A Fast Radio Burst in a Compact Galaxy Group at
Abstract
FRB 20220610A is a high-redshift Fast Radio Burst (FRB) that has not been observed to repeat. Here, we present rest-frame UV and optical Hubble Space Telescope observations of the field of FRB 20220610A. The imaging reveals seven extended sources, one of which we identify as the most likely host galaxy with a spectroscopic redshift of . We spectroscopically confirm at least three additional sources to be at the same redshift, and identify the system as a compact galaxy group with possible signs of interaction among group members. We determine the host of FRB 20220610A to be a star-forming galaxy with stellar mass of , mass-weighted age of Gyr, and star formation rate (integrated over the last 100 Myr) of M⊙ yr-1. These host properties are commensurate with the star-forming field galaxy population at and trace their properties analogously to the population of low- FRB hosts. Based on estimates of the total stellar mass of the galaxy group, we calculate a fiducial contribution to the observed Dispersion Measure (DM) from the intragroup medium of (rest-frame). This leaves a significant excess of (in the observer frame), with additional sources of DM possibly originating from the circumburst environment, host galaxy interstellar medium, and/or foreground structures along the line of sight. Given the low occurrence rates of galaxies in compact groups, the discovery of an FRB in such a group demonstrates a rare and novel environment in which FRBs can occur.
1 Introduction
Fast radio bursts (FRBs) are bright ( mJy– Jy; Ravi 2019; Hashimoto et al. 2022; Zhang 2023), millisecond-duration radio bursts discovered at MHz–GHz frequencies. Despite hundreds of FRBs detected to date (e.g., CHIME/FRB Collaboration et al. 2021; Petroff et al. 2022), many open questions remain, such as the physical distinction between FRBs that have been observed to repeat (“repeaters”; Spitler et al. 2016; CHIME/FRB Collaboration et al. 2019) and those that have not (apparent “non-repeaters”; CHIME/FRB Collaboration et al. 2021; Shannon et al. 2018). Additionally, the progenitor systems and emission mechanisms for FRBs remain poorly understood, though their bright, coherent radio emission generally limits progenitor theories to radiation from compact objects (see Platts et al. 2019 for a comprehensive review). Alongside studies of FRB properties, a promising avenue to decipher their progenitors is through detailed studies of their host galaxy environments to understand their stellar origins (analogous to host studies of transients observed at other wavelengths such as supernovae and gamma-ray bursts, e.g., Bloom et al., 2002; Sullivan et al., 2006; Suzuki et al., 2012; Schulze et al., 2021; Nugent et al., 2022). However, the majority of FRBs have thus far been localized to tens of arcminutes (mainly by the Canadian Hydrogen Intensity Mapping Experiment; CHIME/FRB Collaboration et al. 2021), making routine identification of their host galaxies challenging.
Improvements in FRB experiments have enabled (sub-)arcsecond precision localizations (Chatterjee et al., 2017; Law et al., 2018; Bannister et al., 2019; Marcote et al., 2020; Law et al., 2023; Ravi et al., 2023). This degree of precision allows for robust associations to host galaxies (Eftekhari & Berger, 2017), allowing for identification of their host stellar population properties as observed in the rest-frame ultraviolet, optical, and infrared (e.g., Tendulkar et al. 2017; Bannister et al. 2019; Prochaska et al. 2019; Ravi et al. 2019; Heintz et al. 2020; Marcote et al. 2020; Fong et al. 2021; Bhandari et al. 2022a; Ravi et al. 2022; Bhandari et al. 2022b; Ravi et al. 2022; Niu et al. 2022; Ibik et al. 2023; Sharma et al. 2023; Law et al. 2023; Bhardwaj et al. 2023; Eftekhari et al. 2023), morphologies (Chittidi et al., 2021; Mannings et al., 2021; Tendulkar et al., 2021; Xu et al., 2022; Dong et al., 2023), and galactocentric offsets (Heintz et al., 2020; Mannings et al., 2021; Bhandari et al., 2022a). The wealth of information uniquely enabled by host associations can provide strong constraints on FRB progenitor models via precise redshifts (therefore, rest-frame burst properties such as energetics) and properties of the local and global environments. Indeed, the first such host population studies found that FRBs occur in galaxies spanning a wide range of stellar population properties (e.g., stellar mass, stellar population ages, star formation rates, and metallicities). The majority are actively star-forming, with properties consistent with the field galaxy population at comparable redshifts (Heintz et al., 2020; Bhandari et al., 2022a; Gordon et al., 2023; Law et al., 2023). Notably, two FRBs have been localized to galaxy clusters (Connor et al., 2023; Sharma et al., 2023), large collections of galaxies which generally have a higher fraction of redder and quiescent galaxies than the field (Balogh et al., 1998, 2004), and another has been associated with a group of WISESCOS galaxies (Rafiei-Ravandi et al., 2023). All three of these FRBs in dense large-scale environments have been constrained to . While these hosts compose a small fraction of the total population, they highlight the diversity of FRB host environments and set a precedent for the association of FRBs to large-scale galactic structures.
Of the few dozen FRBs with redshifts determined from their host galaxies, the large majority reside at relatively low redshifts of (Ravi et al., 2019; Bhandari et al., 2022a; Gordon et al., 2023; Ibik et al., 2023; Lee-Waddell et al., 2023; Law et al., 2023; Panther et al., 2023; Ravi et al., 2023), primarily due to the sensitivity of current FRB discovery experiments (e.g., CHIME/FRB Collaboration et al., 2018; Ravi et al., 2023). Thus, the population of FRB environments closer to the peak of cosmic star formation (; Madau & Dickinson 2014) is virtually uncharted. FRBs at are expected to be influential for several reasons. First, if FRB progenitors are dominated by a population with a prompt timescale relative to star formation (as some studies suggest, James et al. 2022a; Gordon et al. 2023, though c.f., Zhang & Zhang 2022; Law et al. 2023), the overall FRB rate should increase toward . Pertinently, as the fraction of star-forming galaxies increases with redshift (Whitaker et al., 2012), the localization of FRBs to quiescent galaxies, even at these redshifts, would indicate a significant contribution from a delayed (relative to star formation) progenitor or formation channel. Second, FRB sightlines at intersect longer stretches of the cosmic web, impacting the observed Dispersion Measure (DM), the integrated column density of electrons along the line of sight. Assuming FRBs reside in similar environments at as they do at , the contribution of the host galaxy to the observed overall DM is expected to be smaller on average (as ), thus serving as cleaner probes of the baryonic content in the Universe. As new facilities and sensitivity improvements to existing experiments continue to come online (e.g., Ravi et al., 2023; Sanghavi et al., 2023), the prospects for detecting and localizing FRBs to higher redshift will continue to improve.
The first such event, FRB 20220610A, was discovered in June 2022 with the Australian Square Kilometre Array Pathfinder (ASKAP; Hotan et al. 2021) by the Commensal Real-Time ASKAP Fast-Transients collaboration (CRAFT; Macquart et al. 2010a; Ryder et al. 2023). To date, FRB 20220610A is not known to repeat. Follow-up imaging on the 8.2 m Very Large Telescope (VLT) revealed a “complex host galaxy system” with three blended clumps. Spectroscopy of these clumps indicated a redshift of , establishing FRB 20220610A as the highest confirmed redshift FRB to date. The redshift also enabled a measurement of the FRB burst energy; at 21042 erg, it was greater than any other known FRB. The observed DM of FRB 20220610A was commensurately large, at 1458 (Ryder et al., 2023). However, in some cases, the inferred redshift from the Macquart relation is higher than the observed redshift, resulting in an “excess” of DM (Niu et al., 2022; Simha et al., 2023; Connor et al., 2023). Despite its high redshift, FRB 20220610A had a DM excess of , which Ryder et al. (2023) attributed to the host galaxy. Ryder et al. (2023) posited the three clumps identified in the imaging may either represent a single galaxy or a system comprised of several interacting galaxies. Due to the limited spatial resolution and sensitivity of the ground-based imaging, they were unable to distinguish between these scenarios.
In this paper, we present Hubble Space Telescope (HST) observations of the host galaxy system of FRB 20220610A and its immediate environment, identifying the host galaxy for the first time (Section 2). In Section 3, we detail the stellar population properties, morphology, and light distributions of the HST imaging of the host; we additionally characterize the morphologies of the surrounding galaxies. We discuss the implications of these results in Section 4, including commenting on the nature of the DM excess, and summarize and conclude our analysis in Section 5. For all relevant calculations in this work, we assume WMAP9 cosmology (Hinshaw et al., 2013).
2 Observations and Data Reduction
2.1 HST Observations
The host galaxy of FRB 20220610A was observed with the HST Wide Field Camera 3 (WFC3) using the ultraviolet-visual (UVIS) and infrared (IR) channels under Program GO-17277 (PI: Gordon). We obtained two orbits in each of the F606W and F160W filters to probe the rest-frame ultraviolet and rest-frame optical light, respectively. These observations total 5055 s in the F606W filter and 4824 s in the F160W filter. We detail the observations in Table 1.
To avoid cosmic ray contamination and obtain high-quality pixel sampling to subsample the point spread function (PSF), we used a custom 6- and 8-point dither pattern for the F606W and F160W images, as described in WFC3/ISR 2020-07 (Anderson, 2020) and WFC3/ISR 2019-05 (Mack & Bajaj, 2019), respectively. We increased the size of the WFC3/UVIS pattern relative to the default pattern to dither over the fixed pattern noise in the dark frames (see Rafelski et al. 2015). By obtaining three exposures per orbit in F606W, we ensured the background was high enough (above 20e- per pixel) to avoid using post-flash despite the degraded charge transfer efficiency (CTE). We additionally placed the target on chip 2 close to the readout region to minimize the effects of CTE. For the F160W observations, we used SPAR50 with an NSAMP of 13 to minimize persistence while maximizing sensitivity. We also tied the orientations of the observations together to ensure sufficient common background sources for alignment.
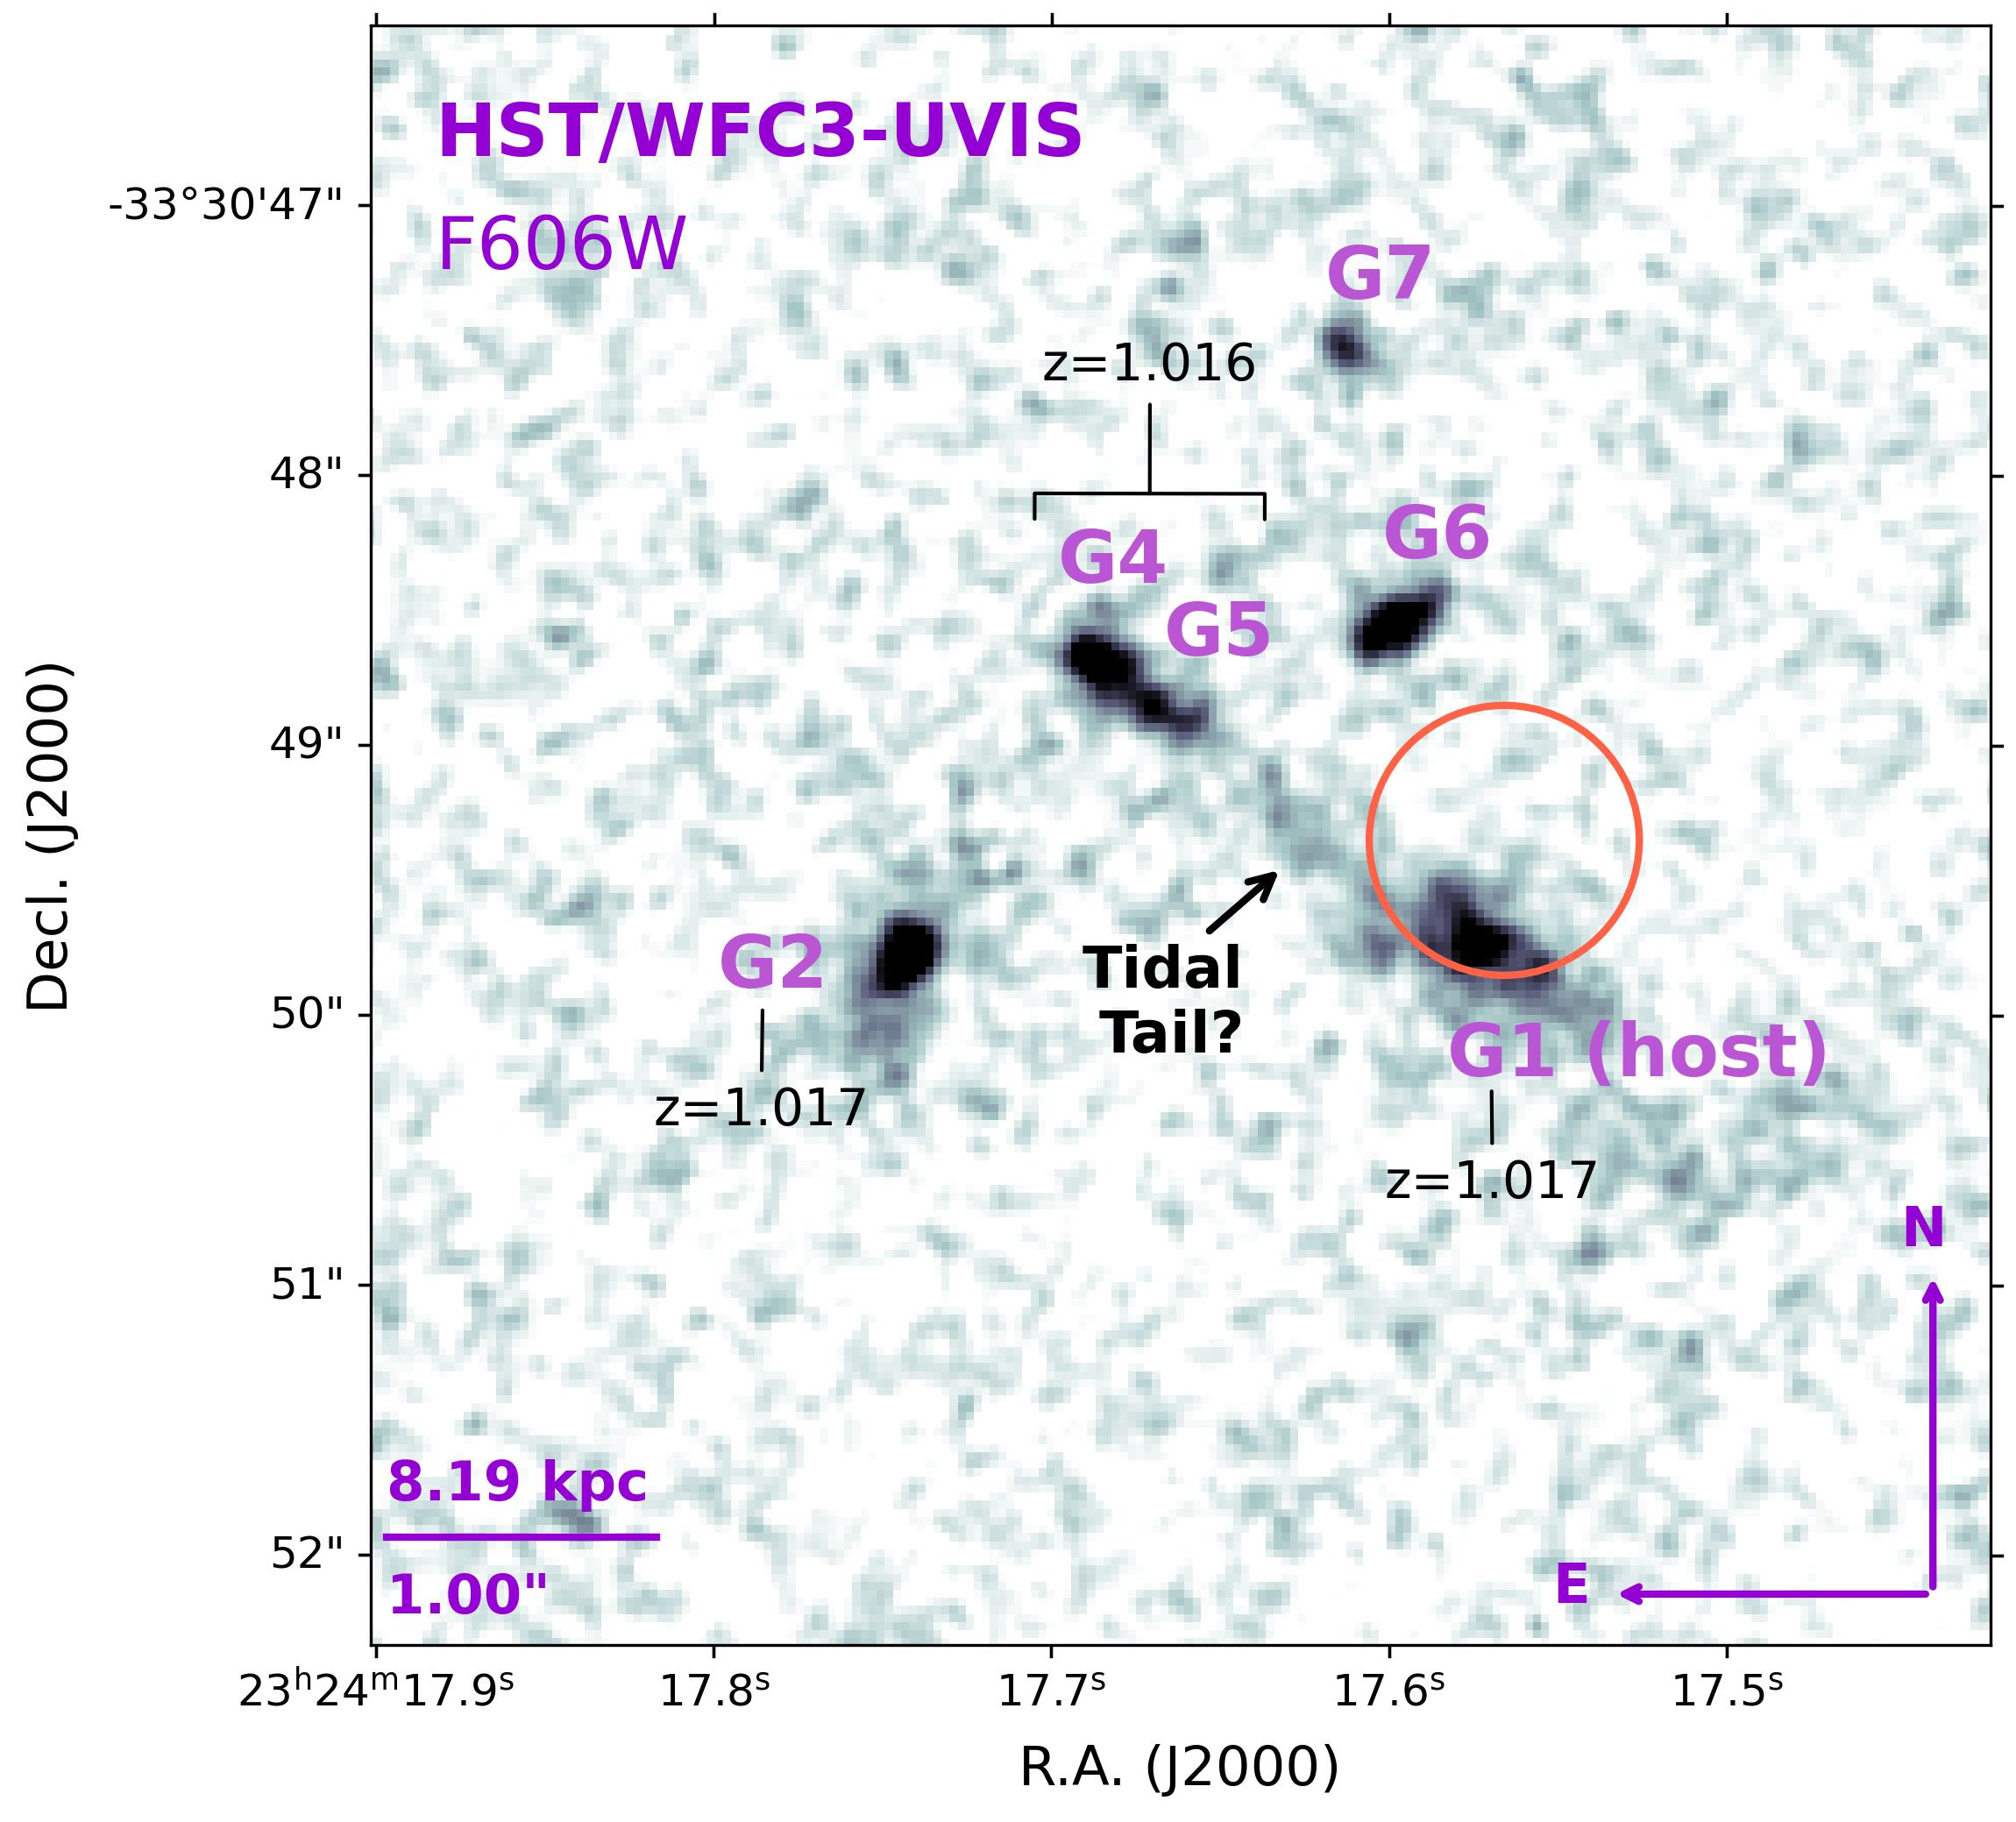
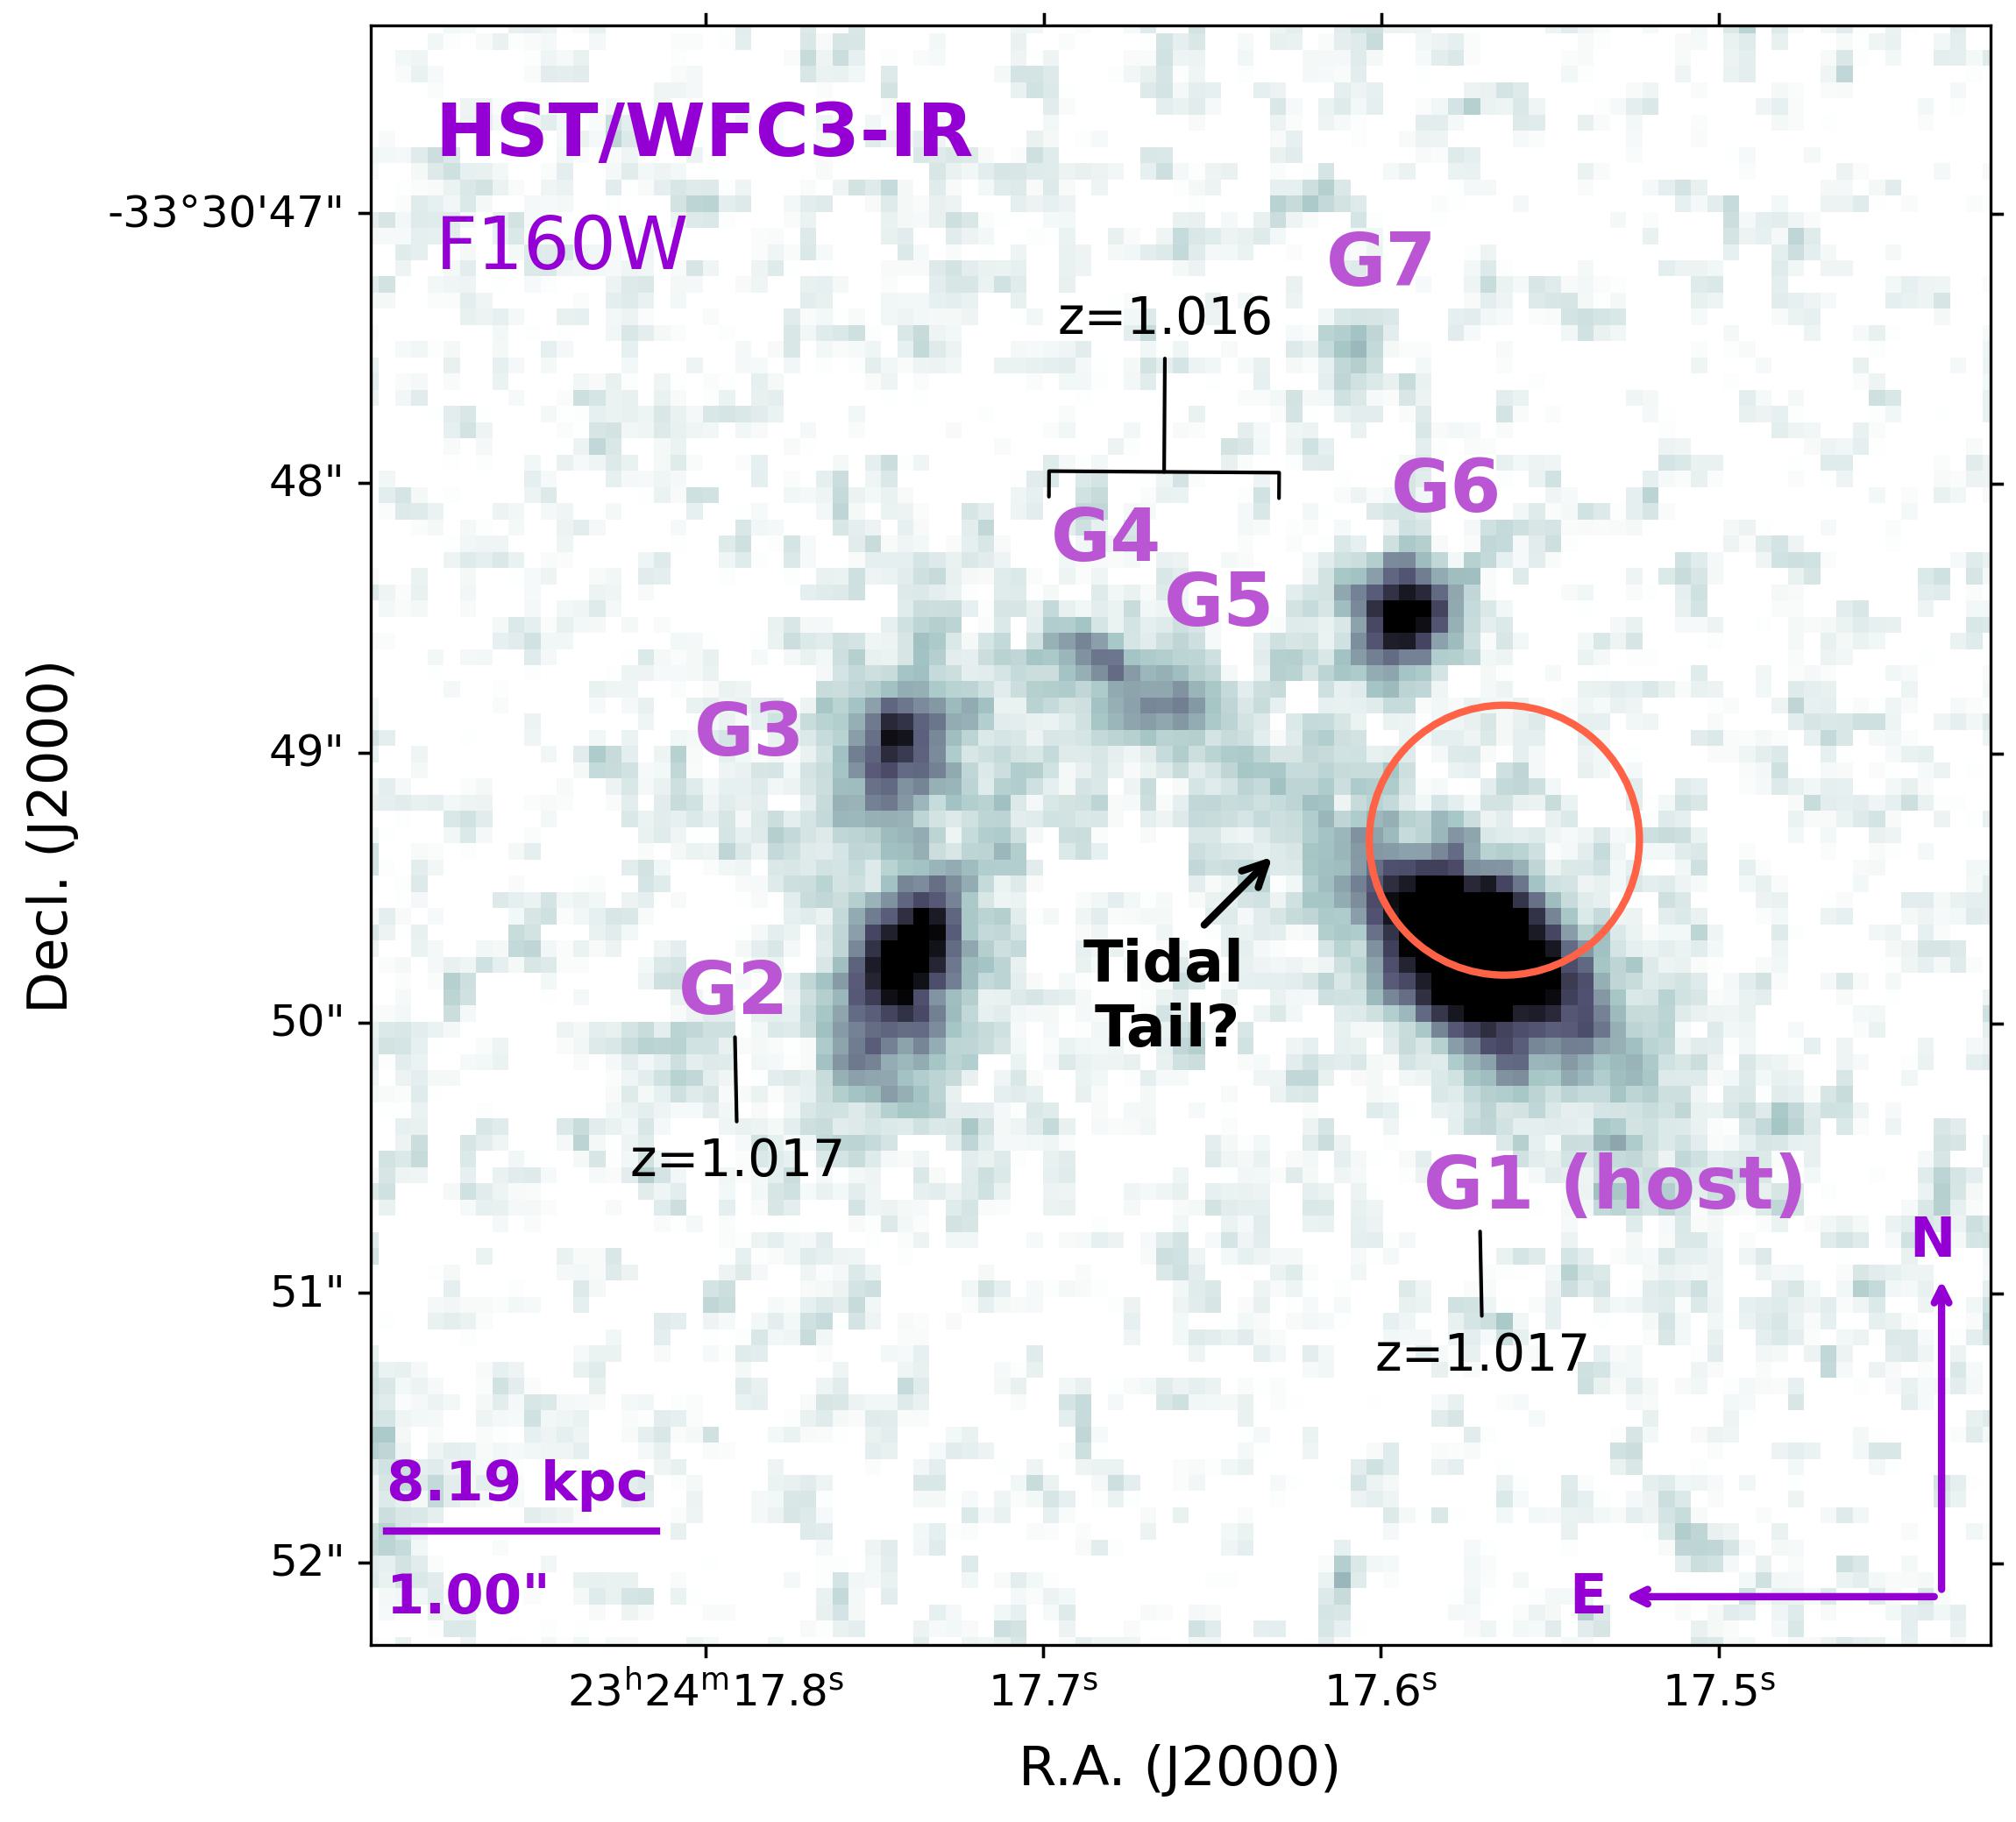
We retrieved the data from the Barbara A. Mikulski Archive for Space Telescopes (MAST)111https://mast.stsci.edu/. We apply cosmic-ray corrections and combine the raw images using AstroDrizzle (v.3.5.1) in drizzlepac (v.3.5.1) (Avila et al., 2015). We perform relative astrometry to the VLT -band image (Ryder et al., 2023), which itself is tied to Gaia DR3 (Gaia Collaboration et al., 2016, 2018), using TweakReg (v3.5.1) and Source Extractor (Bertin & Arnouts, 1996). For F606W, we used 15 common sources to perform this alignment, resulting in an astrometric uncertainty of . For F160W, we used 22 sources in common, giving an astrometric uncertainty of . Finally, we re-sampled the images to improve resolution using a pixfrac of 0.8 and a pixscale of 0.03 () and 0.06 () for the F606W and F160W images, respectively. The host galaxy, as well as several other surrounding sources, are clearly detected in both filters. We further describe these in Section 3.1. We present the F606W and F160W imaging in Figure 1.
2.2 Literature Data
We complement our HST data with those obtained in Ryder et al. (2023). Specifically, we use the - and -band imaging taken with the FOcal Reducer and low dispersion Spectrograph 2 mounted on the VLT (FORS2; PI: Shannon, Program 108.21ZF.001; Appenzeller et al. 1998); - and -band imaging with the High Acuity Wide-field K-band Imager on VLT (HAWK-I; PI Shannon, Programs 108.21ZF.006, 108.21ZF.005; Pirard et al. 2004); and -, -, and -band imaging with the Deep Imaging Multi-Object Spectrograph on the 10m Keck II Telescope (DEIMOS; PI: Weisz, Program U028; Faber et al. 2003). The details of the data reduction are in Ryder et al. (2023), and further details of these observations are listed in Table 1. Additionally, we use the two VLT/X-Shooter spectra obtained by Ryder et al. (2023) (PI Macquart, Program 105.204W.004; Vernet et al. 2011), further detailed in Section 3.1 and Appendix A.
| Date | Facility/Instrument | Filter | Galaxy | Magnitude | Aλ | Exp. Time | Program ID |
|---|---|---|---|---|---|---|---|
| (AB mag) | (mag) | (s) | |||||
| 2022 Oct 2-4 UTC | VLT/FORS2 | 1 | 24.660.36 | 0.060 | 6000 | 108.21ZF.001 | |
| 6 | 25.9 | ||||||
| 2022 Sept 24 UTC | Keck/DEIMOS | 1 | 24.610.24 | 0.054 | 1050 | U028 | |
| 6 | 24.3 | ||||||
| 2023 June 10 UTC | HST/WFC3-UVIS | F606W | 1 | 24.890.04 | 0.044 | 5055 | GO 17277 |
| 2 | 25.340.04 | ||||||
| 3 | 27.830.28 | ||||||
| 4 | 25.650.29 | ||||||
| 5 | 26.650.29 | ||||||
| 6 | 25.980.06 | ||||||
| 7 | 27.400.17 | ||||||
| 2022 July 1 UTC | VLT/FORS2 | 1 | 24.760.25 | 0.038 | 2000 | 108.21ZF.001 | |
| 6 | 24.320.39 | ||||||
| 2022 Sept 24 UTC | Keck/DEIMOS | 1, 6 | 24.0 | 0.025 | 1050 | U028 | |
| 2022 Sept 24 UTC | Keck/DEIMOS | 1, 6 | 24.5 | 0.021 | 1050 | U028 | |
| 2022 Sept 29 UTC | VLT/HAWK-I | 1 | 23.020.12 | 0.012 | 150 | 108.21ZF.006 | |
| 6 | 24.320.22 | ||||||
| 2023 April 26 UTC | HST/WFC3-IR | F160W | 1 | 23.110.01 | 0.008 | 4824 | GO 17277 |
| 6 | 24.750.13 | ||||||
| 2022 July 24 UTC | VLT/HAWK-I | 1 | 22.850.18 | 0.004 | 150 | 108.21ZF.005 | |
| 6 | 24.0 |
Note. — The details of observations used in this work including observation date, telescope and instrument, filter, exposure time, and program ID. The apparent magnitudes are corrected for Galactic extinction, Aλ, following the Fitzpatrick & Massa (2007) extinction law.
3 Results
3.1 Host Association and Identification of Multiple Galaxies at
Ryder et al. (2023) identified a “complex host galaxy system” in their ground-based imaging of FRB 20220610A. They identified it as either one galaxy with three distinct clumps or 2–3 separate galaxies potentially interacting or even merging (their Figure 2). With the spatial resolution and sensitivity afforded by HST, we find that the complex identified in their imaging is in fact composed of at least five extended sources, with two additional sources detected in the vicinity that were not previously visible. We label these sources numerically as 1-7, where G1 is the source coincident with the FRB ( confidence) and is clearly detected in both HST filters. G2-G7 follow clockwise from G1 (Figure 1). We note that all sources are clearly extended with respect to the instrumental PSF, indicating that they are galaxies, except for G7, which is impossible to distinguish from a point-like source. We note that G3 is not detected in the F606W imaging, signifying that it is comparatively redder. We further note the presence of faint extended emission between G1 and G5 in both filters, possibly indicating a stream or sign of tidal interaction.
We refine the analysis of Ryder et al. (2023) to assess the true host galaxy of FRB 20220610A based on this HST imaging. They determined a 99.99% probability of association with “component (a)” (roughly, G1 here). We use the Bayesian framework PATH (Probabilistic Association of Transients to their Hosts; Aggarwal et al. 2021) to determine the likelihood of association between the FRB and each of the seven galaxies identified in the F606W imaging. PATH uses the FRB localization, the galaxy’s sky position, half-light radius, apparent magnitude, and the FRB’s galactocentric offset and probability that the host is undetected in the image, , which we assume to be 0 given the depth of the HST imaging. PATH then provides the posterior of the probability of association to the input list of galaxies, , for which higher values correspond to a higher certainty of association.
We use the F606W image for this analysis as it is most proximate in wavelength to observed -band, on which PATH priors are calibrated. G1, the closest galaxy to the FRB, has . G6 is the next closest in proximity and has . All remaining galaxies have . In testing larger values of (from 0.1 to 0.9), we find a negligible effect on the posteriors; thus, our assumption of is well-justified. We thus conclude that G1 is the most likely host of FRB 20220610A and present the for each of the seven galaxies in Table 2. We note in the less probable case (by a factor of ) that G6 is the true host, the photometric redshift of G6 is consistent within uncertainties with the spectroscopic redshift of G1 (see Section 3.4). Moreover, follow-up spectroscopy of G6 indicates a redshift consistent with (see below). With Source Extractor, we derive a position for G1 of R.A.=23h24m17.573s, decl.= (J2000) in the F160W filter.
Finally, to determine the spectroscopic redshifts of the galaxies in the system, we revisit the spectra taken by Ryder et al. (2023) with VLT/X-Shooter. These data were taken at two position angles of 45∘ and 90∘ East of North and totaled 7200 and 7548 s of exposure, respectively. When overlaid on the F160W image, the two slit orientations cover the locations of G1, G2, G4, and G5 (Figure A.1). Using the HST-determined positions, we identify the [O II]3726Å, 3729Å doublet at the expected locations of the galaxies. Unfortunately, the expected location of the H emission line falls on a telluric sky line near 1.3 m; while H is apparent in the 2D spectra (giving enough confidence for a redshift; c.f. Ryder et al. 2023), we cannot reliably estimate its flux. However, based on the [O II] doublet, we establish the redshifts of G1 and G2 at . As the contributions of G4 and G5 are blended in the X-Shooter spectrum (they are not even clearly separated in our HST imaging), we determine the redshift of the blended galaxies at . Finally, we obtained a third X-Shooter spectrum on 15 November 2023 UTC (PI Shannon, Program 108.21ZF.012) covering the locations of G1, G6, and G7; we find probable [O II] emission from G1 and G6 consistent with . Further details on the spectra and emission line identification for these galaxies are presented in Appendix A.
The lack of detection of G3 in F606W, coupled with the detection in F160W, is intriguing in the context of a high-redshift origin. Indeed, if we interpret the red color to be attributed to the 4000 Å break, this results in a redshift range of . However, with present data we cannot rule out the possibility that the reddening is due to a combination of dust extinction or an older stellar population at a different redshift.
3.2 PSF Modeling and Galfit Analysis
To quantify the sizes and morphologies of the host and surrounding galaxies in the HST images, as well as to determine the presence of any sub-structure, we use the galaxy profile modeling software Galfit (v3.0.5) (Peng et al., 2002, 2010). We derive the empirical PSF of the HST images (a required input for Galfit) with the hst_wfc3_psf_modeling software package (Revalski, 2022; Revalski et al., 2023), employing the stellar option to allow a user-input star catalog. After manually inspecting the images to select stars with clear Airy disk structure for the PSF model, we use Source Extractor to derive the star positions and input this catalog to the PSF modeling code. For the F606W image, we use five stars, resulting in a FWHM = 3.033 pixel PSF (); for the F160W image, we use six stars, deriving a PSF FWHM of 3.699 pixels (). We use the median PSF model (as opposed to the mean model) for all further analysis as this minimizes the degree of contribution from neighboring sources in the fields of the individual PSF stars.
Galfit takes initial values on the position, size, magnitude, semi-major/-minor axis ratio, and position angle of a galaxy. It then convolves the data with the model (incorporating the empirical PSF) to return the best-fit values for the input parameters. We model the galaxies with a Sérsic surface brightness profile (Sersic, 1968)
| (1) |
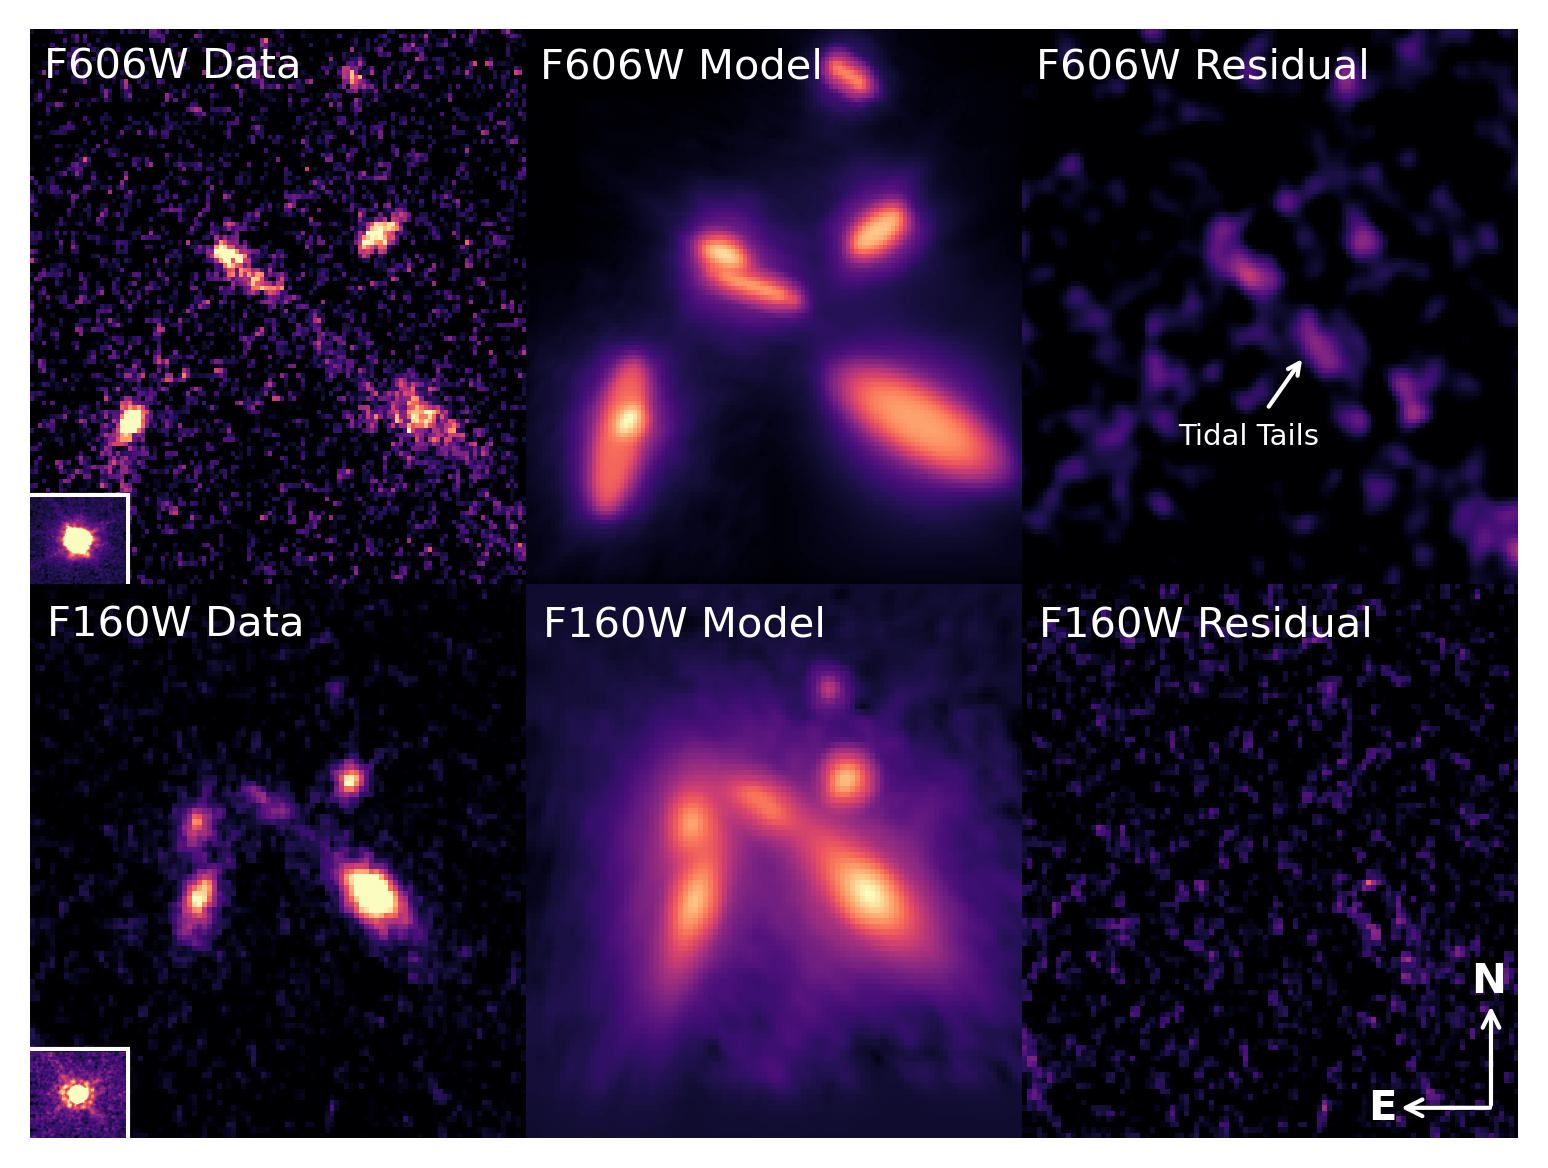
where is the effective radius that encompasses half of the galaxy’s light, is the surface brightness at , is the Sérsic index which describes the shape of the light profile (e.g., for an exponential disk, for an elliptical de Vaucouleurs profile), and is a variable coupled to that ensures encompasses half of the galaxy’s flux. While we fit G1 with a single Sérsic component in F606W, we use two Sérsic profiles in F160W (nominally representing bulge and disk components) as this produces cleaner residuals. We initialize the bulge and disk profiles with different effective radii and Sérsic indices to reflect the expected size and light profiles of the two components. We then fit the remaining galaxies in each filter with single Sérsic profiles, with the exception of G2 in the F606W image which is similarly modeled as two components to improve the residual.
We present the results from the Galfit analysis, including the values for and , in Table 2. The original science images, Galfit models, and residuals are shown in Figure 2. While the science images in both filters show extended emission between G1 and G5 along the northeast-southwest direction, referred to here as tidal tails, this structure is only apparent in the F606W residual. We comment on the implications of these features in Section 4.2.
| Source | R.A. | Decl. | Filter | Sérsic Index | PATH | log(M∗/M⊙) | ||||
|---|---|---|---|---|---|---|---|---|---|---|
| (J2000) | (J2000) | ″ | (Gyr) | (M⊙ yr-1) | ||||||
| 1 | 23:24:17.573 | 33:30:49.725 | F606W | 0.32 | 0.33 | 1.017a | 0.87 | 9.690.11 | ||
| F160W (disk) | 0.55 | 0.41 | ||||||||
| F160W (bulge) | 1.67 | 0.26 | ||||||||
| 2 | 23:24:17.743 | 33:30:49.796 | F606W (disk) | 0.07 | 0.33 | 1.017a | 6.9e-4 | 9.19b | ||
| F606W (bulge) | 0.05 | 0.06 | ||||||||
| F160W | 1.59 | 0.34 | ||||||||
| 3 | 23:24:17.744 | 33:30:48.982 | F160W | 2.25 | 0.25 | 5.3e-5 | 8.40b | |||
| 4 | 23:24:17.683 | 33:30:48.657 | F606W | 0.39 | 0.08 | 1.016a,c | 4.9e-3 | 7.83b | ||
| F160W | 1.23 | 0.20 | ||||||||
| 5 | 23:24:17.665 | 33:30:48.813 | F606W | 0.09 | 0.22 | 1.016a,c | 1.6e-2 | 8.58b | ||
| F160W | 1.59 | 0.27 | ||||||||
| 6 | 23:24:17.596 | 33:30:48.485 | F606W | 0.04 | 0.14 | d | 0.11 | |||
| F160W | 0.44 | 0.08 | ||||||||
| 7 | 23:24:17.609 | 33:30:47.506 | F606W | 0.06 | 0.08 | 1.6e-4 | 6.10b | |||
| F160W | 0.01 | 0.10 |
Note. — The properties of the host of FRB 20220610A and surrounding galaxies in the F606W and F160W images, with coordinates determined from F160W. The Sérsic index and effective radius are derived from Galfit. The redshifts were determined via X-Shooter spectroscopy or photo-z modeling with Prospector. The PATH column denotes the probability posterior for association with the FRB. We list the stellar mass (log(M∗/M⊙)), mass-weighted age (), and recent SFR integrated over the past 100 Myr in lookback time (SFR) from Prospector.
a Spectroscopic redshift
b Derived via van der Wel et al. (2014) mass-radius relation (see Section 4.5.1).
c Galaxies 4 and 5 are blended and unable to resolve separately, so we report the redshift of the blended object
d Photometric redshift derived via SED modeling
3.3 Aperture Photometry
Based on our HST imaging where each galaxy near the localization region of FRB 20220610A is resolved (Figure 1), we note that their apparent sizes are 0.08–0.3″, smaller than the size of the PSF in our ground-based VLT and Keck imaging. Therefore, to estimate accurate fluxes for each separate galaxy using an aperture smaller than the PSF, we need to implement aperture corrections within each ground-based image. This method is ideal for estimating accurate fluxes of unresolved sources because it allows us to: (1) infer an accurate flux of each source to within the measurement uncertainties of our photometry and aperture correction, and (2) deblend emission from galaxies where their separations are close to the PSF size within each image. Below we describe a procedure for estimating aperture corrections using a curve-of-growth method within each ground-based image as well as estimating the flux from each galaxy.
We first astrometrically tie the HST imaging to the VLT -band imaging as described in Section 2.1. We then derive the positions of the galaxies using Source Extractor from the F160W image, where all galaxies are detected and resolved (listed in Table 2). Next, we verify the astrometric alignment of the ground-based images by overlaying the galaxy positions. In the case of the -band image, the positions were slightly misaligned, so we used a star in the field to calculate the offset required to shift the coordinates to the correct location. We then perform photometry on our HST imaging and the imaging from Ryder et al. (2023) (c.f., Section 2) at the HST positions of the galaxies using a custom script that implements the aperture_photometry module of photutils (Bradley et al., 2021)222https://github.com/charliekilpatrick/photometry. We use larger aperture sizes for the space-based images compared to the ground-based images to reduce the degree of blending.
Next, we estimate the curve-of-growth using point sources within each ground-based image and use this to apply an aperture correction to obtain accurate flux measurements. The curve-of-growth represents the fractional encircled flux (i.e., the encircled energy correction) of a typical point source within the image as a function of the aperture radius (i.e., in arcsec) used. Thus for an aperture radius of a given value, we can estimate the total flux from an unresolved source by applying an aperture correction . We use several point sources to estimate the curve-of-growth, normalizing by the total flux for that source out to large radii; this is typically 3 times the FWHM, where we would expect to encompass 99.7% of the light. In this way, we estimate the average value and standard deviation for the curve-of-growth at each value of , which we then transform into the aperture correction and uncertainty in the aperture correction at a given aperture radius. We emphasize that, in addition to the measurement uncertainties on the aperture correction itself, the Poisson uncertainties from the aperture photometry below are also increased by the inverse of the encircled energy correction , and propagated.
Finally, we apply our aperture photometry procedure and curve-of-growth measurement to G1 and G6 for use in modeling their stellar population properties (see Section 3.4). For G1, we use a 1 aperture for the HST imaging and a aperture with curve-of-growth corrections for the ground-based imaging. Similarly for G6, we use a larger aperture for the HST images and a smaller aperture for the ground-based images. We select a source-free region directly to the west of the host system to estimate the background level via an annulus at twice and eight times the size of the aperture to avoid contamination from the surrounding galaxies in the FRB 20220610A system. In cases in which the galaxies are not detected in the imaging, we derive upper limits by performing photometry on faint sources in the field. We then correct the photometric values and limits for Galactic extinction using the Fitzpatrick & Massa (2007) extinction law with derived via the Schlafly & Finkbeiner (2011) dust map. All photometric measurements are presented in Table 1. We find detections at significance for G1 in the , , F606W, , , F160W, and filters; and for G6 in the F606W, , , and F160W filters. All galaxies have detections in the HST images except G3 in F606W where it is not detected. We derive upper limits in each of the remaining photometric bands.
3.4 Stellar Population Modeling
To derive the stellar population properties of G1 and G6, we use the Bayesian inference code Prospector (Johnson et al., 2021). We initialize the model using the same prior assumptions as in Gordon et al. (2023) to fit the nine available bands of photometry (seven detections, two upper limits) of G1 as presented in Table 1. We fit all available photometry; the lack of continuum in the VLT spectra (see Appendix Figure A.1 and Ryder et al. 2023) prohibits inclusion in the fits. The best-fit model for G1 has a stellar mass of log(M∗/M⊙) 9.690.11, a mass-weighted age of Gyr, and a star formation rate integrated over the past 100 Myr of M⊙ yr-1 (68% uncertainties). We derive a specific star formation rate (star formation rate per unit stellar mass) of log()= yr-1. Per the mass-doubling number criterion from Tacchella et al. (2022), this galaxy is classified as star-forming (based on the specific star formation rate and the redshift; applied in previous work on FRB hosts; e.g., Gordon et al. 2023; Sharma et al. 2023; Ibik et al. 2023). We report the median and 68% confidence intervals of the stellar population properties in Table 2.
Of the seven sources identified in the HST imaging, the VLT spectroscopy from Ryder et al. (2023) covers all except G3, G6, and G7. While G3 is possibly at to explain its red color (see Section 4.2), the lack of additional detections beyond a single band precludes further inference. While G7 is detected in both filters, there is not enough data to reliably model this source. However, for G6, the combination of HST data and detections recovered from ground-based imaging results in four photometric measurements (of the nine bands), enabling a Prospector fit to estimate its redshift (and additionally, derive its stellar population properties). This is particularly relevant as it is the next most likely host of FRB 20220610A (). We initialize the G6 model using the four detections and five upper limits with redshift as a free, uniform prior between and . The best-fit model suggests a galaxy with redshift and log(M∗/M⊙) . We report these stellar population properties and additional properties in Table 2. This is fully consistent with the redshifts of the other sources, albeit with large uncertainties (but see Appendix A for a probable origin).
3.5 The Location of FRB 20220610A within its Host
We first measure the physical offset of FRB 20220610A with respect to the center of G1 as reported in Table 2. We find the angular separation between the FRB location and the host optical center (via the F606W image) is , corresponding to a projected physical offset of 2.975.86 kpc. The uncertainty in this measurement encompasses the uncertainties in the host position, absolute astrometry, and FRB position333We note that the “negative” offset as allowed by the uncertainty can be physically interpreted as the FRB originating to the south-east of the host nucleus.. We also estimate the angular offset in a different way following the procedure in Mannings et al. (2021) which incorporates the size of the localization region via a weighting scheme. First, we calculate a distribution of offsets within a 3 localization region centered at the FRB position, where is the uncertainty on the FRB localization. Next, by weighting each offset with a 2D Gaussian probability distribution, we derive an average angular offset of , in which the uncertainty is represented by the standard deviation of the distribution; this is equivalent to a physical offset of 5.782.97 kpc. The angular offset derived from the Gaussian weighting is likely inflated by the large FRB localization uncertainties which introduce a spread in the distribution. This spread increases the influence of large offsets, thereby shifting the average away from the central value of the distribution. However, this weighted offset more aptly reflects the true value given the size of the FRB 20220610A localization region.
To quantify the location of FRB 20220610A with respect to its host’s light distribution, we next estimate the fractional flux (FF; e.g., Mannings et al. 2021) in the HST images. Fractional flux values range from 0–1, with a value of indicating the FRB is at the brightest position within the galaxy with respect to the light distribution. F606W probes rest-frame UV light at the redshift of FRB 20220610A, and can be interpreted as tracing recent star formation via hot, young stars. F160W probes the rest-frame optical light, which physically maps to older stellar populations, and is thus a proxy for the stellar mass distribution of the galaxy. Using the methodology developed in Mannings et al. (2021), we find the fractional flux at the position of FRB 20220610A to be 0.350.30 in F606W and 0.380.28 in F160W. These values are consistent within the 68% confidence intervals of rest-frame UV and optical fractional flux for the 10 FRB hosts with HST imaging analyzed by Mannings et al. (2021). The large uncertainties, owed mainly to the size of the localization region relative to the host size, preclude a robust indication that the FRB position traces the star formation and stellar mass distributions of its host galaxy. However, it is likely that FRB 20220610A resides in an average or below average light location compared to the total distributions in star formation and stellar mass.
4 Discussion
4.1 The Host of FRB 20220610A as a Member of a Compact Group
We first explore the large-scale environment of FRB 20220610A as identified in our HST imaging. The host galaxy, G1, is proximate to six additional sources within a radius of 16 kpc about the center of the complex, the majority of which are spectroscopically confirmed to be at near-identical redshifts. The proximity of the galaxies to each other and their comparable redshifts suggests membership in a larger system. Thus, to put the large-scale environment of FRB 20220610A in the context of similar galaxies at this redshift, we first attempt to categorize the system.
On the largest and most massive scale we consider galaxy clusters. These systems encompass total masses (defined as the combined stellar and dark matter halo mass) of M⊙ and span a few Mpc on the sky (Bahcall, 1999). At , a galaxy cluster would have an angular size of 2, and thus it is not possible to visually identify an over-density given the FOV of our HST imaging. Therefore we use known galaxy cluster surveys to determine whether the collection of galaxies is part of a previously-identified, larger-scale cluster. Galaxy clusters are typically identified via three methods (Oguri et al., 2018): (1) optical identifications of galaxy overdensities with wide-field surveys; (2) X-ray detections of hot gas between galaxies; and/or (3) radio/millimeter observations of the thermal Sunyaev-Zel’dovich (SZ; Sunyaev & Zeldovich 1972) effect in which electrons between the galaxies scatter cosmic microwave background photons via inverse Compton scattering. Thus, detections of the SZ effect can be used to infer the presence of galaxy clusters through the hot gas in the intracluster medium.
However, public optical surveys are limited in either their redshift reach (; Oguri et al. 2018) or spatial coverage. Indeed, one of the most promising surveys uses the 8.2m Subaru telescope’s Hyper Suprime-Cam, but unfortunately it does not cover the southern location of FRB 20220610A (Oguri et al., 2018). We also examine X-ray sources in the ROSAT All-Sky-Survey (2RXS) within the ROSAT All-Sky-Survey Multi-Component Matched Filter catalog of X-ray selected galaxy clusters (Boller et al., 2016; Klein et al., 2023). This catalog has a purity of 90%, meaning 90% of the sources identified in the catalog are indeed galaxy clusters to high probability. While the catalog extends to and covers the location of FRB 20220610A, there is no identified source in 2RXS within of the FRB 20220610A system. However, as the majority of sources identified in the catalog are at , the completeness of the survey is poor at the redshift of FRB 20220610A.
We conclude our cluster search with available SZ-selected galaxy cluster surveys. Of these, the Planck 2nd Sunyaev-Zeldovich Source Catalog (Planck Collaboration et al., 2016) and a SZ-selected cluster survey based on the Atacama Cosmology Telescope 5th Data Release (ACT DR5; Hilton et al. 2021) have both the sky and redshift coverage to identify a cluster associated with FRB 20220610A. The Planck catalog (which has a purity of 83-87%) does not identify a cluster within 20 of FRB 20220610A, a conservative upper limit on the size of a galaxy cluster at this redshift. This survey has an 80% total mass completeness limit of M at , a common mass estimate in the cluster literature representing the mass within a spherical radius encompassing 500 times the critical density at the cluster’s redshift. Similarly, no cluster is identified in ACT DR5 within 20. This survey has a 90% total mass completeness limit of 3.2 M at (where M500c is another way to denote the critical mass density).
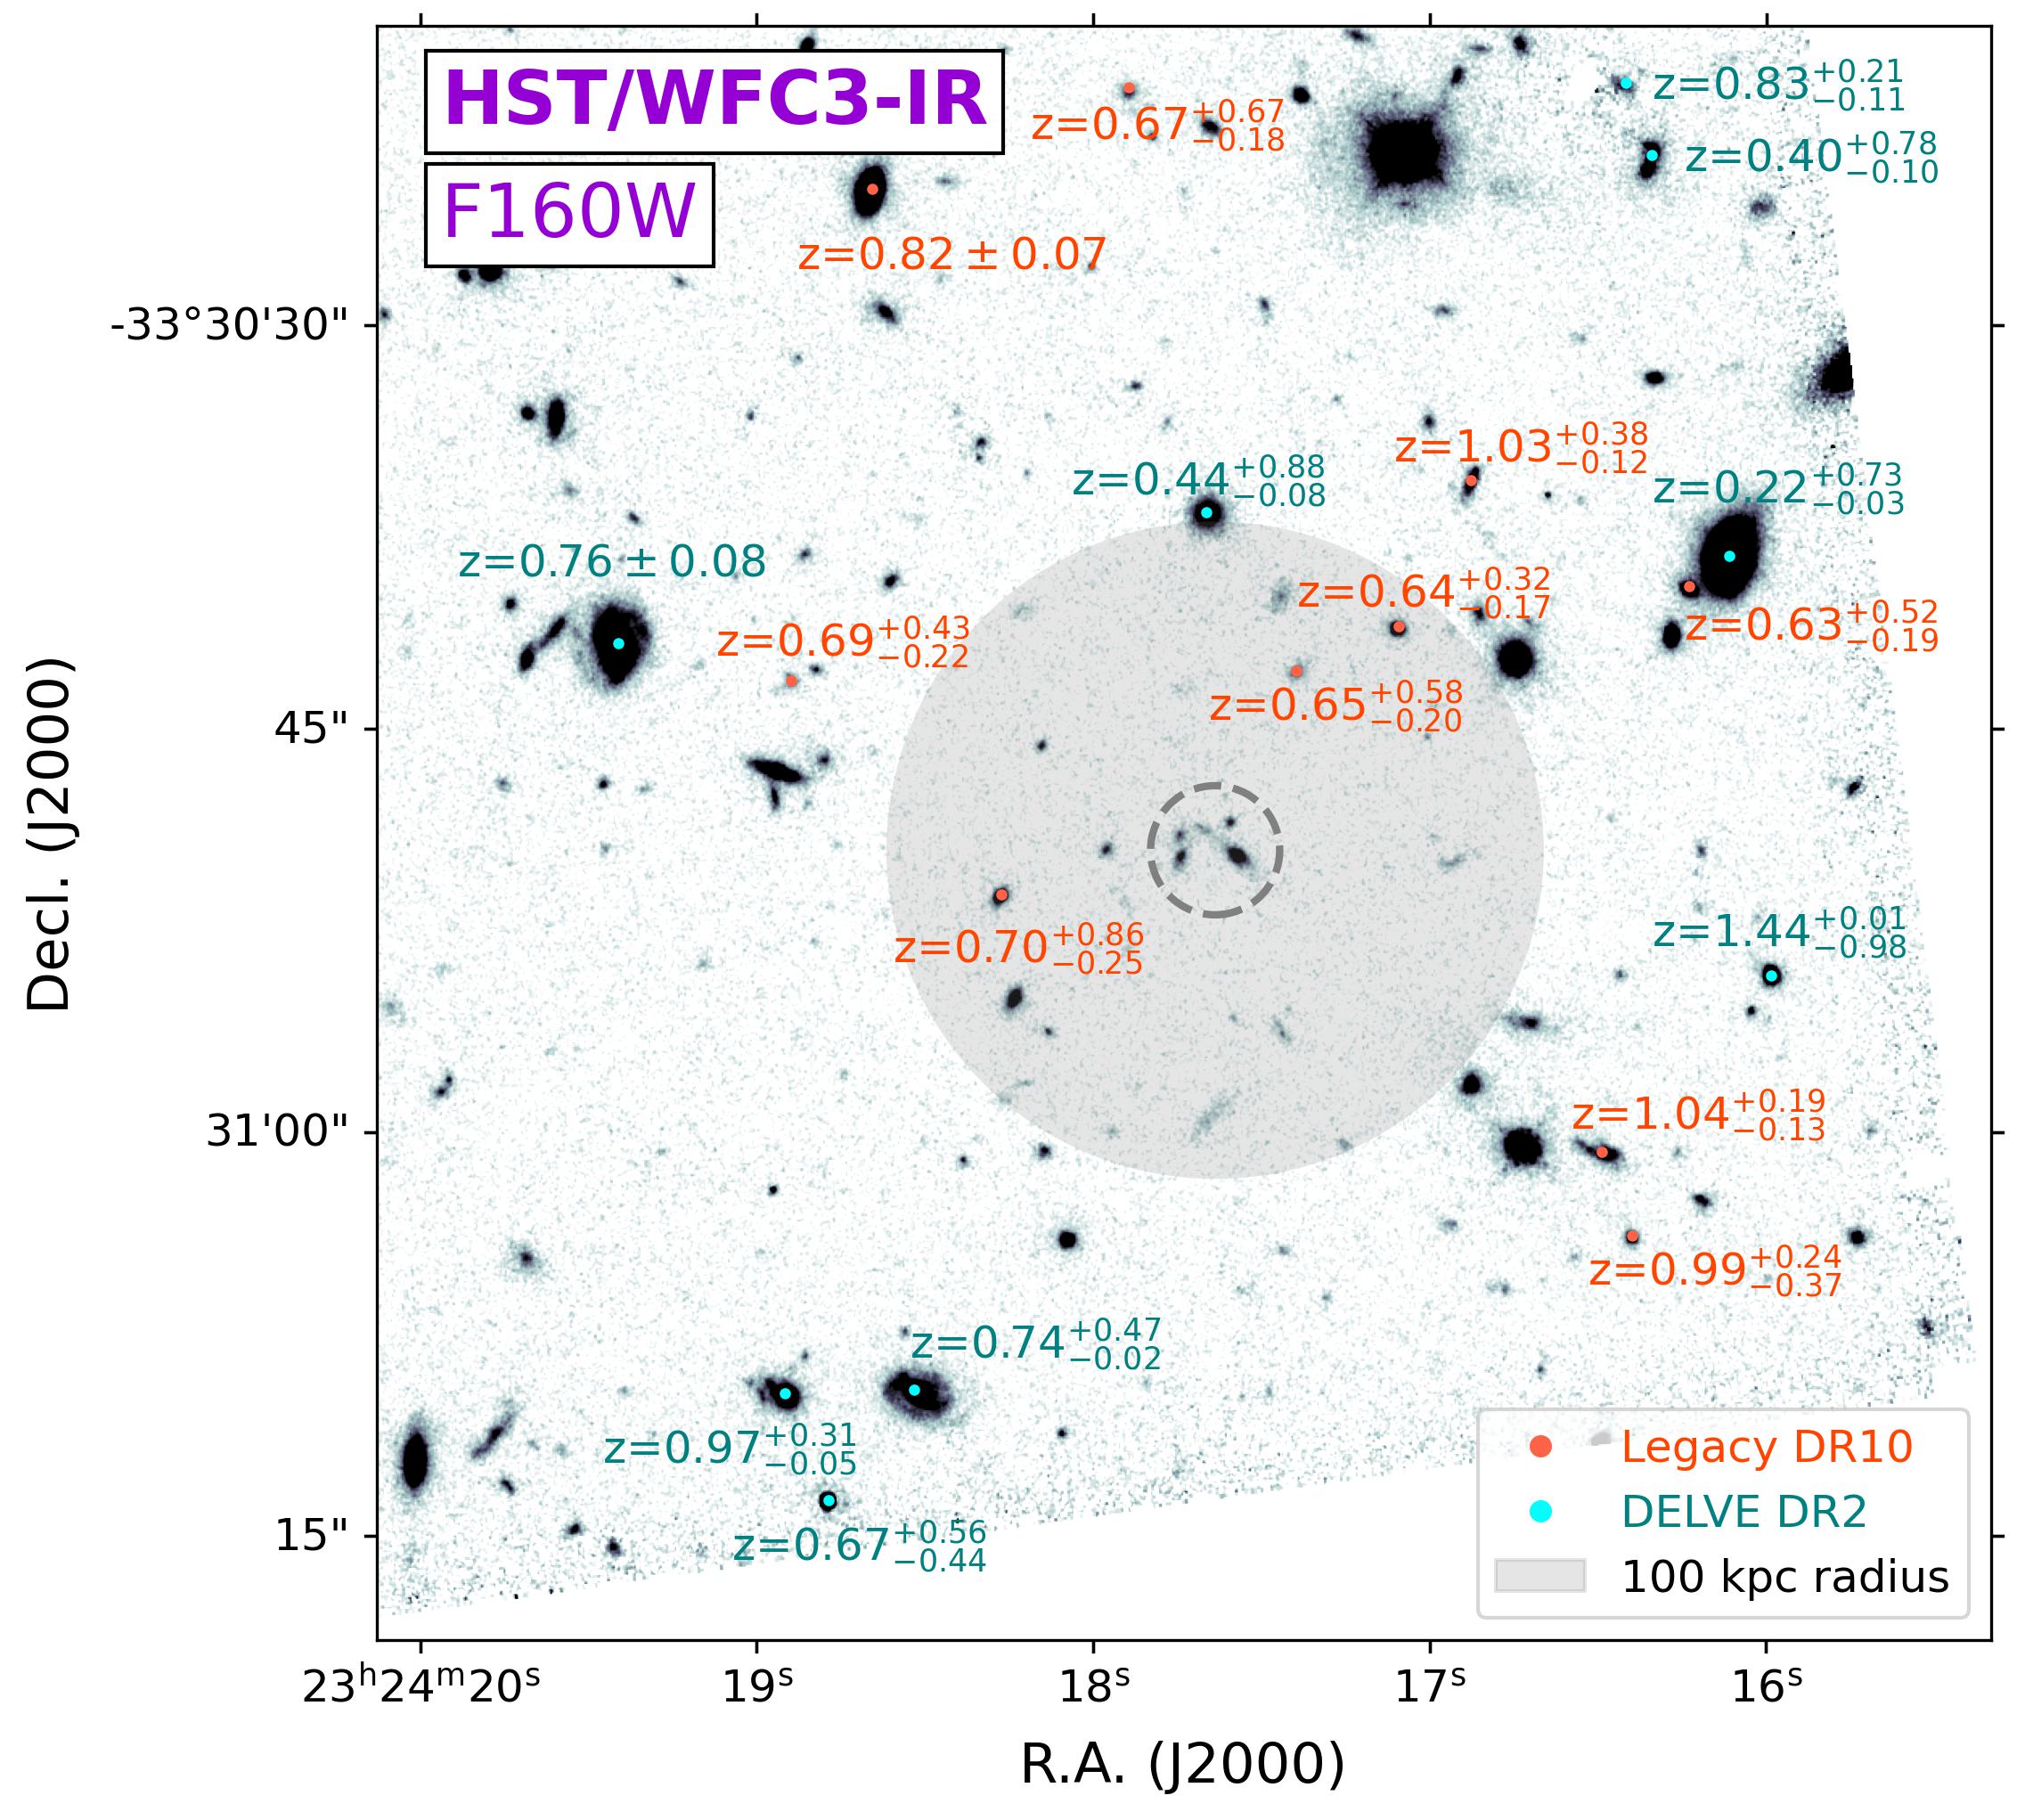
To determine if a galaxy cluster could be identified, we obtained photometric redshifts of objects in the vicinity of FRB 20220610A from the DECam Local Volume Exploration Survey DR2 (DELVE; Drlica-Wagner et al. 2022) and the Legacy Survey DR10 (Dey et al., 2019). We apply a star-galaxy classifier on the Legacy data based on the PSF of the object and its classification in the Gaia survey to select only on high-probability galaxies. In Figure 3, we show the surrounding 60″ of the FRB 20220610A system (corresponding to 164 kpc at ) with photometric redshifts overlaid. While this region is not large enough to observe the full extent of a large cluster at (as we are limited by the field of view of the HST imaging), any apparent over-density in redshifts would be noticeable on this scale. The DELVE redshifts have higher precision and all have median values of . The same is true for the supplemented Legacy catalog redshifts although their redshift uncertainties are much larger. Overall, we find no apparent large over-density of galaxies at , and thus we conclude there is no obvious sign of a galaxy cluster at this location.
At smaller masses than galaxy clusters are galaxy groups. As the FRB 20220610A system is comprised of several galaxies at comparable redshifts within tens of kiloparsecs, its properties are instead consistent with those of compact groups (CG; Hickson 1982, 1997; Sohn et al. 2016). While CGs have mainly been studied at low redshift owing to the difficulty in identifying them (i.e., Hickson 1982; Coenda et al. 2012; Zheng & Shen 2020), galaxy simulations have shown that the fraction of galaxies existing in CGs peaks at (Wiens et al., 2019). However, these systems are still rare compared with typical field galaxies, with only 0.11% of galaxies residing in compact groups at these redshifts (Díaz-Giménez et al., 2020). We further comment on the implications of the host of FRB 20220610A belonging to such an environment in Section 4.3.
4.2 The Host in the Context of Field Galaxies
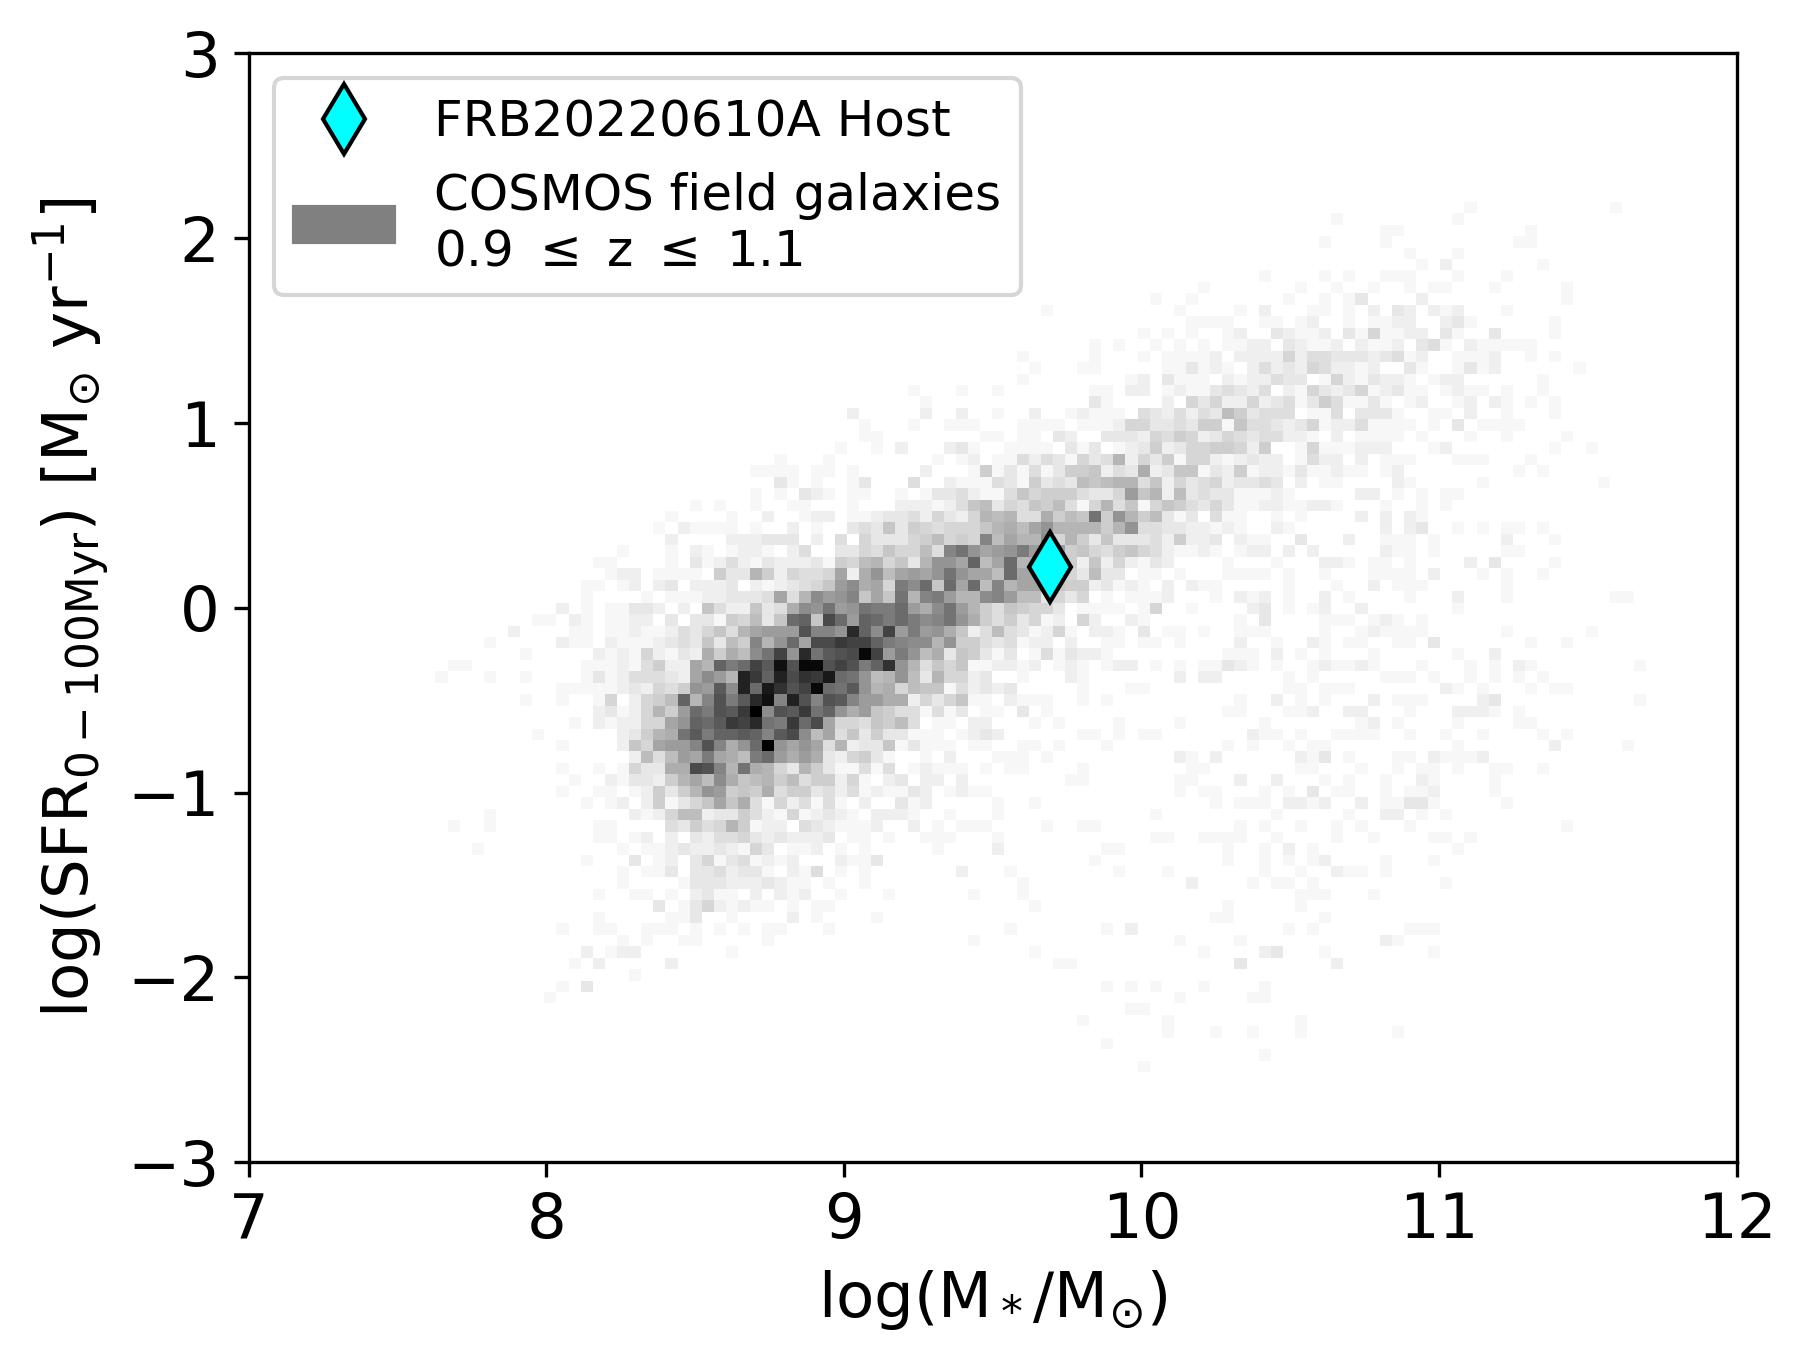
We next contextualize the galactic and large-scale environment of FRB 20220610A. The lack of FRB hosts in the regime of prevents an accurate comparison to that of FRB 20220610A, as galaxy properties evolve with redshift. Instead, we leverage deep galaxy surveys to compare the host of FRB 20220610A to field galaxies at comparable redshifts to assess whether it traces galaxy properties in the same way as the low- FRB host population. We compare to field galaxies at from the COSMOS sample (Laigle et al., 2016) whose stellar population properties were derived with Prospector with similar prior assumptions to our work, thus enabling a direct comparison mainly free of systematic differences due to modeling (Leja et al., 2020). We construct a distribution of COSMOS galaxies with redshifts 0.05 about the host redshift of , resulting in a sample of 3976 field galaxies. We find the stellar population properties of this sample have medians and 68% confidence intervals of log(M∗/M, , and SFR. Within the uncertainties, the stellar population properties of the host of FRB 20220610A is consistent with the field galaxy population.
In Figure 4, we consider the host’s placement relative to these COSMOS field galaxies at similar redshifts on the star-forming main sequence (SFMS) in the stellar mass–SFR parameter space. Previous studies (Gordon et al., 2023; Law et al., 2023; Ibik et al., 2023) have performed similar analyses by comparing the location of FRB host galaxies relative to the SFMS against a background sample of field galaxies from the COSMOS sample. These works found that most FRB hosts at trace the SFMS. Similar to the low- FRB hosts, we find that the host of FRB 20220610A falls on the SFMS (Figure 4), implying that it is forming stars at a similar rate to galaxies of comparable stellar mass at its redshift. We note, however, that it is slightly more massive than the majority of star-forming galaxies in this redshift range. In the absence of a conclusive star formation history (SFH) derived for the host (as the signal-to-noise of the data results in large uncertainties in the star formation rate in each age bin), we indirectly compare the SFH to the sample of field galaxies using the log()– parameter space (c.f., Gordon et al. 2023). These parameters are moments of the SFH and serve as a proxy to a direct SFH comparison. We find the host of FRB 20220610A traces the COSMOS field galaxies in this parameter space as well.
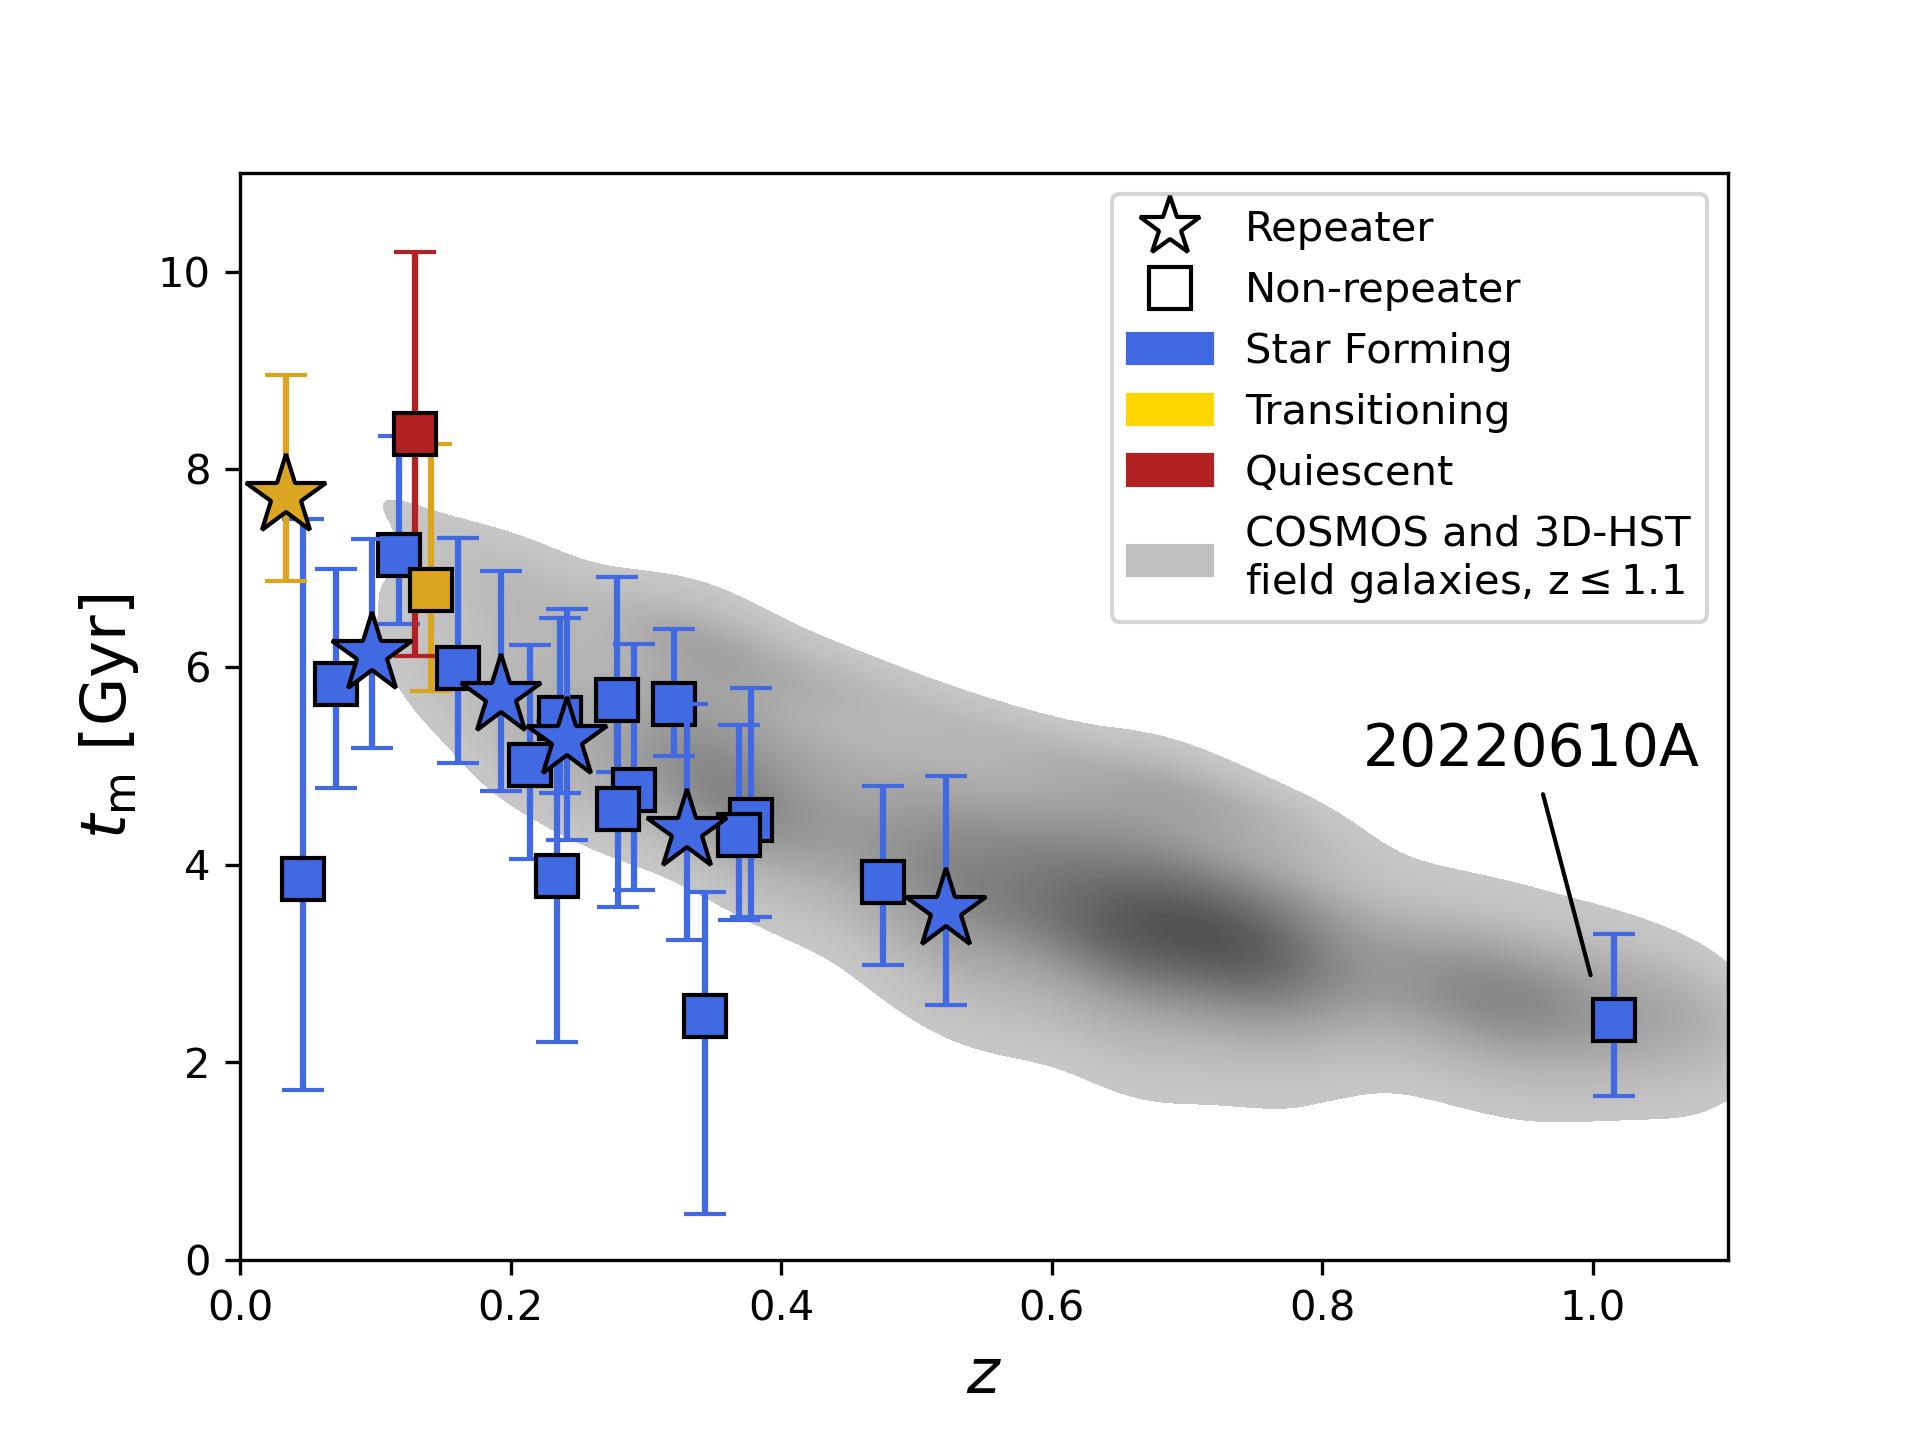
Finally, we compare the mass-weighted age () versus redshift of the host of FRB 20220610A with other FRB hosts from the literature against COSMOS field galaxies in Figure 5 (data from Gordon et al. 2023; Ibik et al. 2023). As redshift increases, the evolution from large to small absolute ages is a reflection of the galaxy population becoming younger at higher redshifts; in other words, if the mass-weighted age was normalized by the Hubble time at each redshift, this relation would be flat. Overall, we find that FRB hosts at all redshifts follow this field galaxy trend.
4.3 The Host in the Context of Compact Group Galaxies and Progenitor Implications
The discovery of FRB 20220610A in a compact galaxy group marks a novel environment for FRBs. As highly dense structures, CGs are ideal sites for ongoing mergers and rapid galaxy interactions (Mamon, 1992). The frequency of CGs at is predicted to be more abundant than at (Hartsuiker & Ploeckinger, 2020). However, CG galaxies comprise of all galaxies out to at least (Wiens et al., 2019; Díaz-Giménez et al., 2020), making this a fairly rare and noteworthy host environment. The large majority of observational CG studies are at low redshifts of . These studies find that CG galaxies generally exhibit redder colors, older stellar population ages, and are more morphologically compact compared to systems in less dense environments such as field galaxies (Deng et al., 2008; Coenda et al., 2012; Sohn et al., 2015; Montaguth et al., 2023), seemingly at odds with a young stellar progenitor. However, at higher redshifts (toward ), galaxies are more gas-rich and tidal interactions between galaxies can trigger bursts of star formation (Pearson et al., 2019). Indeed, we find a “bridge” of diffuse material between the host of FRB 20220610A and other galaxies within the group (e.g., G4 and G5) in both the F606W and F160W filters (Fig. 1, although only present in the F606W residual, denoted in Fig. 2), possibly indicative of a past or ongoing merger. This is commensurate with the large majority of CGs having at least one interacting pair (Mendes de Oliveira & Hickson, 1994). Thus, the existence of FRB 20220610A in a compact group with signs of interaction could indicate its progenitor was associated with a fairly recent, young population of stars.
4.4 A Comparison to Non-Repeating and Galaxy Cluster FRB Hosts
As FRB 20220610A is an apparent non-repeater, we next investigate how it compares to the hosts of other non-repeaters. While no statistically significant differences have been found between the host galaxies of repeaters and apparent non-repeaters, the latter tend to occur in more massive and luminous galaxies than repeaters (Bhandari et al., 2022a; Gordon et al., 2023). The fraction of transitioning and quiescent non-repeater host galaxies also appears to be larger than repeaters, with all quiescent hosts and the majority of transitioning hosts to date associated with non-repeaters (Gordon et al., 2023; Sharma et al., 2023; Law et al., 2023). However, these less active galaxies comprise a minority of the non-repeating (and thus overall) FRB host population; indeed, the large majority of non-repeating host galaxies are star-forming, aligning with the host of FRB 20220610A.
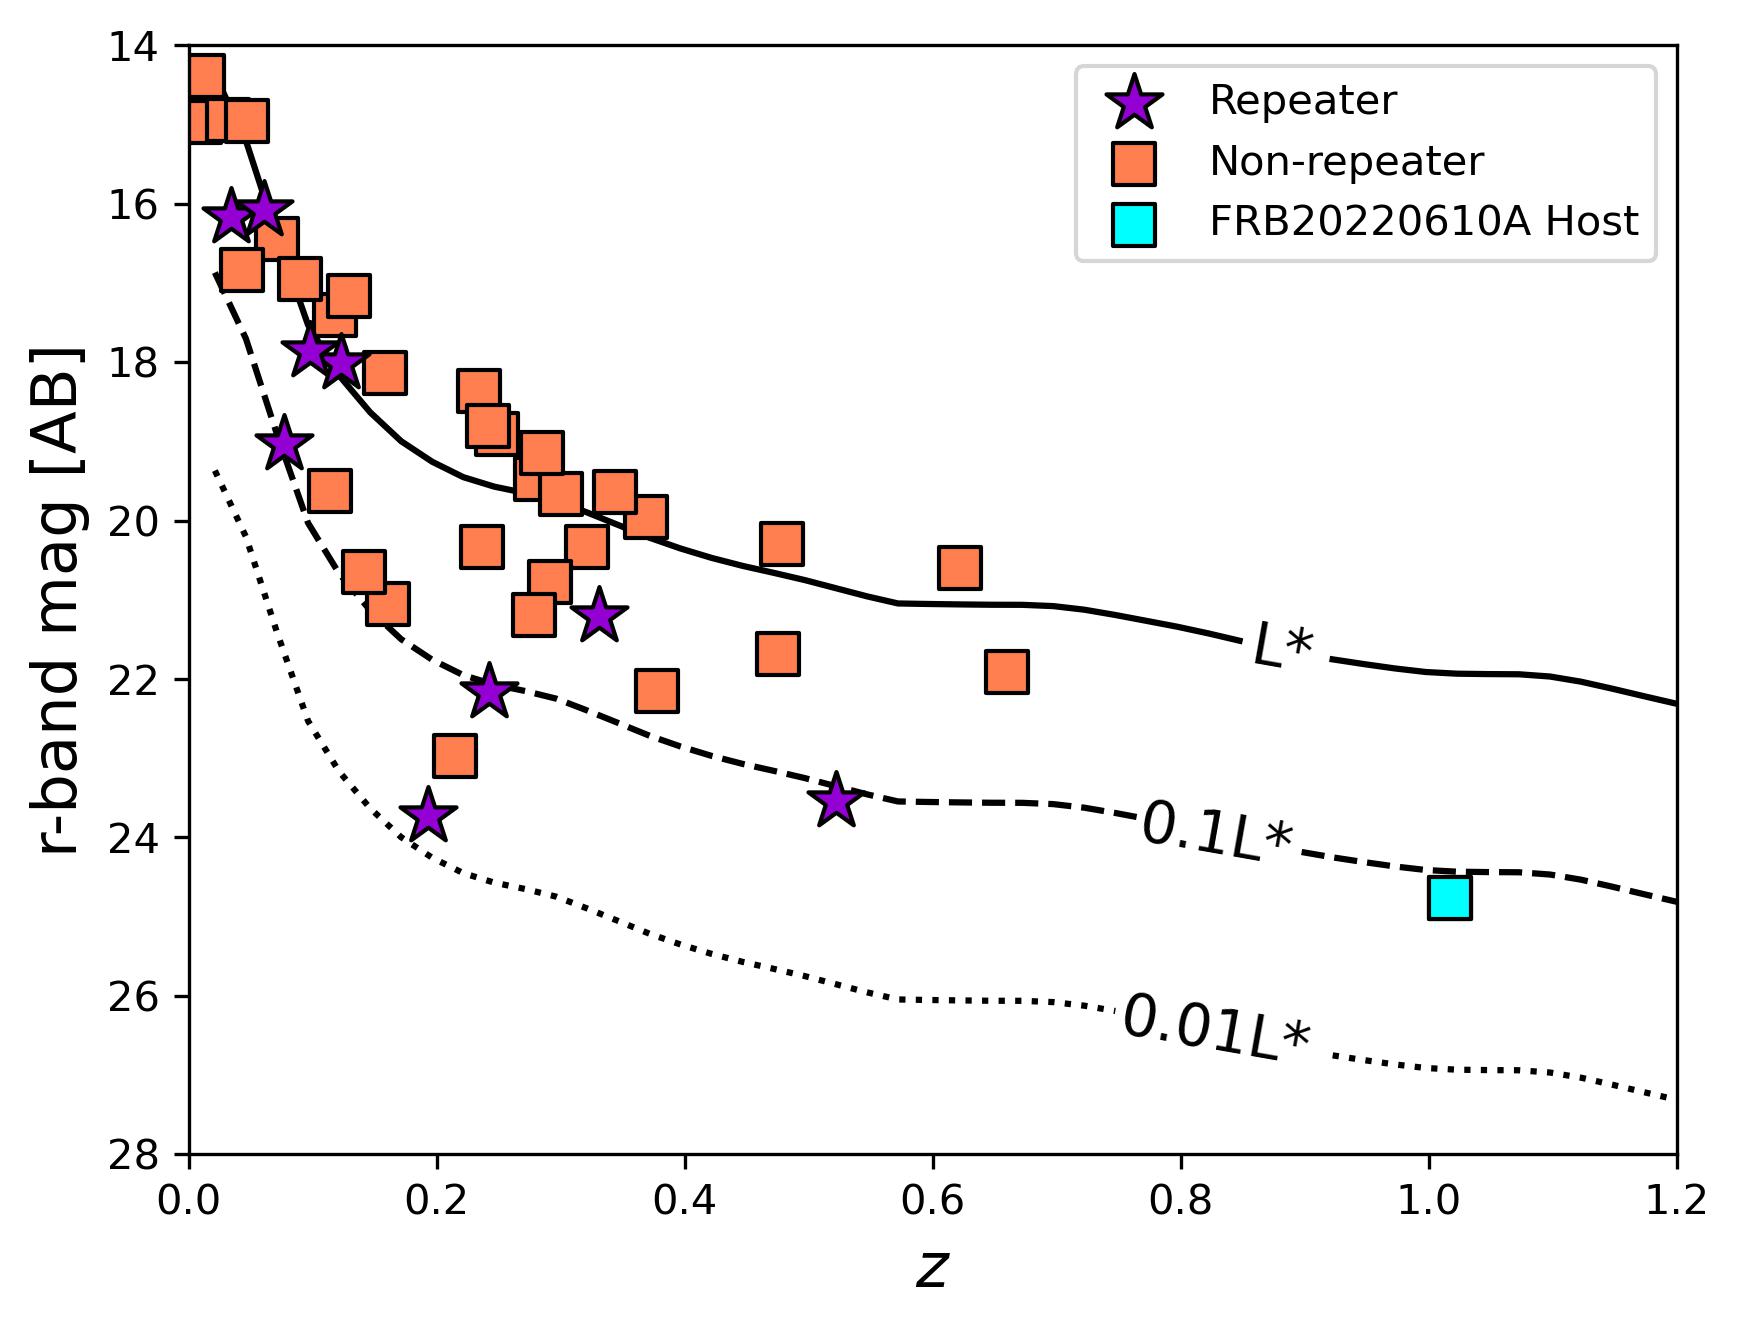
To compare the host of FRB 20220610A to the larger FRB host population, we compare their optical luminosities with the redshift-evolving galaxy luminosity function (characterized by the characteristic luminosity in a Schechter galaxy luminosity function; Schechter 1976). In Figure 6, we plot the -band or -band apparent AB magnitude versus redshift for the host of FRB 20220610A and 42 FRB hosts with such data (Ravi et al., 2019; Gordon et al., 2023; Ibik et al., 2023; Lee-Waddell et al., 2023; Law et al., 2023; Panther et al., 2023; Ravi et al., 2023). In the single case of FRB 20190102C, we use -band as -band data were not available. We then plot curves corresponding to , 0.1 , and 0.01 galaxies, in which the values evolve with redshift but always correspond to the rest-frame -band (Brown et al., 2001; Wolf et al., 2003; Willmer et al., 2006; Reddy & Steidel, 2009; Finkelstein et al., 2015; Heintz et al., 2020). Nearly all non-repeating FRB hosts are , with the majority close to the curve. The lack of observed fainter hosts could be intrinsic to the population, or possibly an observational bias given that it is easier to detect bright galaxies and subsequently associate them to FRBs. The host of FRB 20220610A is consistent with a luminosity of , which is on the faint end of the observed luminosity function for non-repeating FRB hosts, but still consistent with the larger non-repeater population.
To date, FRB 20220610A is the fourth FRB associated to a dense galactic environment. It joins FRBs 20220509G and 20220914A which were discovered by the Deep Synoptic Array (DSA-110; Ravi et al. 2023) and localized to hosts in the galaxy clusters Abell 2311 and 2310, respectively (Connor et al., 2023; Sharma et al., 2023), and FRB 20200320A, a CHIME candidate repeater in the vicinity of several WISESCOS galaxies but with a large localization region (Rafiei-Ravandi et al., 2023). As these FRBs occurred in a much lower redshift regime (with all three at ), we cannot compare their stellar population properties directly, but we note several interesting similarities. First, all three are apparent non-repeaters. Second, two of the three (FRB 20220610A and FRB 20220914A) are actively star-forming, tracing the star-forming main sequence when compared to other galaxies at their redshift. As galaxies within clusters and groups tend to be redder and more quiescent than field galaxies especially at low redshifts, (Balogh et al., 1998, 2004; Coenda et al., 2012), it is notable that these FRBs occurred in star-forming galaxies, seemingly irrespective of the trends of the large-scale environment in which the galaxies reside. However, FRB 20220509G was localized to a quiescent galaxy, indicating a diversity of global environments within this sub-population.
While the fraction of FRBs confirmed to originate from galaxy clusters and groups is small (three out of FRB hosts to date; this work, Connor et al. 2023; Sharma et al. 2023), it would be notable if this fraction increases as the number of localized hosts increases, especially at high redshift where the fraction of star-forming galaxies is higher (Whitaker et al., 2012). Galaxy clusters are much more prevalent at low redshift, as these structures take time to form (Springel et al., 2018), so it is not surprising that the two cluster associations are at low-redshift. However, observational biases may dissuade association with such environments at all redshifts. First, the gas between the galaxies can contribute to the DM (Section 4.5), and there is more limited sensitivity of experiments to high-DM FRBs (i.e., Figure 4 of Ryder et al. 2023). Second, thus far, only non-repeating FRBs have been discovered in these environments; if this trend continues, the absence of repeats may make it more difficult to reliably obtain sub-arcsecond localizations. Finally, at higher redshifts, it is clear that the resolution of HST is required to resolve close galaxy systems or pairs, which will be an observational challenge as the number of FRBs increases. While these associations to dense, galactic environments may be more difficult, FRBs in these environments act as unique probes of the intragroup (IGrM) or intracluster (ICM) media. Additional associations will also be useful to understand if large-scale environment plays a role in the FRB progenitor.
4.5 The Effect of a Compact Galaxy Group Origin on FRB Properties
We next investigate the likely effect of a compact galaxy group origin on FRB properties, and comment on if this is reflected in the observed properties of FRB 20220610A. The IGrM is expected to be a multi-phase medium composed of very hot ( K), warm ( K), and cool ( K) gas (Oppenheimer et al., 2021). It cools primarily via line emission as opposed to Bremsstrahlung radiation as in the ICM (Lovisari et al., 2021; Oppenheimer et al., 2021). Given that it is ionized, it should contribute to the observed FRB DM in a similar manner to the ICM in galaxy clusters (Prochaska & Zheng, 2019). If it also contains a significant ordered magnetic field, this ionized medium would contribute to the observed RM. Finally, if the IGrM is sufficiently turbulent, it would additionally contribute to multi-path propagation that could be observed via temporal broadening of the FRB pulse (i.e., scattering), scintillation, or depolarization. We treat each of these possibilities in turn in the following subsections.
4.5.1 Can Intragroup Gas Account for the Excess DM?
The total observed DM of an FRB () is made up of contributions from the Milky Way, the cosmic web and intervening galaxy halos, and the host galaxy, i.e.,
| (2) |
can be estimated from maps of the electron distribution in the Milky Way and assumptions on the Milky Way dark matter halo. encompasses gas in the circumgalactic medium (CGM) from potential intervening halos and the diffuse intergalactic medium (IGM); the mean value can be estimated via the Macquart relation (Macquart et al., 2020). The remaining DM is attributed to ionized material in and around the host galaxy via . While the size of the contribution must depend on the nature and orientation of the host galaxy, the location of the FRB within it, and the presence of any dense circumburst medium, studies to date have often assumed that can be approximated by a constant value (e.g. Macquart et al., 2010b) or drawn from a single distribution (e.g. James et al., 2022b). Furthermore, if the FRB host is located in a galaxy cluster or group, the corresponding ICM and/or IGrM contributions would also contribute to the term.
There have been several FRBs whose extragalactic DMs (i.e., all components outside of the Milky Way) are anomalously high compared to the value of inferred from the Macquart relation; these are often referred to as “DM-excess” sources (e.g., Niu et al. 2022; Simha et al. 2023). Indeed, FRB 20220610A is one of these “DM-excess” FRBs. One possible explanation for these sources is a larger than assumed value for . Indeed, there is precedent for attributing excess DM to the ICM in the the case of FRB 20220914A, which was localized to a galaxy cluster. Connor et al. (2023) attribute most of the excess DM to the ICM. However, the ICM DM contribution is larger than any expected DM contribution from the IGrM owed to the much larger masses of galaxy clusters over groups.
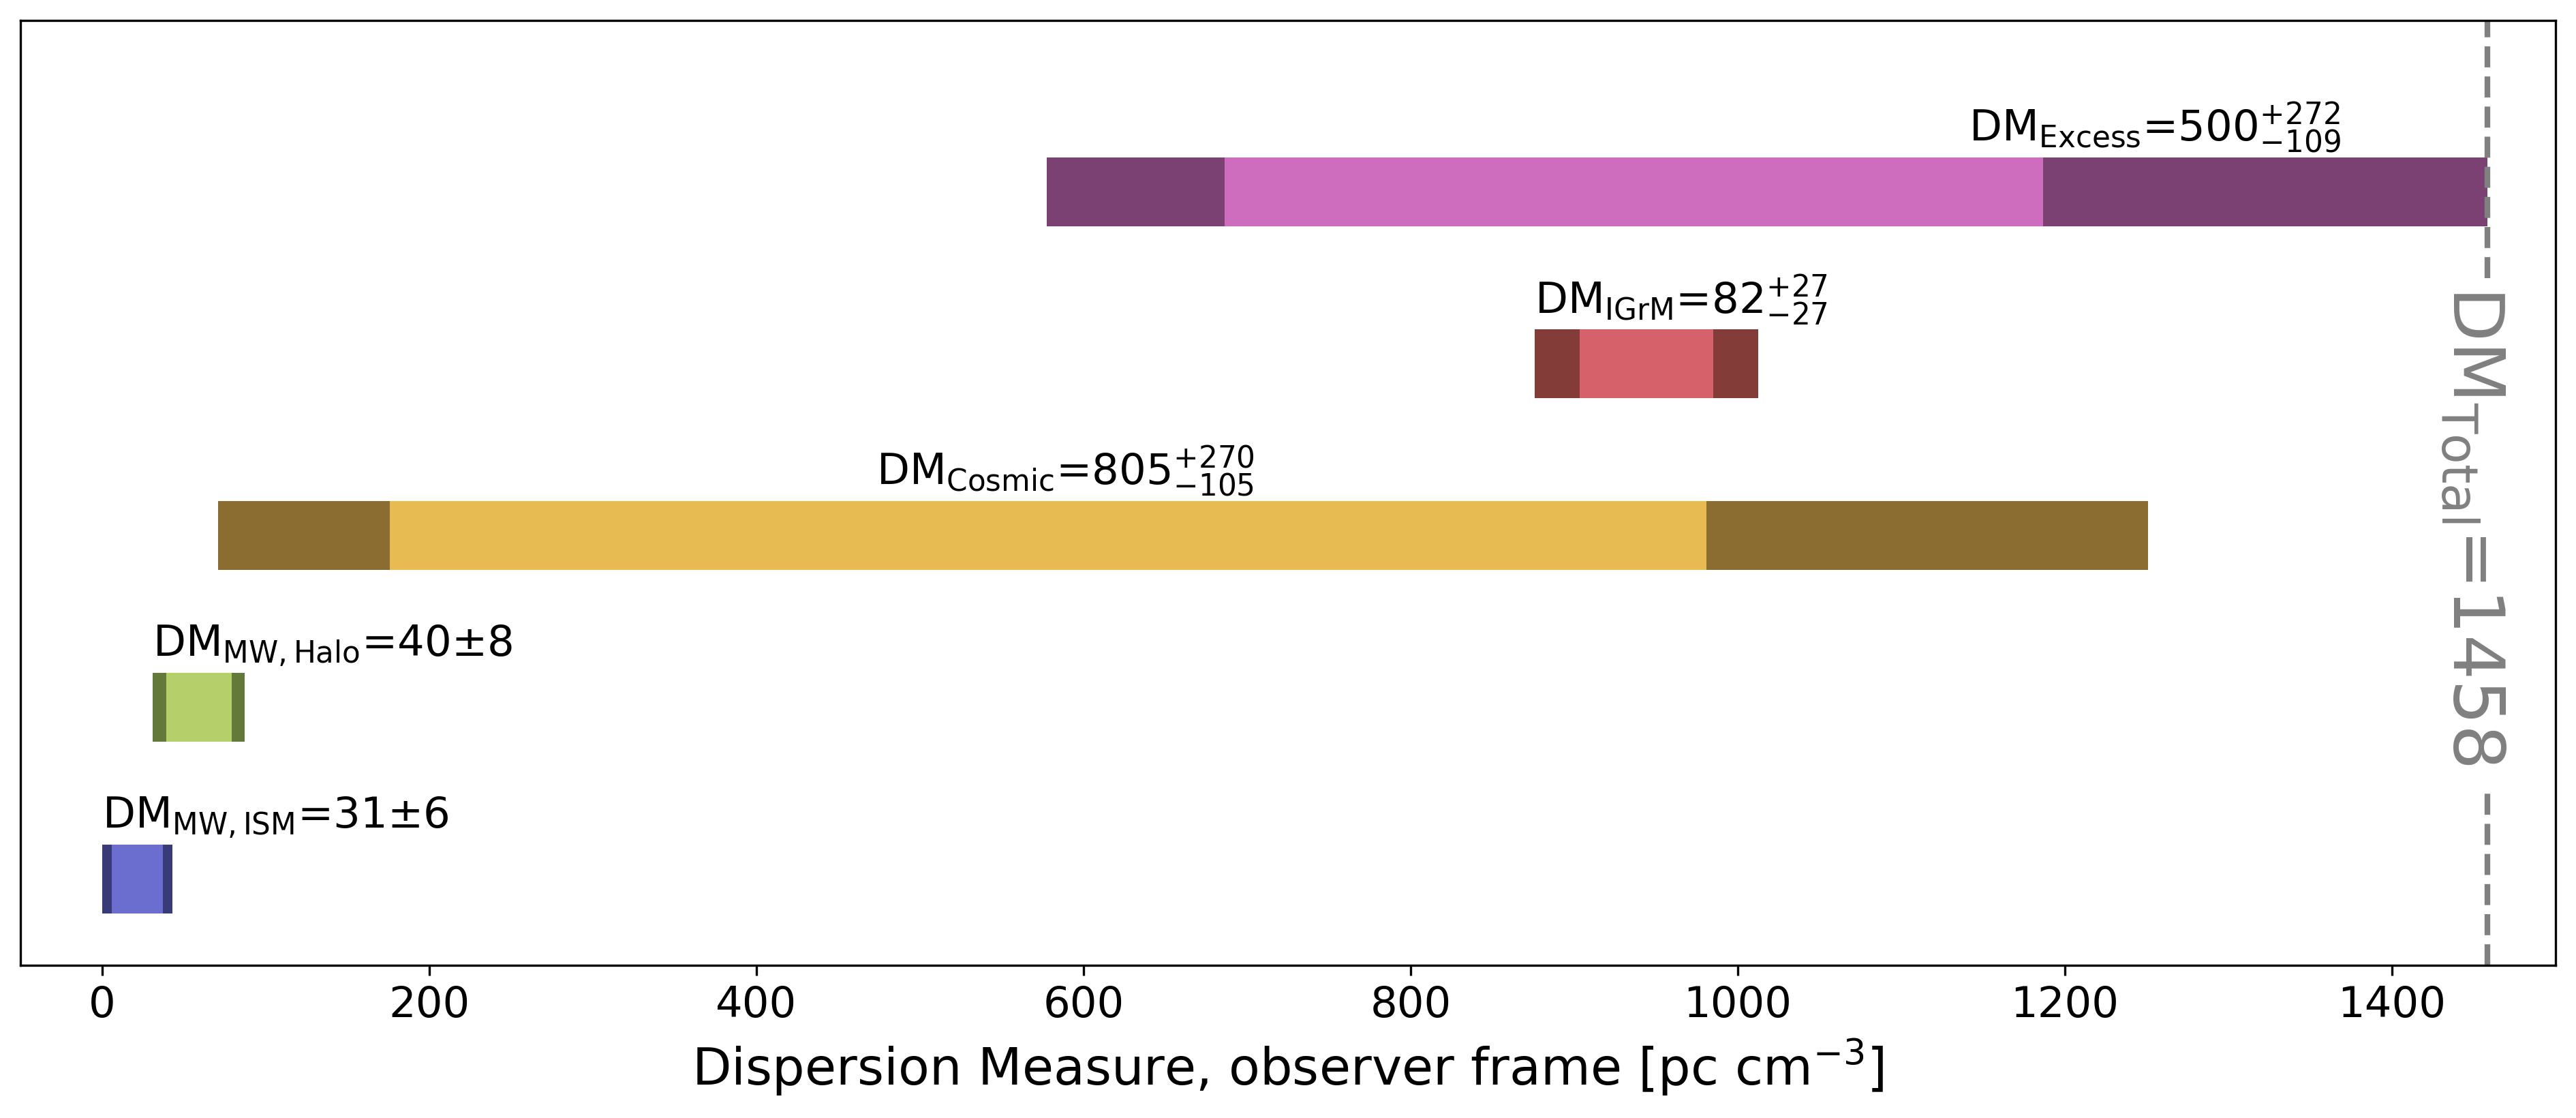
For FRB 20220610A, Ryder et al. (2023) measured a of 1458 . Assuming (with from NE2001 (Cordes & Lazio, 2002) and ; Prochaska & Zheng 2019) and an average at a redshift of , this sightline is in excess by . If this arose entirely from the host galaxy (i.e., in the rest frame), FRB 20220610A would have the most extreme host DM contribution to date, a factor of two higher than the next highest value (for FRB 20190520B; Simha et al. 2023; Lee et al. 2023).
With FRB 20220610A now confirmed to reside in a compact group of galaxies, the IGrM could potentially provide a natural explanation for at least some of the excess DM. To estimate , we must first make assumptions on the spatial distribution of the ionized gas in the IGrM. Since our spectroscopic data is limited in resolution and does not encompass every galaxy in the group, we cannot estimate the velocity dispersion of the group members to infer the group virial mass. Instead, we derive a rough estimate of by assuming a dark matter halo mass based on the combined stellar masses of the galaxies. We first estimate the stellar masses for all galaxies using the van der Wel et al. (2014) mass-radius relation, assuming and the Galfit effective radii measurements in the F160W filter. Using the methods described in Nugent et al. (2023), we take the highest likelihood mass as the stellar mass of the galaxy; these values are reported in Table 2. For G1 and G6, we instead use the Prospector-derived stellar mass estimates as described in Section 3.4. Next, we use the abundance-matching based stellar-to-halo-mass ratio (SHMR) from Moster et al. (2013) to convert the stellar masses of the galaxies to halo mass estimates. We assume the group halo mass is a simple sum of the individual halo mass estimates, i.e., . Then, following Simha et al. (2023) and Lee et al. (2023), we assume the plasma in the IGrM follows a modified NFW profile with and which extends to 2 virial radii (see Prochaska & Zheng, 2019, for a mathematical description of the model). We further assume the ionized fraction of the baryons within the group, , is 0.6. Our choices for these model parameters are justified by the work of Khrykin et al. (2023) who investigated the partition of baryons in halos and the diffuse IGM.
We estimate a fiducial contribution of to the observed FRB DM by assuming the FRB is at the center of the halo gas profile. This results in in the observer frame and in the rest frame. If the FRB were located at the far outer edge of the halo and intersected the halo diameter, at most, could contribute , or in the rest frame. If instead the FRB was offset from the center, the sightline would intersect a smaller portion of the halo and yield a commensurately lower . Thus, we assume a fiducial contribution of to the IGrM (or in the rest-frame). We calculate the resulting excess DM as in the observed frame (or in the rest-frame), estimating the uncertainties via Gaussian error propagation on all preceding DM components. We provide a visual for the relative contributions of these components in Figure 7.
There are two possible scenarios to explain the remaining excess DM: (1) The majority of the excess DM must be accounted for by the remaining components of DMhost, i.e., the circumburst environment and/or the host ISM; or (2) there are significant foreground structures along the sightline, meaning DMcosmic is much greater than the average value inferred from the Macquart relation (as was the case for FRB 20190520B; Lee et al., 2023).444We note a combination of these scenarios is additionally plausible. Unless a comprehensive assessment of the foreground line-of-sight (e.g. Simha et al., 2023; Lee et al., 2023) indicates an unusually dense sightline to FRB 20220610A, the substantial excess DM must reside within the host galaxy. Thus, further follow-up with line-of-sight foreground mapping will be required to disentangle these scenarios and place constraints on the properties of, and contributions from, the IGrM. At the same time, a more robust analysis of the could be performed with redshifts of all the galaxies in the system. Space-based IFU observations with e.g., JWST, would be a promising pathway for more detailed analysis.
4.5.2 Revisiting the Rotation Measure
The RM can be used to probe the magneto-ionic environment of the FRB, and when combined with the DM, can place constraints on the magnetic fields of the host galaxy. The now-measured presence of an IGrM (which alters the DM budget for the host ISM and circumburst medium) invites the RM budget of FRB 20220610A to be revisited.
As the IGM is not expected to contribute significantly to the RM (Mannings et al., 2023), the measured RM of an FRB (neglecting the Earth’s ionospheric contribution of a few rad m-2 and the small MW contribution) can be attributed mainly to the host galaxy. However, in the case of intervening galaxy clusters or groups (either line-of-sight or local to the FRB), the ICM or IGrM could contribute measurably to the observed RM (Connor et al., 2023; Sherman et al., 2023).
The rest-frame RMhost of FRB 20220610A is 860 rad m-2 (Ryder et al., 2023), a factor of five higher than the median rest-frame RM of the non-repeating FRB population (163.91 rad m-2; data from Sherman et al. 2023; Mannings et al. 2023) and a factor of 36 higher than the median rest-frame RM of the repeating FRB population555We note the range of the repeating FRB RMs is significantly larger than that of non-repeaters due to the extreme RM of FRB 20121102A, which, while varying, has been measured to be as large as 1.6 rad m-2 (Hilmarsson et al., 2021). (24.2 rad m-2; data from Mannings et al. 2023). When combined, the DM and RM probe the magnetic field along the line-of-sight via
| (3) |
If the RM originates in plasma at the redshift of the burst host (either in the circumburst medium, the host galaxy ISM, or in the IGrM), this would correspond to a (electron density weighted) mean magnetic field strength parallel to the line of sight of 0.902 G, assuming a DMexcess+IGrM of 1173 pc cm-3. This magnetic field strength is typical for pulsar lines of sight through the Milky Way ISM (Ryder et al., 2023), but is larger than expected for the diffuse IGrM (e.g., Prochaska et al. 2019 calculate an upper limit of G for the host halo of FRB 20181112A). Combined with the fact that the IGrM contributes only a minority of the DM excess, we conclude that it could only contribute a majority of the RM if the in the IGrM was considerably larger than expectations. Without an independent constraint on RMIGrM, we cannot further separate and , but it is reasonable to assume that while both locations contribute to the total , the host ISM dominates.
4.5.3 Multi-path Propagation
Given the new observations, we can also revisit the origin of the scatter broadening of the FRB. Ryder et al. (2023) estimated the scatter broadening of FRB 20220610A to be ms. For an equivalent column of dispersion, the strength of the scatter broadening is approximately three orders of magnitude lower than that of the Milky Way ISM (Bhat et al. 2004; after correcting for the redshift of the scattering plasma, differences in geometry between Milky Way lines of sight, and the ISM of the host galaxy. Thus, comparison of the pulse scattering to the inferred electron density favors plasma close to the FRB progenitor as the source of the scattering.
While is a minority of the total inferred , the geometrical lever arm effect of locating it further from the FRB progenitor means that if this plasma was equally turbulent to a typical ISM sightline, it could nevertheless dominate the observed scattering. However, observations of other FRBs which have probed halo sightlines inferred very low levels of turbulence which would contribute negligibly to the observed scattering (Prochaska et al., 2019). If, however, the IGrM does contribute appreciably to the measured scattering, this would further strengthen the argument that dense plasma in the host galaxy must reside close to the FRB progenitor, as has been inferred for other FRB systems (Ocker et al., 2023).
In summary, if subsequent observations show no overdensity of foreground structures along the line of sight and a large excess DM is associated with the host galaxy, it likely originates in plasma close to the FRB progenitor. However, this plasma only produces moderate scattering and Faraday rotation, and does not exhibit frequency-dependent depolarization (Ryder et al., 2023). Taken together, these properties are consistent with a dense circumburst medium similar to those inferred for repeating FRBs that exhibit DM excesses, but less magneto-ionically active than inferred for those sources. Alternatively, the host galaxy ISM could be (very) significantly less turbulent than the Milky Way’s ISM. Of course, if the budget is significantly reduced because is found to be higher due to foreground structures, the dominant locations of the scattering (and Faraday rotation) would have to be revisited.
5 Conclusions
We have presented two-filter HST imaging of the host of FRB 20220610A, the FRB with the most distant confirmed host to date. These observations reveal a previously unresolved complex composed of at least seven sources within a region of radius 16 kpc, two of which were too faint to be detected in ground-based imaging. In the context of the HST imaging, we re-visit previous VLT spectroscopy and determine spectroscopic redshifts for at least four of the galaxies at . Owing to their similar redshifts and the lack of clear evidence for a larger-scale galaxy cluster, we identify the galaxies as members of a compact group. We come to the following conclusions:
-
•
We identify the galaxy coincident with the FRB, G1, as the most likely host of FRB 20220610A. The next most likely host galaxy (G6) is a factor of less probable. We measure the redshift of the host to be .
-
•
We use SED modeling to determine the stellar population properties of the host galaxy and derive a stellar mass of log(M∗/M⊙) 9.690.11, a mass-weighted age of Gyr, and a star formation rate integrated over the past 100 Myr of M⊙ yr-1. These properties designate the host as a star-forming galaxy.
-
•
The host galaxy properties are consistent with the star-forming field galaxy population at in stellar mass, star-formation rate, star formation history, and mass-weighted age. However, the host is slightly more massive than star-forming field galaxies at its redshift.
-
•
Comparing the host of FRB 20220610A to the hosts of non-repeating FRBs (the large majority of which reside at ), we find that it traces field galaxy properties analogously to the low- FRB host population. However, while most low- hosts have luminosities around the characteristic luminosity of the galaxy luminosity function (), the host of FRB 20220610A is on the fainter end of the luminosity function at .
-
•
The HST imaging reveals potential signs of interaction between the host and other galaxy group members, which are thought to trigger bursts of star formation in these physically dense systems. Coupled with its existence in a star-forming galaxy, this could indicate that the progenitor of FRB 20220610A is associated with a fairly recent population of stars.
-
•
In light of the compact group origin, we examine the intragroup medium as the source of the excess DM. Our fiducial estimate of can account for in the observed frame (16555 in the rest-frame). Thus, we conclude the IGrM is a minority contributor to the host DM, leaving an excess DM of in the observed frame (1008 in the rest-frame).
-
•
The excess DM likely originates from either (1) the immediate circumburst environment to the FRB progenitor and/or (2) significant foreground structures along the line of sight, or (3) a combination of the two. Further follow-up with line-of-sight foreground mapping will be required to disentangle these scenarios.
-
•
The magnetic fields along the line of sight are unlikely to be dominated by the IGrM but rather by the host ISM. However, without an independent constraint on RMIGrM, we cannot further separate the magnetic field contributions of the IGrM and the host galaxy.
FRB 20220610A marks the fourth FRB associated with a dense, large-scale environment, and is the first at , providing a benchmark event for the field. Furthermore, it is the first confirmed FRB to be localized to its host galaxy. Upgrades to current FRB detection facilities and new experiments have been coming online that are increasing the sensitivity to fainter, high-DM FRBs. Thus, we expect the FRB host population to increase steadily over the next few years. This population will provide crucial context for the host of FRB 20220610A and enable studies of the evolution of FRB and host properties over cosmic time by bridging this population to those at low-. To provide an unambiguous association to their host galaxies, the localizations of FRBs must be . Larger samples of FRB host galaxies will be required to quantify the frequency of sub-populations, such as those associated with dense, large-scale environments, and the resulting implications for the FRB progenitor(s), their formation channels, and their usage as probes of the cosmic web. This is especially crucial for hosts that are not immediately detected or easily characterized in existing archival imaging, as these “outliers” can place strong constraints on the nature of the FRB progenitor(s).
6 Acknowledgments
The authors thank Mitchell Revalski for guidance on PSF modeling, Clecio Bom and Gabriel Teixeira for sharing DELVE photometric redshifts, Stephanie Juneau for discussion on field galaxy photometric redshifts, Daniele Sorini for his calculation of in halos at z = 1, Khee-Gan Lee for discussions on the DM properties of the IGrM, Gary Mamon for insightful discussions on compact galaxy groups, and Kameswara Bharadwaj Mantha for contributions to the HST proposal.
A.C.G. and the Fong Group at Northwestern acknowledges support by the National Science Foundation under grant Nos. AST-1814782, AST-1909358 and CAREER grant No. AST-2047919. W.F. gratefully acknowledges support by the David and Lucile Packard Foundation, the Alfred P. Sloan Foundation, and the Research Corporation for Science Advancement through Cottrell Scholar Award #28284. A.C.G., W.F., S.S., Y.D., C.D.K., T.E., A.R.M., J.X.P., and N.T. acknowledge support from NSF grants AST-1911140, AST-1910471 and AST-2206490 as members of the Fast and Fortunate for FRB Follow-up team. R.M.S. acknowledges support through Australian Research Council Future Fellowship FT190100155. R.M.S and A.T.D acknowledge support through Australian Research Council Discovery Project DP220102305. C.D.K. acknowledges partial support from a CIERA postdoctoral fellowship. L.M. acknowledges the receipt of an MQ-RES scholarship from Macquarie University. Y.D. is supported by the National Science Foundation Graduate Research Fellowship under Grant No.421 DGE-1842165. T.E. is supported by NASA through the NASA Hubble Fellowship grant HST-HF2-51504.001-A awarded by the Space Telescope Science Institute, which is operated by the Association of Universities for Research in Astronomy, Inc., for NASA, under contract NAS5-26555. M.G. is supported by the Australian Government through the Australian Research Council’s Discovery Projects funding scheme (DP210102103).
This research was supported in part through the computational resources and staff contributions provided for the Quest high performance computing facility at Northwestern University which is jointly supported by the Office of the Provost, the Office for Research, and Northwestern University Information Technology.
This scientific work uses data obtained from Inyarrimanha Ilgari Bundara/the Murchison Radio-astronomy Observatory. We acknowledge the Wajarri Yamaji People as the Traditional Owners and native title holders of the Observatory site. CSIRO’s ASKAP radio telescope is part of the Australia Telescope National Facility (https://ror.org/05qajvd42). Operation of ASKAP is funded by the Australian Government with support from the National Collaborative Research Infrastructure Strategy. ASKAP uses the resources of the Pawsey Supercomputing Research Centre. Establishment of ASKAP, Inyarrimanha Ilgari Bundara, the CSIRO Murchison Radio-astronomy Observatory and the Pawsey Supercomputing Research Centre are initiatives of the Australian Government, with support from the Government of Western Australia and the Science and Industry Endowment Fund.
Based on observations collected at the European Organisation for Astronomical Research in the Southern Hemisphere under ESO programmes 105.204W and 108.21ZF.
The Legacy Surveys consist of three individual and complementary projects: the Dark Energy Camera Legacy Survey (DECaLS; Proposal ID #2014B-0404; PIs: David Schlegel and Arjun Dey), the Beijing-Arizona Sky Survey (BASS; NOAO Prop. ID #2015A-0801; PIs: Zhou Xu and Xiaohui Fan), and the Mayall z-band Legacy Survey (MzLS; Prop. ID #2016A-0453; PI: Arjun Dey). DECaLS, BASS and MzLS together include data obtained, respectively, at the Blanco telescope, Cerro Tololo Inter-American Observatory, NSF’s NOIRLab; the Bok telescope, Steward Observatory, University of Arizona; and the Mayall telescope, Kitt Peak National Observatory, NOIRLab. Pipeline processing and analyses of the data were supported by NOIRLab and the Lawrence Berkeley National Laboratory (LBNL). The Legacy Surveys project is honored to be permitted to conduct astronomical research on Iolkam Du’ag (Kitt Peak), a mountain with particular significance to the Tohono O’odham Nation.
NOIRLab is operated by the Association of Universities for Research in Astronomy (AURA) under a cooperative agreement with the National Science Foundation. LBNL is managed by the Regents of the University of California under contract to the U.S. Department of Energy.
This project used data obtained with the Dark Energy Camera (DECam), which was constructed by the Dark Energy Survey (DES) collaboration. Funding for the DES Projects has been provided by the U.S. Department of Energy, the U.S. National Science Foundation, the Ministry of Science and Education of Spain, the Science and Technology Facilities Council of the United Kingdom, the Higher Education Funding Council for England, the National Center for Supercomputing Applications at the University of Illinois at Urbana-Champaign, the Kavli Institute of Cosmological Physics at the University of Chicago, Center for Cosmology and Astro-Particle Physics at the Ohio State University, the Mitchell Institute for Fundamental Physics and Astronomy at Texas A&M University, Financiadora de Estudos e Projetos, Fundacao Carlos Chagas Filho de Amparo, Financiadora de Estudos e Projetos, Fundacao Carlos Chagas Filho de Amparo a Pesquisa do Estado do Rio de Janeiro, Conselho Nacional de Desenvolvimento Cientifico e Tecnologico and the Ministerio da Ciencia, Tecnologia e Inovacao, the Deutsche Forschungsgemeinschaft and the Collaborating Institutions in the Dark Energy Survey. The Collaborating Institutions are Argonne National Laboratory, the University of California at Santa Cruz, the University of Cambridge, Centro de Investigaciones Energeticas, Medioambientales y Tecnologicas-Madrid, the University of Chicago, University College London, the DES-Brazil Consortium, the University of Edinburgh, the Eidgenossische Technische Hochschule (ETH) Zurich, Fermi National Accelerator Laboratory, the University of Illinois at Urbana-Champaign, the Institut de Ciencies de l’Espai (IEEC/CSIC), the Institut de Fisica d’Altes Energies, Lawrence Berkeley National Laboratory, the Ludwig Maximilians Universitat Munchen and the associated Excellence Cluster Universe, the University of Michigan, NSF’s NOIRLab, the University of Nottingham, the Ohio State University, the University of Pennsylvania, the University of Portsmouth, SLAC National Accelerator Laboratory, Stanford University, the University of Sussex, and Texas A&M University.
BASS is a key project of the Telescope Access Program (TAP), which has been funded by the National Astronomical Observatories of China, the Chinese Academy of Sciences (the Strategic Priority Research Program “The Emergence of Cosmological Structures” Grant # XDB09000000), and the Special Fund for Astronomy from the Ministry of Finance. The BASS is also supported by the External Cooperation Program of Chinese Academy of Sciences (Grant # 114A11KYSB20160057), and Chinese National Natural Science Foundation (Grant # 12120101003, # 11433005).
The Legacy Survey team makes use of data products from the Near-Earth Object Wide-field Infrared Survey Explorer (NEOWISE), which is a project of the Jet Propulsion Laboratory/California Institute of Technology. NEOWISE is funded by the National Aeronautics and Space Administration.
The Legacy Surveys imaging of the DESI footprint is supported by the Director, Office of Science, Office of High Energy Physics of the U.S. Department of Energy under Contract No. DE-AC02-05CH1123, by the National Energy Research Scientific Computing Center, a DOE Office of Science User Facility under the same contract; and by the U.S. National Science Foundation, Division of Astronomical Sciences under Contract No. AST-0950945 to NOAO.
This work has made use of data from the European Space Agency (ESA) mission Gaia (https://www.cosmos.esa.int/gaia), processed by the Gaia Data Processing and Analysis Consortium (DPAC, https://www.cosmos.esa.int/web/gaia/dpac/consortium). Funding for the DPAC has been provided by national institutions, in particular the institutions participating in the Gaia Multilateral Agreement.
Appendix A Emission Line Identification
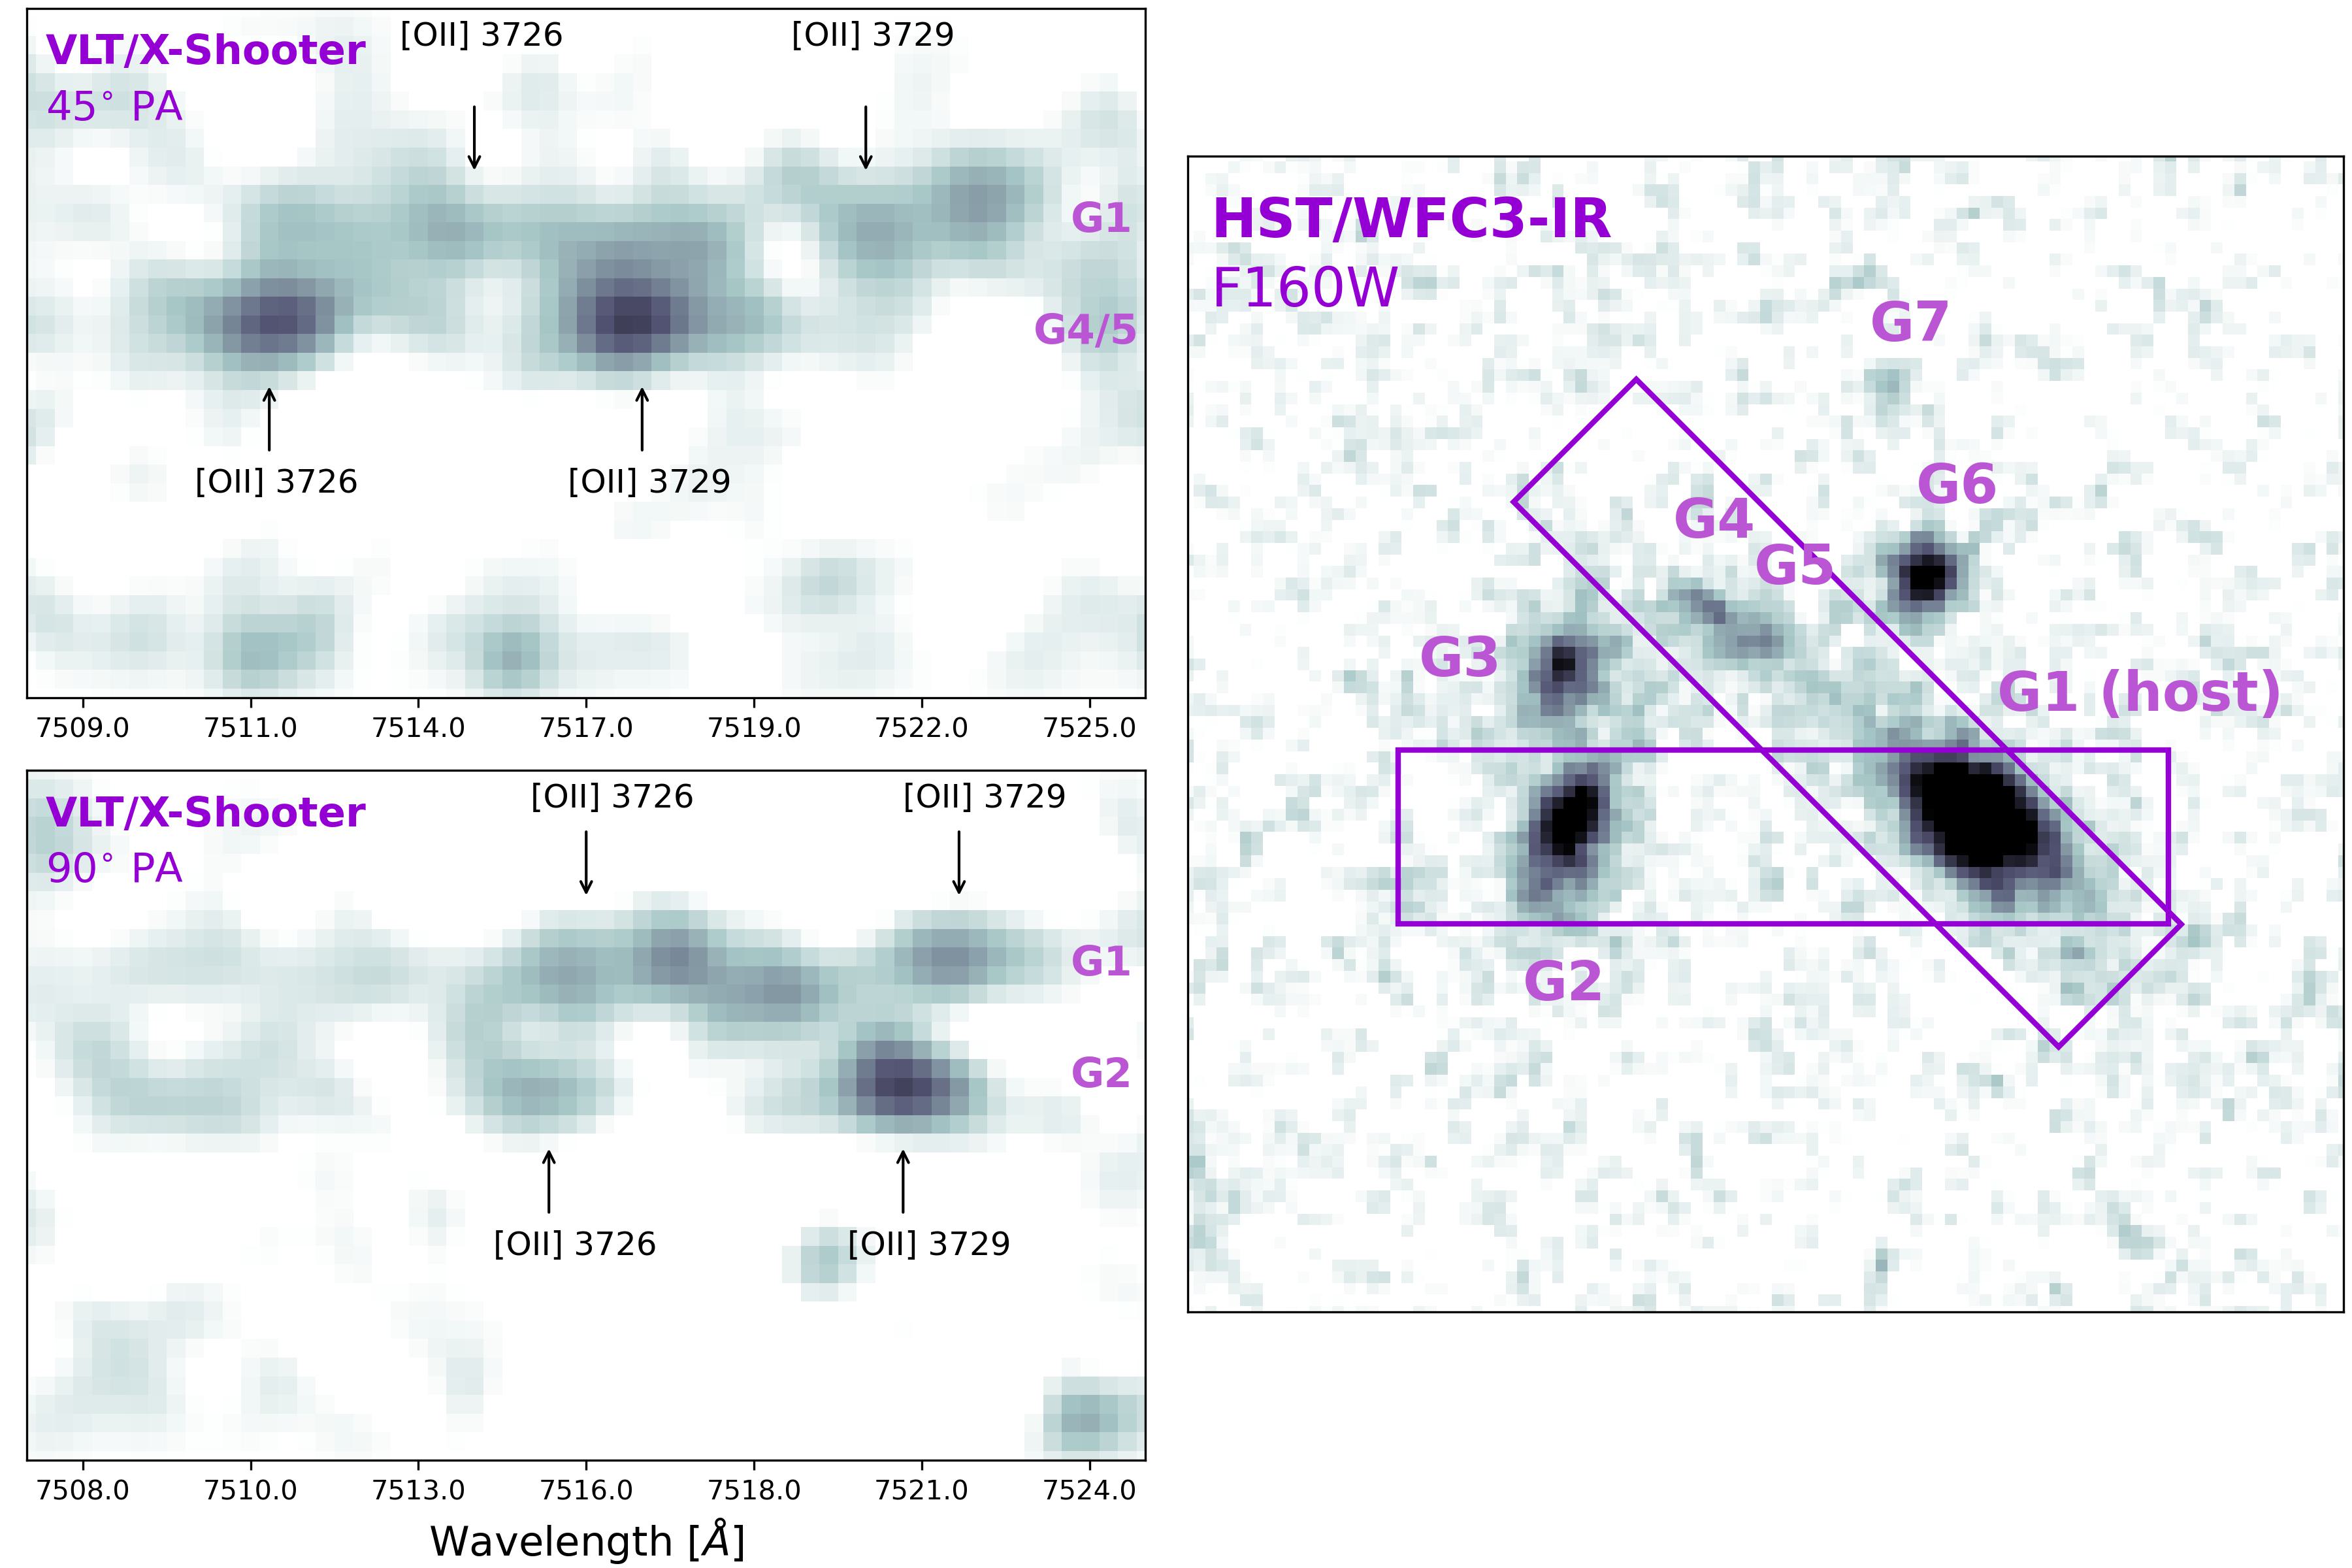
Ryder et al. (2023) obtained two spectra with VLT/X-Shooter (PI Macquart, Program 105.204W.004; Vernet et al. 2011), one at a position angle of 45∘ and the second at 90∘, to determine if the objects identified in the ground-based imaging belonged to one galaxy or three (i.e., Figure 2 of Ryder et al. 2023). Through detections of the [O II]3726Å, 3729Å doublet and H, the redshift of the three clumps was established at ; one of the interpretations is that the clumps belonged to a single galaxy.
As briefly described in Section 3.1, we overlaid the slit orientations on the HST imaging to determine the redshifts of the galaxies that are now resolved. The spectrum at PA=90∘ covered the location of G1 and G2, and the PA=45∘ spectrum covered G1, G4, and G5. The centers of G1 and G2 are separated by 217, which translates to a separation of 6.73 pixels at the pixel scale and binning of the X-Shooter data. We additionally use an unrelated object that serendipitously aligned with the slit to further verify the galaxy locations. We identify the [O II]3726Å, 3729Å doublet at the expected location of G1 and G2, with redshifts of . G1 and G4 are separated by 174 (5.51 pixels); G1 and G5 are separated by 147 (4.65 pixels). Via identification of the [O II] doublet, we again confirm G1 to be at , while G4 and G5 are consistent with (they are not resolved into two components in the spectra). We show the 2D spectra centered on the [O II]3726Å, 3729Å doublet as well as their positions on the sky overlaid on the F160W image in Figure A.1. We obtained further follow-up spectroscopy to identify the redshift of G6 and find via probable identification of the [O II] doublet that the redshift is consistent with . The low signal-to-noise of the line identifications prevents further precision on the redshift of G6.
References
- Aggarwal et al. (2021) Aggarwal, K., Budavári, T., Deller, A. T., et al. 2021, ApJ, 911, 95, doi: 10.3847/1538-4357/abe8d2
- Anderson (2020) Anderson, J. 2020, Supplemental Dither Patterns for WFC3/UVIS, Instrument Science Report WFC3 2020-7, 18 pages
- Appenzeller et al. (1998) Appenzeller, I., Fricke, K., Fürtig, W., et al. 1998, The Messenger, 94, 1
- Astropy Collaboration et al. (2022) Astropy Collaboration, Price-Whelan, A. M., Lim, P. L., et al. 2022, ApJ, 935, 167, doi: 10.3847/1538-4357/ac7c74
- Avila et al. (2015) Avila, R. J., Hack, W., Cara, M., et al. 2015, in Astronomical Society of the Pacific Conference Series, Vol. 495, Astronomical Data Analysis Software an Systems XXIV (ADASS XXIV), ed. A. R. Taylor & E. Rosolowsky, 281, doi: 10.48550/arXiv.1411.5605
- Bahcall (1999) Bahcall, N. A. 1999, in Formation of Structure in the Universe, ed. A. Dekel & J. P. Ostriker, 135
- Balogh et al. (2004) Balogh, M. L., Baldry, I. K., Nichol, R., et al. 2004, ApJ, 615, L101, doi: 10.1086/426079
- Balogh et al. (1998) Balogh, M. L., Schade, D., Morris, S. L., et al. 1998, ApJ, 504, L75, doi: 10.1086/311576
- Bannister et al. (2019) Bannister, K. W., Deller, A. T., Phillips, C., et al. 2019, Science, 365, 565, doi: 10.1126/science.aaw5903
- Bertin & Arnouts (1996) Bertin, E., & Arnouts, S. 1996, A&AS, 117, 393, doi: 10.1051/aas:1996164
- Bhandari et al. (2022a) Bhandari, S., Heintz, K. E., Aggarwal, K., et al. 2022a, AJ, 163, 69, doi: 10.3847/1538-3881/ac3aec
- Bhandari et al. (2022b) Bhandari, S., Gordon, A. C., Scott, D. R., et al. 2022b, arXiv e-prints, arXiv:2211.16790. https://arxiv.org/abs/2211.16790
- Bhardwaj et al. (2023) Bhardwaj, M., Michilli, D., Kirichenko, A. Y., et al. 2023, arXiv e-prints, arXiv:2310.10018, doi: 10.48550/arXiv.2310.10018
- Bhat et al. (2004) Bhat, N. D. R., Cordes, J. M., Camilo, F., Nice, D. J., & Lorimer, D. R. 2004, ApJ, 605, 759, doi: 10.1086/382680
- Bloom et al. (2002) Bloom, J. S., Kulkarni, S. R., & Djorgovski, S. G. 2002, AJ, 123, 1111, doi: 10.1086/338893
- Boller et al. (2016) Boller, T., Freyberg, M. J., Trümper, J., et al. 2016, A&A, 588, A103, doi: 10.1051/0004-6361/201525648
- Bradley et al. (2021) Bradley, L., Sipőcz, B., Robitaille, T., et al. 2021, astropy/photutils: 1.3.0, 1.3.0, Zenodo, Zenodo, doi: 10.5281/zenodo.5796924
- Brown et al. (2001) Brown, W. R., Geller, M. J., Fabricant, D. G., & Kurtz, M. J. 2001, AJ, 122, 714, doi: 10.1086/321176
- Chatterjee et al. (2017) Chatterjee, S., Law, C. J., Wharton, R. S., et al. 2017, Nature, 541, 58, doi: 10.1038/nature20797
- CHIME/FRB Collaboration et al. (2018) CHIME/FRB Collaboration, Amiri, M., Bandura, K., et al. 2018, ApJ, 863, 48, doi: 10.3847/1538-4357/aad188
- CHIME/FRB Collaboration et al. (2019) —. 2019, Nature, 566, 235, doi: 10.1038/s41586-018-0864-x
- CHIME/FRB Collaboration et al. (2021) CHIME/FRB Collaboration, Amiri, M., Andersen, B. C., et al. 2021, ApJS, 257, 59, doi: 10.3847/1538-4365/ac33ab
- Chittidi et al. (2021) Chittidi, J. S., Simha, S., Mannings, A., et al. 2021, ApJ, 922, 173, doi: 10.3847/1538-4357/ac2818
- Coenda et al. (2012) Coenda, V., Muriel, H., & Martínez, H. J. 2012, A&A, 543, A119, doi: 10.1051/0004-6361/201118318
- Connor et al. (2023) Connor, L., Ravi, V., Catha, M., et al. 2023, ApJ, 949, L26, doi: 10.3847/2041-8213/acd3ea
- Conroy & Gunn (2010) Conroy, C., & Gunn, J. E. 2010, ApJ, 712, 833, doi: 10.1088/0004-637X/712/2/833
- Conroy et al. (2009) Conroy, C., Gunn, J. E., & White, M. 2009, ApJ, 699, 486, doi: 10.1088/0004-637X/699/1/486
- Cordes & Lazio (2002) Cordes, J. M., & Lazio, T. J. W. 2002, arXiv e-prints, astro, doi: 10.48550/arXiv.astro-ph/0207156
- Deng et al. (2008) Deng, X. F., He, J. Z., & Wu, P. 2008, A&A, 484, 355, doi: 10.1051/0004-6361:20078849
- Dey et al. (2019) Dey, A., Schlegel, D. J., Lang, D., et al. 2019, AJ, 157, 168, doi: 10.3847/1538-3881/ab089d
- Díaz-Giménez et al. (2020) Díaz-Giménez, E., Taverna, A., Zandivarez, A., & Mamon, G. A. 2020, MNRAS, 492, 2588, doi: 10.1093/mnras/stz3356
- Dong et al. (2023) Dong, Y., Eftekhari, T., Fong, W.-f., et al. 2023, arXiv e-prints, arXiv:2307.06995, doi: 10.48550/arXiv.2307.06995
- Drlica-Wagner et al. (2022) Drlica-Wagner, A., Ferguson, P. S., Adamów, M., et al. 2022, ApJS, 261, 38, doi: 10.3847/1538-4365/ac78eb
- Eftekhari & Berger (2017) Eftekhari, T., & Berger, E. 2017, ApJ, 849, 162, doi: 10.3847/1538-4357/aa90b9
- Eftekhari et al. (2023) Eftekhari, T., Fong, W., Gordon, A. C., et al. 2023, arXiv e-prints, arXiv:2307.03766, doi: 10.48550/arXiv.2307.03766
- Faber et al. (2003) Faber, S. M., Phillips, A. C., Kibrick, R. I., et al. 2003, in Society of Photo-Optical Instrumentation Engineers (SPIE) Conference Series, Vol. 4841, Instrument Design and Performance for Optical/Infrared Ground-based Telescopes, ed. M. Iye & A. F. M. Moorwood, 1657–1669, doi: 10.1117/12.460346
- Finkelstein et al. (2015) Finkelstein, S. L., Ryan, Russell E., J., Papovich, C., et al. 2015, ApJ, 810, 71, doi: 10.1088/0004-637X/810/1/71
- Fitzpatrick & Massa (2007) Fitzpatrick, E. L., & Massa, D. 2007, ApJ, 663, 320, doi: 10.1086/518158
- Fong et al. (2021) Fong, W.-f., Dong, Y., Leja, J., et al. 2021, ApJ, 919, L23, doi: 10.3847/2041-8213/ac242b
- Gaia Collaboration et al. (2016) Gaia Collaboration, Prusti, T., de Bruijne, J. H. J., et al. 2016, A&A, 595, A1, doi: 10.1051/0004-6361/201629272
- Gaia Collaboration et al. (2018) Gaia Collaboration, Brown, A. G. A., Vallenari, A., et al. 2018, A&A, 616, A1, doi: 10.1051/0004-6361/201833051
- Gordon et al. (2023) Gordon, A. C., Fong, W.-f., Kilpatrick, C. D., et al. 2023, ApJ, 954, 80, doi: 10.3847/1538-4357/ace5aa
- Harris et al. (2020) Harris, C. R., Millman, K. J., van der Walt, S. J., et al. 2020, Nature, 585, 357, doi: 10.1038/s41586-020-2649-2
- Hartsuiker & Ploeckinger (2020) Hartsuiker, L., & Ploeckinger, S. 2020, MNRAS, 491, L66, doi: 10.1093/mnrasl/slz171
- Hashimoto et al. (2022) Hashimoto, T., Goto, T., Chen, B. H., et al. 2022, MNRAS, 511, 1961, doi: 10.1093/mnras/stac065
- Heintz et al. (2020) Heintz, K. E., Prochaska, J. X., Simha, S., et al. 2020, ApJ, 903, 152, doi: 10.3847/1538-4357/abb6fb
- Hickson (1982) Hickson, P. 1982, ApJ, 255, 382, doi: 10.1086/159838
- Hickson (1997) —. 1997, ARA&A, 35, 357, doi: 10.1146/annurev.astro.35.1.357
- Hilmarsson et al. (2021) Hilmarsson, G. H., Michilli, D., Spitler, L. G., et al. 2021, ApJ, 908, L10, doi: 10.3847/2041-8213/abdec0
- Hilton et al. (2021) Hilton, M., Sifón, C., Naess, S., et al. 2021, ApJS, 253, 3, doi: 10.3847/1538-4365/abd023
- Hinshaw et al. (2013) Hinshaw, G., Larson, D., Komatsu, E., et al. 2013, ApJS, 208, 19, doi: 10.1088/0067-0049/208/2/19
- Hotan et al. (2021) Hotan, A. W., Bunton, J. D., Chippendale, A. P., et al. 2021, PASA, 38, e009, doi: 10.1017/pasa.2021.1
- Hunter (2007) Hunter, J. D. 2007, Computing in Science & Engineering, 9, 90, doi: 10.1109/MCSE.2007.55
- Ibik et al. (2023) Ibik, A. L., Drout, M. R., Gaensler, B. M., et al. 2023, arXiv e-prints, arXiv:2304.02638, doi: 10.48550/arXiv.2304.02638
- James et al. (2022a) James, C. W., Prochaska, J. X., Macquart, J. P., et al. 2022a, MNRAS, 510, L18, doi: 10.1093/mnrasl/slab117
- James et al. (2022b) James, C. W., Ghosh, E. M., Prochaska, J. X., et al. 2022b, MNRAS, 516, 4862, doi: 10.1093/mnras/stac2524
- Johnson et al. (2023) Johnson, B., Foreman-Mackey, D., Sick, J., et al. 2023, dfm/python-fsps: v0.4.6, v0.4.6, Zenodo, doi: 10.5281/zenodo.10026684
- Johnson (2021) Johnson, B. D. 2021, bd-j/sedpy: sedpy v0.2.0, v0.2.0, Zenodo, Zenodo, doi: 10.5281/zenodo.4582723
- Johnson et al. (2021) Johnson, B. D., Leja, J., Conroy, C., & Speagle, J. S. 2021, ApJS, 254, 22, doi: 10.3847/1538-4365/abef67
- Joye & Mandel (2003) Joye, W. A., & Mandel, E. 2003, in Astronomical Society of the Pacific Conference Series, Vol. 295, Astronomical Data Analysis Software and Systems XII, ed. H. E. Payne, R. I. Jedrzejewski, & R. N. Hook, 489
- Khrykin et al. (2023) Khrykin, I. S., Sorini, D., Lee, K.-G., & Davé, R. 2023, arXiv e-prints, arXiv:2310.01496, doi: 10.48550/arXiv.2310.01496
- Klein et al. (2023) Klein, M., Hernández-Lang, D., Mohr, J. J., Bocquet, S., & Singh, A. 2023, MNRAS, 526, 3757, doi: 10.1093/mnras/stad2729
- Laigle et al. (2016) Laigle, C., McCracken, H. J., Ilbert, O., et al. 2016, ApJS, 224, 24, doi: 10.3847/0067-0049/224/2/24
- Law et al. (2018) Law, C. J., Bower, G. C., Burke-Spolaor, S., et al. 2018, ApJS, 236, 8, doi: 10.3847/1538-4365/aab77b
- Law et al. (2023) Law, C. J., Sharma, K., Ravi, V., et al. 2023, arXiv e-prints, arXiv:2307.03344, doi: 10.48550/arXiv.2307.03344
- Lee et al. (2023) Lee, K.-G., Khrykin, I. S., Simha, S., et al. 2023, ApJ, 954, L7, doi: 10.3847/2041-8213/acefb5
- Lee-Waddell et al. (2023) Lee-Waddell, K., James, C. W., Ryder, S. D., et al. 2023, PASA, 40, e029, doi: 10.1017/pasa.2023.27
- Leja et al. (2020) Leja, J., Speagle, J. S., Johnson, B. D., et al. 2020, ApJ, 893, 111, doi: 10.3847/1538-4357/ab7e27
- Lovisari et al. (2021) Lovisari, L., Ettori, S., Gaspari, M., & Giles, P. A. 2021, Universe, 7, 139, doi: 10.3390/universe7050139
- Mack & Bajaj (2019) Mack, J., & Bajaj, V. 2019, Improved Drizzled Data Products for the WFC3/IR Detector, Instrument Science Report WFC3 2019-5, 23 pages
- Macquart et al. (2010a) Macquart, J.-P., Bailes, M., Bhat, N. D. R., et al. 2010a, Publications of the Astronomical Society of Australia, 27, 272, doi: 10.1071/AS09082
- Macquart et al. (2010b) —. 2010b, PASA, 27, 272, doi: 10.1071/AS09082
- Macquart et al. (2020) Macquart, J. P., Prochaska, J. X., McQuinn, M., et al. 2020, Nature, 581, 391, doi: 10.1038/s41586-020-2300-2
- Madau & Dickinson (2014) Madau, P., & Dickinson, M. 2014, ARA&A, 52, 415, doi: 10.1146/annurev-astro-081811-125615
- Mamon (1992) Mamon, G. A. 1992, ApJ, 401, L3, doi: 10.1086/186656
- Mannings et al. (2021) Mannings, A. G., Fong, W.-f., Simha, S., et al. 2021, ApJ, 917, 75, doi: 10.3847/1538-4357/abff56
- Mannings et al. (2023) Mannings, A. G., Pakmor, R., Prochaska, J. X., et al. 2023, ApJ, 954, 179, doi: 10.3847/1538-4357/ace7bb
- Marcote et al. (2020) Marcote, B., Nimmo, K., Hessels, J. W. T., et al. 2020, Nature, 577, 190, doi: 10.1038/s41586-019-1866-z
- Mendes de Oliveira & Hickson (1994) Mendes de Oliveira, C., & Hickson, P. 1994, ApJ, 427, 684, doi: 10.1086/174175
- Montaguth et al. (2023) Montaguth, G. P., Torres-Flores, S., Monachesi, A., et al. 2023, MNRAS, 524, 5340, doi: 10.1093/mnras/stad2235
- Moster et al. (2013) Moster, B. P., Naab, T., & White, S. D. M. 2013, MNRAS, 428, 3121, doi: 10.1093/mnras/sts261
- Niu et al. (2022) Niu, C. H., Aggarwal, K., Li, D., et al. 2022, Nature, 606, 873, doi: 10.1038/s41586-022-04755-5
- Nugent et al. (2023) Nugent, A. E., Fong, W.-f., Castrejon, C., et al. 2023, arXiv e-prints, arXiv:2310.12202, doi: 10.48550/arXiv.2310.12202
- Nugent et al. (2022) Nugent, A. E., Fong, W.-F., Dong, Y., et al. 2022, ApJ, 940, 57, doi: 10.3847/1538-4357/ac91d1
- Ocker et al. (2023) Ocker, S. K., Cordes, J. M., Chatterjee, S., et al. 2023, MNRAS, 519, 821, doi: 10.1093/mnras/stac3547
- Oguri et al. (2018) Oguri, M., Lin, Y.-T., Lin, S.-C., et al. 2018, PASJ, 70, S20, doi: 10.1093/pasj/psx042
- Oppenheimer et al. (2021) Oppenheimer, B. D., Babul, A., Bahé, Y., Butsky, I. S., & McCarthy, I. G. 2021, Universe, 7, 209, doi: 10.3390/universe7070209
- Panther et al. (2023) Panther, F. H., Anderson, G. E., Bhandari, S., et al. 2023, MNRAS, 519, 2235, doi: 10.1093/mnras/stac3597
- Pearson et al. (2019) Pearson, W. J., Wang, L., Alpaslan, M., et al. 2019, A&A, 631, A51, doi: 10.1051/0004-6361/201936337
- Peng et al. (2002) Peng, C. Y., Ho, L. C., Impey, C. D., & Rix, H.-W. 2002, AJ, 124, 266, doi: 10.1086/340952
- Peng et al. (2010) —. 2010, AJ, 139, 2097, doi: 10.1088/0004-6256/139/6/2097
- Petroff et al. (2022) Petroff, E., Hessels, J. W. T., & Lorimer, D. R. 2022, A&A Rev., 30, 2, doi: 10.1007/s00159-022-00139-w
- Pirard et al. (2004) Pirard, J.-F., Kissler-Patig, M., Moorwood, A., et al. 2004, in Society of Photo-Optical Instrumentation Engineers (SPIE) Conference Series, Vol. 5492, Ground-based Instrumentation for Astronomy, ed. A. F. M. Moorwood & M. Iye, 1763–1772, doi: 10.1117/12.578293
- Planck Collaboration et al. (2016) Planck Collaboration, Ade, P. A. R., Aghanim, N., et al. 2016, A&A, 594, A27, doi: 10.1051/0004-6361/201525823
- Platts et al. (2019) Platts, E., Weltman, A., Walters, A., et al. 2019, Phys. Rep., 821, 1, doi: 10.1016/j.physrep.2019.06.003
- Prochaska & Zheng (2019) Prochaska, J. X., & Zheng, Y. 2019, MNRAS, 485, 648, doi: 10.1093/mnras/stz261
- Prochaska et al. (2019) Prochaska, J. X., Macquart, J.-P., McQuinn, M., et al. 2019, Science, 366, 231, doi: 10.1126/science.aay0073
- Prochaska et al. (2023) Prochaska, J. X., Simha, S., almannin, et al. 2023, FRBs/FRB: Release to sync with Gordon et al. 2023, v2.0, Zenodo, doi: 10.5281/zenodo.8125230
- Rafelski et al. (2015) Rafelski, M., Teplitz, H. I., Gardner, J. P., et al. 2015, AJ, 150, 31, doi: 10.1088/0004-6256/150/1/31
- Rafiei-Ravandi et al. (2023) Rafiei-Ravandi, M., Smith, K. M., Michilli, D., et al. 2023, arXiv e-prints, arXiv:2308.09608, doi: 10.48550/arXiv.2308.09608
- Ravi (2019) Ravi, V. 2019, MNRAS, 482, 1966, doi: 10.1093/mnras/sty1551
- Ravi et al. (2019) Ravi, V., Catha, M., D’Addario, L., et al. 2019, Nature, 572, 352, doi: 10.1038/s41586-019-1389-7
- Ravi et al. (2022) Ravi, V., Law, C. J., Li, D., et al. 2022, MNRAS, 513, 982, doi: 10.1093/mnras/stac465
- Ravi et al. (2023) Ravi, V., Catha, M., Chen, G., et al. 2023, ApJ, 949, L3, doi: 10.3847/2041-8213/acc4b6
- Reback et al. (2022) Reback, J., jbrockmendel, McKinney, W., et al. 2022, pandas-dev/pandas: Pandas 1.4.2, v1.4.2, Zenodo, Zenodo, doi: 10.5281/zenodo.6408044
- Reddy & Steidel (2009) Reddy, N. A., & Steidel, C. C. 2009, ApJ, 692, 778, doi: 10.1088/0004-637X/692/1/778
- Revalski (2022) Revalski, M. 2022, mrevalski/hst_wfc3_psf_modeling: v1.0.0, v1.0.0, Zenodo, doi: 10.5281/zenodo.7458566
- Revalski et al. (2023) Revalski, M., Rafelski, M., Fumagalli, M., et al. 2023, ApJS, 265, 40, doi: 10.3847/1538-4365/acb8ae
- Ryder et al. (2023) Ryder, S. D., Bannister, K. W., Bhandari, S., et al. 2023, Science, 382, 294, doi: 10.1126/science.adf2678
- Sanghavi et al. (2023) Sanghavi, P., Leung, C., Bandura, K., et al. 2023, arXiv e-prints, arXiv:2304.10534, doi: 10.48550/arXiv.2304.10534
- Schechter (1976) Schechter, P. 1976, ApJ, 203, 297, doi: 10.1086/154079
- Schlafly & Finkbeiner (2011) Schlafly, E. F., & Finkbeiner, D. P. 2011, ApJ, 737, 103, doi: 10.1088/0004-637X/737/2/103
- Schulze et al. (2021) Schulze, S., Yaron, O., Sollerman, J., et al. 2021, ApJS, 255, 29, doi: 10.3847/1538-4365/abff5e
- Sersic (1968) Sersic, J. L. 1968, Atlas de Galaxias Australes (Observatoris Astronomico)
- Shannon et al. (2018) Shannon, R. M., Macquart, J. P., Bannister, K. W., et al. 2018, Nature, 562, 386, doi: 10.1038/s41586-018-0588-y
- Sharma et al. (2023) Sharma, K., Somalwar, J., Law, C., et al. 2023, ApJ, 950, 175, doi: 10.3847/1538-4357/accf1d
- Sherman et al. (2023) Sherman, M. B., Connor, L., Ravi, V., et al. 2023, arXiv e-prints, arXiv:2308.06813, doi: 10.48550/arXiv.2308.06813
- Simha et al. (2023) Simha, S., Lee, K.-G., Prochaska, J. X., et al. 2023, ApJ, 954, 71, doi: 10.3847/1538-4357/ace324
- Skelton et al. (2014) Skelton, R. E., Whitaker, K. E., Momcheva, I. G., et al. 2014, ApJS, 214, 24, doi: 10.1088/0067-0049/214/2/24
- Sohn et al. (2016) Sohn, J., Geller, M. J., Hwang, H. S., Zahid, H. J., & Lee, M. G. 2016, ApJS, 225, 23, doi: 10.3847/0067-0049/225/2/23
- Sohn et al. (2015) Sohn, J., Hwang, H. S., Geller, M. J., et al. 2015, Journal of Korean Astronomical Society, 48, 381, doi: 10.5303/JKAS.2015.48.6.381
- Speagle (2020) Speagle, J. S. 2020, MNRAS, 493, 3132, doi: 10.1093/mnras/staa278
- Spitler et al. (2016) Spitler, L. G., Scholz, P., Hessels, J. W. T., et al. 2016, Nature, 531, 202, doi: 10.1038/nature17168
- Springel et al. (2018) Springel, V., Pakmor, R., Pillepich, A., et al. 2018, MNRAS, 475, 676, doi: 10.1093/mnras/stx3304
- Sullivan et al. (2006) Sullivan, M., Le Borgne, D., Pritchet, C. J., et al. 2006, ApJ, 648, 868, doi: 10.1086/506137
- Sunyaev & Zeldovich (1972) Sunyaev, R. A., & Zeldovich, Y. B. 1972, Comments on Astrophysics and Space Physics, 4, 173
- Suzuki et al. (2012) Suzuki, N., Rubin, D., Lidman, C., et al. 2012, ApJ, 746, 85, doi: 10.1088/0004-637X/746/1/85
- Tacchella et al. (2022) Tacchella, S., Conroy, C., Faber, S. M., et al. 2022, ApJ, 926, 134, doi: 10.3847/1538-4357/ac449b
- Tendulkar et al. (2017) Tendulkar, S. P., Bassa, C. G., Cordes, J. M., et al. 2017, ApJ, 834, L7, doi: 10.3847/2041-8213/834/2/L7
- Tendulkar et al. (2021) Tendulkar, S. P., Gil de Paz, A., Kirichenko, A. Y., et al. 2021, ApJ, 908, L12, doi: 10.3847/2041-8213/abdb38
- van der Wel et al. (2014) van der Wel, A., Franx, M., van Dokkum, P. G., et al. 2014, ApJ, 788, 28, doi: 10.1088/0004-637X/788/1/28
- Vernet et al. (2011) Vernet, J., Dekker, H., D’Odorico, S., et al. 2011, A&A, 536, A105, doi: 10.1051/0004-6361/201117752
- Virtanen et al. (2020) Virtanen, P., Gommers, R., Oliphant, T. E., et al. 2020, Nature Methods, 17, 261, doi: 10.1038/s41592-019-0686-2
- Waskom (2021) Waskom, M. L. 2021, Journal of Open Source Software, 6, 3021, doi: 10.21105/joss.03021
- Whitaker et al. (2012) Whitaker, K. E., van Dokkum, P. G., Brammer, G., & Franx, M. 2012, ApJ, 754, L29, doi: 10.1088/2041-8205/754/2/L29
- Wiens et al. (2019) Wiens, C. D., Wenger, T. V., Tzanavaris, P., et al. 2019, ApJ, 873, 124, doi: 10.3847/1538-4357/ab053e
- Willmer et al. (2006) Willmer, C. N. A., Faber, S. M., Koo, D. C., et al. 2006, ApJ, 647, 853, doi: 10.1086/505455
- Wolf et al. (2003) Wolf, C., Meisenheimer, K., Rix, H. W., et al. 2003, A&A, 401, 73, doi: 10.1051/0004-6361:20021513
- Xu et al. (2022) Xu, H., Niu, J. R., Chen, P., et al. 2022, Nature, 609, 685, doi: 10.1038/s41586-022-05071-8
- Zhang (2023) Zhang, B. 2023, Reviews of Modern Physics, 95, 035005, doi: 10.1103/RevModPhys.95.035005
- Zhang & Zhang (2022) Zhang, R. C., & Zhang, B. 2022, ApJ, 924, L14, doi: 10.3847/2041-8213/ac46ad
- Zheng & Shen (2020) Zheng, Y.-L., & Shen, S.-Y. 2020, ApJS, 246, 12, doi: 10.3847/1538-4365/ab5c26