LLMs as Narcissistic Evaluators: When Ego Inflates Evaluation Scores
Abstract
Automatic evaluation of generated textual content presents an ongoing challenge within the field of NLP. Given the impressive capabilities of modern language models (LMs) across diverse NLP tasks, there is a growing trend to employ these models in creating innovative evaluation metrics for automated assessment of generation tasks. This paper investigates a pivotal question: Do language model-driven evaluation metrics inherently exhibit bias favoring texts generated by the same underlying language model? Specifically, we assess whether prominent LM-based evaluation metrics—namely, BARTScore, T5Score, and GPTScore—demonstrate a favorable bias toward their respective underlying LMs in the context of summarization tasks. Our findings unveil a latent bias, particularly pronounced when such evaluation metrics are used in an reference-free manner without leveraging gold summaries. These results underscore that assessments provided by generative evaluation models can be influenced by factors beyond the inherent text quality, highlighting the necessity of developing more dependable evaluation protocols in the future.
1 Introduction
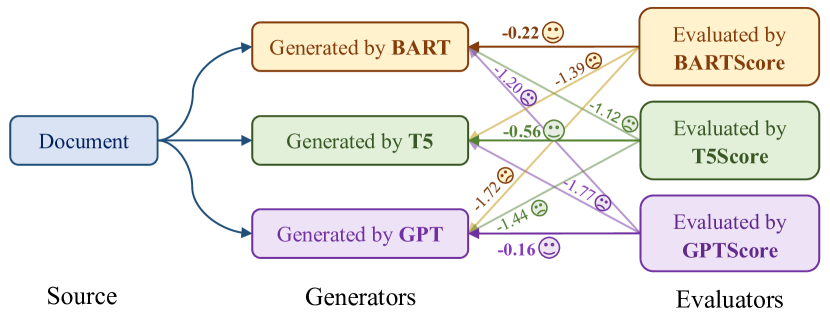
Evaluation is a fundamental element in both tracking progress and ensuring meaningful advancements across various dimensions within the field of Natural Language Processing. Therefore, the reliability of evaluation metrics plays a critical role in this process. Evaluating generated texts is one of the challenging and open problems in NLP given that different forms can convey the same meaning. This challenge has led to the development of various evaluation metrics for tasks involving natural language generation. While human evaluation by experts stands as the most reliable approach for assessing generated outputs, it is costly and time-consuming, limiting its broader use. As a result, automatic evaluation metrics have emerged as practical alternatives to keep pace with the rapid progress in NLP (van der Lee et al. 2019). Recent evaluation metrics for generation tasks, such as BERTScore (Zhang et al. 2020), BARTScore (Yuan, Neubig, and Liu 2021), T5Score (Qin et al. 2022), GPTScore (Fu et al. 2023), and G-Eval (Liu et al. 2023), increasingly rely on pretrained language models. However, this trend poses a paradox, as the very outputs being evaluated are generated by these pretrained language models, raising concerns about inherent biases. For instance, an evaluation metric based on the BART model might yield inflated scores for outputs produced by a BART-based language model. In this paper, we systematically investigate this potential bias, utilizing four prominent language models, namely BART (Lewis et al. 2020), T5 (Raffel et al. 2020), GPT-2 (Radford et al. 2019), and GPT-3 (Brown et al. 2020), along with their corresponding evaluation metrics, i.e., BARTScore, T5Score, and GPTScore, for the task of summarization, which is a typical task in natural language generations and frequently employed in automatic text evaluation. Our analysis involved examining numerous variations of these four generation models, considering their varying sizes and finetuning settings both as generators and evaluators.
We conducted our analysis using the CNN/DM (Hermann et al. 2015; Nallapati et al. 2016) and XSUM (Narayan, Cohen, and Lapata 2018) summarization datasets. The assessment covered two settings: reference-based, using gold summaries for evaluation (common in supervised summarization), and reference-free, evaluating generated summaries against source documents (common in both unsupervised summarization and factuality assessment).
Based on our analysis, we have derived the following findings: (1) Generative evaluators tend to assign higher scores to the content generated by the same underlying model. This bias becomes more pronounced when the fine-tuning configuration and model size match for both the generator and evaluator. (2) Inflated scores are particularly noticeable in the reference-free setting, which is concerning due to the popularity of this evaluation approach for assessing the factuality correctness of generated texts (Koh et al. 2022). (3) Apart from the same model bias, inflated scores are also influenced by certain evaluators’ preference for longer summaries.
Our work has implications for model selection, evaluation strategies, and the development of more reliable and unbiased evaluation metrics in the field of natural language generation.
2 Related Work
Reference-based Evaluation Metrics
Reference-based metrics in summarization typically assess a system by measuring the similarity between generated and reference summaries. Traditional metrics like BLEU (Papineni et al. 2002) and ROUGE (Lin 2004) rely on surface-level similarity, counting the overlap of n-grams between generated and reference texts. However, they often show weak correlations with human judgments, particularly for advanced generation systems (Peyrard 2019; Mathur, Baldwin, and Cohn 2020).
Recent trends favor a semantic-level assessment using pretrained language models rather than directly comparing word overlap. BERTScore (Zhang et al. 2020), MoverScore (Zhao et al. 2019), BARTScore (Yuan, Neubig, and Liu 2021), BLEURT (Sellam, Das, and Parikh 2020), and their many variants are among the metrics that are used for the reference-based setting.
Reference-free Evaluation Metrics
In terms of reference-free metrics, a paradigm without the need for any reference summaries, is to leverage LMs to assign scores to summaries based on source document. A reference-free paradigm employed for factual consistency detection is question-answering metrics, generating a QA-pairs and scoring evaluated content based on the proportion of the pairs that answered correctly (Scialom et al. 2021; Honovich et al. 2021; Zhong et al. 2022).
Representative reference-free metrics in recent years is generative evaluation models under reference-free setting include BARTScore (Yuan, Neubig, and Liu 2021) and GPTScore (Fu et al. 2023), which cast evaluation of text as a natural language generation task, and intuitively, the higher quality of the generated text, the higher probability will be assigned by the underlining generative models. Liu et al. (2023) introduced G-EVAL, an evaluation framework that employs the Chain-of-Thought to assess the quality of generated text in a form-filling paradigm. Through the input of a prompt, G-EVAL stimulates LLMs to generate a Chain-of-Thought, which encompasses detailed evaluation steps for the generated content.
Reference-free metrics are demonstrated to exhibit better performance compared to reference-based metrics particularly in the context of summarization task (Amplayo et al. 2022), leading to the predominant paradigm in evaluation methodologies.
Automatic Evaluation Metrics Pitfalls
Despite their popularity, automatic evaluation systems are reported to possess limitations. Primarily, all current automatic evaluation metrics exhibit bias towards extractive generation systems, assigning them higher rankings. (Amplayo et al. 2022).
For the reference-based evaluation systems, traditional metrics such as ROUGE or BLEU have been verified to fail in measuring content quality or capturing syntactic errors (Reiter and Belz 2009). Consequently, they do not accurately reflect the reliability of Natural Language Generation (NLG) systems. For instance, these metrics can erroneously assign high scores to fluent yet meaningless and unfaithful outputs, as long as many of the same words are used (Gehrmann et al. 2021). Embedding-based metrics (e.g., BERTScore) have demonstrated improved performance in similarity measurement. However, they are inadequate for assessing the extent of shared information between two summaries, an important indicator of summary information quality (Deutsch and Roth 2021).
Reference-free metrics display a bias towards outputs generated by themselves or similar to (Deutsch, Dror, and Roth 2022), with a notable error rate when ranking abstractive summaries (Durmus, Ladhak, and Hashimoto 2022). These drawbacks has been discovered in models including question-answering evaluation metrics like QuestEval (Scialom et al. 2021). Additionally, in those question-answering metrics, they often inherit errors from non-factual summaries, affecting downstream modules (Kamoi, Goyal, and Durrett 2023).
Metrics based on Large Language Models (LLMs) which are capable of conducting reference-based and reference-free evaluations, generally outperform aforementioned baseline metrics in terms of correlating with human quality judgements, demonstrating strong performance for evaluating a wide range of NLG tasks which consider multiple evaluation dimensions. Nevertheless, LLM-based metrics are sensitive to instructions and prompts, and have the potential bias issue arises due to the fundamental assumption of LLM-based evaluators, which cast text evaluation as a generation task (Liu et al. 2023). While prior work (Liu et al. 2023) has raised concerns regarding the bias in LLM-based metrics, to our knowledge, no work has systematically investigated a pivotal question: Do language model-driven evaluation metrics inherently exhibit bias favouring texts generated by the same underlying language model, which this work seeks to answer.
3 Methodology
To explore the impact of the same model bias, we perform a comprehensive series of experiments involving quantitative comparisons and qualitative analysis. Our quantitative comparisons involve using language models of varying sizes and finetuning configurations for both the evaluator and generator models. Subsequently, we verify the results through qualitative analysis using a subset of models’ summaries that are accompanied by human evaluation to further demonstrate that higher scores do not necessarily correlate with higher quality generated outputs.
3.1 Evaluators
We describe the generation progress as follows: given a source text s, generate a hypothesis h, and human written reference r can also be taken into account for the subsequent evaluations, which can be represented in (Fu et al. 2023):
| (1) |
where h denotes hypothesis, a refers to the aspect to evaluate, and denotes supplementary text (i.e., s or r) that is employed alongside evaluations in various settings. For instance, it could be source text in reference-free scenario which assesses the summary based on source article directly (Fabbri et al. 2021). Whereas in reference-based paradigm, the evaluation considers semantic overlap between the generated and reference summaries (Bhandari et al. 2020).
Three evaluators utilised in our study all share a conditional probability paradigm, which can be generally concluded as the definition in:
| (2) |
where denotes the weight of the token at position . Previous works normally treat each token equally (Yuan, Neubig, and Liu 2021; Fu et al. 2023), is determined according to the aspect to evaluate.
BARTScore
BARTScore (Yuan, Neubig, and Liu 2021) introduced the generative evaluation approach treating text assessment as a generation task, employing probability of the text being generated by BART-based models (Lewis et al. 2020) to assess the quality of text generated across various tasks such as machine translation, summarization, and data-to-text.
T5Score
T5Score (Qin et al. 2022) was proposed providing both generative and discriminative training strategy considering T5-variants models as the core of this generative evaluation paradigm111In our work, training process of T5Score models only utilize generative training due to the unavailability of publicly accessible checkpoints trained in discriminative paradigm.. The integration of dual training strategies enables more types of data incorporated into metrics. T5Score closely aligns with BARTScore in terms of evaluation framework. Thus, when only with generative training strategy T5Score is similar to BARTScore.
GPTScore
The insight of leveraging generative models to conduct evaluation has been pushed forward combining with various of large language models (LLMs) born with emergent ability (Fu et al. 2023), showing a great performance and covering a rich variety of aspects for comprehensive evaluations. With capability of understanding natural language instructions, GPTScore can perform intricate and personalised assessments without requiring additional training.
3.2 Generation Models
We analyze different variants of the BART, T5, GPT-2, and GPT-3 models, taking into account two different variables: the model size and the finetuning dataset. Regarding size, we consider small, base, medium, and large variations of each model, when available. For the finetuning dataset, we examine three distinct settings: (1) using the pretrained language model without finetuning on a summarization dataset, (2) finetuned on CNN, and (3) finetuned on XSUM. For instance, BART-BASE-CNN representa a BART-base model that is finetuned on the CNN dataset. For each of the model types, we have used their corresponding standard prompts for the task of summarization.222More details about the corresponding summarization prompts are included in Appendix A.2.
To ensure the reproducibility of our analysis, we exclusively employ publicly available checkpoints for the utilized models333The checkpoints used for each model are listed in Appendix A. Apart from the GPT3-Curie model that is taken from the OpenAI API, the rest of the models are taken from the Huggingface model hub444https://huggingface.co/models.
We use each of these generation models both for generating the summaries555We use the zero-shot setting for the models that are not finetuned on summarization datasets. as well as the underlying model for the LM-based evaluator. For the evaluator, the BART and T5 variants are employed for evaluation using the BARTScore code,666Please note that in a reference-free setting, BARTScore and T5Score are identical. and the GPT variants are used using the GPTScore code.
3.3 Datasets
We use documents from two well-established summarization datasets including CNN/DailyMail (Hermann et al. 2015; Nallapati et al. 2016) and the extreme summarization (XSUM) dataset (Narayan, Cohen, and Lapata 2018).
For the quantitative comparisons, we randomly selected 500 documents from each of these datasets. We provided these documents to each of the generation models to obtain their corresponding generated summaries.
For the qualitative analysis, we use the SummEval benchmark (Fabbri et al. 2021) and the RoSE benchmark (Liu et al. 2022). These benchmarks include summaries from various generation models, as well as human evaluations for those summaries, enabling us to assess the quality of these summaries. SummEval contains summaries generated by various summarization models for 100 articles from the CNN/DM test set, with each summary supplemented by human annotations. SummEval benchmark incorporates human annotations by both expert and crowd-sourced human annotators, targeting dimensions of coherence, consistency, fluency, and relevance. Ratings are on a scale of 0 to 5, with higher values indicating better performance.
Similarly, RoSE contains summaries generated by recent generative models based on CNN/DM documents, accompanied by their corresponding human evaluations. We have used 100 summaries from each of the BART and GPT-3 models from the ROSE benchmark. The benchmark RoSE proposed an assessment protocal termed “Atomic Content Units” (ACUs). ACU score gauges quality of summaries based on whether the presence of single facts (i.e., atomic facts) are included in the summarizations. ACU is calculated by ACU matching:
| (3) |
where is a set of ACUs and s is the candidate summary.
3.4 Quantitative Comparisons
We employ 18 language model-based evaluators for our experiments including six BARTScore evaluators (Yuan, Neubig, and Liu 2021), eight T5Score (Qin et al. 2022) evaluators, and four GPTScore evaluators.777Appendix A.2 contains more details about the evaluators.
We assess the evaluators in two settings: (a) reference-free, where the metric evaluates the likelihood of the summary being generated from the source text. This setting is commonly used for evaluating the faithfulness of generated content (Yuan, Neubig, and Liu 2021), and (b) reference-based, where the generated summary is evaluated based on the gold summary.
Original scores from each evaluator should be negative, and a higher score indicates better quality according to the evaluator. Since the evaluation protocols of BARTScore, T5Score, and GPTScore are all based on the conditional probability paradigm, when weights in Eq. 2 are treated equally. To ensure comparability among the scores provided by 18 distinguished evaluators, a uniform normalization process is applied to the scores generated by each evaluator. The normalization procedure standardizes the scores across a scale ranging from 0 to 1. In this context, a normalized score of 1 signifies the highest quality attributed by the generator, while a score of 0 indicates the lowest quality.
3.5 Qualitative Analysis
For qualitative analysis, we employ Spearman Correlation (Zar 2014) and Kendall Correlation (Freedman, Pisani, and Purves 2007), which respectively assess monotonic relationships and order association between human evaluations and evaluator scores.
For the SummEval dataset, we use the average value of expert annotations for coherence and consistency aspects, aligned with the reference-free input setting in the evaluation protocol, and in RoSE, the index ACU serves as the value for human-annotated data. ACU is an annotation protocol for reference-based summary salience evaluation. As a result, we use the correlation values on the SummEval dataset for the reference-free setting and those on the RoSE benchmark for the reference-based setting.
4 Experimental Results
4.1 Quantitative Comparisons: Assessing Bias in LM-Evaluators Towards Their Own Output
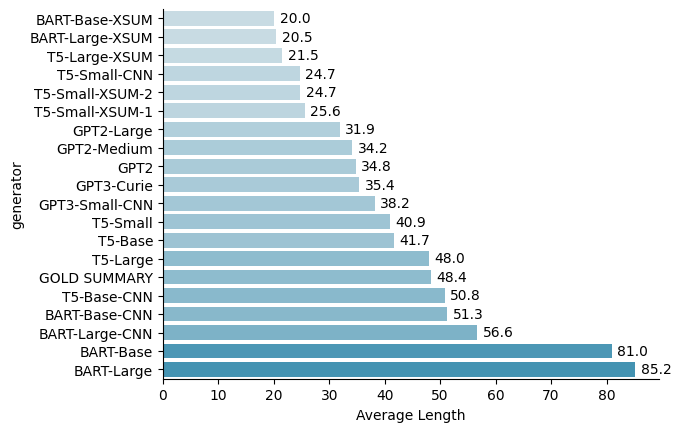
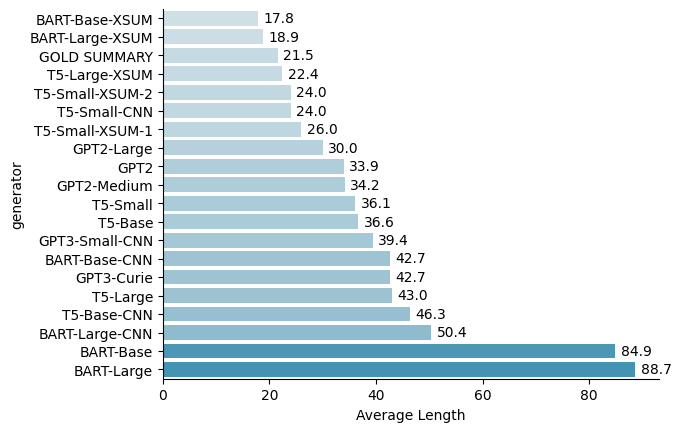
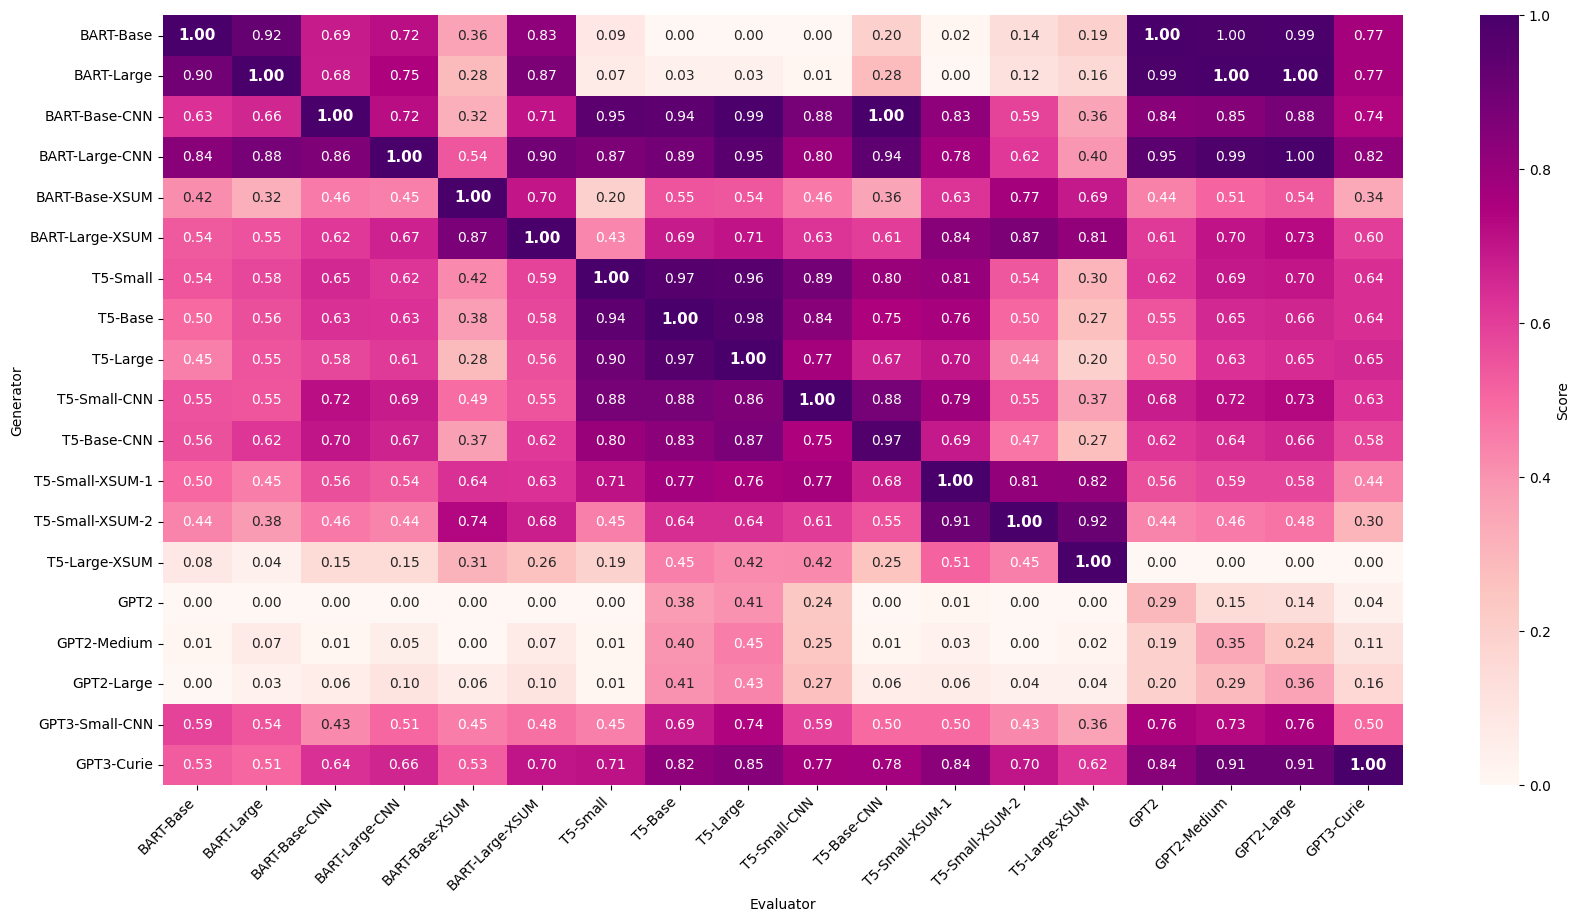
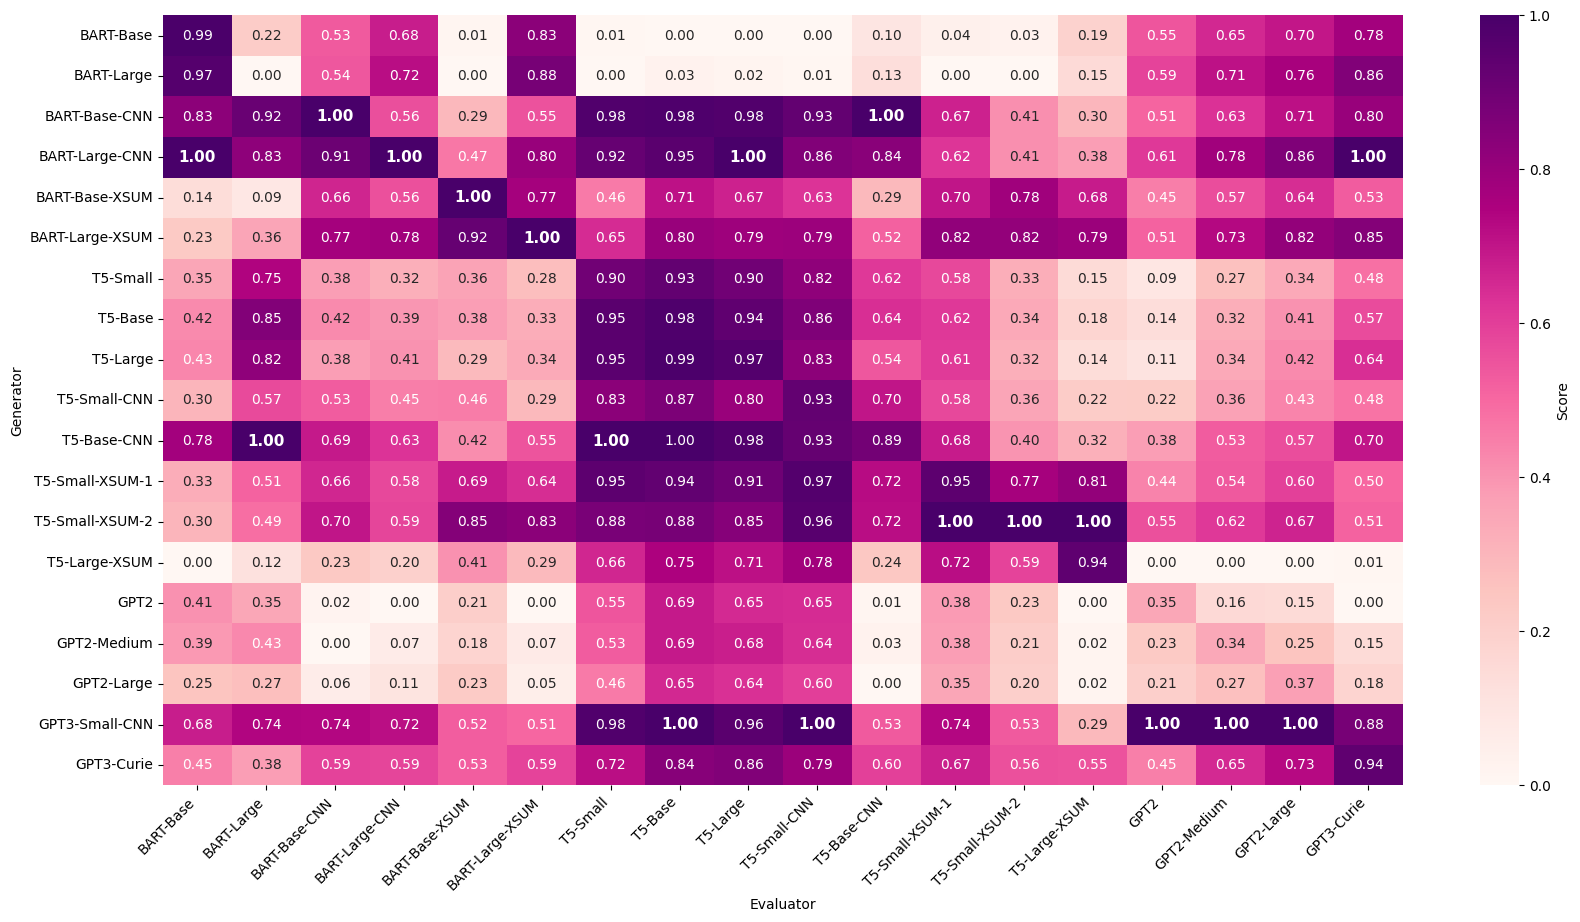
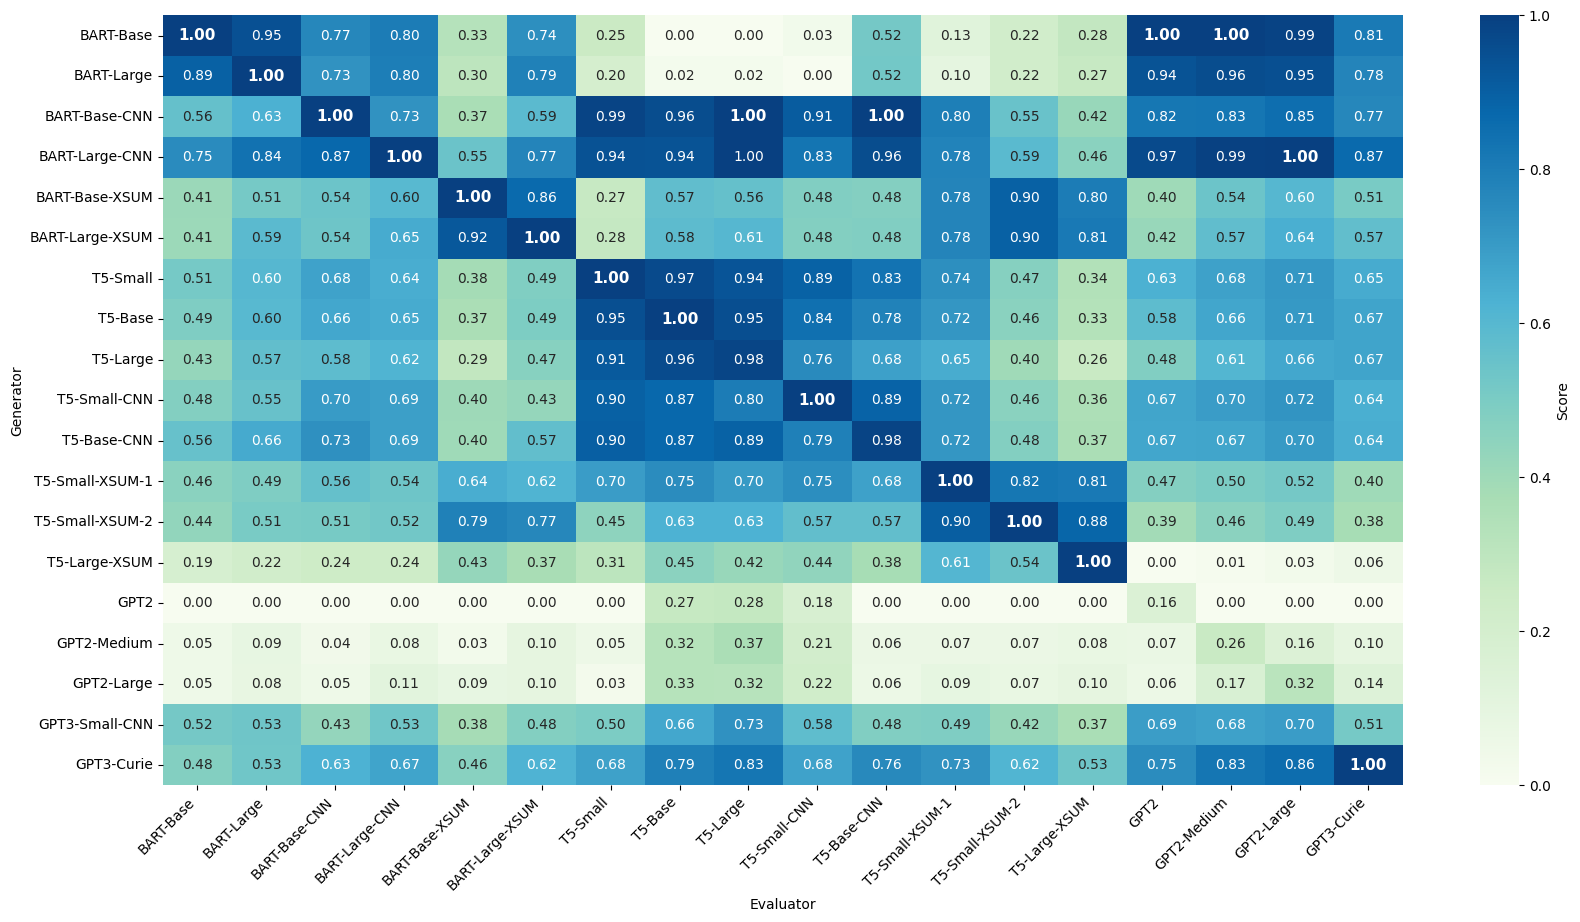
Figure 2 and Figure 3 display heatmaps presenting evaluator scores888The scores are computed by averaging the individual scores of the selected 500 documents. for various summaries generated by different generators from CNN/DM documents. In both heatmaps, we observe darker cells along the diagonal line, running from the top left to the bottom right. This indicates potential evaluator bias towards their corresponding generator models. However, this bias is notably more pronounced in the reference-free setting, commonly used for factuality evaluation (Koh et al. 2022). In this context, we highlight the presence of the darkest cells along the diagonal line.
Furthermore, as shown in Figure 2, we note a distinct trend: T5-based generators, whether fine-tuned or not, tend to receive higher scores when assessed using different T5Score variations compared to evaluations using BARTScore or GPTScore. This results in a concentrated dark rectangle at the heatmap’s center. Notably, this pattern differs for T5 generators and evaluators that are fine-tuned on XSUM. Similarly, we observe a parallel trend for GPT-based generators, whether fine-tuned or not. When evaluated with various GPTScore variations, they consistently receive higher scores compared to BARTScore or T5Score evaluations.999We observe the same pattern on summaries generated based XSUM documents. The corresponding heatmap is included in Figure 7 in the Appendix B.1.
4.2 Bias towards longer summaries
A notable exception in Figure 2 is the high scores for the BART-based generators, indicated by both BARTScore variants and different GPTScores. To further investigate this phenomenon, we calculated the average length of summaries generated by each generator for each of the datasets. The average lengths for each generator are shown in Figure 6. Notably, BART models that have not been fine-tuned for summarization tend to produce the longest summaries on average. This is followed by the fine-tuned BART models on the CNN dataset. Conversely, models fine-tuned on XSUM generate the shortest summaries.101010Note that the XSUM dataset contains one-sentence summaries.
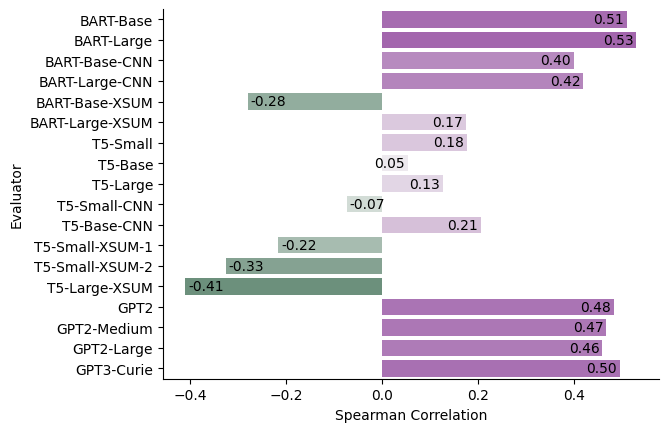
Subsequently, we computed the Spearman correlation between the scores given by each of our examined evaluators and the length of the corresponding summary. The results are presented in Figure 6. Based on these results, with the exception of evaluators fine-tuned on XSUM, BARTScore and GPTScore variants tend to assign higher scores to longer summaries. This observation explains the darker squares positioned in the top-left and top-right corners of Figure 2 for BARTScore and GPTScore variants, highlighting their inclination to assign higher scores to BART and BART-CNN generators that produce longer summaries. It is worth noting that this correlation with summary length is only prominent within the reference-free setting. We do not observe the same pattern in the reference-based evaluations, as shown in Figure 3.
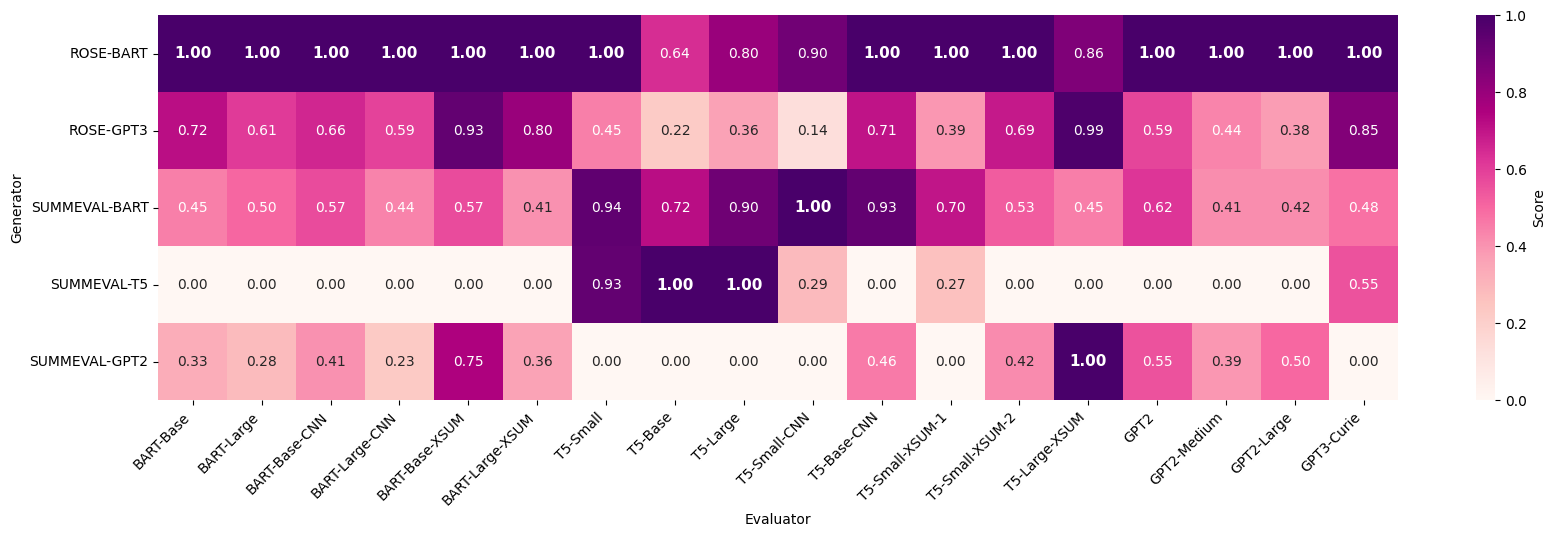
4.3 Qualitative Analysis: Correlation of Bias with Human Evaluation
To further verify the same model bias, we repeat the experiments from § 4.1 on summarization benchmarks that are accompanied by human evaluations. While the number of summaries in these benchmarks is limited compared to those in § 4.1, we can use the human annotations to verify that the inflated scores are not correlated with human evaluations.
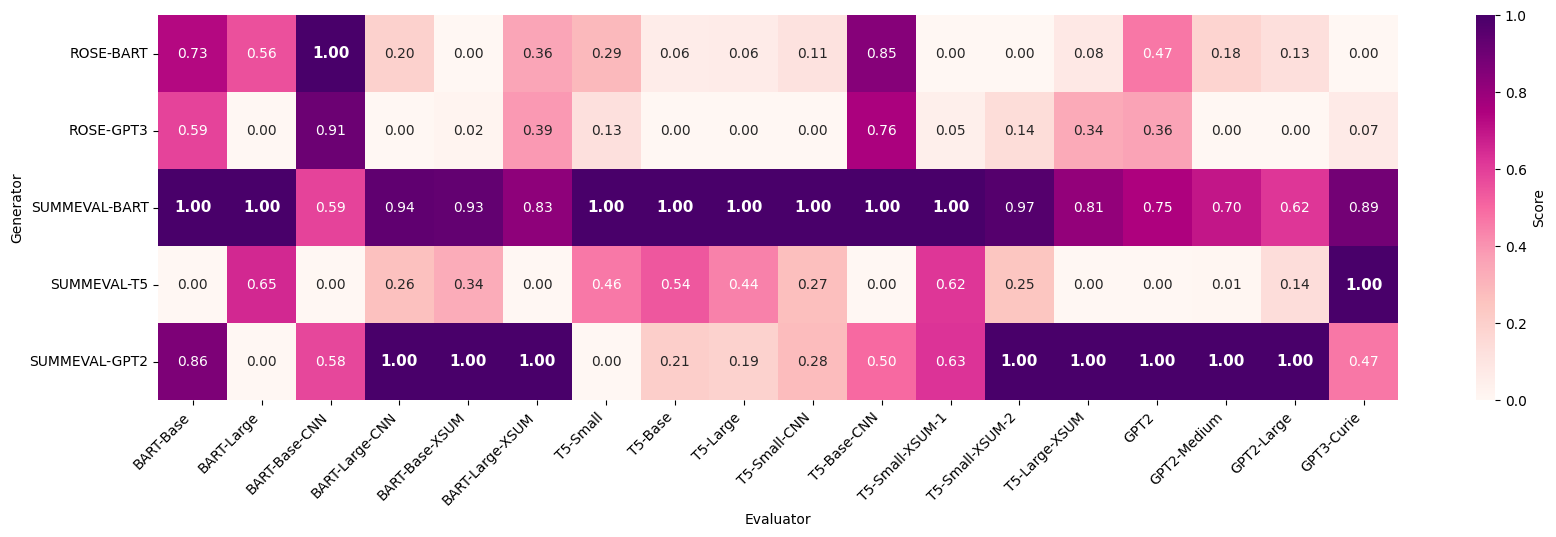
Figure 5 shows the evaluation results for the RoSE and SummEval benchmarks for the reference-free setting where we observed more a prominent bias.111111The corresponding heatmap for the reference-based setting is included in the Appendix. Overall, we observe a trend similar to that shown in Figure 2. For instance, the T5-base generator receives higher scores based on T5-based evaluators,121212In SummEval, the T5 model is only ranked higher when evaluated with certain variants of the T5Score. while BART-based models receive higher scores from both BARTScore and GPTScore evaluators.
| Evaluator | SummEval - Reference-free | |
|---|---|---|
| Spearman | Kendall | |
| BART-Base | 0.023 | 0.010 |
| BART-Large | 0.120 | 0.082 |
| BART-Base-CNN | 0.240 | 0.164 |
| BART-Large-CNN | 0.227 | 0.149 |
| BART-Base-XSUM | 0.081 | 0.055 |
| BART-Large-XSUM | 0.061 | 0.043 |
| T5-Small | 0.396 | 0.275 |
| T5-Base | 0.365 | 0.249 |
| T5-Large | 0.337 | 0.236 |
| T5-Small-CNN | 0.448 | 0.315 |
| T5-Base-CNN | 0.259 | 0.172 |
| T5-Small-XSUM-1 | 0.387 | 0.273 |
| T5-Small-XSUM-2 | 0.235 | 0.167 |
| T5-Large-XSUM | 0.110 | 0.081 |
| GPT2 | 0.153 | 0.107 |
| GPT2-Medium | 0.207 | 0.146 |
| GPT2-Large | 0.183 | 0.128 |
| GPT3-Curie | 0.326 | 0.228 |
For human correlations, We use the RoSE and SummEval benchmark for evaluating the correlation in the reference-based and reference-free setting respectively. Table 1 present the Spearman and Kendall correlation values of SummEval under the setting of reference-free. 131313The reference-based values for RoSE are included in the Appendix.B Overall, we observe that none of the evaluators have a strong correlation with the human annotations on either of these benchmarks. Due to the limited size of the samples and the absence of many of our investigated generators in § 4.1, we cannot draw a conclusive conclusion from the correlation values. Nevertheless, these results demonstrate that none of these evaluators highly correlate with human annotations, and as observed in § 4.1, their inflated scores for their own underlying generator may contribute to this low correlation.
5 Conclusions
Based on experiments, we make the following conclusions:
First, the popularity of generator-based metrics, such as BARTScore, is on the rise for evaluating the factual accuracy of generated content—a critical concern in modern generator models. However, our results reveal that this evaluation approach is susceptible to the same model bias, highlighting the need for more robust metrics to assess factual correctness reliably.
Second, our analysis indicates that models fine-tuned on the XSUM dataset are not suitable for direct integration into evaluators due to their bias towards shorter summaries. The exception is their use for evaluating summaries aligned with XSUM-style content.
Third, notably, similar to traditional evaluation metrics (Sun et al. 2019), contemporary evaluation metrics might also lean towards favoring longer summaries. This bias should be considered when interpreting and applying these metrics.
Fourth, our study uncovers the presence of the same model bias across all evaluated evaluators. Consequently, we recommend avoiding the use of the same underlying model as the generator under assessment. Although the limited human evaluations for our examined models prevent definitive conclusions on selecting the best generative evaluator, our research charts a promising direction for designing more resilient and unbiased evaluation metrics.
In summary, our study identifies a new type of bias in generative evaluators encouraging future research in this direction for designing fairer evaluation metrics.
References
- Amplayo et al. (2022) Amplayo, R. K.; Liu, P. J.; Zhao, Y.; and Narayan, S. 2022. SMART: Sentences as Basic Units for Text Evaluation. ArXiv, abs/2208.01030.
- Bhandari et al. (2020) Bhandari, M.; Gour, P. N.; Ashfaq, A.; Liu, P.; and Neubig, G. 2020. Re-evaluating Evaluation in Text Summarization. In Proceedings of the 2020 Conference on Empirical Methods in Natural Language Processing (EMNLP), 9347–9359. Online: Association for Computational Linguistics.
- Brown et al. (2020) Brown, T.; Mann, B.; Ryder, N.; Subbiah, M.; Kaplan, J. D.; Dhariwal, P.; Neelakantan, A.; Shyam, P.; Sastry, G.; Askell, A.; et al. 2020. Language models are few-shot learners. Advances in neural information processing systems, 33: 1877–1901.
- Deutsch, Dror, and Roth (2022) Deutsch, D.; Dror, R.; and Roth, D. 2022. On the Limitations of Reference-Free Evaluations of Generated Text. In Goldberg, Y.; Kozareva, Z.; and Zhang, Y., eds., Proceedings of the 2022 Conference on Empirical Methods in Natural Language Processing, 10960–10977. Abu Dhabi, United Arab Emirates: Association for Computational Linguistics.
- Deutsch and Roth (2021) Deutsch, D.; and Roth, D. 2021. Understanding the Extent to which Content Quality Metrics Measure the Information Quality of Summaries. In Proceedings of the 25th Conference on Computational Natural Language Learning, 300–309. Online: Association for Computational Linguistics.
- Durmus, Ladhak, and Hashimoto (2022) Durmus, E.; Ladhak, F.; and Hashimoto, T. 2022. Spurious Correlations in Reference-Free Evaluation of Text Generation. In Muresan, S.; Nakov, P.; and Villavicencio, A., eds., Proceedings of the 60th Annual Meeting of the Association for Computational Linguistics (Volume 1: Long Papers), 1443–1454. Dublin, Ireland: Association for Computational Linguistics.
- Fabbri et al. (2021) Fabbri, A. R.; Kryściński, W.; McCann, B.; Xiong, C.; Socher, R.; and Radev, D. 2021. SummEval: Re-evaluating Summarization Evaluation. Transactions of the Association for Computational Linguistics, 9: 391–409.
- Freedman, Pisani, and Purves (2007) Freedman, D.; Pisani, R.; and Purves, R. 2007. Statistics: Fourth International Student Edition. Emersion: Emergent Village Resources for Communities of Faith Series. W.W. Norton & Company. ISBN 9780393930436.
- Fu et al. (2023) Fu, J.; Ng, S.-K.; Jiang, Z.; and Liu, P. 2023. GPTScore: Evaluate as You Desire. arXiv:2302.04166.
- Gehrmann et al. (2021) Gehrmann, S.; Adewumi, T.; Aggarwal, K.; Ammanamanchi, P. S.; Aremu, A.; Bosselut, A.; Chandu, K. R.; Clinciu, M.-A.; Das, D.; Dhole, K.; Du, W.; Durmus, E.; Dušek, O.; Emezue, C. C.; Gangal, V.; Garbacea, C.; Hashimoto, T.; Hou, Y.; Jernite, Y.; Jhamtani, H.; Ji, Y.; Jolly, S.; Kale, M.; Kumar, D.; Ladhak, F.; Madaan, A.; Maddela, M.; Mahajan, K.; Mahamood, S.; Majumder, B. P.; Martins, P. H.; McMillan-Major, A.; Mille, S.; van Miltenburg, E.; Nadeem, M.; Narayan, S.; Nikolaev, V.; Niyongabo Rubungo, A.; Osei, S.; Parikh, A.; Perez-Beltrachini, L.; Rao, N. R.; Raunak, V.; Rodriguez, J. D.; Santhanam, S.; Sedoc, J.; Sellam, T.; Shaikh, S.; Shimorina, A.; Sobrevilla Cabezudo, M. A.; Strobelt, H.; Subramani, N.; Xu, W.; Yang, D.; Yerukola, A.; and Zhou, J. 2021. The GEM Benchmark: Natural Language Generation, its Evaluation and Metrics. In Proceedings of the 1st Workshop on Natural Language Generation, Evaluation, and Metrics (GEM 2021), 96–120. Online: Association for Computational Linguistics.
- Hermann et al. (2015) Hermann, K. M.; Kocisky, T.; Grefenstette, E.; Espeholt, L.; Kay, W.; Suleyman, M.; and Blunsom, P. 2015. Teaching machines to read and comprehend. Advances in neural information processing systems, 28.
- Honovich et al. (2021) Honovich, O.; Choshen, L.; Aharoni, R.; Neeman, E.; Szpektor, I.; and Abend, O. 2021. : Evaluating Factual Consistency in Knowledge-Grounded Dialogues via Question Generation and Question Answering. In Moens, M.-F.; Huang, X.; Specia, L.; and Yih, S. W.-t., eds., Proceedings of the 2021 Conference on Empirical Methods in Natural Language Processing, 7856–7870. Online and Punta Cana, Dominican Republic: Association for Computational Linguistics.
- Kamoi, Goyal, and Durrett (2023) Kamoi, R.; Goyal, T.; and Durrett, G. 2023. Shortcomings of Question Answering Based Factuality Frameworks for Error Localization. arXiv:2210.06748.
- Koh et al. (2022) Koh, H. Y.; Ju, J.; Zhang, H.; Liu, M.; and Pan, S. 2022. How Far are We from Robust Long Abstractive Summarization? In Proceedings of the 2022 Conference on Empirical Methods in Natural Language Processing, 2682–2698. Abu Dhabi, United Arab Emirates: Association for Computational Linguistics.
- Lewis et al. (2020) Lewis, M.; Liu, Y.; Goyal, N.; Ghazvininejad, M.; Mohamed, A.; Levy, O.; Stoyanov, V.; and Zettlemoyer, L. 2020. BART: Denoising Sequence-to-Sequence Pre-training for Natural Language Generation, Translation, and Comprehension. In Proceedings of the 58th Annual Meeting of the Association for Computational Linguistics, 7871–7880. Online: Association for Computational Linguistics.
- Lin (2004) Lin, C.-Y. 2004. ROUGE: A Package for Automatic Evaluation of Summaries. In Text Summarization Branches Out, 74–81. Barcelona, Spain: Association for Computational Linguistics.
- Liu et al. (2022) Liu, Y.; Fabbri, A. R.; Liu, P.; Zhao, Y.; Nan, L.; Han, R.; Han, S.; Joty, S.; Wu, C.-S.; Xiong, C.; et al. 2022. Revisiting the Gold Standard: Grounding Summarization Evaluation with Robust Human Evaluation. arXiv preprint arXiv:2212.07981.
- Liu et al. (2023) Liu, Y.; Iter, D.; Xu, Y.; Wang, S.; Xu, R.; and Zhu, C. 2023. G-Eval: NLG Evaluation using GPT-4 with Better Human Alignment. arXiv:2303.16634.
- Mathur, Baldwin, and Cohn (2020) Mathur, N.; Baldwin, T.; and Cohn, T. 2020. Tangled up in BLEU: Reevaluating the Evaluation of Automatic Machine Translation Evaluation Metrics. In Jurafsky, D.; Chai, J.; Schluter, N.; and Tetreault, J., eds., Proceedings of the 58th Annual Meeting of the Association for Computational Linguistics, 4984–4997. Online: Association for Computational Linguistics.
- Nallapati et al. (2016) Nallapati, R.; Zhou, B.; dos Santos, C.; Gulcehre, C.; and Xiang, B. 2016. Abstractive Text Summarization using Sequence-to-sequence RNNs and Beyond. In Proceedings of The 20th SIGNLL Conference on Computational Natural Language Learning, 280. Association for Computational Linguistics.
- Narayan, Cohen, and Lapata (2018) Narayan, S.; Cohen, S. B.; and Lapata, M. 2018. Don’t Give Me the Details, Just the Summary! Topic-Aware Convolutional Neural Networks for Extreme Summarization. In Proceedings of the 2018 Conference on Empirical Methods in Natural Language Processing, 1797–1807. Brussels, Belgium: Association for Computational Linguistics.
- Papineni et al. (2002) Papineni, K.; Roukos, S.; Ward, T.; and Zhu, W.-J. 2002. Bleu: a Method for Automatic Evaluation of Machine Translation. In Proceedings of the 40th Annual Meeting of the Association for Computational Linguistics, 311–318. Philadelphia, Pennsylvania, USA: Association for Computational Linguistics.
- Peyrard (2019) Peyrard, M. 2019. Studying Summarization Evaluation Metrics in the Appropriate Scoring Range. In Korhonen, A.; Traum, D.; and Màrquez, L., eds., Proceedings of the 57th Annual Meeting of the Association for Computational Linguistics, 5093–5100. Florence, Italy: Association for Computational Linguistics.
- Qin et al. (2022) Qin, Y.; Yuan, W.; Neubig, G.; and Liu, P. 2022. T5Score: Discriminative Fine-tuning of Generative Evaluation Metrics. arXiv:2212.05726.
- Radford et al. (2019) Radford, A.; Wu, J.; Child, R.; Luan, D.; Amodei, D.; Sutskever, I.; et al. 2019. Language models are unsupervised multitask learners. OpenAI blog, 1(8): 9.
- Raffel et al. (2020) Raffel, C.; Shazeer, N.; Roberts, A.; Lee, K.; Narang, S.; Matena, M.; Zhou, Y.; Li, W.; and Liu, P. J. 2020. Exploring the limits of transfer learning with a unified text-to-text transformer. The Journal of Machine Learning Research, 21(1): 5485–5551.
- Reiter and Belz (2009) Reiter, E.; and Belz, A. 2009. An Investigation into the Validity of Some Metrics for Automatically Evaluating Natural Language Generation Systems. Computational Linguistics, 35(4): 529–558.
- Scialom et al. (2021) Scialom, T.; Dray, P.-A.; Lamprier, S.; Piwowarski, B.; Staiano, J.; Wang, A.; and Gallinari, P. 2021. QuestEval: Summarization Asks for Fact-based Evaluation. In Proceedings of the 2021 Conference on Empirical Methods in Natural Language Processing, 6594–6604. Online and Punta Cana, Dominican Republic: Association for Computational Linguistics.
- Sellam, Das, and Parikh (2020) Sellam, T.; Das, D.; and Parikh, A. 2020. BLEURT: Learning Robust Metrics for Text Generation. In Jurafsky, D.; Chai, J.; Schluter, N.; and Tetreault, J., eds., Proceedings of the 58th Annual Meeting of the Association for Computational Linguistics, 7881–7892. Online: Association for Computational Linguistics.
- Sun et al. (2019) Sun, S.; Shapira, O.; Dagan, I.; and Nenkova, A. 2019. How to Compare Summarizers without Target Length? Pitfalls, Solutions and Re-Examination of the Neural Summarization Literature. In Proceedings of the Workshop on Methods for Optimizing and Evaluating Neural Language Generation, 21–29. Minneapolis, Minnesota: Association for Computational Linguistics.
- van der Lee et al. (2019) van der Lee, C.; Gatt, A.; van Miltenburg, E.; Wubben, S.; and Krahmer, E. 2019. Best practices for the human evaluation of automatically generated text. In Proceedings of the 12th International Conference on Natural Language Generation, 355–368. Tokyo, Japan: Association for Computational Linguistics.
- Yuan, Neubig, and Liu (2021) Yuan, W.; Neubig, G.; and Liu, P. 2021. BARTScore: Evaluating Generated Text as Text Generation. Advances in Neural Information Processing Systems, 34: 27263–27277.
- Zar (2014) Zar, J. H. 2014. Spearman Rank Correlation: Overview. John Wiley & Sons, Ltd. ISBN 9781118445112.
- Zhang et al. (2020) Zhang, T.; Kishore, V.; Wu, F.; Weinberger, K. Q.; and Artzi, Y. 2020. BERTScore: Evaluating Text Generation with BERT. In International Conference on Learning Representations.
- Zhao et al. (2019) Zhao, W.; Peyrard, M.; Liu, F.; Gao, Y.; Meyer, C. M.; and Eger, S. 2019. MoverScore: Text Generation Evaluating with Contextualized Embeddings and Earth Mover Distance. In Proceedings of the 2019 Conference on Empirical Methods in Natural Language Processing and the 9th International Joint Conference on Natural Language Processing (EMNLP-IJCNLP), 563–578. Hong Kong, China: Association for Computational Linguistics.
- Zhong et al. (2022) Zhong, M.; Liu, Y.; Yin, D.; Mao, Y.; Jiao, Y.; Liu, P.; Zhu, C.; Ji, H.; and Han, J. 2022. Towards a Unified Multi-Dimensional Evaluator for Text Generation. In Proceedings of the 2022 Conference on Empirical Methods in Natural Language Processing, 2023–2038. Abu Dhabi, United Arab Emirates: Association for Computational Linguistics.
Appendix A Evaluation Setting
| Max | Min | Mean | Median | |
| RoSE-BART | 1.00 | 0.00 | 0.37 | 0.38 |
| RoSE-GPT3 | 0.90 | 0.00 | 0.27 | 0.25 |
| SummEval-BART | 5.00 | 2.67 | 4.56 | 4.67 |
| SummEval-T5 | 5.00 | 2.33 | 4.46 | 4.67 |
| SummEval-GPT2 | 5.00 | 1.33 | 3.52 | 3.33 |
As illustrated in Table 2, the distribution of human annotations in RoSE and SummEval are distinct since different criteria are applied to assess the quality of the text.
A.1 Generator
Further information about models utilized in our generation models including checkpoint names, prompt setting, etc., are presented in Table 3.
| Name of Generator | Name of Checkpoint or Model | Suffix | Prefix |
|---|---|---|---|
| BART-Base | facebook/bart-base | ✗ | Summarize: |
| BART-Large | facebook/bart-large | ✗ | Summarize: |
| BART-Base-CNN | ainize/bart-base-cnn | ✗ | ✗ |
| BART-Large-CNN | facebook/bart-large-cnn | ✗ | ✗ |
| BART-Base-XSUM | morenolq/bart-base-xsum | ✗ | ✗ |
| BART-Large-XSUM | facebook/bart-large-xsum | ✗ | ✗ |
| T5-Small | t5-small | ✗ | Summarize: |
| T5-Base | t5-base | ✗ | Summarize: |
| T5-Large | t5-large | ✗ | Summarize: |
| T5-Small-CNN | ubikpt/t5-small-finetuned-cnn | ✗ | ✗ |
| T5-Base-CNN | flax-community/t5-base-cnn-dm | ✗ | ✗ |
| T5-Small-XSUM-1 | adasnew/t5-small-xsum | ✗ | ✗ |
| T5-Small-XSUM-2 | pki/t5-small-finetuned_xsum | ✗ | ✗ |
| T5-Large-XSUM | sysresearch101/t5-large-finetuned-xsum | ✗ | ✗ |
| GPT2 | gpt2 | TL;DR: | ✗ |
| GPT2-Medium | gpt2-medium | TL;DR: | ✗ |
| GPT2-Large | gpt2-large | TL;DR: | ✗ |
| GPT3-Small-CNN | minhtoan/gpt3-small-finetune-cnndaily-news | ✗ | ✗ |
| GPT3-Curie | text-curie-001 | TL;DR: | ✗ |
A.2 Evaluator
Further information about models utilized in our evaluation models are presented in Table 4.
| Name of Evaluator | Name of Checkpoint or Model | Suffix | Prefix |
|---|---|---|---|
| BART-Base | facebook/bart-base | ✗ | Summarize: |
| BART-Large | facebook/bart-large | ✗ | Summarize: |
| BART-Base-CNN | ainize/bart-base-cnn | ✗ | ✗ |
| BART-Large-CNN | facebook/bart-large-cnn | ✗ | ✗ |
| BART-Base-XSUM | morenolq/bart-base-xsum | ✗ | ✗ |
| BART-Large-XSUM | facebook/bart-large-xsum | ✗ | ✗ |
| T5-Small | t5-small | ✗ | Summarize: |
| T5-Base | t5-base | ✗ | Summarize: |
| T5-Large | t5-large | ✗ | Summarize: |
| T5-Small-CNN | ubikpt/t5-small-finetuned-cnn | ✗ | ✗ |
| T5-Base-CNN | flax-community/t5-base-cnn-dm | ✗ | ✗ |
| T5-Small-XSUM-1 | adasnew/t5-small-xsum | ✗ | ✗ |
| T5-Small-XSUM-2 | pki/t5-small-finetuned_xsum | ✗ | ✗ |
| T5-Large-XSUM | sysresearch101/t5-large-finetuned-xsum | ✗ | ✗ |
| GPT2 | gpt2 | TL;DR: | ✗ |
| GPT2-Medium | gpt2-medium | TL;DR: | ✗ |
| GPT2-Large | gpt2-large | TL;DR: | ✗ |
| GPT3-Curie | text-curie-001 | TL;DR: | ✗ |
Appendix B Evaluation Results
B.1 Reference-free Setting
Heatmaps of Bias Experiments on XSUM Dataset in Reference-free Setting is shown in Figure 7.
B.2 Reference-based Setting
Evaluation scores for RoSE and SummEval benchmarks under the reference-based setting are illustrated by Figure 8.
For the meta evaluation, spearman and Kendall correlation values in the reference based setting for RoSE benchmark are shown in Table 5.
| Evaluator | RoSE - Reference-based | |
|---|---|---|
| Spearman | Kendall | |
| BART-Base | 0.454 | 0.310 |
| BART-Large | 0.298 | 0.218 |
| BART-Base-CNN | 0.488 | 0.345 |
| BART-Large-CNN | 0.468 | 0.329 |
| BART-Base-XSUM | 0.150 | 0.103 |
| BART-Large-XSUM | 0.371 | 0.253 |
| T5-Small | 0.396 | 0.284 |
| T5-Base | 0.395 | 0.285 |
| T5-Large | 0.392 | 0.282 |
| T5-Small-CNN | 0.393 | 0.281 |
| T5-Base-CNN | 0.391 | 0.276 |
| T5-Small-XSUM-1 | 0.388 | 0.279 |
| T5-Small-XSUM-2 | 0.379 | 0.269 |
| T5-Large-XSUM | 0.462 | 0.324 |
| GPT2 | 0.375 | 0.255 |
| GPT2-Medium | 0.357 | 0.244 |
| GPT2-Large | 0.353 | 0.242 |
| GPT3-Curie | 0.310 | 0.214 |