Chemodynamical study of two CEMP-no stars from the Hamburg/ESO Survey ††thanks: Based on data collected using Mercator/HERMES
Abstract
The Carbon-Enhanced Metal-Poor (CEMP) stars with no enhancement of neutron-capture elements, the so-called CEMP-no stars are believed to be the direct descendants of first-generation stars and provide a unique opportunity to probe the early Galactic nucleosynthesis. We present a detailed chemical and kinematic analysis for two extremely metal-poor stars HE12432408 and HE00380345 using high-resolution (R86,000) HERMES spectra. For the object HE12432408, we could make a detailed comparison with the available literature values; however, only limited information is available for the other object HE00380345. Our estimated metallicity for these two objects are 3.05 and 2.92 respectively. With estimated [C/Fe] (1.03 and 1.05) and [Ba/Fe] (0.18 and 0.11) respectively, the objects are found to be bonafide CEMP-no stars. From the observed abundances of C, Na, Mg, and Ba (i.e., A(C), A(Na), A(Mg), A(Ba)), the objects are found to belong to Group II CEMP-no stars. A detailed abundance profile analysis indicates that the objects are accreted from dSph satellite galaxies that support hierarchical Galaxy assembly. Further, our analysis shows that the progenitors of the stars are likely Pop II Core-Collapse Supernovae. The object HE00380345 is found to be a high-energy, prograde, outer-halo object, and HE12432408 is found to be a high-energy, retrograde, inner-halo object. Our detailed chemodynamical analysis shows that HE12432408 is related to I’itoi structure, where as HE00380345 is likely related to Sgr or GSE events. The mass of the progenitor galaxies of the program stars inferred from their dynamics is at par with their likely origin in massive dSph galaxies.
keywords:
stars: carbon - stars: Abundances - stars: chemically peculiar - stars: individual - stars: kinematics and dynamics1 Introduction
The CEMP-no stars, a sub-class of Carbon-Enhanced Metal-Poor (CEMP) stars with enhanced carbon abundance and no signatures of heavy neutron-capture elements, are the most chemically primitive objects presently known (Norris & Yong, 2019; Yoon et al., 2020). These stars occupy the lowest metallicity tail ([Fe/H]3) of the Metallicity Distribution Function (MDF) of the Galaxy (Yong et al., 2013; de Bennassuti et al., 2017; Yoon et al., 2019; Norris & Yong, 2019), and their fraction increases with decreasing metallicity, constituting 20% of very metal-poor stars ([Fe/H]2), 40% of extremely metal-poor stars ([Fe/H]3), and 75% of ultra metal-poor stars ([Fe/H]4) (Frebel et al., 2006; Carollo et al., 2012; Lee et al., 2013; Placco et al., 2014; Banerjee et al., 2018). Among the fourteen known CEMP stars with [Fe/H]4.5, twelve stars belong to the CEMP-no group, and they might have been formed a few million years after the Big Bang (Norris & Yong, 2019). They are formed from the ejecta of the first-generation, massive, short-lived Pop III stars (Frebel et al., 2008; Nomoto et al., 2013; Spite et al., 2013; Placco et al., 2014; Choplin et al., 2017; Ezzeddine et al., 2019). The indirect studies of the formation and nucleosynthesis pathways of the first stars, and their contribution to the early chemical enrichment of the Universe, can be achieved through the analysis of chemical imprints of their direct descendants, the CEMP-no stars (Hansen et al., 2016a; Yoon et al., 2019). Hence, the CEMP-no stars are important probes in studies of Galactic archaeology that aims to understand the nature of the first generation stars, the associated nucleosynthesis, the early star formation and galaxy formation, and early Galactic chemical evolution etc. (Frebel & Norris, 2015; Bonifacio et al., 2015; Hansen et al., 2016a; Yoon et al., 2020). Further, these stars are expected to shed light on the physical processes resulting in the transitions from massive Pop III stars to normal Pop II stars (Salvadori et al., 2007; Hartwig et al., 2015; de Bennassuti et al., 2017).
Different scenarios have been suggested by various authors for the origin of CEMP-no stars (Hansen et al. 2015, Yoon et al. 2016 and references there in), however, the exact origin of these stars still remains unknown. According to some authors, the CEMP-no stars are generally single stars, suggesting an intrinsic origin, ie, formed from a pre-enriched natal cloud of ISM (Spite et al., 2013; Starkenburg et al., 2014; Bonifacio et al., 2015; Hansen et al., 2016b; Yoon et al., 2016). The suggested progenitors for the CEMP-no stars include: (i) faint supernovae that underwent mixing and fall back. Due to the low explosion energy, such SNe could not expel all the synthesized element. Only the light elements such as C, N, O, Na, Mg, Al, and Si are released to the ISM (Umeda & Nomoto, 2003, 2005; Tominaga et al., 2014), (ii) extremely metal-poor fast rotating massive stars or spinstars that enriched the ISM with C, N, and O through strong stellar winds (Meynet et al., 2006; Frischknecht et al., 2012; Maeder & Meynet, 2015; Choplin et al., 2017), and (iii) i-process in massive Pop III stars (Clarkson et al., 2018). In addition to these scenarios, Arentsen et al. (2019) suggested that the binary mass-transfer from extremely metal-poor AGB companion stars in the past might explain at least a few of the CEMP-no stars among the confirmed binary CEMP-no objects. If the binary-mass-transfer scenario holds true for the origin of CEMP-no stars, this will help to understand extremely metal-poor AGB stars and provide robust observational constraints to the AGB nucleosynthesis and mass-transfer models for metallicity [Fe/H]2.
The differences in the morphology of CEMP-no stars on the Yoon - Beers diagram (A(C) - [Fe/H] diagram) leading to two distinct groups, Group II and Group III CEMP-no stars, suggest multiple formation pathways for them (Yoon et al., 2016). In addition to these two groups of CEMP-no stars, a few of the CEMP-no stars ( 15%) are found to lie in the high-carbon region that is typically occupied by CEMP-s and CEMP-r/s stars (Group I), known as Group I CEMP-no stars. However, these CEMP-no stars show larger [Sr/Ba] values than those in the Group I CEMP-s and CEMP-r/s stars (Norris & Yong, 2019). Eight objects among these Group I CEMP-no stars are confirmed binaries (Yoon et al. 2016, Arentsen et al. 2019 and references therein). Similarity in the morphology of the Yoon - Beers diagram for the CEMP-no stars in the Galactic halo and dwarf satellite galaxies suggested that the halo CEMP-no stars are accreted from the mini halos (Bonifacio et al., 2015; Yoon et al., 2018, 2019; Yoon et al., 2020). Additional spectroscopic studies of Group I, Group II, and Group III CEMP-no stars in both the Galaxy and its satellite galaxies are required to better constrain their origin, and hence the nature of first stars. In addition to this, such studies will help us to improve our understanding of Galactic assembly and Galactic halo formation. Further study is required to investigate what fraction of these anomalous Group I CEMP-no stars are binaries, and also to explain the origin of binary CEMP-no stars with low carbon abundance.
Several cosmological simulations are in accordance with the hierarchical Galactic halo assembly through numerous complex mergers (eg., Deason et al. 2013; Pillepich et al. 2014; Amorisco 2017). The highly structured nature of the Galactic halo points at an accretion origin. This has simulated several high- and medium-resolution spectroscopic studies of different samples (Myeong et al., 2019; Naidu et al., 2020; Woody & Schlaufman, 2021; Aguado et al., 2021; Malhan et al., 2022; Zepeda et al., 2023), and large-scale surveys (eg., GALAH; Buder et al. 2018). Based on high-precision data from the Gaia Satellite, these studies identified various structures arising from the clustering of satellite galaxies, stellar streams, and globular clusters in the dynamic (Energy - Action) space, and attempted to uncover the Milky Way mergers. These structures in various chemical and dynamical planes, along with the observations of r-process stars in the halo, revealed the signatures of remnants of dwarf satellite galaxies accreted in the past by the Galaxy, and unambiguously confirmed the importance of accretion for its formation (Myeong et al., 2018; Roederer et al., 2018; Dietz et al., 2020; Helmi, 2020; Woody & Schlaufman, 2021; Malhan et al., 2022; Naidu et al., 2022; Zepeda et al., 2023; Frebel & Ji, 2023). It has been shown that the massive progenitor dwarf galaxies (M⋆ 108 - 109 M⊙) contribute primarily to the accreted halo, with sub-dominant contributions from the low-mass satellite galaxies (Dietz et al., 2020; Naidu et al., 2020). Major massive dwarf satellite galaxy accretions that built the Galactic halo are Gaia-Sausage-Enceladus (GSE; Helmi et al. 2018; Belokurov et al. 2018), Kraken/Koala/Heracles (Kruijssen et al., 2019; Forbes, 2020; Pfeffer et al., 2021; Horta et al., 2021), and Sequoia (Myeong et al., 2019; Matsuno et al., 2019). These events happened 10 Gyrs ago at red-shifts z2, with more than 50% of the halo stars in the solar neighbourhood coming from the GSE (Helmi et al., 2018; Kruijssen et al., 2019; Frebel & Ji, 2023). Besides these major mergers, several other numerous minor accretions (both massive and low-mass) like Aleph, Arjuna, I’itoi, Wukong/LMS-1 (Naidu et al., 2020), Thamnos (Koppelman et al., 2019) etc. have contributed to the Galactic halo.
Although it is known that numerous dwarf satellite galaxy accretions led to the formation of the present-day Milky Way halo, our understanding of this process is still lacking, particularly in terms of the total number of mergers, their dynamical characteristics, and their contributions to various stellar populations of the halo (Malhan et al., 2022; Frebel & Ji, 2023). Since many metal-poor stars in the halo trace their origin to the dwarf satellite galaxies (Frebel & Norris, 2015; Frebel & Ji, 2023), they are ideal tools to study the Galactic halo assembly. Based on the kinematic, chemical, and dynamical properties of a sample of 644 CEMP stars, Zepeda et al. (2023) have shown that the CEMP-no stars are not in-situ to the Galaxy, but were originally born in satellite galaxies that were accreted and disrupted by the Milky Way. This is also on par with the findings of Yoon et al. (2019). Several authors have discussed the relevance and scope of enhancing medium- and high-resolution spectroscopic studies of different sub-groups of CEMP-no stars to further our understanding of early Galactic chemical evolution and Galactic halo formation (eg. Hansen et al. 2015, 2016c; Norris & Yong 2019; Yoon et al. 2019; Yoon et al. 2020; Zepeda et al. 2023). The stars that were accreted very early into the Galaxy still retain their original chemical composition and a few kinematic properties such as energy, action, and angular momentum (Frebel & Ji, 2023). Zepeda et al. (2023) have discussed the possibility of recovering the Galactic accretion events through a clustering approach, and matching the chemical, orbital, and kinematic properties of CEMP stars with each other. Along this line, we have conducted a high-resolution spectroscopic and chemodynamical analysis of two CEMP-no stars, HE 00380345 and HE 12432408, with the aim of deriving clues to their origin.
This paper is arranged as follows. A brief discussion on previous studies of the stellar sample is given section 2. Section 3 describes the method of sample selection, data acquisition and data reduction. Estimation of radial velocity is given in section 4, followed by the description of stellar atmospheric parameter estimation and mass determination in section 5. Section 6 provides procedures adopted for abundance determination. Abundance uncertainty is given in section 7. A detailed discussion on the abundance pattern and the progenitors of the program stars is presented in section 8. Kinematic analysis of the sample is given in section 9. A detailed discussion on the orbital and various dynamical properties of the program stars in the Galaxy is also provided in this section. In section 10, we have discussed our chemodynamical analysis to assign the stars to known accretion structures of Milky Way. Finally, the conclusions are summarized in section 11.
2 Previous studies on the program stars: a brief summary
Based on an analysis of medium-resolution spectra ( 2 Å ) obtained with 2 - 4 m class telescopes, Frebel et al. (2006) derived metallicity of the program stars as 2.86 and 2.88 for HE 00380345 and HE 12432408 respectively, and carbon abundance with respect to iron [C/Fe], as 0.3 and 0.13 respectively. Their classification as metal-poor stars were determined by applying a selection procedure taking account the strength of the Ca II K line as a function of the metallicity and the effective temperature. The strength of Ca II K line is measured following the procedure in Beers (1999) by means of the line index KP, a pseudo-equivalent width measurement in Å. Ca II K line is known as the strongest metal absorption line in the optical wavelength range. The optical photometry by Beers et al. (2007) gave BV = 0.767 with E(B-V) = + 0.043 for the object HE 00380345. Beers et al. (2017) also derived the metallicity [Fe/H] and carbonicity [C/Fe] of these objects as (2.51, 0.76) and (2.65, 0.75) for HE 00380345 and HE 12432408 respectively, based on medium-resolution spectral analysis, and classified them as CEMP-no stars. The wavelength regions used as inputs to the n-SSPP (non-SEGUE Stellar Parameter Pipeline) for determination of the parameters span a range of 3600 - 4400 Å, 3600 - 4800 Å, or 3600 - 5250 Å.
Using spectral synthesis calculations, Holmbeck et al. (2020) derived the metallicity [Fe/H] ( 2.53) and abundances of C, Sr, Ba, and Eu for the object HE 00380345, based on a snap-shoot high-resolution spectrum of HE 0038-0345 at a resolution30,000 with a SNR30. While carbon is found to be mildly enhanced with [C/Fe] = 0.46, Sr and Ba are found below solar with [Sr/Fe] = 0.16 and [Ba/Fe] = 0.49. The abundance of Eu is however found as near-solar with [Eu/Fe] = 0.12. The object is classified as a non-RPE (no r-process enhancement) star (Holmbeck et al., 2020). Our estimates of effective temperature and surface gravity match closely with those of Holmbeck et al. (2020) within the error limits. However, we got lower values for the micro-turbulent velocity (1.43 km s-1) and metallicity (0.39 dex) compared to them.
Among the Fe I and II lines used for stellar atmospheric parameter determination, four Fe I lines 4889.74, 5339.93, 5393.17, 5586.76 Å, and one Fe II line 4520.224 Å are common with those used by Holmbeck et al. (2020). In Holmbeck et al. (2020), the measured equivalent widths of these Fe I lines are almost double, and that of the Fe II line is almost 7 times as large as that measured by us. Besides, among the 84 Fe I lines used by them, 26 lines are with excitation potentials, Elow 1.2 eV. In EMP stars, the Fe I lines with Elow 1.2 eV are affected by 3D hydrodynamic effects and show significant deviation from 1D (Tafelmeyer et al., 2010; Hayek et al., 2011; Dobrovolskas et al., 2013; Jablonka et al., 2015). The abundances estimated from these lines are shown to be over-estimated (Collet et al., 2007; Dobrovolskas et al., 2013; Mashonkina et al., 2017). For instance, in the analysis of Collet et al. (2007), in the Teff/log g/[Fe/H] 4858/2.2/3 model, the Fe I line with Elow = 0 eV gave an abundance 0.8 dex higher compared to the Fe I line with Elow = 4 eV, whereas Mashonkina et al. (2017) noted a difference of 0.36 dex, Dobrovolskas et al. (2013) noted 0.5 dex. Since 30% of the Fe I lines used by Holmbeck et al. (2020) are low Elow lines, the Fe abundance could likely be over-estimated.
Based on a VLT/UVES spectrum at resolution 40,000 and SNR130, Lombardo et al. (2022) have performed an analysis of the object HE 1243-2408, and presented the stellar atmospheric parameters and elemental abundances of 15 elements. Our estimates of stellar atmospheric parameters are lower compared to Lombardo et al. (2022); (Teff, log g, , [Fe/H]) (223 K, 0.95, 0.74 km s-1, 0.2). Though the analysis in both cases is based on 1D LTE, the adopted procedures and methodologies are different. The differences in the method of estimation of stellar atmospheric parameters and elemental abundances, differences in the choices of atomic data, solar abundance values, Fe partition functions etc. could affect the derived values (Roederer et al., 2018). While we have derived the stellar atmospheric parameters spectroscopically using the traditional excitation, ionization balances of Fe I – Fe II lines, Lombardo et al. (2022) used the Gaia EDR3 photometry and parallax values, following the procedure in Koch-Hansen et al. (2021). The micro-turbulent velocity is estimated using a calibration equation from Mashonkina et al. (2017). The micro-turbulent velocity estimated this way is shown to exhibit a discrepancy of 0.5 km s-1 from the spectroscopic value, reaching up-to a value of 0.7 km s-1 (Mashonkina et al., 2017). The analysis of Mucciarelli & Bonifacio (2020) has shown that the photometric estimates of atmospheric parameters are higher than the spectroscopic ones, and the deviation increases with decreasing metallicity. At [Fe/H]2.5, the photometric temperature and surface gravity are higher than the spectroscopic values by 350 K and 1.0 dex, respectively (Mucciarelli & Bonifacio, 2020). This is in agreement with the discrepancy observed in the estimates of Lombardo et al. (2022) and other studies in the literature. This could be likely due to the 3D and/or NLTE effects in the lower metallicity, which leads to the non-zero slope in the excitation potential and observed Fe abundances when using the photmetric temperature (Mucciarelli & Bonifacio, 2020; Koch-Hansen et al., 2021; Lombardo et al., 2022). However, current modelling of the giant stars incorporating these effects could not remove this slope completely (Mucciarelli & Bonifacio, 2020). Finally, the discrepancy in the estimates of stellar atmospheric parameters between our study and that of Lombardo et al. (2022) is reflected in the estimates of elemental abundances as well.
3 STELLAR Spectra: Object SELECTION, Observation AND DATA REDUCTION
The program stars, HE 00380345 and HE 12432408, are selected from the the catalog of bright (13 B 14.5) metal-poor candidates (Frebel et al., 2006) from the Hamburg/ESO Survey (HES). The high-resolution spectra of the objects were acquired using the High-Efficiency and high-Resolution Mercator Echelle Spectrograph (HERMES) attached to the 1.2m Mercator telescope at the Roque de los Muchachos Observatory in La Palma, Canary Islands, Spain (Raskin et al., 2011). The spectra cover the wavelength range 3770 - 9000 Å, and have resolution R86,000. For the object HE 00380345, three frames with exposures 2000, 700, and 1600 sec were taken on 10/12/2018, 29/01/2019, and 31/10/2019, respectively. In the case of HE 12432408, two frames of 1400 sec exposures were taken on 02/02/2019. The spectra were reduced using the HERMES pipeline. Multiple frames for each object are co-added after the Doppler correction, to enhance the S/N ratio. The co-added spectra are continuum fitted using IRAF (Image Reduction and Analysis Facility) software. The basic data of the program stars are given in Table 1. A small portion of the continuum-fitted, radial-velocity-corrected spectra of the stars are shown in Figure 1 as an example.
| Star | RA | Dec. | B | V | J | H | K | S/N | ||
|---|---|---|---|---|---|---|---|---|---|---|
| 4200 Å | 5500 Å | 7700 Å | ||||||||
| HE 00380345 | 00 41 09.29 | 03 28 59.51 | 11.99 | 11.30 | 9.886 | 9.419 | 9.293 | 15.08 | 58.67 | 74.86 |
| HE 12432408 | 12 45 53.85 | 24 25 02.42 | 11.66 | 10.97 | 9.075 | 8.551 | 8.434 | 13.55 | 56.41 | 65.01 |

4 Radial velocity
The radial velocities of the program stars are estimated from the measured shift in wavelengths of several clean and unblended spectral lines, using the standard procedure as discussed in Shejeelammal & Goswami (2022). The average of the radial velocities for each object corrected for heliocentric motion is taken as the radial velocity of the object. The detailed radial velocity data of the objects will be published in a summary paper (Jorissen et al., in preparation) on the orbits of CEMP stars. Our radial velocity estimates, along with those from Gaia DR3 (Gaia Collaboration et al., 2022) are presented in Table 2. Our radial velocity values for these two objects match quite closely with Gaia values.
5 STELLAR ATMOSPHERIC PARAMETERS
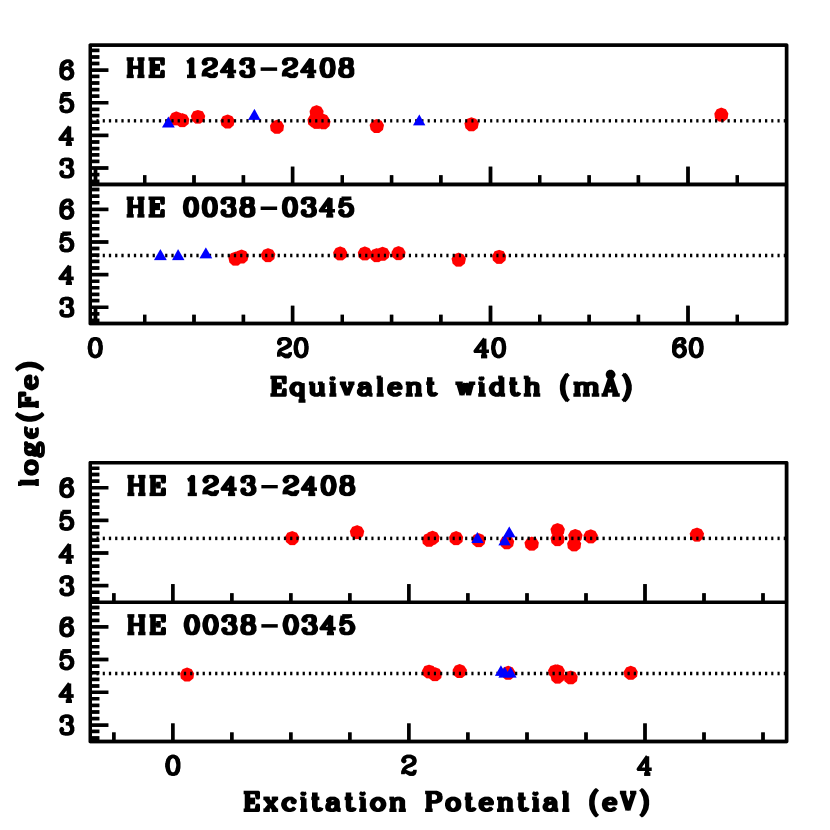
The stellar atmospheric parameters are derived using the standard excitation balance and ionization balance methods from a set of clean lines of Fe I and Fe II (Table 8). We performed the analysis under the assumption of local thermodynamic equilibrium (LTE), using the code MOOG (version 2013, Sneden 1973). The selected spectral lines have excitation potentials in the range 0 - 6 eV and equivalent widths in the range 5 - 180 mÅ. The model atmospheres are selected from the Kurucz grid of model atmospheres (Castelli & Kurucz 2003, http://kurucz.harvard.edu/grids.html). We have followed the detailed procedure for stellar atmospheric parameter estimation as discussed in our earlier papers Shejeelammal et al. (2020, 2021); Shejeelammal & Goswami (2021). By setting the slope of the estimated Fe I abundances with excitation potentials to zero, the effective surface temperature is obtained. The micro-turbulent velocity is then derived by establishing a zero trend between the abundances of Fe I lines and their reduced equivalent widths. Lastly, by adjusting its value until the abundances of the Fe I and Fe II lines coincide, the surface gravity is determined. To derive the final stellar atmospheric parameters, an iterative process is performed until these three conditions are simultaneously accomplished. The derived stellar atmospheric parameters of the stars, along with the literature values are given in Table 2. The iron abundances derived from different Fe I and Fe II lines are shown in Figure 2.
| Star | Teff | log g | [Fe I/H] | [Fe II/H] | Vr† | Vr | Reference | |
|---|---|---|---|---|---|---|---|---|
| (K) | cgs | (km s-1) | (km s-1) | (km s-1) | ||||
| 100 | 0.2 | 0.2 | (This work) | (Gaia DR3) | ||||
| HE 00380345 | 4830 | 1.75 | 0.78 | 2.920.07 | 2.920.03 | 43.660.05 | 44.420.84 | 1 |
| – | – | – | 2.86 | – | – | – | 2 | |
| 5010 | 1.82 | – | 2.51 | – | – | – | 3 | |
| 4898 | 1.78 | 2.21 | 2.53 | – | – | – | 4 | |
| HE 12432408 | 4800 | 1.40 | 0.98 | 3.050.12 | 3.050.12 | +213.610.03 | +213.220.21 | 1 |
| – | – | – | 2.88 | – | – | – | 2 | |
| 5293 | 2.13 | – | 2.65 | – | – | – | 3 | |
| 5023 | 2.35 | – | 2.85 | – | – | – | 5 |
The surface gravity of the program stars are estimated from the parallax method as well. The log g values are calculated using the equation log (g/g⊙)= log (M/M⊙) + 4 log (Teff/Teff⊙) - log (L/L⊙), where Teff⊙ = 5770 K, log g⊙ = 4.44, and Mbol⊙ = 4.74 mag (Bessell et al., 1998). The stellar masses are determined from the position on the H-R diagram. We have adopted the stellar evolutionary tracks of Girardi et al. (2000) to generate the H-R diagrams. The detailed procedure followed is discussed in Shejeelammal et al. (2020). The positions of the program stars on the H-R diagram are shown in Figure 3. We have used z = 0.0004 tracks for this H-R diagram. We could not estimate the mass of the star HE 12432408 since the evolutionary tracks corresponding to its luminosity and temperature are not available. The estimated mass of the object HE 00380345 is 0.600.05 M⊙ and the log g value is 1.68. The spectroscopic surface gravity value of this star match closely with that derived from the parallax method within 0.07 dex. We have adopted the spectroscopic surface gravity value for the analysis.

6 Abundance determination
Abundances of different elements are determined using the measured equivalent widths of spectral lines as well as the spectrum synthesis method. For the elements with hyper-fine splitting (HFS) as well as for molecular bands, we have used spectrum synthesis calculation. Different line parameters are taken from linemake (https://github.com/vmplacco/linemake) atomic and molecular line database (Placco et al., 2021). The abundances are estimated relative to solar values (Asplund et al., 2009). The NLTE corrections are applied to the derived elemental abundances wherever applicable. The derived elemental abundances of the program stars are given in Table 3. The lines used to derive the abundances are given in Tables 8 - 9.
| HE 00380345 | HE 12432408 | |||||||
|---|---|---|---|---|---|---|---|---|
| Z | solar log | log | [X/H] | [X/Fe] | log | [X/H] | [X/Fe] | |
| C (CH band 4315 Å)† | 6 | 8.43 | 6.43(syn) | 2.00 | 0.92 (1.05) | 5.95(syn) | 2.48 | 0.57 (1.03) |
| N (12CN band 4215 Å) | 7 | 7.83 | 7.83(syn) | 0.0 | 2.92 | 8.33(syn) | 0.5 | 3.55 |
| Na INLTE | 11 | 6.24 | 4.17 (syn)(2) | 2.07 | 0.85 | 3.620.09(syn)(2) | 2.62 | 0.43 |
| Na ILTE | 11 | 6.24 | 4.20 (syn)(2) | 2.04 | 0.88 | – | – | – |
| Mg I | 12 | 7.6 | 5.350.13(2) | 2.25 | 0.67 | 5.390.13(2) | 2.21 | 0.84 |
| Si I | 14 | 7.51 | 5.41(1) | 2.10 | 0.82 | – | – | – |
| Ca I | 20 | 6.34 | 3.890.19(5) | 2.45 | 0.47 | 3.600.09(5) | 2.74 | 0.31 |
| Sc II | 21 | 3.15 | – | – | – | 0.25(syn)(1) | 2.90 | 0.15 |
| Ti I | 22 | 4.95 | 2.560.15(3) | 2.39 | 0.53 | 2.340.15(3) | 2.61 | 0.44 |
| Ti II | 22 | 4.95 | 2.580.12(4) | 2.37 | 0.55 | 2.300.16(3) | 2.65 | 0.40 |
| Cr I | 24 | 5.64 | 2.830.20(2) | 2.81 | 0.11 | 2.480.07(4) | 3.16 | 0.11 |
| Fe I | 26 | 7.5 | 4.580.07(10) | 2.92 | - | 4.450.12(14) | 3.05 | - |
| Fe II | 26 | 7.5 | 4.580.03(3) | 2.92 | - | 4.450.12(3) | 3.05 | - |
| Ni I | 28 | 6.22 | 3.420.06(2) | 2.80 | 0.12 | 3.170.10(3) | 3.05 | 0.0 |
| Zn I | 30 | 4.56 | 2.20(1) | 2.36 | 0.56 | 1.88(1) | 2.68 | 0.37 |
| Sr II | 38 | 2.87 | 0.87(syn)(1) | 3.74 | 0.82 | – | – | – |
| Y II | 39 | 2.21 | 1.31(syn)(1) | 3.52 | 0.60 | 1.23(syn)(1) | 3.44 | 0.39 |
| Zr I | 40 | 2.58 | – | – | – | 0.58(syn)(1) | 3.16 | 0.11 |
| Ba II | 56 | 2.18 | 0.85(syn)(1) | 3.03 | 0.11 | 1.05(syn)(1) | 3.23 | 0.18 |
| Eu II | 63 | 0.52 | 1.82(syn)(1) | 2.34 | 0.58 | – | – | – |
Asplund et al. (2009), The number of lines used to derive the abundance are given in parenthesis.
NLTE refers to the abundance obtained after applying the NLTE correction.
† The values in the parenthesis for [C/Fe] are obtained after applying corrections for evolutionary effect.
6.1 Light elements: C, N, Na, -, and Fe-peak elements
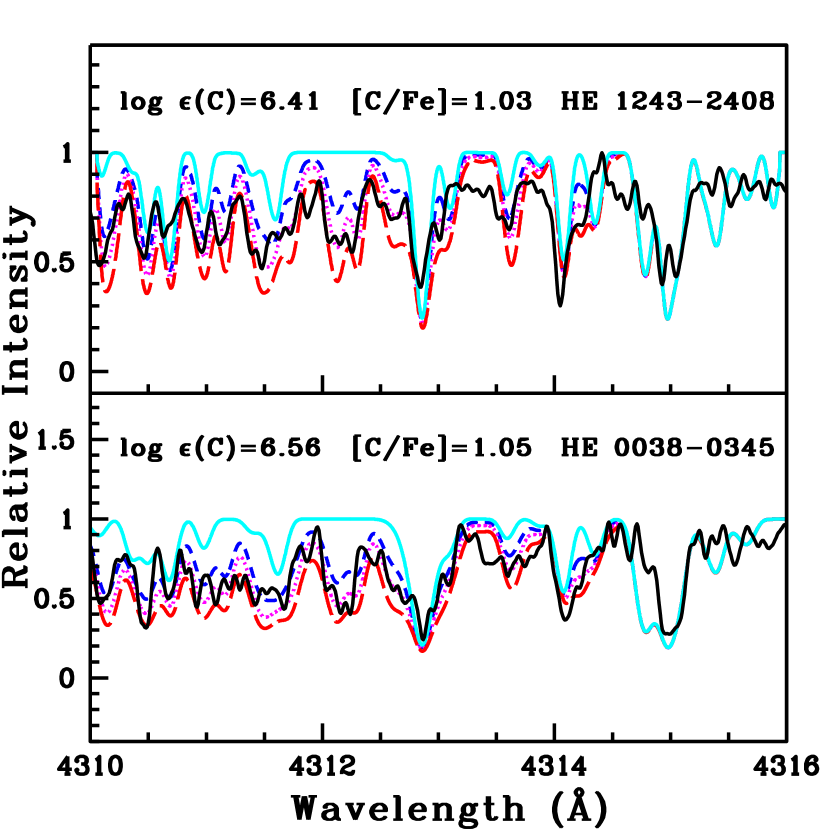
The carbon abundances are derived from the spectral synthesis calculation of CH G-band at 4315 Å. The derived [C/Fe] values with evolutionary corrections are 1.05 and 1.03 for HE 00380345 and HE 12432408, respectively. The other C2 molecular bands are very weak and marginally detectable in the program stars, and hence, could not be used for abundance analysis. The spectral synthesis fits for the CH band at 4315 Å are shown in Figure 4.
The nitrogen abundance is derived from the spectrum synthesis calculation of 12CN band at 4215 Å. Since this region of the spectra is noisy, the derived abundances are taken to be upper limits. Both the program stars show enhanced abundances of nitrogen with [N/Fe] values 2.92 in HE 00380345, and 3.55 in HE 12432408.
The sodium abundances are derived from the spectrum synthesis calculation of Na I 5889.951, 5895.924 Å lines. The NLTE corrections to the abundances derived from these lines are adopted from Andrievsky et al. (2007), which are 0.53 and 0.41 for HE 00380345 and HE 12432408, respectively. In HE 00380345, we could derive the abundance of sodium from Na I 5682.63 Å line as well. While the object HE 00380345 shows a large enhancement in Na with [Na/Fe]0.85, the object HE 12432408 shows a moderate enhancement with [Na/Fe]0.43.
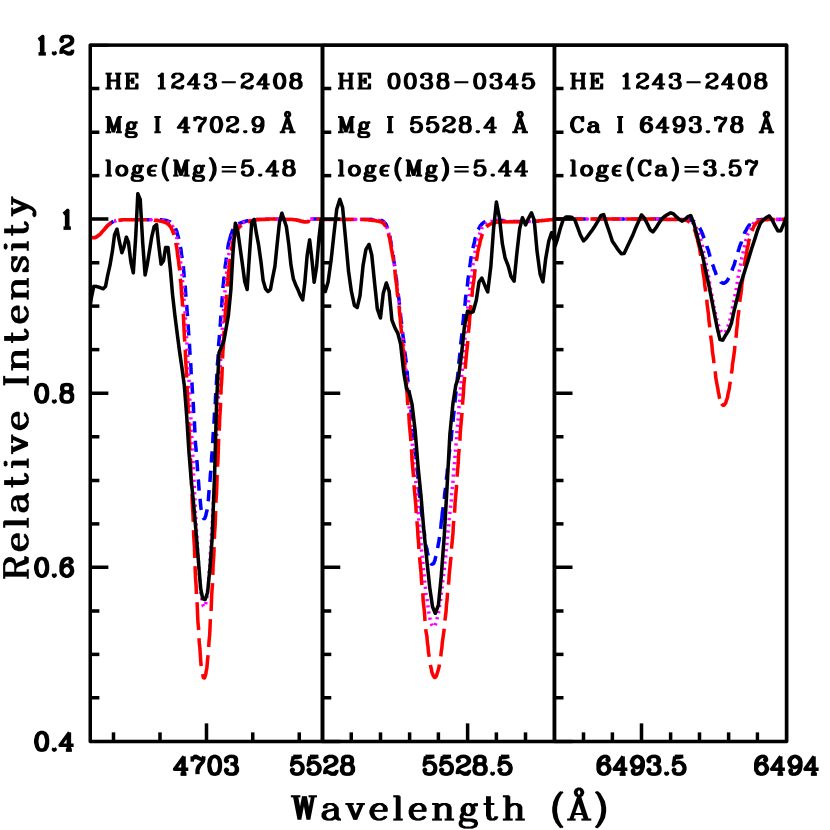
The abundances of Mg, Si, Ca, Ti, Cr, Ni, and Zn are derived from the measured equivalent widths of different spectral lines listed in Table 9. The abundance of magnesium is derived from the Mg I 4702.991, 5528.405 Å lines in both the program stars. While Mg is enhanced in HE 00380345 with [Mg/Fe]0.67, the object HE 12432408 shows [Mg/Fe]0.84. The Si I 5948.541 Å line is used to derive the silicon abundance in HE 00380345 and found to be enhanced with [Si/Fe]0.82. No good Si lines usable for the abundance determination could be found in HE 12432408. In both stars, five Ca I lines (Table 9) are used to derive the calcium abundances. While the object HE 00380345 shows an abundance of Ca with [Ca/Fe]0.47, the object HE 12432408 shows moderate enhancement with [Ca/Fe]0.31. The abundance of scandium could only be estimated in the object HE 12432408, where we have used the spectral synthesis calculation of Sc II 5526.79 Å line. Scandium shows a mild enhancement ([Sc/Fe]0.15) in this object. We could not estimate the Sc abundance in the star HE 00380345 as there are no good lines. Both program stars show moderate enhancement of Ti with values [Ti I/Fe]0.53 (HE 00380345) and 0.44 (HE 12432408). The abundance of Ti measured using Ti II lines also shows enhancement with [Ti II /Fe]0.40.
Chromium shows near-solar values in both the stars with [Cr/Fe]0.11 and 0.11 for HE 00380345 and HE 12432408 respectively. Nickel is also found to show near-solar values with [Ni/Fe]0.12 (HE 00380345) and [Ni/Fe]0.00 (HE 12432408). The Zn abundances are derived using the lines Zn I 4722.150 and 4810.530 Å for HE 00380345 and HE 12432408, respectively. Zinc is found to be moderately enhanced in both the objects with [Zn/Fe]0.56 and 0.37 respectively for HE 00380345 and HE 12432408. The spectral synthesis fits for the alpha elements Mg and Ca are shown in Figure 5.
6.2 Heavy elements
We have derived the abundances of heavy elements Sr, Y, Zr, Ba, and Eu in our program stars, whenever possible. The spectrum synthesis calculation is used for the abundance determination of all these elements. The Sr abundance could be determined only for HE 00380345 as there are no good lines of Sr detected in the spectra of the other object. The abundance of Sr derived using the Sr II 4215.519 Å line is found to be under-abundant in this object with [Sr/Fe]0.82. The yttrium abundance is derived from the Y II 5087.420 Å line in HE 00380345, and Y II 4883.684 Å line in HE 12432408. In the case of HE 00380345, we could only derive the upper limit to yttrium abundance. In both stars, yttrium is found to be under-abundant with values [Y/Fe]0.39. We could derive an upper limit to the Zr abundance in the object HE 12432408, where we have used Zr I 6134.999 Å line. Zirconium is found to be under-abundant in this object with [Zr/Fe]0.11. The abundance of barium is derived in both the program stars. We have used Ba II 6141.7 Å line in HE 00380345, and Ba II 6496.9 Å line in HE 12432408. Ba is found to be under-abundant with values [Ba/Fe]0.11 (HE 00380345) and 0.18 (HE 12432408). We have derived an upper limit to the Eu abundance in HE 00380345. The europium abundance is derived from the Eu II 6645.07 Å line which returned a value [Eu/Fe]0.58 for this object.
7 ABUNDANCE UNCERTAINTIES
The uncertainty in the elemental abundances are calculated using the
procedure discussed in Shejeelammal et al. (2020).
The uncertainty in the elemental abundances as a result of the uncertainties in the
stellar atmospheric parameters are calculated using,
= + + + +
The uncertainties in the atmospheric parameters (’s) are
(Teff, log g, , [Fe/H]) (100 K, 0.2, 0.2 km s-1, 0.1).
The partial derivatives () in the above equation are evaluated by changing the parameters
by an amount equal to their respective uncertainties.
The line-to-line scatter, standard deviation (), of the abundances of a
specific element species determined from N number of lines gives rise to the random error
in elemental abundance, which is calculated as = .
The cumulative uncertainty on the abundance of an element (say X) is computed from,
= +
The uncertainty on [X/Fe] of each element is calculated in the specific case of HE 00380345. Since Sc II and Zr I could not be detected in this object, we used HE 12432408 to calculate the uncertainty in the abundances of these two elements. Table 4 gives the calculated uncertainty on [X/Fe], , of each element.
| Element | Teff | log g | [Fe/H] | ||
|---|---|---|---|---|---|
| (100 K) | (0.2 dex) | (0.2 km s-1) | (0.1 dex) | ||
| C | 0.20 | 0.02 | 0.00 | 0.00 | 0.23 |
| N | 0.30 | 0.06 | 0.02 | 0.00 | 0.32 |
| Na I | 0.05 | 0.01 | 0.00 | 0.00 | 0.12 |
| Mg I | 0.06 | 0.02 | 0.02 | 0.00 | 0.15 |
| Si I | 0.04 | 0.00 | 0.00 | 0.00 | 0.11 |
| Ca I | 0.07 | 0.02 | 0.03 | 0.01 | 0.14 |
| Sc II | 0.05 | 0.05 | 0.03 | 0.00 | 0.13 |
| Ti I | 0.13 | 0.02 | 0.02 | 0.00 | 0.19 |
| Ti II | 0.04 | 0.07 | 0.02 | 0.01 | 0.14 |
| Cr I | 0.13 | 0.03 | 0.08 | 0.01 | 0.21 |
| Fe I | 0.10 | 0.00 | 0.01 | 0.00 | – |
| Fe II | 0.03 | 0.09 | 0.01 | 0.03 | – |
| Ni I | 0.07 | 0.00 | 0.00 | 0.00 | 0.13 |
| Zn I | 0.03 | 0.03 | 0.02 | 0.00 | 0.11 |
| Sr II | 0.13 | 0.05 | 0.08 | 0.02 | 0.19 |
| Y II | 0.05 | 0.06 | 0.01 | 0.01 | 0.13 |
| Zr I | 0.06 | 0.00 | 0.05 | 0.02 | 0.13 |
| Ba II | 0.07 | 0.06 | 0.04 | 0.01 | 0.14 |
| Eu II | 0.05 | 0.07 | 0.03 | 0.01 | 0.14 |
8 abundance analysis and discussion
The two objects analyzed in this study, HE 00380345 and HE 12432408, are found to be extremely metal-poor stars with [Fe/H]3. The observed nitrogen abundances in them are [N/Fe] 2.92 (HE 00380345) and 3.55 (HE 12432408). The neutron-capture elements are found to be under abundant ( 0.1) in both the objects. The stars on the Red-Giant Branch (RGB) undergo internal mixing and hence alters the surface CN abundances (eg. Aoki et al. 2007; Gratton et al. 2000; Spite et al. 2006; Placco et al. 2014). Based on the analysis of a sample of 505 metal-poor ([Fe/H] 2) stars with no enhancement of neutron-capture elements from the literature, Placco et al. (2014) shown that the frequency of CEMP-no stars ([C/Fe] 0.7) in the Galaxy is increased by 11% for [Fe/H] 3, when proper correction required for the carbon depletion is applied to the observed [C/Fe].
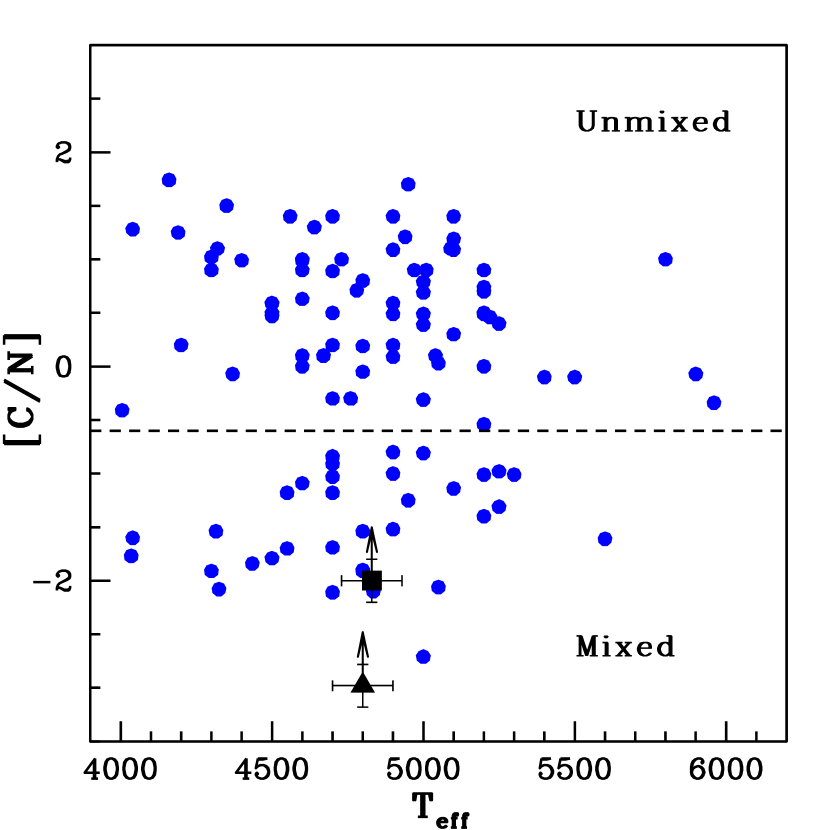
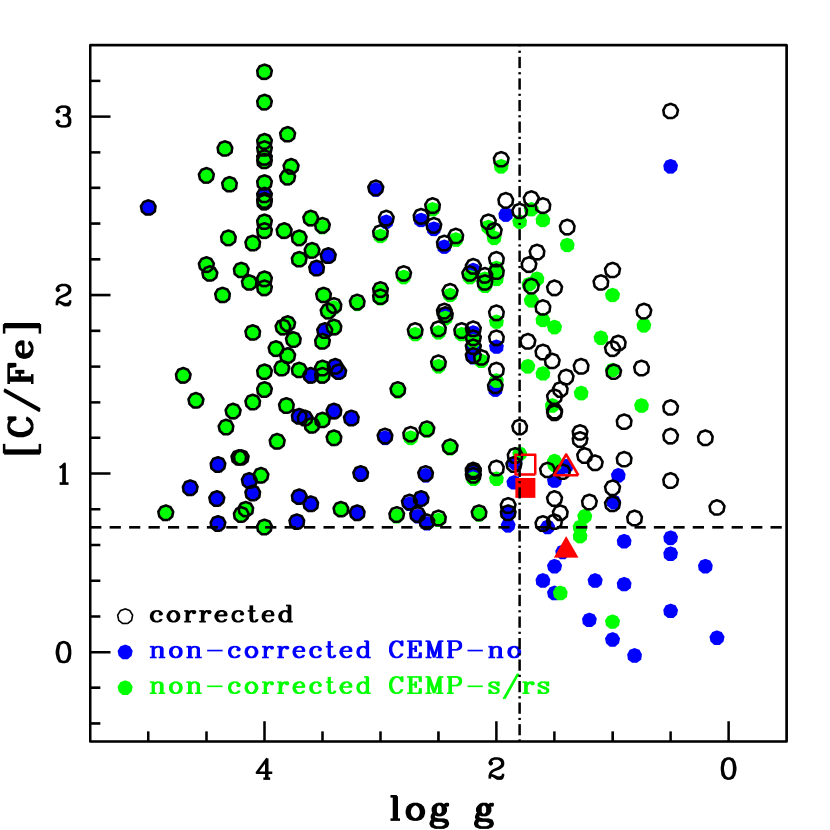
Since both our program stars are giants (Figure 3 and Table 2), it is likely that the stars have undergone internal mixing, altering the surface CN composition (Spite et al., 2005; Placco et al., 2014). We have checked the [C/N] ratio, an indicator of mixing, of the program stars as discussed in Spite et al. (2005). The plot of [C/N] ratio with respect to effective temperature of the program stars is shown in Figure 6. The [C/N] values of other known CEMP stars are also plotted in the same figure, for a comparison. From the figure, it is clear that both program stars are mixed, with [C/N]0.6 (Spite et al., 2005). Since CEMP-no stars are important objects for studying the first stellar populations and the Initial Mass Function (IMF), the identification of genuine CEMP-no stars is crucial. Hence, we have applied the necessary evolutionary correction to the observed carbon abundance values in order to take account of any extra mixing on the giant branch that could have altered the carbon abundance. The corrections to the carbon abundances are calculated using the online tool publicly available at http://vplacco.pythonanywhere.com/, developed by Placco et al. (2014). The calculated correction factors are +0.13 and +0.46 respectively for HE 00380345 and HE 12432408, and the final corrected [C/Fe] values for them are 1.05 and 1.03. The observed and corrected [C/Fe] values of the program stars, along with other CEMP stars from Placco et al. (2014) are plotted in Figure 7. As we can see from this figure, for log g 1.8, compared to CEMP-s and CEMP-r/s stars, a larger number of CEMP-no stars lie below [C/Fe] 0.7, even closer to [C/Fe] 0. The amount of carbon depleted are noticeably larger for lower surface gravities ( 1.8), and all the stars in this region are brought to [C/Fe] 0.7 when corrected for the mixing. With the corrected [C/Fe] values ( 1) and [Ba/Fe] values ( 0), our program stars are found to belong to CEMP-no classification (Beers & Christlieb, 2005).
Since the program stars are enhanced in nitrogen, we have examined if the stars are Nitrogen-Enhanced Metal-Poor (NEMP) star candidates. The NEMP stars are those with [N/Fe] 1 and [C/N] 0.5, according to Johnson et al. (2007). They generally show enhancement of s-process elements in addition to nitrogen and are mostly found at [Fe/H] 2.9. Binary mass transfer from intermediate-mass AGB stars with hot-bottom burning (HBB; M 5 M⊙) are suggested to be the origin of these class of stars (Johnson et al., 2007; Pols et al., 2012; Simpson & Martell, 2019). At lower metallicities ( 2.3), the stars of lower masses ( 3 M⊙) could experience HBB, and hence the same mechanism that produce CEMP-s stars would produce NEMP stars as well (Johnson et al., 2007; Pols et al., 2012). However, they are rare and only 15 NEMP stars were identified till date (Pols et al., 2012; Simpson & Martell, 2019). Four out of these 15 objects show no evidence of s-element enhancement, similar to CEMP-no stars. According to Komiya et al. (2007), the binary mass transfer from low metallicity AGB stars ([Fe/H] 2.5) with masses in the range 3.5 - 6 M⊙ could produce CEMP-no stars. In such a scenario, NEMP stars with no s-element enhancement are expected to be formed through the same process of mass-transfer that would produce CEMP-no stars (Pols et al., 2012). We found that the program stars satisfy the conditions [N/Fe] 1 and [C/N] 0.5 to be NEMP stars. According to the definitions of CEMP and NEMP stars, they tend to overlap partially (some CEMP stars show [N/Fe] 1 and [C/N] 0.5), and the internal mixing on RGB could lead to the misinterpretation of CEMP stars as NEMP stars (Pols et al., 2012). In the study of Pols et al. (2012), among the 24 NEMP candidates identified according to the above definition, ten objects are found to be internally mixed true CEMP stars on RGB. So, though the program stars follow the definition of NEMP stars, based on the discussion in the previous paragraph and from Figures 6 and 7, we conclude that our objects are bonafide CEMP-no stars.
Detailed abundance profile analysis of the program stars and the interpretation are presented in the following sub-sections.
8.1 Carbon abundances and location of the program stars on the Yoon - Beers A(C) - [Fe/H] diagram
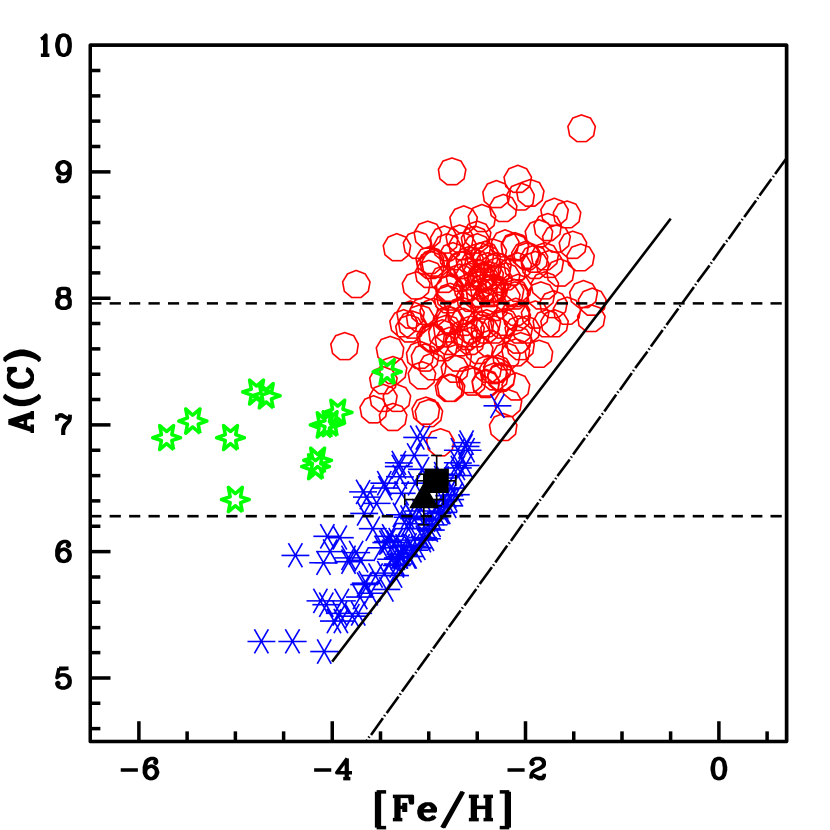
The identification and further studies on the existence of two carbon plateaus of CEMP stars in the distribution of absolute carbon abundance A(C) versus metallicity [Fe/H] point at the likelihood of different mechanisms for the production of carbon in CEMP stars (Spite et al., 2013; Hansen et al., 2015; Bonifacio et al., 2015; Yoon et al., 2016). According to the extended literature compilation performed by Yoon et al. 2016, the two plateaus are at carbon abundance values A(C)7.96 and 6.28. Their analysis have further shown that different classes of CEMP stars exhibit different morphology on the A(C) - [Fe/H] diagram, and based on the morphology the stars are classified into three groups. In this plot, the high-carbon band is occupied by the CEMP-s and CEMP-r/s stars, with a wide scatter in A(C) at any given [Fe/H]. The stars in this band is referred as Group I stars. They show a very weak trend of A(C) with respect to [Fe/H]. The CEMP-no stars that occupy the low-carbon band exhibit two distinct behaviours. One sub-set (5[Fe/H]2.5) shows a clear dependence of A(C) on [Fe/H], referred as Group II stars, and another sub-set with no clear dependence of A(C) on [Fe/H], referred as Group III stars. Different morphology of the three groups of CEMP stars led to the interpretation that these stars have different origin. The radial velocity studies of different CEMP stars have shown that stars in the low-carbon band (CEMP-no) are generally single stars and those in the high-carbon band (CEMP-s and CEMP-r/s) are generally binaries. Hence, binary mass-transfer from a companion AGB star is supported as the origin of CEMP-s and CEMP-r/s stars (Starkenburg et al., 2014; Bonifacio et al., 2015). The exact origin of CEMP-no stars has not been clearly understood yet, however, it is inferred that they are born from a natal cloud polluted by massive Pop III stars (Cooke & Madau, 2014; Frebel & Norris, 2015; Norris et al., 2013).
The locations of our program stars on the A(C) - [Fe/H] diagram, along with other CEMP stars from the literature, are shown in the Figure 8. The carbon abundances corrected for the evolutionary effect are used in this plot. As it is clear from the Figure 8, the two program stars fall in the region of Group II CEMP-no stars. Radial velocity studies of the program stars are not available in the literature. However, our estimated radial velocities are similar to those listed in the Gaia. This may indicate that these stars are likely single, but not conclusively.
In the following sections we have discussed the possible progenitors of the program stars based on a detailed analysis of their abundance patterns.
8.2 Analysis of abundance patterns observed in the program stars and comparison with the literature
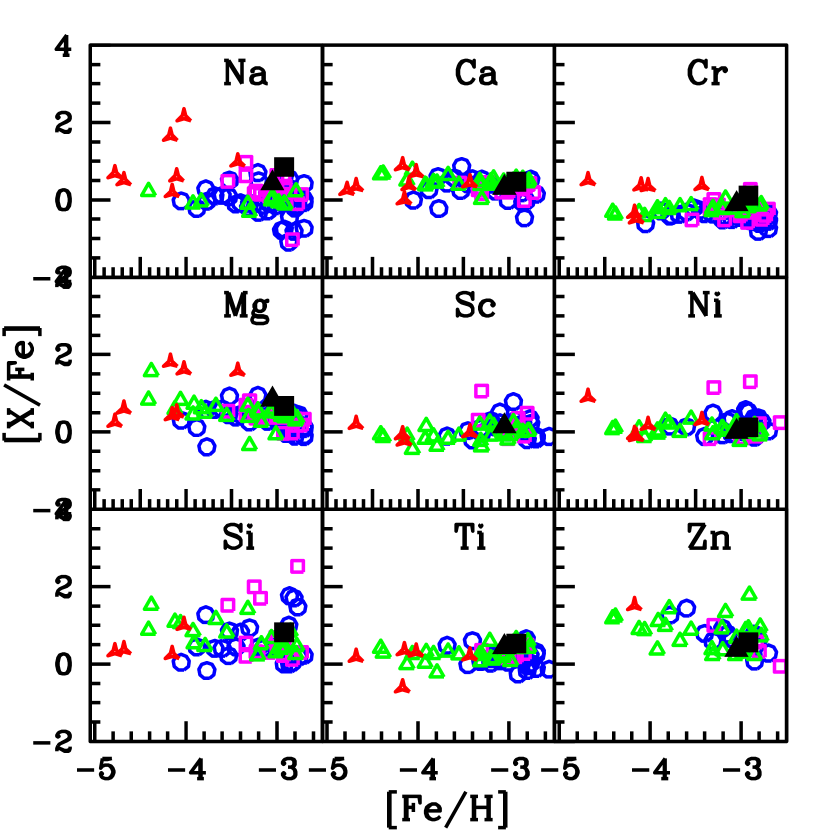
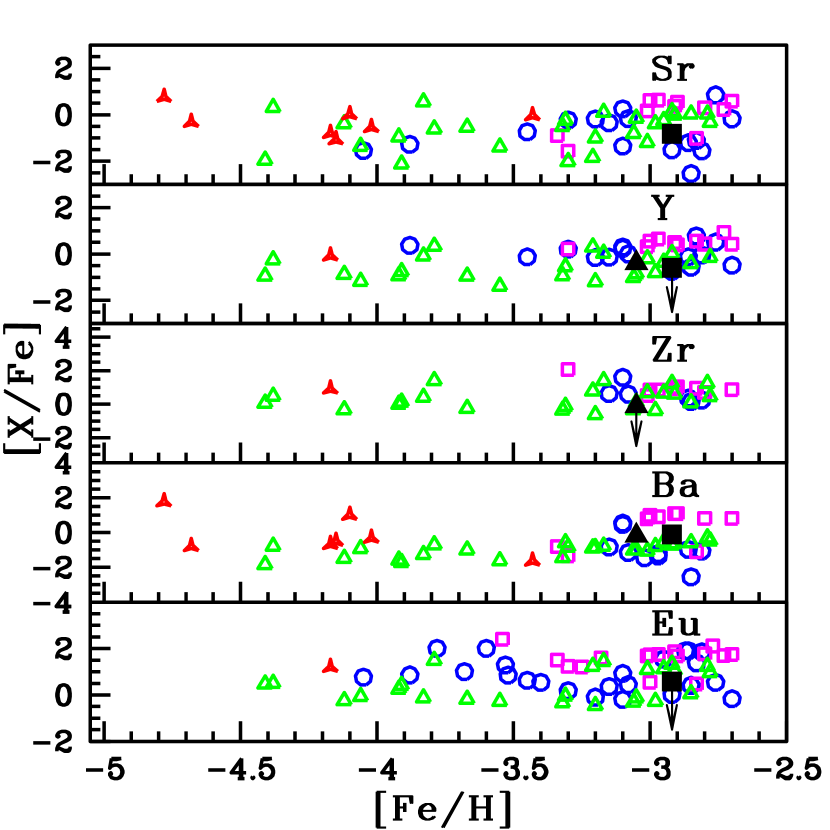
The observed abundances of different elements in the program stars are compared with those in other CEMP-no stars and EMP stars from the literature. These comparisons are shown in Figure 9. The estimated elemental abundances in the program stars match closely with the abundances of elements in other extremely metal-poor stars. Both program stars show enhancement of N, Na, and Mg. HE 00380345 show enhancement of Si as well, while Si abundance is not available for HE 12432408. These elements are found to be over abundant in majority of extremely metal-poor stars, indicating the signatures of first star nucleosynthesis (Aoki et al., 2002; Nomoto et al., 2013; Roederer et al., 2014; Aoki et al., 2018).
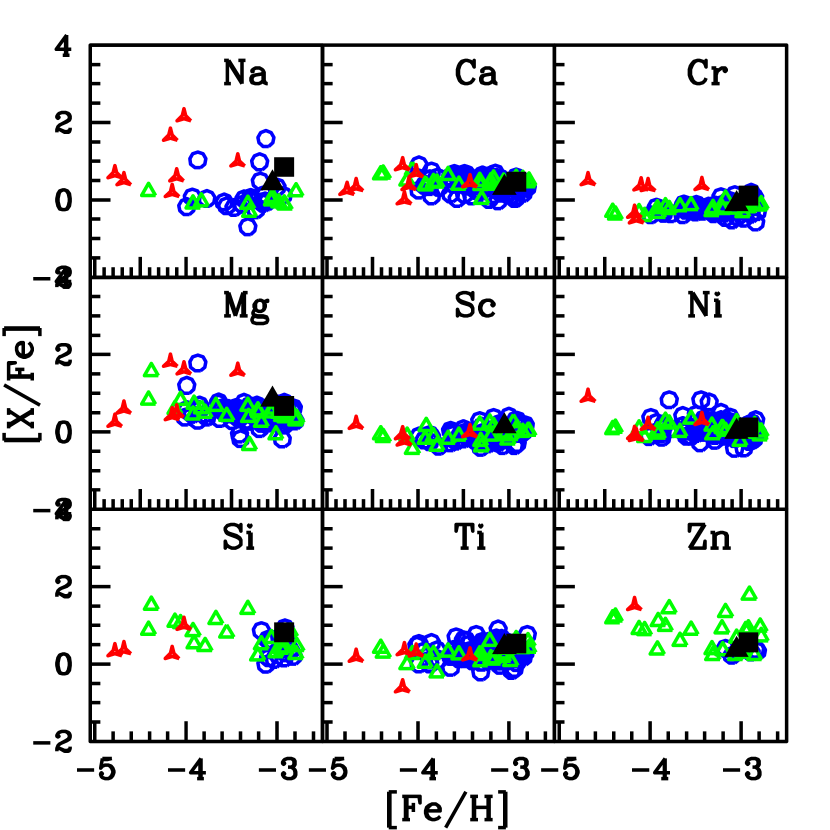
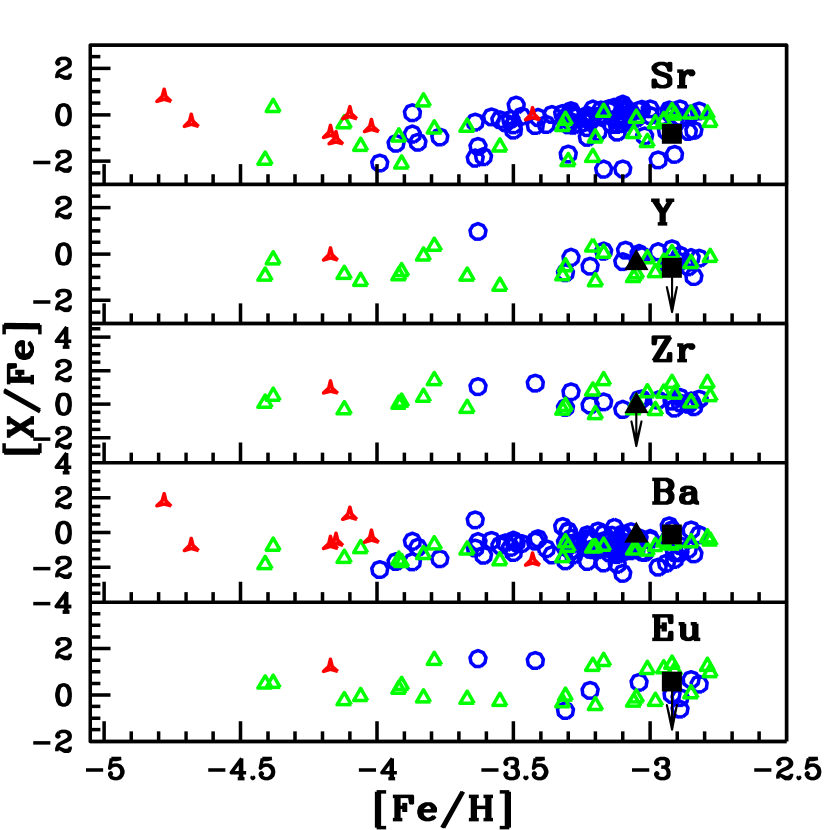
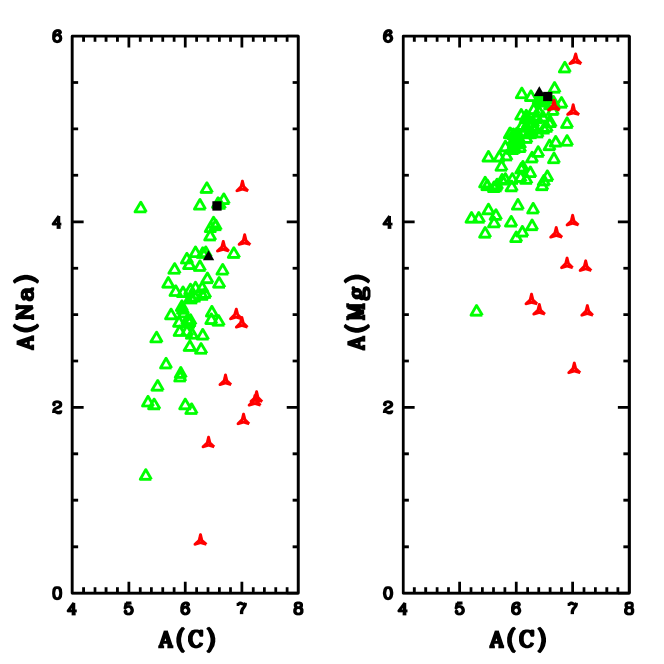
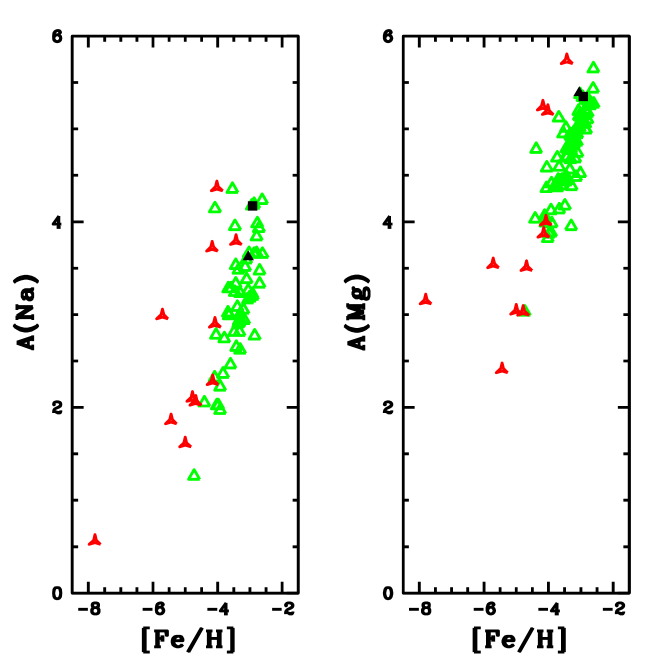
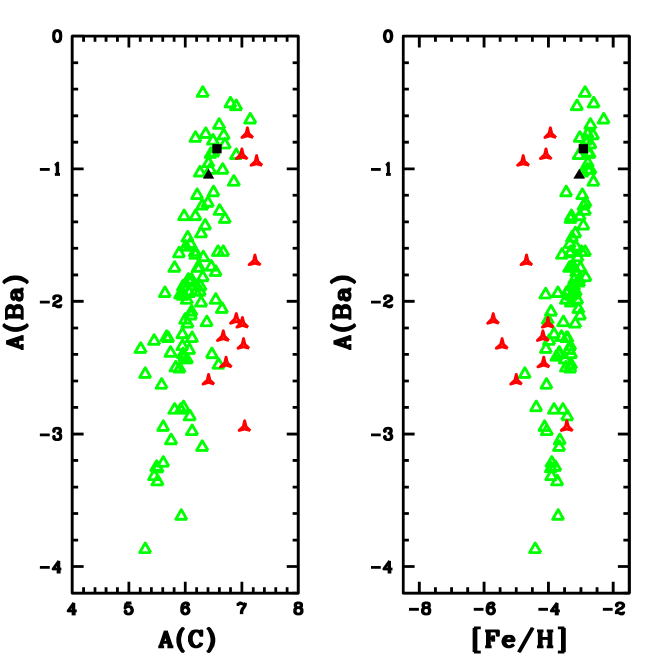
A close match of the abundance ratios of the program stars with their counterparts observed in the Group II CEMP-no stars (Figure 9), indicates that the program stars likely belong to the same group. The two groups of CEMP-no stars show distinct behaviours in terms of the abundances of Na, Mg, and Ba, in addition to carbon explained in the previous section. There exist a strong correlation between A(C, Na, Mg, Ba) and [Fe/H] among Group II CEMP-no stars, where as there is no such dependence among the Group III CEMP-no stars (Yoon et al., 2016, 2019). We have examined the abundances of Na, Mg, and Ba, with respect to A(C) and [Fe/H] and performed a comparison with Group II and Group III CEMP-no stars from the literature. These plots are shown in Figure 10. The locations of the program stars in these plots suggest that they are Group II CEMP-no stars, similar to that inferred from Figures 8 and 9.
8.3 Possible origin of the program stars
Origin of CEMP-no stars is still an open question with several suggested scenarios that include pre-enrichment of their natal cloud by faint SNe, spinstars, metal-free massive stars, or the contribution from all these sources (Yoon et al. 2016 and references therein, Hansen et al. 2016a). However, the study of Arentsen et al. (2019) shown that the binary fraction of CEMP-no stars is about 32% (11 out of 34 stars), where eight of these stars have high-carbon abundance (A(C) 6.6). This led them to suggest that at least a few of these stars might have been polluted by extremely metal-poor AGB stars that produced carbon but not a significant amount of s-process elements, like the abundances observed in these stars.
From the complex morphology of A(C) - [Fe/H] space for CEMP-no stars and their distinct behaviour in terms of abundances of Na and Mg, Yoon et al. (2016) presented the first evidence for the operation of at least two different classes of first-generation stellar progenitors for the CEMP-no stars. This hypothesis has been supported by Placco et al. (2016) from the analysis of 12 Ultra Metal-Poor (UMP) CEMP-no stars. Likelihood of existence of multiple formation pathways for CEMP-no stars has been confirmed consequently by several other authors (Arentsen et al., 2019; Yoon et al., 2019; Yoon et al., 2020; Jeon et al., 2021; Dietz et al., 2021; Purandardas & Goswami, 2021a). It may also be possible that, a single yet to be identified process, could account for the abundance pattern of all UMP stars (Placco et al., 2016). On the other hand, more than one progenitors could also contribute to the observed abundance pattern of the same CEMP-no star (Placco et al., 2016; Arentsen et al., 2019; Yoon et al., 2019).
From the abundance characteristics of the two groups of CEMP-no stars, and previous studies on BD+44 493 (Group II star) and HE 1327-2326 (Group III star), Yoon et al. (2016) had suggested that the progenitors of Group II stars may be faint SNe and that of Group III stars may be spinstars. Placco et al. (2016) performed an analysis to identify the progenitors of 12 UMP stars in their sample. They have considered the non-rotating, metal-free massive star models of Heger & Woosley (2010) for a mass range 10 - 100 M⊙, and compared these yields with the light element abundance patterns of their sample. The abundance patterns of only five out of twelve stars could be reproduced with the SN models of Heger & Woosley (2010). Among these five stars, three objects are Group II stars, and the rest two are Group III stars.
In the context of a hierarchical Galactic assembly, Yoon et al. (2019) performed a comparison of the morphology of Galactic halo CEMP-no stars on the A(C) - [Fe/H] diagram with those of CEMP-no stars in the dwarf satellite galaxies - ultra-faint Dwarfs (UFDs) and dwarf spheroidal (dSph) galaxies, of the Milky Way (MW). A very similar behaviour of A(C) - [Fe/H] as that of halo stars, with two distinct groups, is found among the CEMP-no stars of the UFD and dSph galaxies. This similarity in the morphology among these stars is a strong evidence that CEMP-no halo stars are accreted from the mini-halos, supporting various studies of Galactic assembly and halo formation (Frebel & Norris, 2015; Starkenburg et al., 2017; Amorisco, 2017; Spite et al., 2018). The characteristics of each group of CEMP-no stars depend on the nature of the host mini-halos. While the UFD galaxies host both Group II and III stars, the dSph galaxies host only Group II stars, due to several distinct properties of these galaxies such as mass, star formation history (SFH), metal-enrichment/pollution pathways, cooling agents, etc (Yoon et al. 2018, 2019; Yoon et al. 2020 and references therein). According to the study by Yoon et al. (2019), the majority of Group II CEMP-no stars in the Galactic halo are likely accreted from dwarf spheroidal-like systems, and the Group III CEMP-no stars are likely accreted from ultra-faint dwarf-like satellite galaxies.
The dSphs are massive (109 M⊙) with more gas content than UFDs that result in extended star formation, leading to the formation of Pop II stars that explode as core collapse supernovae, in addition to the Pop III supernovae. This results in a more metal-rich environment. The extended star formation history (SFH) leading to the strong chemical evolution is reflected as strong correlation among A(C), A(Na,Mg,Ba), and [Fe/H]. The next generation stars are formed from the well-mixed ISM enriched by multiple SNe, both from Pop II and III (Salvadori et al., 2015; de Bennassuti et al., 2017; Chiaki et al., 2018).
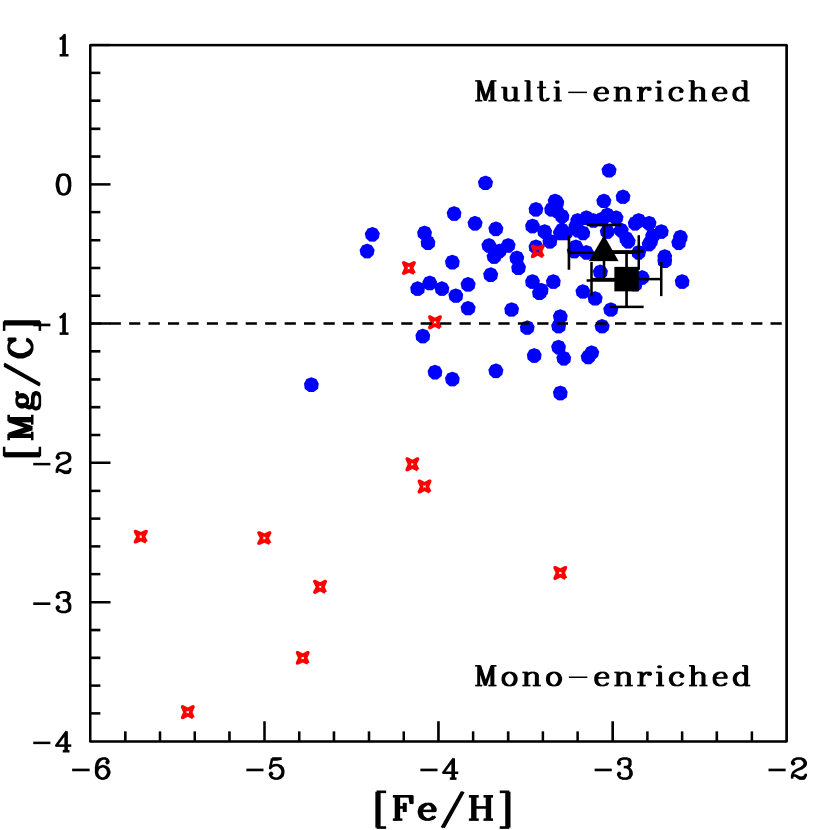
In contrast, UFDs are less massive (106 M⊙) with dark-matter dominated halos. These mini-halos likely undergo only one or a few generations of star formation due to low star formation efficiency and supernovae feed back (Salvadori & Ferrara, 2009; Vincenzo et al., 2014; Jeon et al., 2017). As a result, the stars in these systems are primitive and likely mono-enriched, as evident from their low metallicity and [Mg/C] value (0.5) (Hartwig et al., 2018). Only one Pop III progenitor - CCSNe, faint SNe, and/or spinstars, had enriched the natal clouds of these Group II and Group III stars (Salvadori et al., 2015; de Bennassuti et al., 2017).
The distinct abundance patterns of Group II and Group III stars support these different formation environments. The abundances of elements C, Na, Mg, and Fe suggest that Group II stars are likely formed from the gas cooled by the silicate grains, whose key elements are Mg and Si that are main products of CCSNe. The Group III stars are formed from the gas cooled by the carbon grains, whose key element is carbon, which is mainly produced by spinstars and/or faint SNe (Chiaki et al. 2017, Yoon et al. 2019; Yoon et al. 2020 and references therein). The simulations of Jeon et al. (2021) have shown that the Group II CEMP-no stars attribute their origin to normal SNe and Group III CEMP-no stars to faint SNe.
We have found from the abundance analysis, as discussed in the previous sections, that our program stars belong to Group II CEMP-no stars. We have examined the [Mg/C] ratio of the program stars to see if they are mono-enriched or multi-enriched. According to Hartwig et al. (2018), the stars with [Mg/C]1 are mono-enriched. It should be noted that, like carbon, the abundances of the light elements Li, Mg, and Fe are found to show significant changes in metal-poor stars as they evolve from the turn-off point to RGB, owing to atomic diffusion. In the case of Mg and Fe, the corrections can be as much as 0.3 dex; however, it has very little impact on [X/Fe] ratio of these elements (Korn et al., 2007). We have applied the diffusion correction of 0.3 to the [Mg/H] values of the program stars before calculating [Mg/C] ratio. The calculated (diffusion corrected) values of this ratio in HE 00380345 and HE 12432408 respectively are 0.68 and 0.49, indicating multi-enrichment. The location of the program stars on the [Mg/C] - [Fe/H] plot is shown in Figure 11, along with other CEMP-no stars from the literature. The program stars are found to be multi-enriched based on the [Ca/Fe] value (2) as well. If the result of Yoon et al. (2019) holds true, this multi-enrichment suggests that the program stars may owe their origin to the dSph satellite galaxies, as discussed above. Further, they might have formed from the gas cloud pre-enriched by CCSNe, from the ground of arguments discussed previously in this section. In the case of spinstar progenitor, the stars are expected to show [Sr/Ba]0 (Frischknecht et al., 2012; Hansen et al., 2019). We could estimate this ratio in the object HE 00380345, it returned a value [Sr/Ba]0.71, discarding spinstar progenitor. In the case of faint SNe progenitor, the stars are expected to show [C/Fe]2. The faint SNe are found to contribute in the metallicity range 5.5[Fe/H]3.5. In the case of stars with [C/Fe]1 and 4[Fe/H]3, CCSNe are found to contribute to the abundance pattern (Umeda & Nomoto, 2003, 2005; Tominaga et al., 2014; Mardini et al., 2022). Further, the CEMP-no stars with [C/Fe]2 are originated from Pop III stars, and Pop II stars are responsible for the origin of CEMP stars with [C/Fe] 2 (Jeon et al., 2017; Jeon et al., 2021). Hence, from the [C/Fe] values (2) and [Fe/H] (3), the progenitors of our program stars are likely Pop II CCSNe.
We have compared the abundances of the program stars with those in the CEMP-no stars of the dSPhs and UFDs from the literature (SAGA database; http://sagadatabase.jp/). This comparison is shown in Figure 12. From the figure, it is obvious that the abundance pattern of Group II CEMP-no stars of the Galaxy matches with those in the dSphs. As seen from the Figure 11, majority of Group II CEMP-no stars are multi-enriched, reinforcing their origin in dSphs. Also, the elemental abundances of the program stars match closely with those in the CEMP-no stars of the dSphs. From this, along with the observations discussed earlier in this section, we infer that our program stars are likely accreted from the dSph satellite galaxies.
In the next section, we have discussed the accretion origin of the program stars on the ground of kinematic analysis.
9 Kinematic analysis
The components of spatial velocity, total spatial velocity, and the Galactic population of the program stars are estimated following the procedures described in Johnson & Soderblom (1987), Bensby et al. (2003, 2004), Mishenina et al. (2004), and Reddy et al. (2006). The detailed procedure is discussed in our previous paper Shejeelammal et al. (2021).
The components of spatial velocity with respect to the Local Standard of Rest (LSR) is calculated as,
km/s.
(U, V, W)⊙ = (11.1, 12.2, 7.3) km/s is the solar motion with respect to LSR (Schönrich et al., 2010).
Total space velocity with respect to LSR is estimated using;
.
The proper motions in RA () and DEC (), and the parallax () values are taken from SIMBAD astronomical database and Gaia DR3 (Gaia Collaboration et al. 2016, 2022; Babusiaux et al. 2022, https://gea.esac.esa.int/archive/).
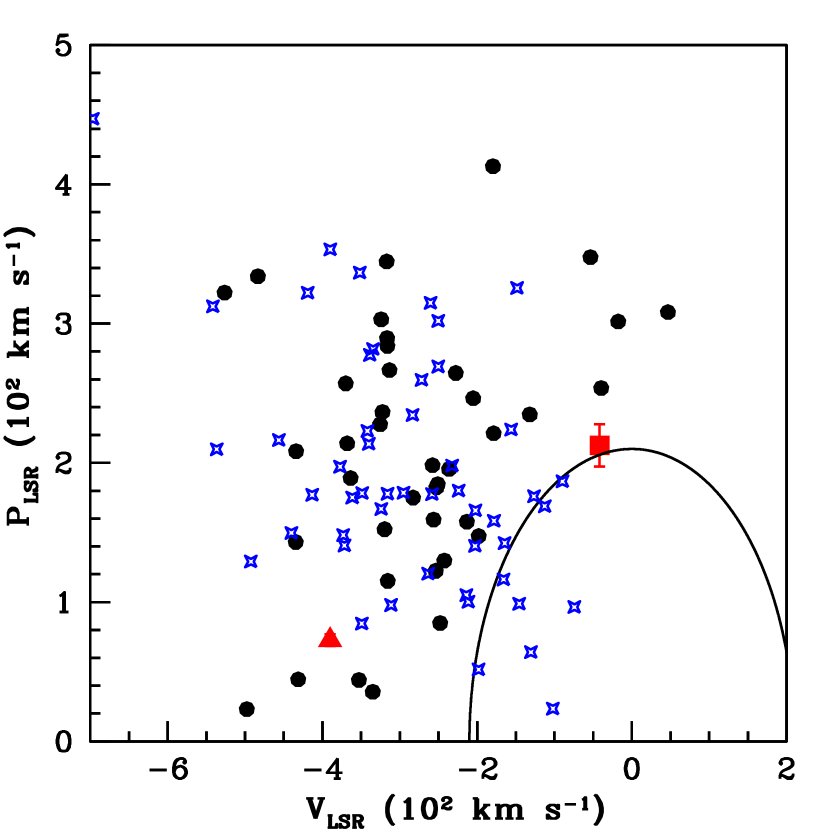
The estimated spatial velocities, along with the probabilities of the objects to belong to the Galactic thin/thick disk and halo, are presented in Table 5. While the object HE 00380345 is found to belong to the thick disk with a probability of 0.82, the object HE 00380345 is found to be a member of the halo with a probability of 1. However, according to Koppelman et al. (2018), the stars with Vspa 210 km s-1 are bonafide halo objects. Both our program stars have total spatial velocities greater than this value (Table 5). If we follow this criterion, both the program stars belong to the Galactic halo. A Toomre diagram (PLSR vs VLSR) demonstrating the location of the program stars in the Galaxy is shown in Figure 13. In this plot, the PLSR = is the perpendicular component of VLSR. As seen from the figure, the object HE 00380345 lies marginally in the disk (with the lower limit), while HE 12432408 is a bonafide halo object. We have also calculated the spatial velocities of the stars from Hansen et al. (2019), and the MW satellite galaxies. These are also shown in Figure 13, for a comparison. Here, we have included only the kinematically selected halo stars (Vspa 210 km s-1) from Hansen et al. (2019). We note that, a few satellite galaxies have velocities typical of the Galactic disk.
| Star name | ULSR | VLSR | WLSR | PLSR | Vspa | Pthin | Pthick | Phalo |
|---|---|---|---|---|---|---|---|---|
| (km s-1) | (km s-1) | (km s-1) | (km s-1) | (km s-1) | ||||
| HE 00380345 | 199.2215.07 | 41.722.70 | 74.152.07 | 212.5715.19 | 216.6313.54 | 0.00 | 0.82 | 0.18 |
| HE 12432408 | 6.011.89 | 390.064.70 | 72.573.85 | 72.814.28 | 396.805.37 | 0.00 | 0.00 | 1.00 |
9.1 Orbital properties
We have computed the orbital characteristics of the program stars to understand more about their origin. The orbital properties such as Galactocentric distances, Galactocentric velocities, angular momenta, orbital energies, are estimated using the galpy (http://github.com/jobovy/galpy, Bovy 2015) python package for Galactic dynamics. We used the high-precision astrometric data - , , , , distance, and Vr, from Gaia DR3 (Gaia Collaboration et al., 2022) listed in Tables 1 and 6. We set the Galactocentric distance of the sun at ro = 8 kpc, velocity at this distance at Vo = 220 km s-1 (Bovy et al., 2012), and the vertical distance of the sun above the plane at zo = 20.8 pc (Bennett & Bovy, 2019). The adopted solar motion with respect to LSR is (U, V, W)⊙ = (11.1, 12.2, 7.3) km/s (Schönrich et al., 2010).
Using these parameters as initial conditions, we have integrated the orbits 12 Gyrs backwards in a Milky Way-like potential. In the default MWPotential2014 (Bovy, 2015) in galpy, the bulge is parametrized by a power-law density profile that exponentially cut-off at 1.9 kpc with an exponent 1.8, the disk by Miyamoto-Nagai potential with vertical scale height of 280 pc and radial scale-length of 3 kpc (Miyamoto & Nagai, 1975), and halo by Navarro-Frenk-White (NFW) potential with a scale-length of 16 kpc (Navarro et al., 1996). This potential is characterized by a virial radius, rvir = 245 kpc and a virial mass, Mvir = 0.81012 M⊙. However, according to recent studies based on the Gaia proper motions, the virial mass of the Galaxy ranges from 1.11012 - 1.51012 M⊙ (eg., Watkins et al. 2019; Wang et al. 2020). The lower mass of the halo in the default MWPotential2014 lead to the inaccurate estimations of orbital parameters for Galactic halo objects, especially the orbital energies are highly over-estimated (Kim et al., 2019; Woody & Schlaufman, 2021). Kim et al. (2019) noted that, many high-energy, retrograde stars in the outer halo are unbound in the default MWPotential2014. Hence, in our analysis, we have used a scaled version of the default MWPotential2014, where the halo mass is increased by 50%. In the scaled MWPotential2014, Mvir1.2 1012 M⊙, in agreement with the recent observations.
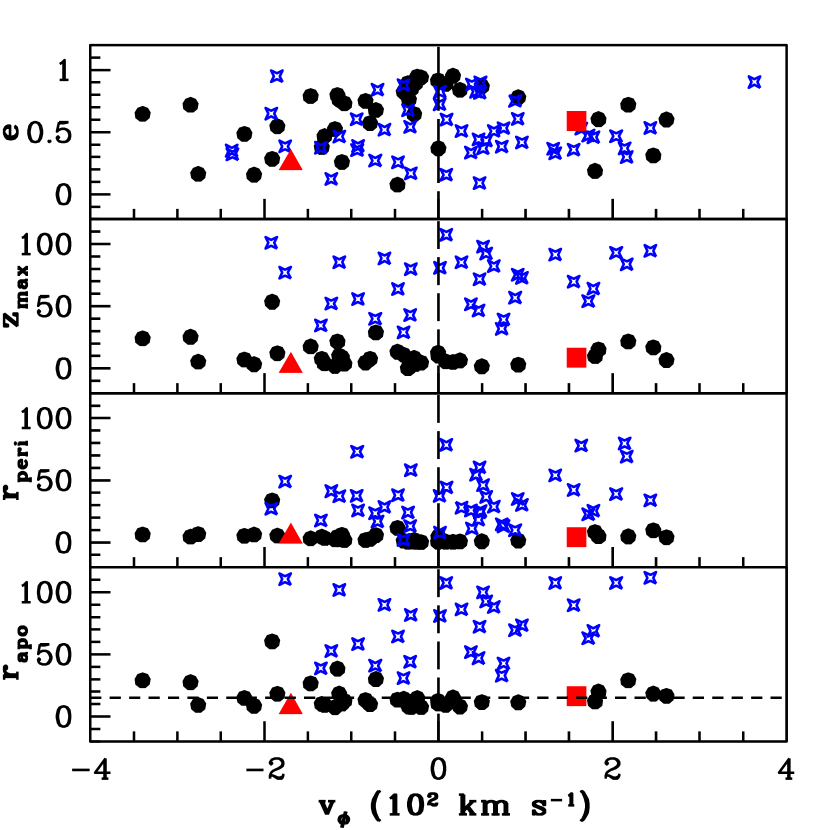
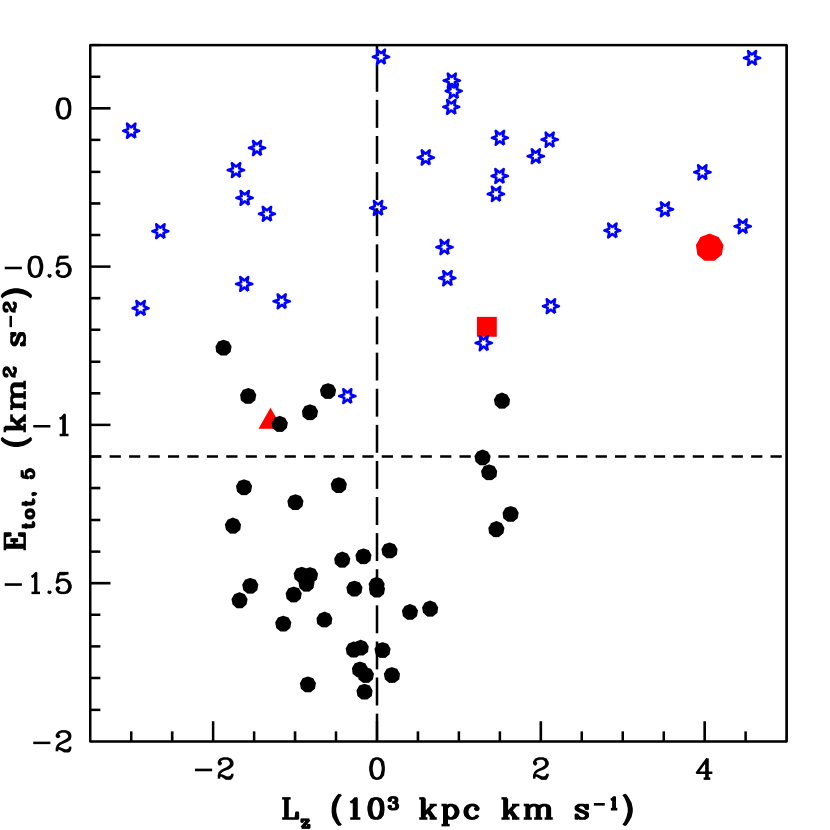
The computed orbital parameters - apocentric distance (rapo), pericentric distance (rperi), maximum height from the Galactic plane (zmax), eccentricity (e), total orbital energy (Etot), components of angular momentum (Lx, Ly, Lz), Galactocentric tangential velocity (vϕ), and 3D Galactocentric distance, of the program stars are given in Table 6. For a comparison purpose, we have calculated these parameters for the halo stars that were kinematically chosen from Hansen et al. (2019), as well as for the 50 MW satellite galaxies, using the same procedure and potential as the program stars. The resulting parameters are shown in Figures 14 and 15, however, we have excluded the unbound (Etot0) objects. In the Lindblad diagram (Etot - Lz; Figure 15), the star LAMOSTJ045019.27 + 394758.7, a sculptor dwarf galaxy escapee from the literature (Purandardas et al., 2022), is also shown.
We note from Figure 15 that our program stars and the escapee star LAMOSTJ045019.27 + 394758.7 have energies on par with a few satellite galaxies. The program stars and the halo stars have similar orbital parameters, as seen in Figure 14. We note that, in contrast to halo stars and program stars, satellite galaxies exhibit greater rapo, rperi, and zmax values, yet all three samples’ orbital eccentricities fall within the same range.
From Figure 15, we can see that both our program stars are bound to the Galaxy (Etot0), and belong to the high-energy (1.1105 km2 s-2, Myeong et al. 2019) region. The object HE 00380345 has a prograde (Lz, vϕ 0) orbit, whereas the object HE12432408 has a retrograde (Lz, vϕ 0) motion. While HE 00380345 belongs to the outer halo (outer halo starts from rapo15 - 20 kpc, Carollo et al. 2007) with rapo16.27 kpc, HE 12432408 belongs to the inner halo (6rapo13 kpc, Roederer et al. 2018) with rapo7.70 kpc. To sum up, the star HE 00380345 is found to be a high-energy, prograde, outer halo object, and HE 12432408 is found to be a high-energy, retrograde, inner halo object.
| HE 00380345 | HE 12432408 | |
| Astrometric data from Gaia DR3: | ||
| Galactic longitude, l (degrees) | 116.56 | 301.32 |
| Galactic latitude, b (degrees) | 66.23 | +38.44 |
| Proper motions, (, ) (mas/yr) | (19.26, 8.46) | (51.21, 58.59) |
| parallax, (mas) | 0.45 | 1.05 |
| Radial velocity, Vr (km s-1) | 42.66 | 213.35 |
| 3D Galactocentric distance, rgal (kpc) | 8.69 | 7.67 |
| Apocentric distance, rapo (kpc) | 16.27 | 7.70 |
| Pericentric distance, rperi (kpc) | 4.25 | 4.60 |
| Maximum height from the Galactic plane, zmax (kpc) | 8.65 | 1.99 |
| Orbital eccentricity, e | 0.59 | 0.25 |
| Total orbital energy, Etot (105 km2 s-2) | 0.69 | 0.99 |
| Angular momentum, (Lx, Ly, Lz) (103 kpc km s-1) | (0.42, 1.03, 1.34) | (0.15, 0.55, 1.30) |
| Galactocentric tangential velocity, vϕ (km s-1) | 158.70 | 169.74 |
10 Association of program stars to recognized Milky Way structures
The likely-hood of accretion origin of the stellar halo with higher apocenters and/or retrograde orbits have been discussed by several authors (Roederer et al., 2018; Myeong et al., 2019; Dietz et al., 2020; Aguado et al., 2021). The chemodynamical analysis of samples of globular clusters, stars, stellar streams, satellite galaxies etc., have shown that the Galactic halo shows different substructures in the energy - action space (Etot - Jϕ; JϕLz), owing to various major and minor accretion events in the past (Myeong et al., 2019; Naidu et al., 2020; Helmi, 2020; Aguado et al., 2021; Dietz et al., 2021; Woody & Schlaufman, 2021; Malhan et al., 2022; Zepeda et al., 2023). In addition to the substructures associated with the major massive accretion events such as Gaia-Sausage-Enceladus (GSE), Kraken, and sequoia, several other structures such as LMS-1/Wukong, Thamnos, Metal-weak Thick Disk (MWTD), I’itoi, Splashed Disk (SD), Sagittarius (Sgr), In Situ Halo, Arjuna, Aleph, Helmi Streams etc. associated with minor mergers (massive/low-mass) are found to contribute significantly to the hierarchical Galactic halo assembly (Helmi et al., 2018; Helmi, 2020; Naidu et al., 2020, 2022; Malhan et al., 2022; Zepeda et al., 2023). Each of these substructures show different chemical and dynamical properties. Zepeda et al. (2023) grouped a sample of 644 CEMP stars to different Chemodynamically Tagged Groups (CDTGs) from their chemical abundances and orbital properties, and associated these CTDGs to various aforementioned Milky Way substructures.
We have performed a chemodynamical analysis of our program stars, and compared their properties with those of Milky Way substructures to see if they could be associated with any of these accretion events. The properties of the MW structures relevant to this study are listed in Table 7. We found that none of our object meet the criteria of In situ halo (Table 7), and hence they belong to the ex situ halo component. According to Dietz et al. (2020), while the high-energy, retrograde, outer halo, metal-poor objects are donated by the Sequoia dwarf progenitor galaxy, the EMP ([FeH]2), high-energy, prograde, outer halo objects are accreted onto the halo from a series of minor mergers. Recent studies have shown that the high-energy, retrograde halo is associated with Arjuna, Sequoia, and I’itoi events, depending on the metallicity (Naidu et al., 2020; Malhan et al., 2022) 111Naidu et al. 2020 and Malhan et al. 2022 used a coordinate system where prograde orbits are those with vϕ, Lz 0.. The Metallicity Distribution Function (MDF) of this component of halo has shown that the stars with [Fe/H]1.5 belong to Arjuna, those with 2[Fe/H]1.5 to Sequoia, and with [Fe/H]2 to I’itoi structures. I’itoi, on the other hand, might be thought of as a metal-poor tail of Sequoia and/or Arjuna (Naidu et al., 2020). We found from our inspection that our high-energy, retrograde object HE 12432408 satisfies the orbital as well as the chemical properties ([Fe/H], [/Fe] 222The mean of [Mg/Fe] and [Ca/Fe] values is taken as the [/Fe] of program stars, that are 0.57 and 0.58 respectively in HE 00380345 and HE 12432408.) of the I’itoi substructure.
Our high-energy, prograde object HE 00380345 does not fully satisfy the requirement of any specific MW structure; it falls under the unclassified debris class of Naidu et al. (2020). However, they found that certain classes of this unclassified debris clustered around the selection boxes of various structures. These stars may be plausible members of that particular structure in whose close proximity they tend to cluster. If we consider such a scenario, the object HE 00380345 may plausibly belong to either the Sagittarius or the GSE. We note that even though the MDF of the GSE and the Sgr peaks at higher metallicities ([Fe/H]1.3 and 1.0 respectively; Myeong et al. 2018; Dietz et al. 2020; Naidu et al. 2020), they could contribute a few stars at metallicities as low as 3 (Zepeda et al. 2023, Figures 8 and 11 of Naidu et al. 2020). The star HE 00380345 satisfies all the properties of the Sgr except for Ly 0.3Lz 2.5. Alternatively, it satisfies all the properties of the GSE structure except for the eccentricity (e0.7); but with an estimated eccentricity of 0.6, this may be a possible member of the GSE as well.
Finally, we wind up this section with a discussion on the mass of the possible progenitor galaxies of the program stars. From the above discussion, we infer the likely association of our program stars with structures such as I’itoi, metal-poor extension of Arjuna/Sequoia (Arjuna may be a highly retrograde extension of GSE itself, as noted by Naidu et al. 2020), Sgr, or GSE. The progenitor satellite galaxies of all these events have stellar masses M⋆ 108 - 109 M⊙ (Myeong et al., 2019; Kruijssen et al., 2020; Naidu et al., 2020, 2022). This mass of the progenitor galaxies is in agreement with the typical masses of dSphs, and hence this may justify the origin of program stars in massive ( 109 M⊙) dSph galaxies as discussed in Section 8.3.
| In situ halo | I’itoi | Gaia-Sausage-Enceladus (GSE) | Sagittarius (Sgr) | |
|---|---|---|---|---|
| Etot (105 km2 s-2) | 0.8 | 1.25 | 0.5 | 0.9 - 0.4 |
| Lz (103 kpc km s-1) | 1.0 | 0.7 | 150 - +150 | 0 |
| vϕ (km s-1) | 200 | 100 | 150 - +200 | 50 |
| Eccentricity, e | 0.3 | 0.1 - 0.7 | 0.7 | 0.4 - 0.7 |
| rgal (kpc) | 25 | 40 | 50‡ | 8 |
| Metallicty, [Fe/H]∗ | 1 | 2 | 1.3 | 1.0 |
| [/Fe] | 0.25 - 0.5 | 0.2 - 0.6 | 0.3 - 0.6⋆ | 0.4 - 0.6⋆ |
| Ly (103 kpc km s-1) | – | – | – | 0.3Lz 2.5 |
† Adopted from Naidu
et al. (2020)
‡ The sample is limited up to 50 kpc; ∗ Peak of MDF; ⋆ At [Fe/H]3.0
11 conclusions
The high-resolution spectroscopic analysis of two CEMP star candidates, HE 00380345 and HE 12432408, selected from the HES is carried out. We present the first-time detailed chemodynamical analysis of these stars. Both the objects are found to be extremely metal-poor stars with [Fe/H]3.0. The estimated [C/Fe] values, 1.05 and 1.03 (after applying the correction), and [Ba/Fe] values, 0.11 and 0.18, for HE 00380345 and HE 12432408 respectively, show that both the objects are CEMP-no stars. From the estimated [C/N] values, the stars are found to have undergone mixing that altered the surface carbon abundances.
The location of the program stars on the A(C) - [Fe/H] diagram shows that both the objects belong to the Group II CEMP-no stars of Yoon et al. (2016). The observed abundances of Na, Mg, and Ba also confirms the assignment of the program stars to the Group II. The [Mg/C] and [Ca/Fe] ratios of the objects reveal that they are multi-enriched. Based on the multi-enrichment and other abundance profile analysis, we found that the program stars may have formed in the dSph satellite galaxies. This result is in strong agreement with the Galactic assembly and accretion of halo CEMP-no stars from mini-halos, as suggested by Yoon et al. (2018), Yoon et al. (2019), and Yoon et al. (2020). Furthermore, from the finding that the program stars were likely born in the dSph-like systems, and based on the [C/Fe], [Fe/H], and [Sr/Ba] values, we found that the likely progenitors of the program stars are Pop II core-collapse SNe.
We have performed a detailed kinematic analysis and derived various orbital and dynamical properties of the program stars to derive non-abundance-based conclusions about their origin. The kinematic analysis shows that the objects HE 00380345 and HE 12432408 are members of the Galactic halo with Vspa210 km s-1. From the dynamical and orbital parameters, the object HE 00380345 is found to be a high-energy, prograde, outer halo object, and HE 12432408 is found to be a high-energy, retrograde, inner halo object. Our detailed chemodynamical analysis shows that HE 12432408 belongs to the I’itoi structure (which can be likely a metal-poor tail of the Sequoia and/or Arjuna), where as HE 00380345 is a plausible member of the Sgr or the GSE accretion events. The mass of the progenitor galaxies of the program stars inferred from their dynamics (M⋆ 108 - 109 M⊙), agrees with our speculations based on the chemical abundances that the stars may have originated in massive ( 109 M⊙) dSph like systems.
12 ACKNOWLEDGMENT
Based on observations obtained with the HERMES spectrograph, supported by the Fund for
Scientific Research of Flanders (FWO), the Research Council of K.U.Leuven,
the Fonds National de la Recherche Scientifique (F.R.S.- FNRS), Belgium, the
Royal Observatory of Belgium, the Observatoire de Genéve, Switzerland and the
Thüringer Landessternwarte Tautenburg, Germany.
We thank Alain Jorissen for sharing the HERMES spectra used in this study.
This work made use of the SIMBAD astronomical database, operated
at CDS, Strasbourg, France, and the NASA ADS, USA.
This work has made use of data from the European Space Agency (ESA) mission
Gaia (https://www.cosmos.esa.int/gaia), processed by the Gaia
Data Processing and Analysis Consortium (DPAC,
https://www.cosmos.esa.int/web/gaia/dpac/consortium). Funding for the DPAC
has been provided by national institutions, in particular the institutions
participating in the Gaia Multilateral Agreement.
We are grateful for the support received from the Belgo-Indian Network for Astronomy &
Astrophysics project BINA - 2 (DST/INT/Belg/P-02 (India) and BL/11/IN07 (Belgium)).
Data Availability
The data underlying this article will be shared on reasonable request to the authors.
References
- Aguado et al. (2021) Aguado D. S., et al., 2021, ApJ, 908, L8
- Amorisco (2017) Amorisco N. C., 2017, MNRAS, 464, 2882
- Andrievsky et al. (2007) Andrievsky S. M., Spite M., Korotin S. A., Spite F., Bonifacio P., Cayrel R., Hill V., François P., 2007, A&A, 464, 1081
- Aoki et al. (2002) Aoki W., Ryan S. G., Norris J. E., Beers T. C., Ando H., Tsangarides S., 2002, ApJ, 580, 1149
- Aoki et al. (2005) Aoki W., et al., 2005, ApJ, 632, 611
- Aoki et al. (2007) Aoki W., Beers T. C., Christlieb N., Norris J. E., Ryan S. G., Tsangarides S., 2007, ApJ, 655, 492
- Aoki et al. (2018) Aoki W., Matsuno T., Honda S., Ishigaki M. N., Li H., Suda T., Kumar Y. B., 2018, PASJ, 70, 94
- Arentsen et al. (2019) Arentsen A., Starkenburg E., Shetrone M. D., Venn K. A., Depagne É., McConnachie A. W., 2019, A&A, 621, A108
- Asplund et al. (2009) Asplund M., Grevesse N., Sauval A. J., Scott P., 2009, ARA&A, 47, 481
- Babusiaux et al. (2022) Babusiaux C., et al., 2022, arXiv e-prints, p. arXiv:2206.05989
- Banerjee et al. (2018) Banerjee P., Qian Y.-Z., Heger A., 2018, ApJ, 865, 120
- Beers (1999) Beers T. C., 1999, in Gibson B. K., Axelrod R. S., Putman M. E., eds, Astronomical Society of the Pacific Conference Series Vol. 165, The Third Stromlo Symposium: The Galactic Halo. p. 202
- Beers & Christlieb (2005) Beers T. C., Christlieb N., 2005, ARA&A, 43, 531
- Beers et al. (2007) Beers T. C., et al., 2007, ApJS, 168, 128
- Beers et al. (2017) Beers T. C., et al., 2017, ApJ, 835, 81
- Belokurov et al. (2018) Belokurov V., Erkal D., Evans N. W., Koposov S. E., Deason A. J., 2018, MNRAS, 478, 611
- Bennett & Bovy (2019) Bennett M., Bovy J., 2019, MNRAS, 482, 1417
- Bensby et al. (2003) Bensby T., Feltzing S., Lundström I., 2003, A&A, 410, 527
- Bensby et al. (2004) Bensby T., Feltzing S., Lundström I., 2004, A&A, 415, 155
- Bessell et al. (1998) Bessell M. S., Castelli F., Plez B., 1998, A&A, 333, 231
- Bonifacio et al. (2015) Bonifacio P., et al., 2015, A&A, 579, A28
- Bovy (2015) Bovy J., 2015, ApJS, 216, 29
- Bovy et al. (2012) Bovy J., et al., 2012, ApJ, 759, 131
- Buder et al. (2018) Buder S., et al., 2018, MNRAS, 478, 4513
- Carollo et al. (2007) Carollo D., et al., 2007, Nature, 450, 1020
- Carollo et al. (2012) Carollo D., et al., 2012, ApJ, 744, 195
- Castelli & Kurucz (2003) Castelli F., Kurucz R. L., 2003, in Piskunov N., Weiss W. W., Gray D. F., eds, Proceedings of the IAU Symp. No 210 Vol. 210, Modelling of Stellar Atmospheres. p. A20 (arXiv:astro-ph/0405087)
- Chiaki et al. (2017) Chiaki G., Tominaga N., Nozawa T., 2017, MNRAS, 472, L115
- Chiaki et al. (2018) Chiaki G., Susa H., Hirano S., 2018, MNRAS, 475, 4378
- Choplin et al. (2017) Choplin A., Hirschi R., Meynet G., Ekström S., 2017, A&A, 607, L3
- Clarkson et al. (2018) Clarkson O., Herwig F., Pignatari M., 2018, MNRAS, 474, L37
- Collet et al. (2007) Collet R., Asplund M., Trampedach R., 2007, A&A, 469, 687
- Cooke & Madau (2014) Cooke R. J., Madau P., 2014, ApJ, 791, 116
- Deason et al. (2013) Deason A. J., Belokurov V., Evans N. W., Johnston K. V., 2013, ApJ, 763, 113
- Dietz et al. (2020) Dietz S. E., Yoon J., Beers T. C., Placco V. M., 2020, ApJ, 894, 34
- Dietz et al. (2021) Dietz S. E., Yoon J., Beers T. C., Placco V. M., Lee Y. S., 2021, ApJ, 914, 100
- Dobrovolskas et al. (2013) Dobrovolskas V., Kučinskas A., Steffen M., Ludwig H. G., Prakapavičius D., Klevas J., Caffau E., Bonifacio P., 2013, A&A, 559, A102
- Ezzeddine et al. (2019) Ezzeddine R., et al., 2019, ApJ, 876, 97
- Forbes (2020) Forbes D. A., 2020, MNRAS, 493, 847
- Frebel & Ji (2023) Frebel A., Ji A. P., 2023, arXiv e-prints, p. arXiv:2302.09188
- Frebel & Norris (2015) Frebel A., Norris J. E., 2015, ARA&A, 53, 631
- Frebel et al. (2006) Frebel A., et al., 2006, ApJ, 652, 1585
- Frebel et al. (2008) Frebel A., Collet R., Eriksson K., Christlieb N., Aoki W., 2008, ApJ, 684, 588
- Frischknecht et al. (2012) Frischknecht U., Hirschi R., Thielemann F. K., 2012, A&A, 538, L2
- Gaia Collaboration et al. (2016) Gaia Collaboration et al., 2016, A&A, 595, A1
- Gaia Collaboration et al. (2022) Gaia Collaboration et al., 2022, arXiv e-prints, p. arXiv:2208.00211
- Girardi et al. (2000) Girardi L., Bressan A., Bertelli G., Chiosi C., 2000, A&AS, 141, 371
- Goswami et al. (2021) Goswami P. P., Rathour R. S., Goswami A., 2021, A&A, 649, A49
- Gratton et al. (2000) Gratton R. G., Sneden C., Carretta E., Bragaglia A., 2000, A&A, 354, 169
- Hansen et al. (2015) Hansen T., et al., 2015, ApJ, 807, 173
- Hansen et al. (2016a) Hansen T. T., Andersen J., Nordström B., Beers T. C., Placco V. M., Yoon J., Buchhave L. A., 2016a, A&A, 586, A160
- Hansen et al. (2016b) Hansen T. T., Andersen J., Nordström B., Beers T. C., Placco V. M., Yoon J., Buchhave L. A., 2016b, A&A, 588, A3
- Hansen et al. (2016c) Hansen C. J., et al., 2016c, A&A, 588, A37
- Hansen et al. (2019) Hansen C. J., Hansen T. T., Koch A., Beers T. C., Nordström B., Placco V. M., Andersen J., 2019, A&A, 623, A128
- Hartwig et al. (2015) Hartwig T., Bromm V., Klessen R. S., Glover S. C. O., 2015, MNRAS, 447, 3892
- Hartwig et al. (2018) Hartwig T., et al., 2018, MNRAS, 478, 1795
- Hayek et al. (2011) Hayek W., Asplund M., Collet R., Nordlund Å., 2011, A&A, 529, A158
- Heger & Woosley (2010) Heger A., Woosley S. E., 2010, ApJ, 724, 341
- Helmi (2020) Helmi A., 2020, ARA&A, 58, 205
- Helmi et al. (2018) Helmi A., Babusiaux C., Koppelman H. H., Massari D., Veljanoski J., Brown A. G. A., 2018, Nature, 563, 85
- Holmbeck et al. (2020) Holmbeck E. M., et al., 2020, ApJS, 249, 30
- Honda et al. (2004) Honda S., Aoki W., Kajino T., Ando H., Beers T. C., Izumiura H., Sadakane K., Takada-Hidai M., 2004, ApJ, 607, 474
- Horta et al. (2021) Horta D., et al., 2021, MNRAS, 500, 1385
- Jablonka et al. (2015) Jablonka P., et al., 2015, A&A, 583, A67
- Jeon et al. (2017) Jeon M., Besla G., Bromm V., 2017, ApJ, 848, 85
- Jeon et al. (2021) Jeon M., Bromm V., Besla G., Yoon J., Choi Y., 2021, MNRAS, 502, 1
- Johnson & Soderblom (1987) Johnson D. R. H., Soderblom D. R., 1987, AJ, 93, 864
- Johnson et al. (2007) Johnson J. A., Herwig F., Beers T. C., Christlieb N., 2007, ApJ, 658, 1203
- Kim et al. (2019) Kim Y. K., Lee Y. S., Beers T. C., 2019, ApJ, 882, 176
- Koch-Hansen et al. (2021) Koch-Hansen A. J., Hansen C. J., Lombardo L., Bonifacio P., Hanke M., Caffau E., 2021, A&A, 645, A64
- Komiya et al. (2007) Komiya Y., Suda T., Minaguchi H., Shigeyama T., Aoki W., Fujimoto M. Y., 2007, ApJ, 658, 367
- Koppelman et al. (2018) Koppelman H., Helmi A., Veljanoski J., 2018, ApJ, 860, L11
- Koppelman et al. (2019) Koppelman H. H., Helmi A., Massari D., Price-Whelan A. M., Starkenburg T. K., 2019, A&A, 631, L9
- Korn et al. (2007) Korn A. J., Grundahl F., Richard O., Mashonkina L., Barklem P. S., Collet R., Gustafsson B., Piskunov N., 2007, ApJ, 671, 402
- Kruijssen et al. (2019) Kruijssen J. M. D., Pfeffer J. L., Reina-Campos M., Crain R. A., Bastian N., 2019, MNRAS, 486, 3180
- Kruijssen et al. (2020) Kruijssen J. M. D., et al., 2020, MNRAS, 498, 2472
- Lee et al. (2013) Lee Y. S., et al., 2013, AJ, 146, 132
- Lombardo et al. (2022) Lombardo L., et al., 2022, A&A, 665, A10
- Maeder & Meynet (2015) Maeder A., Meynet G., 2015, A&A, 580, A32
- Malhan et al. (2022) Malhan K., et al., 2022, ApJ, 926, 107
- Mardini et al. (2022) Mardini M. K., et al., 2022, MNRAS, 517, 3993
- Mashonkina et al. (2017) Mashonkina L., Jablonka P., Pakhomov Y., Sitnova T., North P., 2017, A&A, 604, A129
- Matsuno et al. (2019) Matsuno T., Aoki W., Suda T., 2019, ApJ, 874, L35
- Meynet et al. (2006) Meynet G., Ekström S., Maeder A., 2006, A&A, 447, 623
- Mishenina et al. (2004) Mishenina T. V., Soubiran C., Kovtyukh V. V., Korotin S. A., 2004, A&A, 418, 551
- Miyamoto & Nagai (1975) Miyamoto M., Nagai R., 1975, PASJ, 27, 533
- Mucciarelli & Bonifacio (2020) Mucciarelli A., Bonifacio P., 2020, A&A, 640, A87
- Myeong et al. (2018) Myeong G. C., Evans N. W., Belokurov V., Sanders J. L., Koposov S. E., 2018, ApJ, 856, L26
- Myeong et al. (2019) Myeong G. C., Vasiliev E., Iorio G., Evans N. W., Belokurov V., 2019, MNRAS, 488, 1235
- Naidu et al. (2020) Naidu R. P., Conroy C., Bonaca A., Johnson B. D., Ting Y.-S., Caldwell N., Zaritsky D., Cargile P. A., 2020, ApJ, 901, 48
- Naidu et al. (2022) Naidu R. P., et al., 2022, ApJ, 926, L36
- Navarro et al. (1996) Navarro J. F., Frenk C. S., White S. D. M., 1996, ApJ, 462, 563
- Nomoto et al. (2013) Nomoto K., Kobayashi C., Tominaga N., 2013, ARA&A, 51, 457
- Norris & Yong (2019) Norris J. E., Yong D., 2019, ApJ, 879, 37
- Norris et al. (2013) Norris J. E., et al., 2013, ApJ, 762, 25
- Pfeffer et al. (2021) Pfeffer J., Lardo C., Bastian N., Saracino S., Kamann S., 2021, MNRAS, 500, 2514
- Pillepich et al. (2014) Pillepich A., et al., 2014, MNRAS, 444, 237
- Placco et al. (2014) Placco V. M., Frebel A., Beers T. C., Stancliffe R. J., 2014, ApJ, 797, 21
- Placco et al. (2016) Placco V. M., et al., 2016, ApJ, 833, 21
- Placco et al. (2021) Placco V. M., Sneden C., Roederer I. U., Lawler J. E., Den Hartog E. A., Hejazi N., Maas Z., Bernath P., 2021, Research Notes of the American Astronomical Society, 5, 92
- Pols et al. (2012) Pols O. R., Izzard R. G., Stancliffe R. J., Glebbeek E., 2012, A&A, 547, A76
- Purandardas & Goswami (2021a) Purandardas M., Goswami A., 2021a, ApJ, 912, 74
- Purandardas & Goswami (2021b) Purandardas M., Goswami A., 2021b, ApJ, 922, 28
- Purandardas et al. (2019) Purandardas M., Goswami A., Goswami P. P., Shejeelammal J., Masseron T., 2019, MNRAS, 486, 3266
- Purandardas et al. (2022) Purandardas M., Goswami A., Shejeelammal J., Sonamben M., Pawar G., Mkrtichian D., Doddamani V. H., Joshi S., 2022, MNRAS, 513, 4696
- Raskin et al. (2011) Raskin G., et al., 2011, A&A, 526, A69
- Reddy et al. (2006) Reddy B. E., Lambert D. L., Allende Prieto C., 2006, MNRAS, 367, 1329
- Roederer et al. (2014) Roederer I. U., Preston G. W., Thompson I. B., Shectman S. A., Sneden C., Burley G. S., Kelson D. D., 2014, AJ, 147, 136
- Roederer et al. (2018) Roederer I. U., Sneden C., Lawler J. E., Sobeck J. S., Cowan J. J., Boesgaard A. M., 2018, ApJ, 860, 125
- Salvadori & Ferrara (2009) Salvadori S., Ferrara A., 2009, MNRAS, 395, L6
- Salvadori et al. (2007) Salvadori S., Schneider R., Ferrara A., 2007, MNRAS, 381, 647
- Salvadori et al. (2015) Salvadori S., Skúladóttir Á., Tolstoy E., 2015, MNRAS, 454, 1320
- Schönrich et al. (2010) Schönrich R., Binney J., Dehnen W., 2010, MNRAS, 403, 1829
- Shejeelammal & Goswami (2021) Shejeelammal J., Goswami A., 2021, ApJ, 921, 77
- Shejeelammal & Goswami (2022) Shejeelammal J., Goswami A., 2022, ApJ, 934, 110
- Shejeelammal et al. (2020) Shejeelammal J., Goswami A., Goswami P. P., Rathour R. S., Masseron T., 2020, MNRAS, 492, 3708
- Shejeelammal et al. (2021) Shejeelammal J., Goswami A., Shi J., 2021, MNRAS, 502, 1008
- Simpson & Martell (2019) Simpson J. D., Martell S. L., 2019, MNRAS, 490, 741
- Sneden (1973) Sneden C. A., 1973, PhD thesis, THE UNIVERSITY OF TEXAS AT AUSTIN.
- Spite et al. (2005) Spite M., et al., 2005, A&A, 430, 655
- Spite et al. (2006) Spite M., et al., 2006, A&A, 455, 291
- Spite et al. (2013) Spite M., Caffau E., Bonifacio P., Spite F., Ludwig H. G., Plez B., Christlieb N., 2013, A&A, 552, A107
- Spite et al. (2018) Spite M., Spite F., François P., Bonifacio P., Caffau E., Salvadori S., 2018, A&A, 617, A56
- Starkenburg et al. (2014) Starkenburg E., Shetrone M. D., McConnachie A. W., Venn K. A., 2014, MNRAS, 441, 1217
- Starkenburg et al. (2017) Starkenburg E., Oman K. A., Navarro J. F., Crain R. A., Fattahi A., Frenk C. S., Sawala T., Schaye J., 2017, MNRAS, 465, 2212
- Tafelmeyer et al. (2010) Tafelmeyer M., et al., 2010, A&A, 524, A58
- Tominaga et al. (2014) Tominaga N., Iwamoto N., Nomoto K., 2014, ApJ, 785, 98
- Umeda & Nomoto (2003) Umeda H., Nomoto K., 2003, Nature, 422, 871
- Umeda & Nomoto (2005) Umeda H., Nomoto K., 2005, ApJ, 619, 427
- Venn et al. (2004) Venn K. A., Irwin M., Shetrone M. D., Tout C. A., Hill V., Tolstoy E., 2004, AJ, 128, 1177
- Vincenzo et al. (2014) Vincenzo F., Matteucci F., Vattakunnel S., Lanfranchi G. A., 2014, MNRAS, 441, 2815
- Wang et al. (2020) Wang W., Han J., Cautun M., Li Z., Ishigaki M. N., 2020, Science China Physics, Mechanics, and Astronomy, 63, 109801
- Watkins et al. (2019) Watkins L. L., van der Marel R. P., Sohn S. T., Evans N. W., 2019, ApJ, 873, 118
- Woody & Schlaufman (2021) Woody T., Schlaufman K. C., 2021, AJ, 162, 42
- Yong et al. (2013) Yong D., et al., 2013, ApJ, 762, 26
- Yoon et al. (2016) Yoon J., et al., 2016, ApJ, 833, 20
- Yoon et al. (2018) Yoon J., et al., 2018, ApJ, 861, 146
- Yoon et al. (2019) Yoon J., Beers T. C., Tian D., Whitten D. D., 2019, ApJ, 878, 97
- Yoon et al. (2020) Yoon J., Whitten D. D., Beers T. C., Lee Y. S., Masseron T., Placco V. M., 2020, ApJ, 894, 7
- Zepeda et al. (2023) Zepeda J., et al., 2023, ApJ, 947, 23
- de Bennassuti et al. (2017) de Bennassuti M., Salvadori S., Schneider R., Valiante R., Omukai K., 2017, MNRAS, 465, 926
Appendix A Line list
| Wavelength(Å) | El | (eV) | log gf | HE 00380345 | HE 12432408 |
|---|---|---|---|---|---|
| 4132.9 | Fe I | 2.84 | 0.920 | 28.5(4.59) | - |
| 4153.90 | 3.40 | 0.280 | - | 18.4(4.26) | |
| 4337.05 | 1.56 | 1.7 | - | 63.4(4.63) | |
| 4489.74 | 0.12 | 3.90 | 40.9(4.54) | - | |
| 4547.847 | 3.546 | 0.820 | - | 8.2(4.51) | |
| 5005.711 | 3.883 | 0.120 | 17.5(4.59) | - | |
| 5006.119 | 2.833 | 0.61 | - | 38.1(4.33) | |
| 5151.911 | 1.010 | 3.320 | - | 22.2(4.45) | |
| 5198.711 | 2.222 | 2.135 | - | 14.8(4.55) | |
| 5215.179 | 3.266 | 0.933 | - | 14.2(4.48) | |
| 5226.862 | 3.038 | 0.667 | - | 28.5(4.28) | |
| 5263.31 | 3.260 | 0.870 | - | 13.4(4.42) | |
| 5339.93 | 3.27 | 0.680 | 27.3(4.64) | - | |
| 5364.870 | 4.44 | 0.220 | - | 10.4(4.56) | |
| 5393.17 | 3.24 | 0.720 | 24.8(4.64) | - | |
| 5569.62 | 3.42 | 0.490 | - | 22.5(4.52) | |
| 5586.76 | 3.370 | 0.110 | 36.8(4.45) | - | |
| 6137.694 | 2.588 | 1.403 | - | 23.1(4.39) | |
| 6219.28 | 2.200 | 2.450 | - | 8.8(4.46) | |
| 6252.555 | 2.402 | 1.690 | - | 23.0(4.45) | |
| 6393.60 | 2.430 | 1.620 | 30.7(4.65) | - | |
| 6430.85 | 2.18 | 2.010 | 29.1(4.63) | 22.4(4.40) | |
| 4233.16 | Fe II | 2.580 | 2.020 | - | 32.8(4.42) |
| 4416.820 | 2.780 | 2.570 | 11.2(4.61) | - | |
| 4491.405 | 2.855 | 2.700 | 6.6(4.56) | - | |
| 4508.288 | 2.855 | 2.210 | - | 16.1(4.59) | |
| 4520.224 | 2.81 | 2.600 | 8.4(4.56) | 7.4(4.35) |
The numbers in the parenthesis in columns 5 & 6 give the derived absolute abundances from the respective line.
| Wavelength(Å) | El | (eV) | log gf | HE 00380345 | HE 12432408 |
|---|---|---|---|---|---|
| 5682.633 | Na I | 2.102 | 0.700 | 8.3(4.20) | - |
| 4702.991 | Mg I | 4.346 | 0.666 | 44.3(5.26) | 53.8(5.48) |
| 5528.405 | 4.346 | 0.620 | 57.0(5.44) | 50.8(5.30) | |
| 5948.541 | Si I | 5.083 | 1.23 | 6.9(5.41) | - |
| 4098.530 | Ca I | 2.530 | 0.520 | 12.9(4.07) | - |
| 4283.011 | 1.886 | 0.224 | - | 28.8(3.54) | |
| 4455.890 | 1.899 | 0.540 | - | 23.9(3.73) | |
| 5594.462 | 2.523 | 0.050 | 23.3(3.70) | - | |
| 6102.723 | 1.879 | 0.890 | - | 16.9(3.66) | |
| 6162.173 | 1.899 | 0.1 | 57.6(4.08) | - | |
| 6439.075 | 2.525 | 0.47 | 43.4(3.90) | 31.1(3.57) | |
| 6493.781 | 2.521 | 0.14 | 17.8(3.70) | 19.2(3.49) | |
| 4533.239 | Ti I | 0.848 | 0.476 | - | 32.3(2.20) |
| 4999.50 | 0.820 | 0.170 | 29.3(2.40) | - | |
| 5007.21 | 0.82 | 0.17 | 33.1(2.57) | 33.3(2.50) | |
| 5210.386 | 0.047 | 0.884 | - | 22.1(2.32) | |
| 4470.86 | Ti II | 1.16 | 2.28 | - | 20.1(2.35) |
| 4493.51 | 1.08 | 2.73 | 15.3(2.70) | - | |
| 5185.9 | 1.89 | 1.35 | 21.7(2.43) | - | |
| 5226.543 | 1.566 | 1.300 | 47.9(2.64) | 33.8(2.12) | |
| 5336.77 | 1.58 | 1.700 | - | 29.9(2.43) | |
| 5381.015 | 1.566 | 2.08 | 20.7(2.56) | 26.7(2.73) | |
| 4289.73 | Cr I | 0.00 | 0.37 | 78.2(2.97) | 67.1(2.48) |
| 5206.04 | 0.94 | 0.020 | - | 51.4(2.46) | |
| 5345.801 | 1.003 | 0.980 | - | 12.8(2.39) | |
| 5409.772 | 1.03 | 0.720 | 30.3(2.69) | 26.5(2.56) | |
| 4855.41 | Ni I | 3.54 | 0.000 | 9.7(3.46) | - |
| 4904.41 | 3.54 | 0.170 | - | 3.1(3.08) | |
| 5084.08 | 3.68 | 0.030 | - | - | |
| 5115.39 | 3.83 | 0.110 | - | 2.0(3.15) | |
| 5146.48 | 3.706 | 0.12 | 7.5(3.38) | - | |
| 4722.15 | Zn I | 4.029 | 0.370 | - | 8.1(1.88) |
| 4810.53 | 4.08 | 0.170 | 17.9(2.20) | - |
The numbers in the parenthesis in columns 5 & 6 give the derived absolute abundances from the respective line.