Dwarf-Dwarf Interactions Can Both Trigger and Quench Star Formation
Abstract
It is exceedingly rare to find quiescent low-mass galaxies in the field at low redshift. UGC5205 is an example of such a quenched field dwarf (). Despite a wealth of cold gas () and ultraviolet emission that indicates significant star formation in the past few hundred Myr, there is no detection of H emission – star formation in the last Myr – across the face of the galaxy. Meanwhile, the near equal-mass companion of UGC5205, PGC027864, is starbursting ( Å). In this work, we present new Karl G. Jansky Very Large Array (VLA) 21 cm line observations of UGC5205 showing that the lack of star formation is caused by an absence of H I in the main body of the galaxy. The H I of UGC5205 is highly disturbed; the bulk of the H I resides in several kpc-long tails, while the H I of PGC027864 is dominated by ordered rotation. We model the stellar populations of UGC5205 to show that, as indicated by the UV-H emission, the galaxy underwent a coordinated quenching event Myr ago. The asymmetry of outcomes for UGC5205 and PGC027864 demonstrate that major mergers can both quench and trigger star formation in dwarfs. However, because the gas remains bound to the system, we suggest that such mergers only temporarily quench star formation. We estimate a total quenched time of Myr for UGC5205, consistent with established upper limits on the quenched fraction of a few percent for dwarfs in the field.
O1 m^-#2
1 Introduction
Dwarf galaxies ( ) provide a crucial laboratory for the processes, both internal and environmental, that regulate star-formation. Unlike more massive galaxies, empirical evidence suggests that low-mass galaxies are nearly always star-forming in the field, with less than of galaxies at expected to be quenched outside the influence of a massive galaxy (Geha et al., 2012). While merging and feedback are actively discussed as mechanisms for truncating star formation in massive galaxies (e.g., Blanton & Moustakas, 2009), the dearth of a build-up of quenched dwarfs in the field suggests that these mechanisms either do not exist in the dwarf regime, or are inefficient at quenching dwarf galaxies.
In this paper, we study an intriguing exception that may prove the rule. UGC5205 is a dwarf galaxy () at Mpc that is classified as a field dwarf by standard criteria (Geha et al., 2012). However, UGC5205 is in an interacting pair with the comparable-mass galaxy PGC027864. This pair is part of the TiNy Titans survey of dwarf interacting pairs (Stierwalt et al., 2015, 2017). While both galaxies are very H I rich, there is no sign of H emission across the face of UGC5205 (Pracy et al., 2012). PGC027864, meanwhile, is vigorously star-forming, and has been studied in the UV as a local analog to high redshift galaxies (e.g., Izotov & Thuan, 2016; Senchyna et al., 2022). The two galaxies in this pair thus have radically different effective star formation efficiencies (where we will roughly define star formation efficiency as ) despite very similar stellar masses, H I masses, and large scale environments.
Our aim in the present work is to understand the root of this apparent disparity in SFE by studying the morphology and kinematics of the H I gas, particularly in the quenched dwarf UGC5205. While mergers are a recognized mechanism for quenching star formation in massive galaxies (see, e.g. Hopkins et al., 2008; Somerville et al., 2008; Quai et al., 2021), this pathway has not been explored as a quenching mechanism for dwarfs. In fact, although signatures of dwarf-dwarf interactions and mergers at this mass ratio are observed in a few percent of dwarfs (Stierwalt et al., 2015; Besla et al., 2018; Kado-Fong et al., 2020), for both dwarf pairs (Stierwalt et al., 2015) and post-coalescence mergers (Kado-Fong et al., 2020), dwarf-dwarf interactions appear to trigger, rather than quench, star formation. In particular, long-term quenching via low-mass mergers is disfavored due to the lack of an emergent field dwarf population at low redshift (Geha et al., 2012) despite theoretical expectations that major mergers between dwarfs are relatively common () since and direct evidence for major mergers at low- (see, e.g. Stierwalt et al., 2015; Kado-Fong et al., 2020). UGC5205 thus provides an excellent laboratory to interrogate the physical processes at play during dwarf-dwarf mergers, and how quenching can occur dynamically in such a gas-rich system.
This manuscript is structured as follows. Section 2 introduces the Karl G. Jansky Very Large Array (VLA) data that we obtained of UGC5205 and PGC027864, while Section 3 discusses the analysis of the VLA data and archival UV-optical datasets. Finally, in Section 4 we discuss the viability of proposed mechanisms to quench UGC5205 as well as the implications that the existence of UGC5205 has on the existence and evolution of a quiescent dwarf population.
Throughout this analysis, we adopt a flat CDM cosmology with (), and .
2 Observations and Data Reduction
In this section we present and discuss new multi-configuration VLA observations from project 21A-081. We observed UGC5205 in the L-band centered at 1413.8929 MHz in the D configuration on March 25, 2021 for 2 hr (1.5 hr on source). On June 13 and 15, 2021 we observed UGC5205 with an identical frequency tuning in the C configuration for 3.5 hr (2.5 hr on source) each, for a total of 5 hr on source. Phase referencing using the calibrator J0943-0819 was performed every three minutes. Once per observation, we performed flux density and bandpass calibration using the calibrator 3C138 for five minutes.
Initial flagging, flux density scaling, and calibration for the three measurement sets were performed with the Common Astronomy Software Applications (CASA; CASA Team et al. 2022) pipeline version 1.4.2111https://science.nrao.edu/facilities/vla/data-processing/pipeline/scripted-pipeline, with additional flagging, data reduction, and imaging performed with CASA version 6.4.3.27. We reduced each of the two C configuration scheduling blocks separately; we combined the reduced datasets from each block as the final step to produce the final C configuration dataset. We note that the C configuration data contained severe radio frequency interference (RFI) requiring manual flagging using the PLOTMS and FLAGDATA tasks.
For each configuration, we used the task TCLEAN to produce an initial image cube containing both the line and continuum emission. We imaged the data with a spectral resolution of 6.6 km/s and chose ‘Briggs’ weighting with a robust parameter of 0.3 to achieve an optimal compromise among sensitivity, angular resolution, and sidelobe suppression. The cell sizes used for imaging the C and D configuration datasets were 2.2 and 9 arcseconds, respectively. The HI emission associated with UGC5205 and MGC+00-25-010 spanned channels 224 to 252 (1575 km/s to 1395 km/s). We performed continuum subtraction using the CASA task UVCONTSUB before producing the final image cube for each configuration with TCLEAN. Our final C configuration image achieved an rms noise of and our final D configuration image reached an rms of .
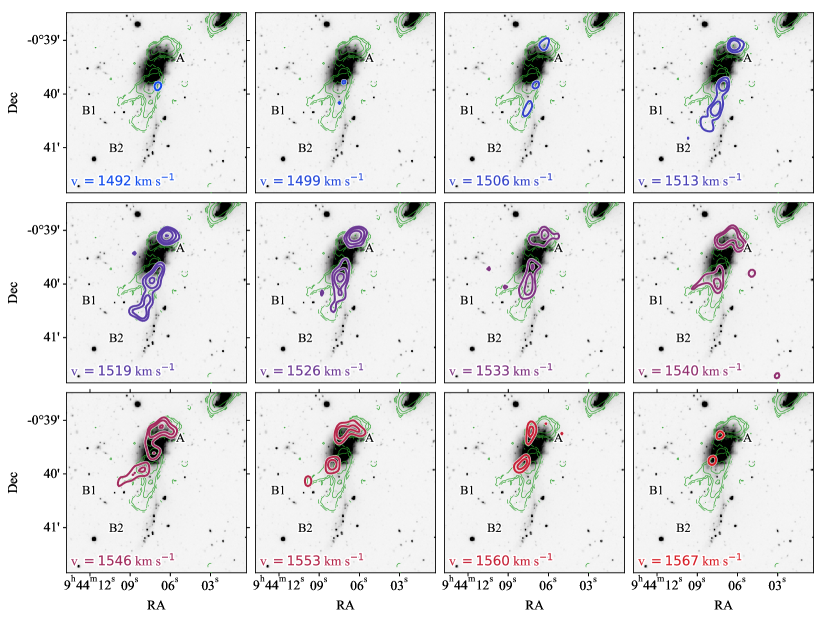
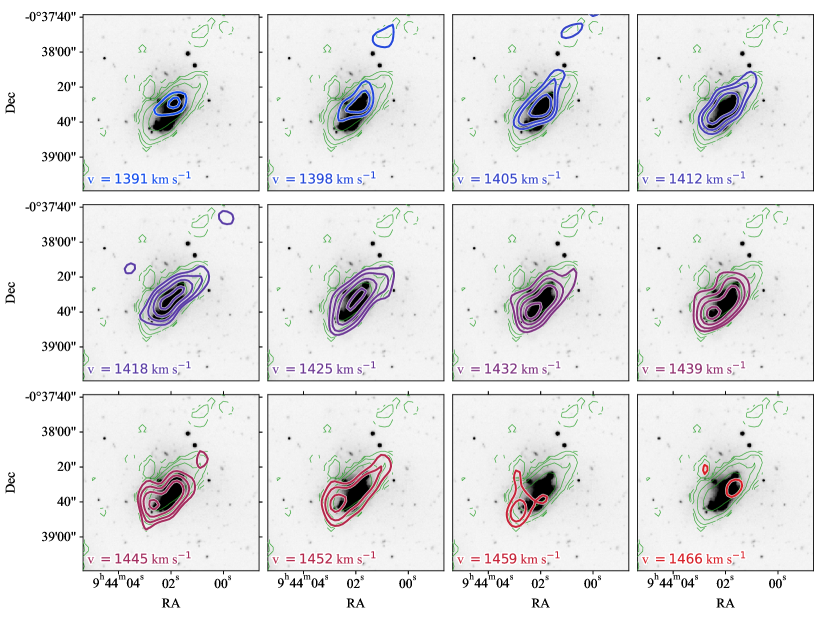
In the subsequent sections, we will consider the VLA data coincident with UGC5205 and with PGC027864 separately (in Section 3.2 and Section 3.3, respectively). For the reader’s convenience, however, we tabulate key VLA figures here. The C-array moment zero map of the system is shown in Figure 2, while the C-array moment one map of the system is shown in Figure 3. The moment zero map of the D-array data is shown in Figure 13. Channel maps of UGC5205 and PGC027864 are shown separately in Figure 5 and Figure 6, respectively.
3 Results
3.1 Optical Morphology
Before presenting the spatially resolved H I data obtained with VLA, we will briefly detail the optical morphology of the galaxy pair in order to provide context to the reader in interpreting the gas reservoirs of these two galaxies.
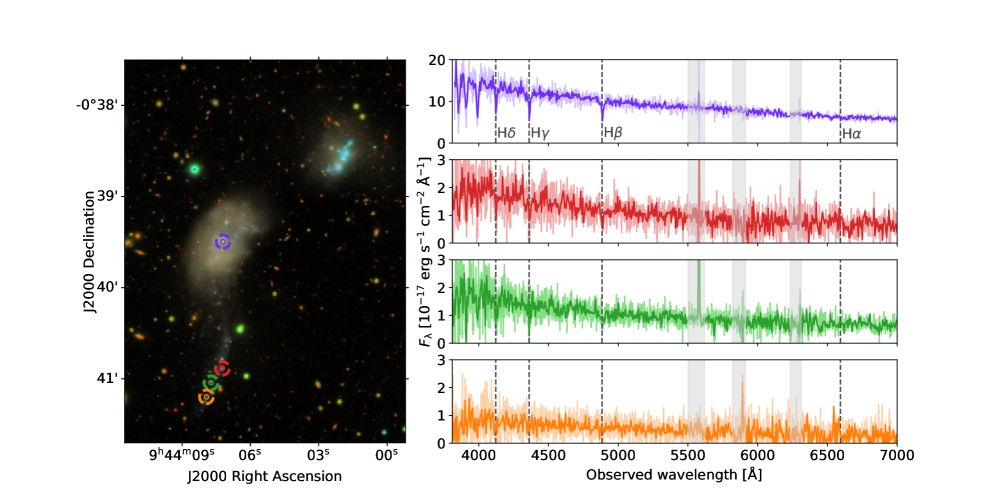
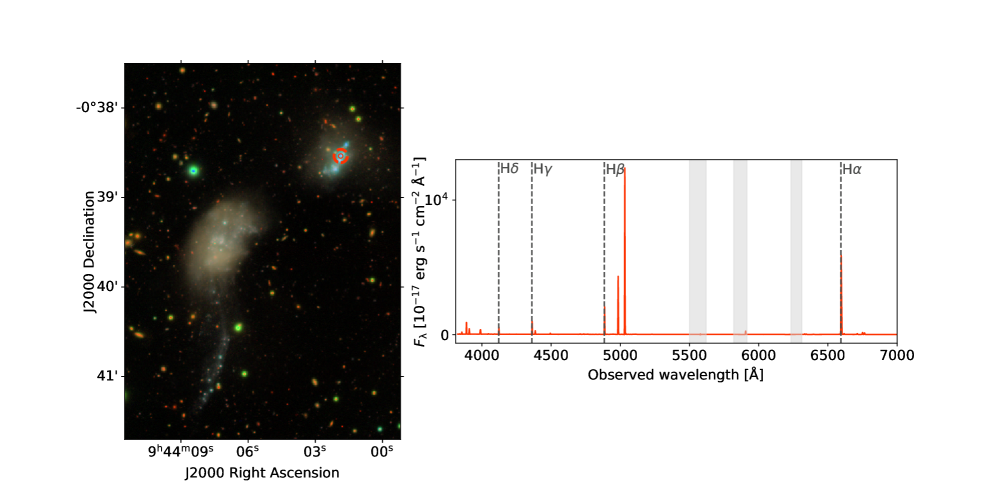
In Figure 1, we show an image from the Hyper-Suprime Camera data of the UGC5205/PGC027864 pair in the bands. Superposed on the image are the locations of the four SDSS fibers that took the spectra shown on the right-hand side. We point out a few key features of this interacting system. First, there is clearly a tidal feature stretching to the South of UGC5205. Likely this tail is associated with the ongoing interaction with PGC027864 to the North. The striking point, and the reason for our focus on UGC5205, is that despite the clear evidence of young stellar ages in the spectra (a point to which we will return more quantitatively in Section 3.5), there is no H detected at any position covered by the SDSS. Likewise an integral-field observation of the galaxy center shows no H emission (Pracy et al., 2012).
In contrast, as is clear from this three-color image, PGC027864 is star-bursting. The low metallicity and high star formation rate of this galaxy have been documented extensively (e.g., Shirazi & Brinchmann, 2012; Senchyna et al., 2017).
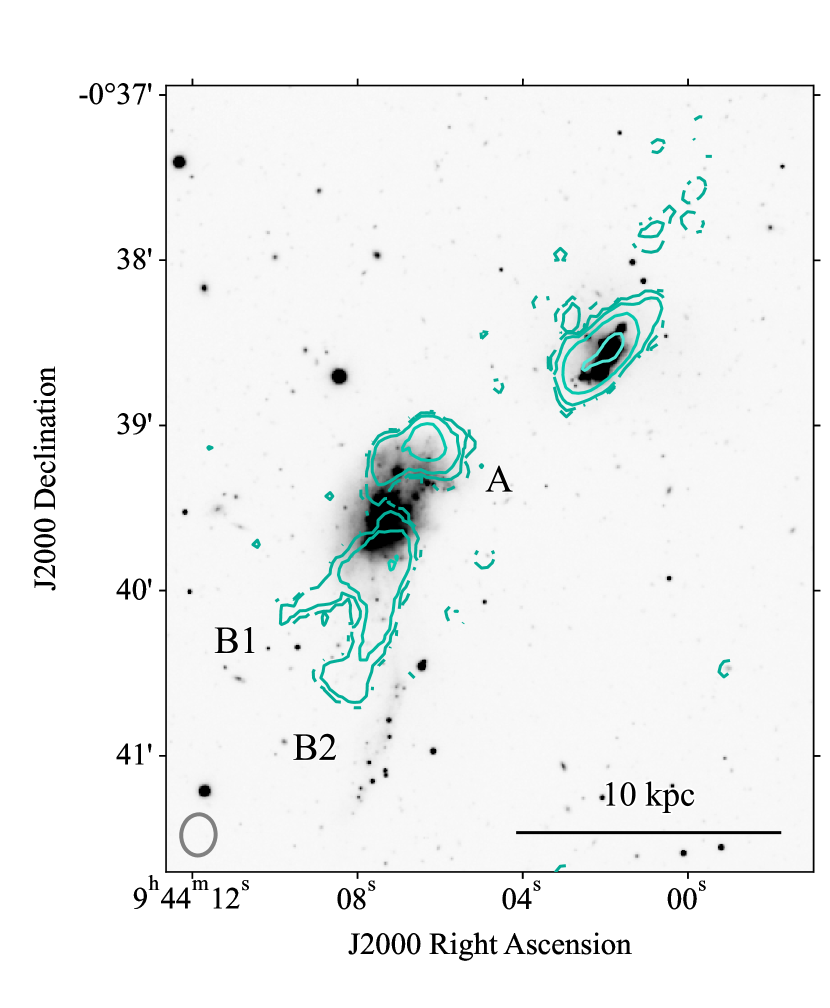
Having addressed the optical morphology, we can now consider the spatially resolved H I data for this galaxy pair. The moment 0 maps of the C-array VLA data are shown as contours overlaid on the HSC-SSP optical imaging of UGC5205 and PGC027864 in Figure 2. We see immediately see that the H I associated with UGC5205 has a complex morphology and the H I associated with PGC027864 is relatively less disturbed.
3.2 H I morphology and kinematics of UGC5205
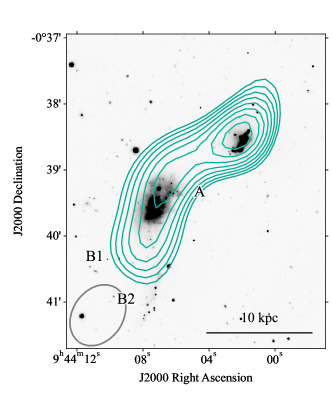
There are three primary components of the H I associated with UGC5205 that we will consider throughout the paper, as labeled in Figure 2. While there appears to be gas to the southeast of the galaxy (components B1 & B2) and gas to the northwest of the galaxy (component A), there is no detected concentration of H I in the galaxy center.
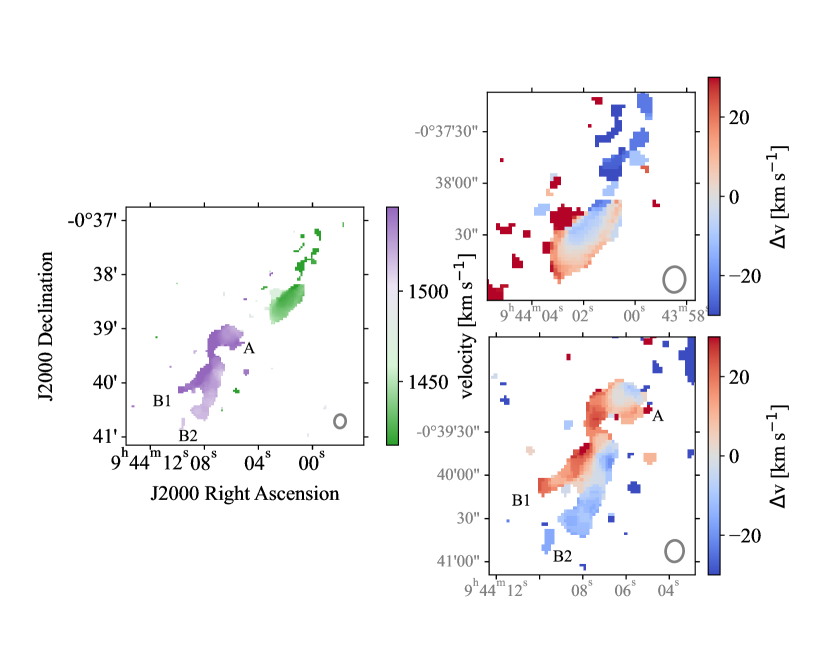
To better understand the nature of the complex H I morphology of UGC5205, we show the first moment maps in Figure 3. Here, the left panel shows the full extent of the H I associated with UGC5205 and PGC027864, while the right top and bottom panels show the difference in velocity from the peak heliocentric velocity of the H I profile of UGC5205 and PGC027864, respectively.
From the moment 1 maps, we note the varied velocities along B1 and B2. The systemic velocity of the stars, as measured from the absorption features in the SDSS spectra, is . Nearly all of the gas is redshifted relative to this velocity, with only the very tip of tail B2 overlapping in velocity with the galaxy systemic velocity. This velocity mismatch was previously established by single-dish spectra (see Section B.1). Tail B1 and component A share a similar velocity of 1500-1550 km s-1, and there is a small gradient across component A.
B2 extends away from the galaxy center in a similar direction as the stellar tidal feature. Because of the spatial proximity to the stellar tidal feature, and due to the narrow range of velocities we see in B1 and B2 in the moment 1 map, we suggest that B1 and B2 are tidal in nature. We show the channel maps of UGC5205 in Figure 5 – B1 and B2 span only a couple of channels, and we see little to no gradient along the features. Both B1 and B2 are redshifted relative to UGC5205, but their velocity structure seems quite typical for tidal tails.
The nature of Feature A, which sits between the two galaxies spatially but is much closer to the systemic velocity of UGC5205, is unclear. The total mass of H I associated with UGC5205 is . The mass in H I associated with the extended features is split almost equally between A and B1+B2. Specifically, as detailed in Table 2, component A has an H I mass of while the two tails have a combined mass of . The apertures used to measure the enclosed H I mass in each component are shown as dashed ellipses in Figure 4.
Component A spans a range of velocities ( km s-1). There is a some evidence for a velocity gradient across Component A, with the material to the East falling at higher velocity and the material to the West (closest to the companion galaxy) at the lowest velocity, as can be seen directly from the channel maps in Figure 5. Component A, recall, comprises roughly 50% of the total H I associated with UGC5205.
| Galaxy | Component | Velocity | Channel | a |
|---|---|---|---|---|
| km s-1 | ||||
| UGC5205 | total | 3.47 | ||
| A | 1.33 | |||
| B1 | 0 | 1.41 | ||
| B2 | ||||
| PGC027864 | total | 2.11 |
The overall morphological and kinematic picture of UGC5205 as unveiled by the VLA data reveals a highly disturbed gas reservoir. It is striking to note that the H I is systematically redshifted with respect to the systemic velocity of UGC5205 and that there is a strong dearth of H I in the center of the galaxy. Although a full suite of matched simulations is beyond the scope of this work, the asymmetry of the system in velocity space argues against a scenario in which the gas morphology results from purely secular effects – again pointing to a tidal origin of the gas tails around UGC5205.
Finally, we note that given the velocity difference (with respect to the stellar systemic velocity) and extent of the tidal features, and the expected total mass of the dwarf pair, the H I of UGC5205 should remain bound to UGC5205 and/or the eventual product of the merger between UGC5205 and PGC027864.
3.3 H I morphology and kinematics of PGC027864
In contrast to the complex morphology and kinematics of UGC5205, the H I reservoir of PGC027864 is relatively undisturbed. The systemic velocity of PGC027864 is 1640 (see Table 3), as measured from the SDSS spectra. Unlike UGC5205, the H I peak velocity is well-aligned with the optical emission lines of PGC027864.
In Figure 6 we present the channel maps for PGC027864. As is implied in Figure 3, we see a gradient in velocity, with the lowest-velocity gas arising from the North-west component of the galaxy (at km s-1), and the highest-velocity gas arising from the Southeast (at km s-1). The channel maps of PGC027864 show evidence for significant non-rotational motion, with emission in the southeast extending over a range of .
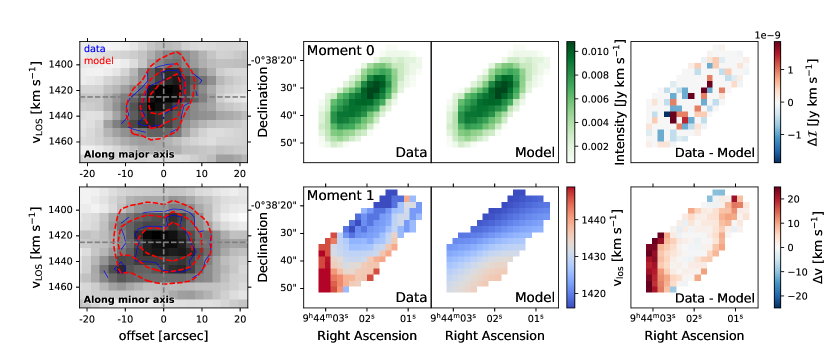
We also see evidence for a more regular rotation curve across the face of this galaxy, though as noted above there is significant evidence for disturbance. We estimate the rotational velocity of PGC027864 in two ways: by constructing an integrated spectrum of the H I associated with PGC027864 and measuring , the full width at half beam power, and using the 3D tilted ring fitter 3DBarolo, which is well-suited to low resolution kinematic analysis (Di Teodoro & Fraternali, 2015), to fit a rotation curve (and thus an associated ) to the VLA cube localized around PGC027864. We fix the inclination to deg following the published inclination from the HyperLEDA database. Following Ponomareva et al. (2021), for a well-ordered rotating disc galaxy these two quantities should be related as .
Our best-fitting 3DBarolo model is shown in Figure 7. We find an average , though we find that there is significant structure to the velocity map of PGC027864 that is not well-fit by the tilted ring model. This is not surprising given that there is significant 21cm emission by H I that has been stripped from the main body of the galaxy, as shown in Figure 2. When we construct an integrated spectrum containing all 21cm emission associated with PGC027864, we measure , somewhat higher than the expected expectation. When we exclude the emission from H I that is spatially offset from the main body of PGC027864, we find , in good agreement with the measurement from 3DBarolo.
Given these kinematic measures of the H I associated with PGC027864, we can attempt to place the galaxy on the baryonic Tully-Fisher relation (Ponomareva et al., 2021). We caution that we expect that both kinematic measures will be biased somewhat high given that the gas of PGC027864 shows evidence of disturbance. We estimate the total baryonic mass of PGC027864 as
| (1) |
where the multiplicative factor of 1.4 is a correction for the mass in Helium and heavier elements. We ignore the mass contribution of both because the gas reservoir is expected to be dominated by H I at these stellar masses, with contributing (Leroy et al., 2008; Kado-Fong et al., 2022b), and to follow literature norms. In particular, from the measured baryonic Tully-Fisher relation (bTFR) of Ponomareva et al. (2021), which traces the correlation between total baryonic mass and galaxy rotational velocity, we expect a baryonic mass of , where the uncertainty reflects both the uncertainty of the inferred velocity and the scatter in the bTFR. PGC027864 therefore lies within one sigma of the measured bTFR, which is consistent with the interpretation that ordered rotation dominates the H I velocity field.
3.4 Integrated Star Formation Rates: H and UV Estimates
Although UGC5205 shows no sign of H emission across its face, it is well-detected in the UV. The differing timescales over which H and UV emission trace star formation can therefore give us insight into the recent star formation history of UGC5205 and PGC027864.
We estimate the integrated star formation rate across the main bodies of UGC5205 and PGC027864 from both GALEX UV photometry and the SDSS H emission – or, in the case of UGC5205, an upper limit thereof. To prevent systematic offsets between the UV and H-derived star formation rates, we compute the -SFR and -SFR relations using the python implementation pythonfsps of the Flexible Stellar Population Synthesis (fsps, Conroy & Gunn, 2010) framework assuming the Binary Population and Spectral Synthesis (BPASS Eldridge & Stanway, 2016) stellar isochrone library and a Kroupa initial mass function (IMF) (Kroupa, 2001). We assume that the star formation rate has been constant for the past 10 Myr to compute and constant for the past 300 Myr to compute . This yields a conversion of:
| (2a) | |||
| (2b) |
These calibrations differ significantly from the Kennicutt (1998) conversions as published, but are within and of the conversions when the difference between the chosen IMF is taken into account.
We use imaging from the GALEX Medium Imaging Survey (MIS)222The GALEX observations used in this work can be found in the Mikulski Archive for Space Telescopes (MAST) via http://dx.doi.org/10.17909/qj70-dv28 (catalog 10.17909/qj70-dv28). to measure FUV and NUV fluxes in the main bodies of UGC5205 and PGC027864, where we determine the geometry of the elliptical aperture333We set the limit of the aperture to , in accordance with the approximate isophotal limit where the ellipse is defined as using the standard definition of the SExtractor geometric parameters set forth in (Bertin & Arnouts, 1996) using sep, a python implementation of the SExtractor object segmentation algorithm (Bertin & Arnouts, 1996). Galactic extinction in both bands is corrected for using the Schlafly & Finkbeiner (2011) galactic reddening measurements444Obtained via the IRSA Galactic Dust Reddening and Extinction database: http://dx.doi.org/10.26131/IRSA537 (catalog 10.26131/IRSA537).
The estimation of an H-based star formation rate is straightforward for PGC027864 and somewhat less so for UGC5205, given the lack of H across the main body of the galaxy.
We measure of PGC027864 from its galactic extinction-corrected SDSS spectrum, where we fit the H, [N II]6548Å, and [N II]6583Å lines simultaneously as equal-width Gaussians with a scalar continuum. We additionally fit H in order to correct for internal reddening via the Balmer decrement.
Let us now consider an upper limit for the equivalent width of the H emission in the main body of UGC5205. Integral Field Unit (IFU) spectroscopy from the Wide Field Spectrograph (WiFeS) did not detect H emission across the main body of UGC5205 (Pracy et al., 2012). The strong Balmer absorption lines in the blue imply an upper limit of across the main body of UGC5205 after stellar absorption corrections, but neither emission nor absorption were detected at the expected observed wavelength of H. We can therefore only place an upper limit on the H-based SFR of UGC5205. To be consistent with the H-based SFR we will estimate for PGC027864, we use the central SDSS spectrum of UGC5205 to estimate an upper limit on the H emission. As above, we fit the N II lines in the vicinity of H in addition to H, , , and . We fix the equivalent width of H to be half that of the other Balmer lines following González Delgado et al. (1999). From this procedure, we estimate an upper limit of Å after correction for stellar absorption and Å if we ignore the absorption correction.
To convert H equivalent widths to H luminosities, we adapt the method555In particular, we do not include the effect of stellar absorption, as we have already taken this into account during line fitting, or of redshift, given the proximity of our target galaxies. of Bauer et al. (2013) as follows:
| (3) |
where our absolute r-band magnitudes are tabulated for each galaxy in Table 3. We note that this method assumes that the equivalent width measured in the central SDSS spectrum is equal to the average equivalent width across the face of the galaxy. Our estimate is therefore likely to be biased high given that the SDSS fiber is placed on the galaxy’s central starburst (we show the placement of the SDSS fiber, as well as the optical spectrum of PGC027864, in Appendix A) – as such, the integrated H SFR for PGC027864 should be taken only as a rough estimate to demonstrate the galaxy’s starbursting nature.
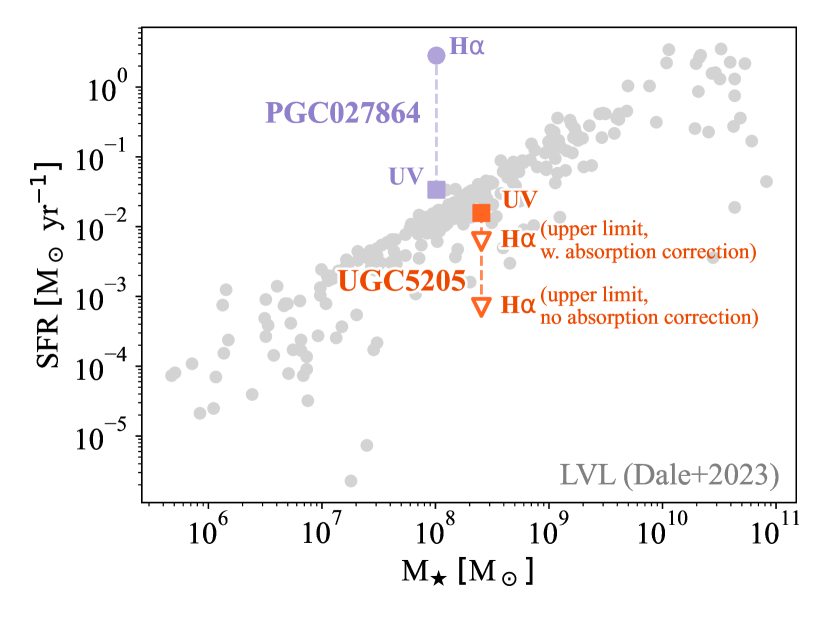
Figure 8 shows a comparison of our H and UV-based star formation rate estimates, along with a local comparison sample of Local Volume Legacy galaxies (Dale et al., 2023). Here, the filled square symbols show the UV-based SFRs of UGC5205 and PGC027864, while the filled circle (in the case of PGC027864) and the unfilled triangle (for UGC5205) show the H-based SFR and upper limit, respectively. Here, one may immediately notice that although the UV-based SFR estimates of UGC5205 and PGC027864 place both galaxies on the SFMS as defined by Dale et al. (2023), there has been a marked divergence in star formation behavior between the Myr timescales probed by UV emission and the Myr timescales probed by H emission. While the H-based SFR of PGC027864 places the galaxy well above the SFMS in the vigorously star-bursting regime, the H non-detection of UGC5205 indicates that star formation has very recently quenched in the galaxy. We will return to this divergence of recent star formation behavior in Section 4.
3.5 The Stellar Populations of UGC5205
The ionized and neutral gas in UGC5205 show a coordinated story of a recently quenched star formation history. Referring back to Figure 1, we see that the stellar continuum and absorption features are clearly detected in the SDSS spectra. Thus, the star formation history as determined from stellar population synthesis can reveal an independent view into the quenching timescale of the galaxy.
We model the star formation history of UGC5205 based on the four SDSS spectra shown in Figure 1. We utilize Prospector (Johnson & Leja, 2017; Leja et al., 2017; Johnson et al., 2021) to fit non-parametric star formation histories independently to the four spectra. Allowing for a flexible and non-parametric star-formation history is crucial to capture the very recent burst and then truncation that defines post-starburst galaxies (Suess et al., 2022a).
We fix the redshift to the systemic redshift of UGC5205 as measured from the stellar absorption features and assume a Chabrier IMF (Chabrier, 2003). We set a uniform prior on the stellar mass in each spatial region between and and a uniform prior on the stellar metallicity from . We use the Kriek & Conroy (2013) dust law, allowing the power-law slope to vary between and 0.4 and the attenuation to vary between . We assume young stars are attenuated twice as much as older stars, and fix the shape of the IR SED following the Draine & Li (2007) dust emission templates with , , and .666We have also run the fit using and based on the values quoted by Draine & Li (2007) for the low-mass galaxies NGC5195 and Mrk33. We find that altering these parameters do not significantly alter our inferred SFHs. We place a uniform prior on the galaxy’s intrinsic velocity dispersion between . Following Suess et al. (2022b), we include both a spectroscopic jitter term and the Prospector pixel outlier model, intended to prevent bad spectral pixels from skewing the output.
The model includes three early time bins ( Gyr) with fixed width, then five bins with uniform stellar mass formed but flexible time edges, such that the model can determine the start and end of star formation, then a final bin with flexible time edges and flexible stellar mass formed to capture any low-level recent star formation; Suess et al. (2022a) show that this model is robust to determine quenching time scales.
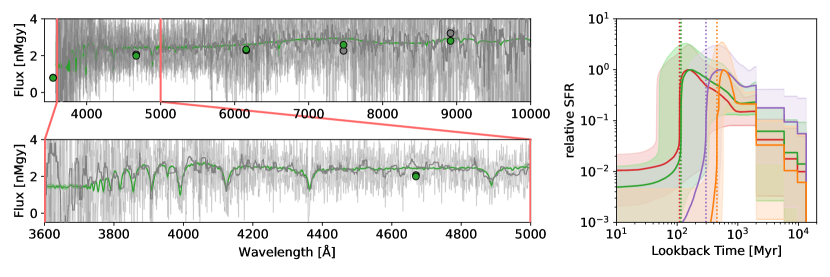
The derived star formation histories of each SDSS spectrum, along with an example spectrophotometric fit, are shown in Figure 9. We remind the reader that the three off-body spectra (green, red, and purple in Figure 9) are centered on bright young stellar clusters along the stellar tidal tail of UGC5205.
We recover a broadly consistent star formation history from all spectra considered, though we caution against an over-interpretation of the seemingly earlier quenching time of the central spectrum (orange) due to the more complex stellar population filling the central fiber. The SDSS spectra are well-represented by a post-starburst system that underwent a coordinated burst and subsequent quenching event 100-300 Myr ago. This is highly consistent with the picture of a post-starburst system presented in Figure 8, and places a timescale for the quenching event that is independent of the ionized gas emission.
3.6 Neighboring Galaxies
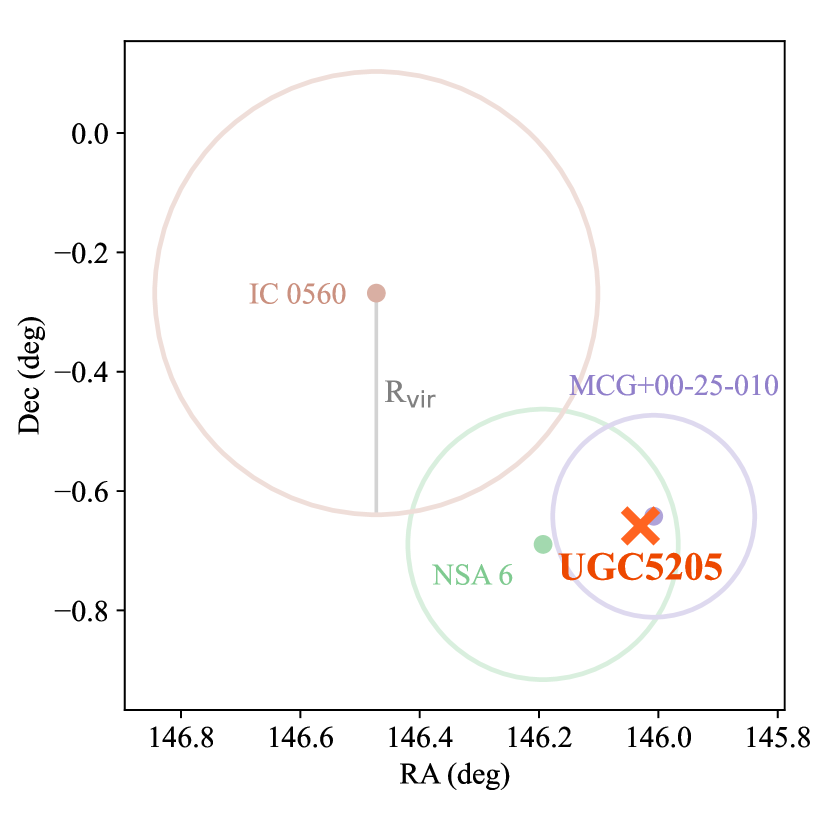
By standard definitions, UGC5205 is considered a field dwarf galaxy in that it is separated by more than 2.5 Mpc and from the nearest massive galaxy (Geha et al., 2012). However, in addition to PGC027864, there are two galaxies in the vicinity of UGC5205, NSA6 and IC0560.
As shown in Table 3, NSA6 is close in stellar mass to UGC5205 and PGC027864. IC0560, with an absolute 2MASS Ks-band magnitude of (Skrutskie et al., 2006) and an estimated stellar mass of , lies just under the cutoff to be considered massive by the Geha et al. (2012) criterion ( or ). These galaxies are selected to be within two projected virial radii of UGC5205 at their redshift and within , though both are significantly offset () than PGC027864 () from UGC5205 in line-of-sight velocity.
In Figure 10 we show the position of UGC5205 with respect to these possible neighbor galaxies, where the bold cross indicates UGC5205 and the filled points indicate the three potential neighbors. The large unfilled circles around each filled point indicate the on-sky size of the galaxy’s estimated virial radius at its redshift, where we use the stellar-to-halo mass relation of Behroozi et al. (2019) to make a crude estimate of of each galaxy and estimate its virial radius as
| (4) |
following Bryan et al. (1999), where is the critical density. From this initial estimate, we find that UGC5205 lies within the virial radius of PGC027864 and NSA6, but outside that of IC0560. This separation from IC0560 is especially important given that the star formation behavior of UGC5205 is unusual for a non-satellite galaxy. As detailed in Appendix C, we find that IC0560 is unable to exert sufficient ram pressure to strip the gas reservoir of UGC5205.
We detail the optical properties of all three galaxies in the vicinity of UGC5205 (and UGC5205 itself) in Table 3. We retrieve redshifts and absolute r-band magnitudes for each galaxy from the NASA Sloan Atlas (Blanton et al., 2011) with the exception of UGC5205, where we remeasure the redshift from the absorption features in the SDSS spectrum placed on the main body of the galaxy. Stellar mass estimates are then made using the and -band NSA photometry and with the color-mass relation of Kado-Fong et al. (2022a), which was calibrated against SED-based stellar mass estimates in the dwarf regime.
| Galaxy | ||||
|---|---|---|---|---|
| kpc | ||||
| UGC5205 | 1500 | -16.24 | – | 2.54 |
| NSA 6 | 1228 | -15.27 | 50.6 | 1.22 |
| PGC027864 | 1449 | -16.24 | 9.8 | 1.02 |
| IC 0560 | 1848 | -19.15 | 271.0 | 193 |
Note. — The optical properties of UGC5205 and galaxies within two projected virial radii of UGC5205. Redshifts and absolute r-band magnitudes are drawn from the NASA Sloan Atlas except for UGC5205, wherein the redshift was remeasured from optical absorption features in the SDSS spectrum of the main body. The stellar mass of each galaxy was inferred from the relation measured by Kado-Fong et al. (2022a), which was calibrated from galaxies of this stellar mass range.
4 Discussion
Although UGC5205 is only a single galaxy, the existence of a quenched dwarf in the field is significant to our understanding of low-mass galaxy star formation regulation due to their marked rarity at the stellar mass of UGC5205 (Geha et al., 2012). In this discussion, we will consider both how UGC5205 came to be quenched and what implications the existence of a quenched field dwarf has on our understanding of star formation regulation in isolated dwarf galaxies.
4.1 The Quenching Timescale of UGC5205
The combination of a lack of H emission, a strong UV detection (Section 3.4), and a predominantly young stellar population (Section 3.5) paint a consistent story of a galaxy that underwent a global quenching event Myr ago.
We can also make a rough, back of the envelope calculation of the lookback time at which the tidal features seen in the H I of UGC5205 were launched based on their extent and velocity relative to the systemic velocity of UGC5205. Due to the complex dynamics of the dwarf interaction, a hydrodynamic simulation would be necessary to truly place a timescale on the merger interaction, but here we can at least make a rough consistency check of the merger-driven quenching picture.
The H I tails B1 and B2 are roughly 56″ and 72″ in extent, which corresponds to 5.8 kpc and 7.5 kpc at the distance of UGC5205 assuming an angular diameter distance of Mpc based on its recessional velocity of . Their mean velocities, as determined by a geometric mean of the moment one map, are and , respectively. If we simply estimate the creation timescale assuming a constant velocity, we arrive at a launching lookback time of Myr and Myr for B1 and B2 assuming that the transverse velocity is equal to the difference in velocity between the tidal tail and the systemic stellar velocity of UGC5205. This is consistent with the picture wherein the tidal features were pulled out of the H I reservoir during or shortly after the starburst event, and strengthens the interpretation of a interaction-driven quenching picture for UGC5205.
4.2 HI Properties
Prior to the resolved H I data presented in this work, single dish observations revealed a large reservoir of cold gas associated with UGC5205 (Springob et al., 2005). It was unclear, then, how UGC5205 could support a large reservoir of H I and yet be completely devoid of recent star formation.
The spatially-resolved VLA observations presented in this work show that the bulk of the H I reservoir of UGC5205 is indeed not spatially coincident with the bulk of the stellar mass of the galaxy and has instead been pulled out into two large tidal tails. Furthermore, both tails are offset in velocity from the systemic redshift as measured from stellar absorption features in the same direction. Indeed, the H I morphology of UGC5205 suggests that the lack of recent star formation in the galaxy is borne out of a dearth of cold gas in the galaxy center and not an anomalously low star formation efficiency, as may be suggested from single dish observations alone.
Along these lines, we find that the H I morphology of PGC027864 – the starbursting neighbor of UGC5205 – is relatively undisturbed. With the majority of its cold gas remaining near its center, PGC027864 has much more cold gas available for star formation than UGC5205 despite a similar total H I mass. The difference in the spatial distribution of the cold gas provides a clear explanation for the divergent star formation behavior of UGC5205 and PGC027864. Furthermore, the divergence of morphological and kinematic properties of this dwarf pair – despite their similar global H I properties – underlines the need for interferometric imaging to shed light on the physical processes that shape galaxies’ gas reservoirs.
4.3 Implications for Quenching Dwarfs in the Field
It has been shown that the build-up of a quiescent galaxy population at is negligible for non-satellite galaxies. The properties of UGC5205 demonstrate that dwarfs can indeed quench outside of the influence of a massive host for short timescales ( Myr), while the dearth of a larger population of similar galaxies implies that UGC5205 will not remain quenched.
The spatial distribution of the H I associated with UGC5205 implies that the galaxy has entered a period of quiescence through its interaction with the nearby dwarf PGC027864. In this section, we will explore the implication of UGC5205’s quenched status on the overall occurrence rate of quenched field galaxies.
4.3.1 Dwarf-Dwarf Mergers
Both projected distance and velocity difference point to a clear ongoing interaction between UGC5205 and PGC027864. Indeed, PGC027864 is currently undergoing a strong starburst; such starbursting periods have been shown to correlate with major mergers between low-mass galaxies (Stierwalt et al., 2015; Privon et al., 2017; Kado-Fong et al., 2020). As shown in Figure 4 and Figure 6, however, there is little evidence to indicate a disturbance in the H I reservoir of PGC027864. This asymmetry in outcomes implies an asymmetry in the pair which allows PGC027864 to retain its H I reservoir while presumably instigating significant tidal disruption in UGC5205, despite their similar stellar masses (see Table 3). Potential asymmetries include highly different mass-to-light ratios (though we note that we have demonstrated that PGC027864 lies on the baryonic Tully-Fisher Relation) or a difference in the concentration of the original H I profile which made UGC5205 relatively more susceptible to stripping.
Regardless of the reason for the asymmetry, however, the existence of UGC5205 shows that interactions between low-mass galaxies may provide a viable way to quench star formation in field dwarfs. The tidal morphology and kinematics of the H I around UGC5205 as well as the coincident starburst and tidal feature creation paint a consistent picture in which the interaction between UGC5205 and PGC027864 both triggered star formation in PGC027864 and quenched star formation in UGC5205.
Finally, as briefly noted in Section 3.2, the gaseous tidal features around UGC5205 remain bound to the galaxy. This means that the cold gas associated with UGC5205 should eventually reaccrete onto the system and reignite star formation. In particular, using the approximate halo properties from Section 3.6 and the halo mass-concentration relation of Child et al. (2018), we estimate a freefall time of
| (5) |
at the largest point of extent of the H I tidal tails. From our inferred SFH of Section 3.5, UGC5205 has already been quenched for Myr, implying that the total time that UGC5205 will be quenched by this interaction is Myr. We therefore suggest that low-mass interactions such as the system in this work provide an avenue to temporarily quench star formation. Such a mechanism is in good agreement with observations that quenched dwarfs account for, at most, a few percent of low-mass galaxies in the field (Geha et al., 2012).
4.3.2 Low-Mass Group/Filament
Interestingly, UGC5205 is located around 2 Mpc from another quenched field dwarf of stellar mass , COSMOS-dw1 (Polzin et al., 2021). The projected distance places these two galaxies a factor of several beyond each other’s virial radii given their velocities, making a direct interaction between the dwarfs highly unlikely. However, the relative proximity of two independently discovered highly rare objects suggests that a larger scale environmental factor may be at play in producing these quenched field dwarfs.
Polzin et al. (2021) suggested internal feedback from star formation to be the mechanism which has temporarily quenched COSMOS-dw1. This interpretation is more feasible for COSMOS-dw1 given that it is a factor of lower in stellar mass than UGC5205, but does not explain why two quenched dwarfs would be found within a few Mpc of each other. Similarly, our interpretation that the interaction with PGC027864 has temporarily quenched UGC5205 connects more directly to the environment of UGC5205 but does not directly imply the existence of another quenched dwarf at a separation larger than several virial radii.
The moderate spatial proximity of these two quenched systems is especially puzzling given that UGC5205 has been identified as a void galaxy (Pustilnik et al., 2019). This makes it difficult to envision a scenario in which a large-scale cosmic filament would be responsible for quenching both UGC5205 and COSMOS-dw1. However, we note that the void catalog of Pustilnik et al. (2019) was constructed using only those galaxies brighter than ; it is thus possible that UGC5205 and COSMOS-dw1 are connected by a large-scale structure traced only by low-mass galaxies. At this point, an attempt to define such a structure based on the existence of UGC5205 and COSMOS-dw1 would be highly speculative. A further spectroscopic exploration of other low-mass galaxies in the vicinity of these two quenched field dwarfs will be necessary to more conclusively establish a link between the unusual quenched nature of these two galaxies.
5 Conclusions
In this work we have presented new spatially resolved H I observations of the interacting field dwarf system UGC5205 and PGC027864. Despite the fact that they are remarkably similar in their integrated UV, optical, and H I properties, one dwarf is quenched ( Å) and the other is starbursting ( Å) in this peculiar pair. The existence of UGC5205, a quenched dwarf in the field, is intriguing due to the fact that the quiescent field dwarf population is still poorly understood at this stellar mass. Previous works have put an upper limit on the quenched fraction at the stellar mass of UGC5205, but this galaxy represents a novel opportunity to directly understand the nature of quenching processes at this mass scale.
With our new VLA observations, we have shown that:
-
•
Approximately half of the H I reservoir of UGC5205 has been pulled into large tidal tails that are spatially and kinematically offset from the main stellar body of UGC5205, making most of the cold gas in the galaxy unavailable for star formation despite a sizable total H I mass.
-
•
The H I reservoir of PGC027864, conversely, shows only minor disturbance. The core can be fit by a tilted ring model, with some emission from tidal H I visible along the axis of the dwarf pair.
This asymmetry in H I morphology provides a clear explanation for the marked divergence in the apparent global star formation efficiency (defined simply as ) of UGC5205 and PGC027864.
With this morphological information in hand, and given the lack of other likely disrupting bodies, we suggest that it is the ongoing interaction with PGC027864 that has temporarily quenched UGC5205. This interpretation is supported by the fact that the timing of the quenching event in UGC5205, as inferred both by the UV and H emission (or lack thereof, Section 3.4) and from stellar population fitting of UGC5205 (Section 3.5), is coincident with the rough lookback time at which the gaseous tidal features were created (Section 4.1) Under this assertion, we can examine the implications of UGC5205 on the build-up of a population of quenched dwarfs:
-
•
UGC5205 and PGC027864 show that dwarf-dwarf interactions are not only able to trigger starbursts, but also quench star formation. Both phenomena can moreover happen simultaneously in the same interaction.
-
•
Given that the H I in UGC5205 likely remains bound to the system, the sizable cold gas reservoir should eventually reaccrete and reignite star formation in the system. Based off our inferred SFH and an estimate of the freefall time at the position of the tidal features, we estimate a total quenched period of Myr. This suggests that interaction-driven quenching events are temporary in low-mass systems.
-
•
UGC5205 is 2 Mpc away from the lower mass quenched field dwarf COSMOS-dw1. Given their low masses, this distance is too far for a direct interaction between the quenched dwarfs. Furthermore, while UGC5205 is highly consistent with a pair interaction quenching picture, COSMOS-dw1 has been suggested to have self-quenched through star formation feedback. However, it is possible that a large-scale structure populated by low-mass objects could increase the efficacy of both quenching mechanisms.
The dwarf pair demonstrates that the star formation behavior of low-mass galaxies is sensitive not only to the presence of massive host galaxies, as has been studied in depth in the literature (see, e.g. Geha et al., 2012, 2017; Carlsten et al., 2020, 2021; Mao et al., 2021; Carlsten et al., 2022), but also to the presence of other low-mass galaxies, which has previously been explored only in the enhanced star formation scenario (see, e.g. Stierwalt et al., 2015; Pearson et al., 2016; Privon et al., 2017; Kado-Fong et al., 2020; Subramanian et al., 2023).
The existence of UGC5205 and its low-mass neighbors demonstrate the potential of a new avenue for understanding star formation regulation in dwarf galaxies outside the influence of a massive host. Characterizing just one of these rare quiescent field dwarfs has shed new light on the role of low-mass interactions in regulating dwarf star formation – assembling a larger sample of quenched field dwarfs would provide even more novel constraints on the duty cycle and efficiency of such quenching events. TiNy Titans has established a sample of dwarf multiples for galaxies with SDSS spectroscopy; the upcoming generation of deeper surveys will, on timescales within a few years, push this pair-finding out to larger volumes and lower masses (Darragh-Ford et al., 2022; Luo et al., 2023) and shed new light into the regulation and evolution of star formation in low-mass galaxies.
The authors thank George Privon for helpful conversations that improved the quality of this manuscript. The authors also thank the anonymous referee for their insightful comments that improved the quality of this work.
EKF gratefully acknowledges support from the Yale Center for Astronomy and Astrophysics Prize Postdoctoral Fellowship.
The National Radio Astronomy Observatory is a facility of the National Science Foundation operated under cooperative agreement by Associated Universities, Inc.
Basic research in radio astronomy at the U.S. Naval Research Laboratory is supported by 6.1 Base Funding.
The Hyper Suprime-Cam (HSC) collaboration includes the astronomical communities of Japan and Taiwan, and Princeton University. The HSC instrumentation and software were developed by the National Astronomical Observatory of Japan (NAOJ), the Kavli Institute for the Physics and Mathematics of the Universe (Kavli IPMU), the University of Tokyo, the High Energy Accelerator Research Organization (KEK), the Academia Sinica Institute for Astronomy and Astrophysics in Taiwan (ASIAA), and Princeton University. Funding was contributed by the FIRST program from the Japanese Cabinet Office, the Ministry of Education, Culture, Sports, Science and Technology (MEXT), the Japan Society for the Promotion of Science (JSPS), Japan Science and Technology Agency (JST), the Toray Science Foundation, NAOJ, Kavli IPMU, KEK, ASIAA, and Princeton University.
This paper makes use of software developed for Vera C. Rubin Observatory. We thank the Rubin Observatory for making their code available as free software at http://pipelines.lsst.io/.
This paper is based on data collected at the Subaru Telescope and retrieved from the HSC data archive system, which is operated by the Subaru Telescope and Astronomy Data Center (ADC) at NAOJ. Data analysis was in part carried out with the cooperation of Center for Computational Astrophysics (CfCA), NAOJ. We are honored and grateful for the opportunity of observing the Universe from Maunakea, which has the cultural, historical and natural significance in Hawaii.
Based on observations made with the NASA Galaxy Evolution Explorer. GALEX is operated for NASA by the California Institute of Technology under NASA contract NAS5-98034.
Funding for the SDSS and SDSS-II has been provided by the Alfred P. Sloan Foundation, the Participating Institutions, the National Science Foundation, the U.S. Department of Energy, the National Aeronautics and Space Administration, the Japanese Monbukagakusho, the Max Planck Society, and the Higher Education Funding Council for England. The SDSS Web Site is http://www.sdss.org/. The SDSS is managed by the Astrophysical Research Consortium for the Participating Institutions. The Participating Institutions are the American Museum of Natural History, Astrophysical Institute Potsdam, University of Basel, University of Cambridge, Case Western Reserve University, University of Chicago, Drexel University, Fermilab, the Institute for Advanced Study, the Japan Participation Group, Johns Hopkins University, the Joint Institute for Nuclear Astrophysics, the Kavli Institute for Particle Astrophysics and Cosmology, the Korean Scientist Group, the Chinese Academy of Sciences (LAMOST), Los Alamos National Laboratory, the Max-Planck-Institute for Astronomy (MPIA), the Max-Planck-Institute for Astrophysics (MPA), New Mexico State University, Ohio State University, University of Pittsburgh, University of Portsmouth, Princeton University, the United States Naval Observatory, and the University of Washington.
References
- Bauer et al. (2013) Bauer, A. E., Hopkins, A. M., Gunawardhana, M., et al. 2013, MNRAS, 434, 209, doi: 10.1093/mnras/stt1011
- Behroozi et al. (2019) Behroozi, P., Wechsler, R. H., Hearin, A. P., & Conroy, C. 2019, MNRAS, 488, 3143, doi: 10.1093/mnras/stz1182
- Bertin & Arnouts (1996) Bertin, E., & Arnouts, S. 1996, A&AS, 117, 393, doi: 10.1051/aas:1996164
- Besla et al. (2018) Besla, G., Patton, D. R., Stierwalt, S., et al. 2018, MNRAS, 480, 3376, doi: 10.1093/mnras/sty2041
- Blanton et al. (2011) Blanton, M. R., Kazin, E., Muna, D., Weaver, B. A., & Price-Whelan, A. 2011, AJ, 142, 31, doi: 10.1088/0004-6256/142/1/31
- Blanton & Moustakas (2009) Blanton, M. R., & Moustakas, J. 2009, ARA&A, 47, 159, doi: 10.1146/annurev-astro-082708-101734
- Bryan et al. (1999) Bryan, G. L., Machacek, M., Anninos, P., & Norman, M. L. 1999, ApJ, 517, 13, doi: 10.1086/307173
- Carlsten et al. (2020) Carlsten, S. G., Greco, J. P., Beaton, R. L., & Greene, J. E. 2020, ApJ, 891, 144, doi: 10.3847/1538-4357/ab7758
- Carlsten et al. (2022) Carlsten, S. G., Greene, J. E., Beaton, R. L., Danieli, S., & Greco, J. P. 2022, ApJ, 933, 47, doi: 10.3847/1538-4357/ac6fd7
- Carlsten et al. (2021) Carlsten, S. G., Greene, J. E., Greco, J. P., Beaton, R. L., & Kado-Fong, E. 2021, ApJ, 922, 267, doi: 10.3847/1538-4357/ac2581
- CASA Team et al. (2022) CASA Team, Bean, B., Bhatnagar, S., et al. 2022, PASP, 134, 114501, doi: 10.1088/1538-3873/ac9642
- Chabrier (2003) Chabrier, G. 2003, PASP, 115, 763, doi: 10.1086/376392
- Child et al. (2018) Child, H. L., Habib, S., Heitmann, K., et al. 2018, ApJ, 859, 55, doi: 10.3847/1538-4357/aabf95
- Conroy & Gunn (2010) Conroy, C., & Gunn, J. E. 2010, ApJ, 712, 833, doi: 10.1088/0004-637X/712/2/833
- Dale et al. (2023) Dale, D. A., Boquien, M., Turner, J. A., et al. 2023, AJ, 165, 260, doi: 10.3847/1538-3881/accffe
- Darragh-Ford et al. (2022) Darragh-Ford, E., Wu, J. F., Mao, Y.-Y., et al. 2022, arXiv e-prints, arXiv:2212.07433, doi: 10.48550/arXiv.2212.07433
- Di Teodoro & Fraternali (2015) Di Teodoro, E. M., & Fraternali, F. 2015, MNRAS, 451, 3021, doi: 10.1093/mnras/stv1213
- Draine & Li (2007) Draine, B. T., & Li, A. 2007, ApJ, 657, 810, doi: 10.1086/511055
- Eldridge & Stanway (2016) Eldridge, J. J., & Stanway, E. R. 2016, MNRAS, 462, 3302, doi: 10.1093/mnras/stw1772
- Geha et al. (2012) Geha, M., Blanton, M. R., Yan, R., & Tinker, J. L. 2012, ApJ, 757, 85, doi: 10.1088/0004-637X/757/1/85
- Geha et al. (2017) Geha, M., Wechsler, R. H., Mao, Y.-Y., et al. 2017, ApJ, 847, 4, doi: 10.3847/1538-4357/aa8626
- González Delgado et al. (1999) González Delgado, R. M., Leitherer, C., & Heckman, T. M. 1999, ApJS, 125, 489, doi: 10.1086/313285
- Gunn & Gott (1972) Gunn, J. E., & Gott, J. Richard, I. 1972, ApJ, 176, 1, doi: 10.1086/151605
- Hopkins et al. (2008) Hopkins, P. F., Hernquist, L., Cox, T. J., & Kereš, D. 2008, ApJS, 175, 356, doi: 10.1086/524362
- Izotov & Thuan (2016) Izotov, Y. I., & Thuan, T. X. 2016, MNRAS, 457, 64, doi: 10.1093/mnras/stv2957
- Johnson & Leja (2017) Johnson, B., & Leja, J. 2017, bd-j/prospector: Initial release, v0.1, Zenodo, Zenodo, doi: 10.5281/zenodo.1116491
- Johnson et al. (2021) Johnson, B. D., Leja, J., Conroy, C., & Speagle, J. S. 2021, ApJS, 254, 22, doi: 10.3847/1538-4365/abef67
- Kado-Fong et al. (2020) Kado-Fong, E., Greene, J. E., Huang, S., et al. 2020, ApJ, 900, 163, doi: 10.3847/1538-4357/abacc2
- Kado-Fong et al. (2022a) Kado-Fong, E., Greene, J. E., Huang, S., & Goulding, A. 2022a, ApJ, 941, 11, doi: 10.3847/1538-4357/ac9964
- Kado-Fong et al. (2022b) Kado-Fong, E., Kim, C.-G., Greene, J. E., & Lancaster, L. 2022b, ApJ, 939, 101, doi: 10.3847/1538-4357/ac9673
- Kennicutt (1998) Kennicutt, Jr., R. C. 1998, ARA&A, 36, 189, doi: 10.1146/annurev.astro.36.1.189
- Koribalski et al. (2004) Koribalski, B. S., Staveley-Smith, L., Kilborn, V. A., et al. 2004, AJ, 128, 16, doi: 10.1086/421744
- Kriek & Conroy (2013) Kriek, M., & Conroy, C. 2013, ApJ, 775, L16, doi: 10.1088/2041-8205/775/1/L16
- Kroupa (2001) Kroupa, P. 2001, MNRAS, 322, 231, doi: 10.1046/j.1365-8711.2001.04022.x
- Leja et al. (2017) Leja, J., Johnson, B. D., Conroy, C., van Dokkum, P. G., & Byler, N. 2017, ApJ, 837, 170, doi: 10.3847/1538-4357/aa5ffe
- Leroy et al. (2008) Leroy, A. K., Walter, F., Brinks, E., et al. 2008, AJ, 136, 2782, doi: 10.1088/0004-6256/136/6/2782
- Luo et al. (2023) Luo, Y., Leauthaud, A., Greene, J., et al. 2023, arXiv e-prints, arXiv:2305.19310, doi: 10.48550/arXiv.2305.19310
- Mao et al. (2021) Mao, Y.-Y., Geha, M., Wechsler, R. H., et al. 2021, ApJ, 907, 85, doi: 10.3847/1538-4357/abce58
- Oppenheimer et al. (2016) Oppenheimer, B. D., Crain, R. A., Schaye, J., et al. 2016, MNRAS, 460, 2157, doi: 10.1093/mnras/stw1066
- Pearson et al. (2016) Pearson, S., Besla, G., Putman, M. E., et al. 2016, MNRAS, 459, 1827, doi: 10.1093/mnras/stw757
- Polzin et al. (2021) Polzin, A., van Dokkum, P., Danieli, S., Greco, J. P., & Romanowsky, A. J. 2021, ApJ, 914, L23, doi: 10.3847/2041-8213/ac024f
- Ponomareva et al. (2021) Ponomareva, A. A., Mulaudzi, W., Maddox, N., et al. 2021, MNRAS, 508, 1195, doi: 10.1093/mnras/stab2654
- Pracy et al. (2012) Pracy, M. B., Owers, M. S., Couch, W. J., et al. 2012, MNRAS, 420, 2232, doi: 10.1111/j.1365-2966.2011.20188.x
- Privon et al. (2017) Privon, G. C., Stierwalt, S., Patton, D. R., et al. 2017, ApJ, 846, 74, doi: 10.3847/1538-4357/aa8560
- Pustilnik et al. (2019) Pustilnik, S. A., Tepliakova, A. L., & Makarov, D. I. 2019, MNRAS, 482, 4329, doi: 10.1093/mnras/sty2947
- Quai et al. (2021) Quai, S., Hani, M. H., Ellison, S. L., Patton, D. R., & Woo, J. 2021, MNRAS, 504, 1888, doi: 10.1093/mnras/stab988
- Schlafly & Finkbeiner (2011) Schlafly, E. F., & Finkbeiner, D. P. 2011, ApJ, 737, 103, doi: 10.1088/0004-637X/737/2/103
- Senchyna et al. (2017) Senchyna, P., Stark, D. P., Vidal-García, A., et al. 2017, MNRAS, 472, 2608, doi: 10.1093/mnras/stx2059
- Senchyna et al. (2022) Senchyna, P., Stark, D. P., Charlot, S., et al. 2022, ApJ, 930, 105, doi: 10.3847/1538-4357/ac5d38
- Shirazi & Brinchmann (2012) Shirazi, M., & Brinchmann, J. 2012, MNRAS, 421, 1043, doi: 10.1111/j.1365-2966.2012.20439.x
- Skrutskie et al. (2006) Skrutskie, M. F., Cutri, R. M., Stiening, R., et al. 2006, AJ, 131, 1163, doi: 10.1086/498708
- Somerville et al. (2008) Somerville, R. S., Hopkins, P. F., Cox, T. J., Robertson, B. E., & Hernquist, L. 2008, MNRAS, 391, 481, doi: 10.1111/j.1365-2966.2008.13805.x
- Springob et al. (2005) Springob, C. M., Haynes, M. P., Giovanelli, R., & Kent, B. R. 2005, ApJS, 160, 149, doi: 10.1086/431550
- Stierwalt et al. (2015) Stierwalt, S., Besla, G., Patton, D., et al. 2015, ApJ, 805, 2, doi: 10.1088/0004-637X/805/1/2
- Stierwalt et al. (2017) Stierwalt, S., Liss, S. E., Johnson, K. E., et al. 2017, Nature Astronomy, 1, 0025, doi: 10.1038/s41550-016-0025
- Subramanian et al. (2023) Subramanian, S., Mondal, C., & Kalari, V. 2023, arXiv e-prints, arXiv:2310.02595, doi: 10.48550/arXiv.2310.02595
- Suess et al. (2022a) Suess, K. A., Leja, J., Johnson, B. D., et al. 2022a, ApJ, 935, 146, doi: 10.3847/1538-4357/ac82b0
- Suess et al. (2022b) Suess, K. A., Kriek, M., Bezanson, R., et al. 2022b, ApJ, 926, 89, doi: 10.3847/1538-4357/ac404a
Appendix A SDSS Spectrum of PGC027864
In addition to the four spectra taken of UGC5205, there is one SDSS spectrum associated with the companion PGC027864. q In Figure 11, we show this spectrum and its placement with respect to the galaxy; unlike UGC5205, the optical spectrum shows strong line emission that indicates that PGC027864 is actively starbursting.
As in the analogous main text figure (Figure 1), at left we show a -composite image of the UGC5205 and PGC027864 system with the position of the SDSS fiber on PGC027864 overlaid. The inner circle shows the on-sky size of the 3” diameter fiber. At right we show the spectrum itself; unlike Figure 1, we do not show a binned version of the spectrum due to the high SNR of the emission lines.
Appendix B Ancillary H I data
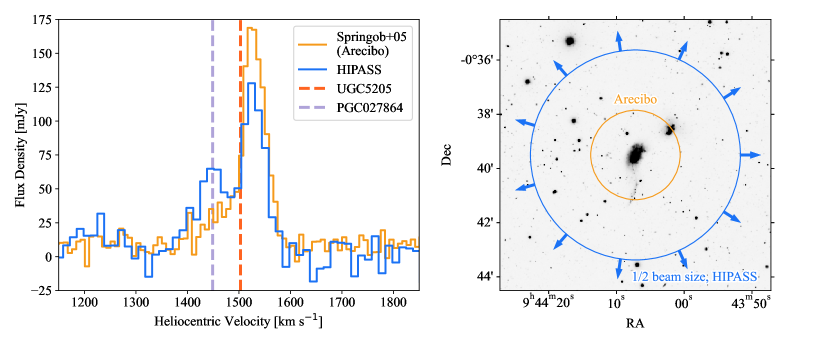
B.1 Archival H I Observations
Single dish observations of UGC5205 and PGC027864 find a gas-rich system. Figure 12 shows HI line profiles from the HI Parkes All Sky Survey (HIPASS, Koribalski et al., 2004) and Arecibo (Springob et al., 2005). The HIPASS beam contains both UGC5205 and PGC027864, while the Arecibo beam is centered on UGC5205 and grazes the southwestern edge of PGC027864. The HIPASS HI profile shows a peak at the redshift of PGC027864; this gas is likely the origin of the asymmetric tail in the Springob et al. (2005) line profile, as the Arecibo beam includes a part of PGC027864. The main peak of the H I profiles, however, is shifted redwards of UGC5205, as is seen in the spatially resolved VLA data.
B.2 Integrated Spectra
In order to understand whether we are missing significant flux at spatial scales larger than what can be probed by the high-resolution C-array data, the system was also observed in the D configuration. We show the moment zero map of the D-array data in Figure 13. Much of the spatial structure of the system’s H I (and in particular the disturbed H I associated both with UGC5205 and with PGC027864) is not observed in the D-array data due to the larger beamsize.
To understand whether there is significant 21 cm emission from H I at larger spatial scales than can be reached by the C configuration data, we integrate the spectrum coincident with UGC5205 in both the C-array and D-array data. We extract all the flux from within the black circle shown in Figure 4. The black circle is centered on (09:44:07.714, -03.39.54.389) in order to encompass all of the emission associated with UGC5205 while excluding emission from its nearby companion PGC027864. We find a very good agreement in total flux between the two integrated spectra, with a fractional difference of for all emission at for gas at . There is an excess at velocities of to ; this is at the velocity of PGC027864, and is likely due to some gas associated with the companion contaminating the low resolution D-array data, but not higher resolution the C-array data.
Appendix C The Plausibility of Ram Pressure Stripping by IC0560
Given the singular nature of its current star formation and H I reservoir, we will consider the potential influence of the nearby intermediate-mass galaxy IC0560 on the structure and evolution of UGC5205.
Although UGC5205 is considered a field galaxy by standard methods to determine low-mass galaxy environment (Geha et al., 2012), the intermediate-mass galaxy IC0560 is at a velocity difference of . We should thus examine whether this more massive galaxy is able to exert sufficient ram pressure to strip the atomic gas from UGC5205.
Following Gunn & Gott (1972), we define the ram pressure at the position of UGC5205 as
| (C1) |
where is the (radial) density profile of the circumgalactic medium of IC0560. here is the radial distance of UGC5205 where the center of IC0560 is . The velocity difference here refers to the velocity difference between UGC5205 and IC0560 assuming that both galaxies are at the distance of IC0560.
Assuming plane-parallel geometry, the confining weight that the gas feels can be written as:
| (C2) |
where and are the stellar and gas surface densities, respectively. The original treatment of Gunn & Gott (1972) implicitly assumes that the contribution to the weight from dark matter is negligible compared to that from stars – while this may not be true in detail for UGC5205 due to its lower stellar mass, including the effect of dark matter would make the gas even harder to strip than in this simple exercise.
For the hot gas associated with IC0560 to successfully strip the gas from UGC5205, the ram pressure must overcome the external weight felt by the gas. Taking the NASA Sloan Atlas (NSA) photometry of UGC5205, we arrive at an average stellar mass surface density of . The relevant gas surface density differs from the present-day H I surface density for two reasons. First, the relevant distribution of the gas reservoir is the distribution before the galaxy’s reservoir was disturbed. Second, our H I observations account for only one phase of the galaxy’s interstellar medium, while this exercise concerns the total gas surface density.
In order to estimate the total, pre-disturbed gas surface density, let us assume that the H I of UGC5205 was originally distributed with the same profile as the present-day stars, but with a scale radius equal to twice that of the half-light radius ( kpc). We will neglect the dynamical contribution of other phases of the ISM (notably neglecting molecular hydrogen) both because is likely to play only a minor dynamical role in low-mass galaxies (Leroy et al., 2008; Kado-Fong et al., 2022a) and because neglecting the contribution of will lead to an underestimate in the IC0560 gas density needed to strip the gas from UGC5205 (i.e., we will over-estimate the capacity for IC0560 to strip UGC5205).
These assumptions lead to average estimated gas surface density of . We thus find that for stripping to occur the density of the gas associated with IC0560 at the position of UGC5205 must exceed
| (C3) |
Although simulations predict that the circumgalactic medium (CGM) of sub-L* galaxies can exceed this requirement, such densities are only predicted very nearby the galaxy (, Oppenheimer et al., 2016). At the present-day distance of UGC5205, CGM densities of sub-L* galaxies are several orders of magnitude below this stripping threshold ( cm at ). We thus conclude that the disturbed nature of the H I of UGC5205 is not due to ram pressure stripping from gas associated with IC0560.