Mapping the core of the Tarantula Nebula with VLT-MUSE. III. A template for metal-poor starburst regions in the visual and far-ultraviolet
Abstract
We present the integrated VLT-MUSE spectrum of the central (3030 pc2) of NGC 2070, the dominant giant H ii region of the Tarantula Nebula in the Large Magellanic Cloud, together with an empirical far-ultraviolet spectrum constructed via LMC template stars from the ULLYSES survey and Hubble Tarantula Treasury Project UV photometry. NGC 2070 provides a unique opportunity to compare results from individual stellar populations (e.g. VLT FLAMES Tarantula Survey) in a metal-poor starburst region to the integrated results from the population synthesis tools Starburst99, Charlot & Bruzual and BPASS. The metallicity of NGC 2070 inferred from standard nebular strong line calibrations is dex lower than obtained from direct methods. The H inferred age of 4.2 Myr from Starburst99 is close to the median age of OB stars within the region, although individual stars span a broad range of 1–7 Myr. The inferred stellar mass is close to that obtained for the rich star cluster R136 within NGC 2070, although this contributes only 21% to the integrated far-UV continuum. He ii 1640 emission is dominated by classical WR stars and main sequence WNh+Of/WN stars. 18% of the NGC 2070 far UV continuum flux arises from very massive stars with 100 , including several very luminous Of supergiants. None of the predicted population synthesis models at low metallicities are able to successfully reproduce the far-UV spectrum of NGC 2070. We attribute issues to the treatment of mass-loss in very massive stars, the lack of contemporary empirical metal-poor templates, plus WR stars produced via binary evolution.
keywords:
stars: massive - galaxies: Magellanic Clouds; galaxies: starburst; galaxies: clusters: individual: R136; ISM: HII regions: ultraviolet: stars1 Introduction
The Tarantula Nebula (30 Doradus) in the Large Magellanic Cloud (LMC) is intrinsically the brightest star-forming region within the Local Group of galaxies (Crowther, 2019). It has been the subject of numerous studies across the electromagnetic spectrum (Vacca et al., 1995; Sabbi et al., 2013; Wong et al., 2022; Crowther et al., 2022; Fahrion & De Marchi, 2023). Its low (half-solar) metallicity and high star-formation intensity are more typical of knots star-forming galaxies at 2–3 (Steidel et al., 2016; Johnson et al., 2017) than local systems, owing to its very rich stellar content (Schneider et al., 2018a). Indeed, 30 Doradus has nebular conditions which are reminiscent of Green Pea galaxies (Cardamone et al., 2009), which are local extreme emission-line galaxies, some of which are known to be Lyman continuum leakers (Micheva et al., 2017).
The Tarantula Nebula is host to hundreds of massive stars, including very massive stars (VMS) located in the central, dense star cluster R136 (Massey & Hunter, 1998; Crowther et al., 2010) and the extended giant H ii region NGC 2070, the central ionized nebula within the Tarantula (Bestenlehner et al., 2014). Its proximity permits observation and analysis of individual massive OB and Wolf-Rayet stars (Melnick, 1985; Selman et al., 1999; Evans et al., 2011). Star formation in the Tarantula Nebula began at least 15–30 Myr ago, as witnessed by the Hodge 301 cluster, with an upturn in its rate of star formation in the last 5–10 Myr (Schneider et al., 2018b). Star formation is still ongoing, as witnessed by clumps of molecular gas observed with the Atacama Large Millimeter Array (ALMA, Wong et al., 2022).
The proximity of the LMC provides a unique opportunity to study a rich, intensively star-forming region individually, via its resolved stellar content (Doran et al., 2013), and collectively, via its integrated light via application of population synthesis models. If the LMC were located at a distance of 10 Mpc, R136, NGC 2070 and the Tarantula would subtend diameters of 0.04 arcsec, 0.8 arcsec and 6 arcsec, respectively (Crowther, 2019). Population synthesis models are widely employed to interpret far-UV spectroscopy of unresolved star clusters at Mpc distances (Chandar et al., 2004; James et al., 2014; Sirressi et al., 2022), local star-forming galaxies (Wofford et al., 2013; Berg et al., 2022) plus those at observed with large ground-based telescopes (Steidel et al., 2016; Saxena et al., 2020) or James Webb Space Telescope (Carnall et al., 2023; Curtis-Lake et al., 2023).
Although the nebular properties of the entire 30 Doradus region has previously been studied (Kennicutt et al., 1995; Pellegrini et al., 2010), here we focus on the central region of NGC 2070 observed with the Multi Unit Spectroscopic Explorer (MUSE) mounted at the Very Large Telescope (VLT), as part of its original Science Verification programme. Castro et al. (2018) introduce the dataset, and provide a stellar census and nebular kinematic properties, while Castro et al. (2021b) present a spectroscopic analysis of OB stars. This region is host to the central R136 star cluster, several WR stars including the R140 complex, plus several cool supergiants such as Melnick 9.
Age estimates of OB stars within NGC 2070 (external to R136) range from 1–7 Myr, with a median age of 3.6 Myr (Schneider et al., 2018b). To date, only the central cluster R136 has been observed in the far-ultraviolet, both collectively (Heap et al., 1992) and individually (Crowther et al., 2016), the latter obtaining a cluster age of 1.5 Myr (see also Brands et al., 2022). Several other luminous early-type stars within NGC 2070 have been observed in the far-UV with COS or STIS instruments aboard Hubble Space Telescope (HST), plus a large sample of far-UV template spectra of LMC OB stars have been obtained via the HST initiative ULLYSES (Roman-Duval et al., 2020; Crowther, 2022). Consequently we are able to construct an empirical integrated spectrum of the MUSE field-of-view in the far-UV, for comparison with predictions from (theoretical) population synthesis models Starburst99 (Leitherer et al., 1999, 2014), Charlot & Bruzual (Bruzual & Charlot, 2003; Plat et al., 2019), and BPASS (Eldridge et al., 2017; Stanway & Eldridge, 2018).
The present study completes the analysis of NGC 2070 MUSE Wide Field Mode (WFM) observations and is structured as follows. We provide a brief summary of visual MUSE observations of NGC 2070 and describe how the far-UV spectrum of NGC 2070 is constructed in Section 2. The integrated MUSE dataset is analysed in Section 3, with an emphasis on nebular properties and optical Wolf-Rayet bumps, with the far-UV spectrum compared to predictions from various population synthesis models in Section 4. A comparison between individual and cumulative results is provided in Section 5, together with brief conclusions. Initial results for nebular, stellar and integrated properties of the MUSE WFM datasets were presented in Crowther et al. (2017).
2 NGC 2070 spectroscopic datasets
2.1 Visual observations
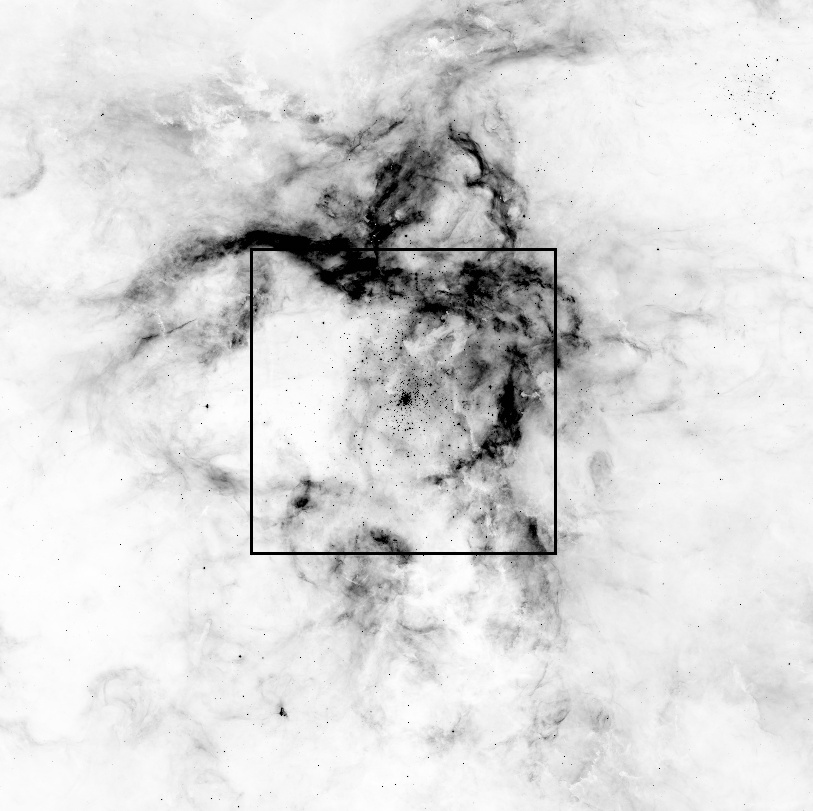
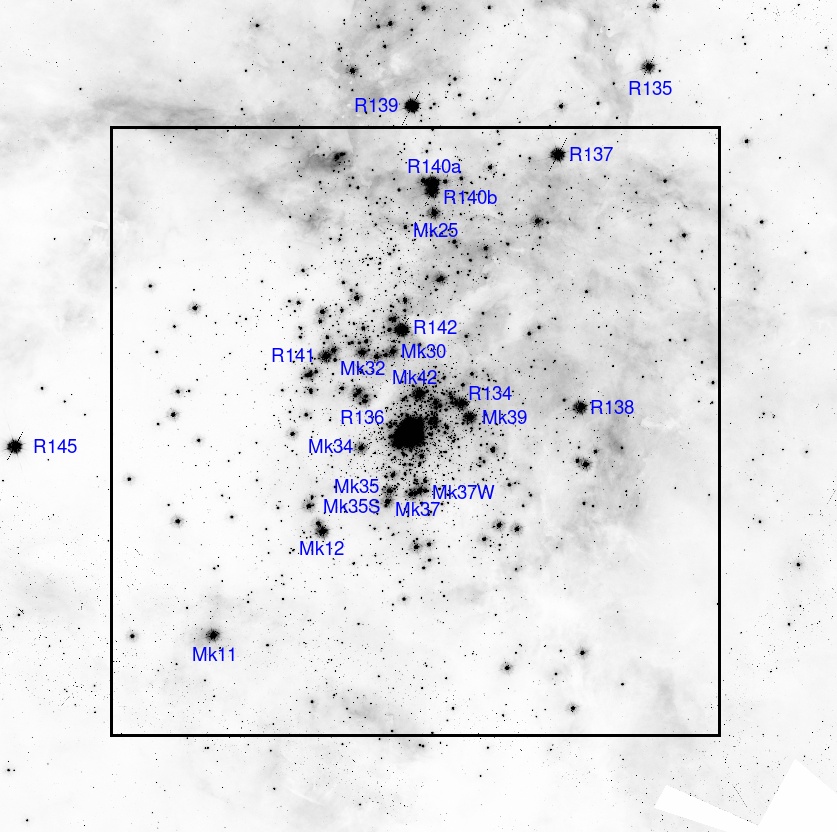
MUSE is a wide-field, integral-field spectrograph providing intermediate resolution (2000) spectroscopy from 4600-9350Å (Bacon et al., 2010). Four overlapping MUSE Wide Field Mode pointings were obtained at the Very Large Telescope (VLT) in August 2014 via a Science Verification programme (PI: J. Melnick), providing a 2 arcmin2 (3030 pc2) mosaic which encompasses both the R136 star cluster and R140, an aggregate of WR stars to the north (Castro et al., 2018). The MUSE field of view is indicated on Hubble Tarantula Treasury Project111https://archive.stsci.edu/hlsp/http (HTTP, Sabbi et al., 2013). 320320 arcsec2 ACS/F658N and 165165 arcsec2 WFC3/F336W images in Fig. 1 in which selected bright sources are identified in the latter. A larger footprint, especially to the north, would be required to fully sample the bright nebulosity of NGC 2070, but MUSE field of view includes 50% of the far-UV continuum of the entire Tarantula222We have followed the approach set out in Section 2.2 to estimate erg s-1 cm-2Å-1 for the region of the Tarantula exterior to the MUSE footprint.
The MUSE spatial resolution spanned 0.7 to 1.1 arcsec, corresponding to a mean spatial resolution of 0.220.04 pc. Four exposures of 600s for each pointing provided a continuum S/N exceeding 50 for 600 sources in the yellow. The integrated MUSE green–red spectrum of NGC 2070 is presented in Fig. 2, with nebular properties reminiscent of Green Pea galaxies (Cardamone et al., 2009), plus WR bumps in the blue (upper inset) and red (lower inset). Recent MUSE Narrow Field Mode (NFM) observations of the R136 cluster are presented in Castro et al. (2021a).

| Subtype | Empirical | Template | Total | |||
|---|---|---|---|---|---|---|
| N | N | N | ||||
| O | 34 | 1.92 | 159 | 7.44 | 193 | 9.36 |
| Of/WN+WNh | 7 | 1.31 | 5 | 0.46 | 12 | 1.77 |
| B | 0 | 16 | 1.40 | 16 | 1.40 | |
| Wolf-Rayet | 1 | 0.39 | 5 | 0.67 | 6 | 1.06 |
| Sum | 42 | 3.62 | 185 | 9.97 | 227 | 13.59 |
| Sum + Faint | 180 | 0.83 | 407 | 14.42 | ||
2.2 Far-ultraviolet observations
The combination of VLT/MUSE (Castro et al., 2018), VLT/FLAMES (Evans et al., 2011) and HST/STIS (Crowther et al., 2016) spectroscopy provide near complete spectral type census of bright early-type stars in the Tarantula (Schneider et al., 2018a; Crowther, 2019). This census permits us to construct an integrated far-UV spectrum of the region within the MUSE mosaic discussed in Section 2.1, by combining empirical datasets for a subset of stars (those with far-UV spectroscopy) with suitable templates for the remainder (those lacking far-UV spectroscopy at 2000). Empirical HST COS or STIS spectroscopy is available for a subset of individual UV-bright sources, which are rebinned to 2000. These are supplemented by Goddard High Resolution Spectroscopy (GHRS) G140L observations of the central 22 arcsec2 R136a cluster (Heap et al., 1992), also obtained at 2000333The spectral resolution of STIS/G140L observations from Crowther et al. (2016) achieved 1000, too low for our purposes here. The cumulative far-UV spectrum was constructed used the Starlink spectroscopic package dipso (Howarth et al., 2004).


For the majority of sources, far-UV spectroscopy of LMC OB and WR templates from ULLYSES444https://ullyses.stsci.edu/ (Roman-Duval et al., 2020) are utilised (up to DR6), supplemented by COS and STIS datasets from GO programmes (GO 15629, Mahy; GO 16272, Shenar). Templates are anchored to estimates of 1500Å fluxes determined from F275W or F336W photometry from HTTP (Sabbi et al., 2016). Since HTTP photometry of 30 Doradus is incomplete, we also utilise WFC3/F336W photometry from De Marchi et al. (2011) or WFPC2/F336W photometry from Hunter et al. (1995). We provide details of templates in Tables 5-6. Gaps in spectra arise from incomplete spectral coverage of templates (e.g. COS G130M+G160M).
We estimate 1500 fluxes of O and WR stars lacking far-UV spectroscopy from a calibration of F275W photometry anchored by O stars within 30 Doradus for which far-UV spectroscopy is available, as shown in the left panel of Fig 3, whose linear fit is
| (1) |
F275W photometry is not available throughout the MUSE field of view, whereas F336W is available for all sources, for which a calibration is presented in the right panel of Fig. 3, and a linear fit is
| (2) |
Fluxes for individual stars in 30 Doradus used in the calibration are provided in Appendix C (Table 9). For B supergiants, 1500 fluxes are reduced by a scale factor of 0.85 (B0.50.5), 0.65 (B1–3) or 0.5 (B4–9) from a comparison between spherical non-LTE model atmospheres of far- to near-UV fluxes of O and B stars (Hillier & Miller, 1998). For B dwarfs, 1500 fluxes are reduced by a factor of 0.77 (B0.50.5) or 0.65 (B1.50.5) from a comparison between TLUSTY plane parallel non-LTE model atmospheres of O and B stars (Lanz & Hubeny, 2007). We also adjust the 1160–1700 slopes of templates according to their colours as discussed in Appendix C
We incorporate a total of 227 sources with spectral types and estimated fluxes erg s-1 cm-2Å-1 into our cumulative far-UV spectrum, which are listed in Appendix B (Table 7). Of these, 29 lie within the R136a 22 arcsec2 GHRS footprint, 13 possess HST COS (G130M+G160M or G140L) or STIS (E140M) spectroscopy, such that the remaining 185 require ULLYSES templates, several of which have known far-UV fluxes courtesy of HST/STIS G140L spectroscopy (Massey et al., 2005). Although R136a stars exterior to the GHRS footprint have been observed in the far-UV with HST/STIS G140L (Crowther et al., 2016), their slit loss corrections are uncertain, such that from GHRS is 20% higher than the sum of individual fluxes. Consequently we adopt from calibrations for stars exterior to the GHRS aperture in common with (Crowther et al., 2016).
HSH95 17, alias #9 from Kalari et al. (2022), is included in Table 7 despite an uncertain spectral type since it lies within the GHRS 22 arcsec2 footprint such that we do not require a bespoke UV template. Several other sources which would qualify on the basis of their far-UV fluxes are excluded due to unknown spectral types (e.g. HSH95 76, HSH95 87, SMB 136) which is necessary to incorporate suitable UV templates. Their contribution to the cumulative far-UV flux is negligible (1%).
20 sources in Table 7 are confirmed spectroscopic binaries, although not all stars have been subject to spectroscopic monitoring, so the true binary frequency will be significantly higher. Confirmed multiple systems amongst the UV-brightest sources ( erg s-1 cm-2Å-1) include O-type binaries HSH95 39, HSH95 42 within R136a (Massey et al., 2002), Wolf-Rayet and O-type binaries R140b, c and d (Shenar et al., 2019; Walborn et al., 2014), plus colliding wind binaries R136c, Mk 33Na, Mk 34 and Mk 39 (Crowther et al., 2022).
The cumulative far-UV flux of the individual 227 sources is 1.36 erg s-1 cm-2Å-1. An additional 180 sources with known spectral types possess far-UV fluxes in the range erg s-1 cm-2Å-1. We account for these collectively via a B0 V template scaled to their cumulative far-UV flux ( erg s-1 cm-2Å-1), such that they contributes an additional 6% to the total far-UV continuum. Table 1 provides a spectral subtype of the sources contributing to the far-UV continuum. Stars possessing empirical far-UV spectroscopy contribute 25% of the total. The dominant contribution arises from large numbers of O stars (65%), although modest populations of very massive main-sequence WN (WNh) and transition Of/WN stars (12%), B stars, primarily supergiants (10%) and classical WR stars (7%) also make non-negligible contributions.
| Source | Sp Type | Obs | VMS | |
|---|---|---|---|---|
| R136a | 3WN5h+O4 If/WN8+.. | 13. | STIS/G140L | 8 |
| R140a | WC4+WN6+.. | 12. | STIS/E140M | |
| R140b | WN5(h)+O | 9. | WN6 template | |
| R134 | WN6(h) | 6.5 | WN6 template | |
| Mk 53 | WN8(h) | 2.2 | WN7 template | |
| Mk 49 | WN6(h) | 2.1 | WN6 template | |
| Mk 33Sb | WC5 | 2.1 | WC4 template | |
| R136c | WN5h+ | 1.8 | WN5h template | |
| Mk 34 | WN5h+WN5h | 1.6 | WN5h template | 2 |
| Mk 39 | O2.5 If/WN6+ | 1.1 | COS/G130M+G160M | |
| Mk 42 | O2 If* | 0.8 | STIS/E140M | |
| Mk 35 | O2 If/WN5 | 0.8 | O2If/WN5 template | |
| Mk 37a | O3.5 If/WN7 | 0.5 | O3.5 If/WN7 template | |
| Total | 57. |
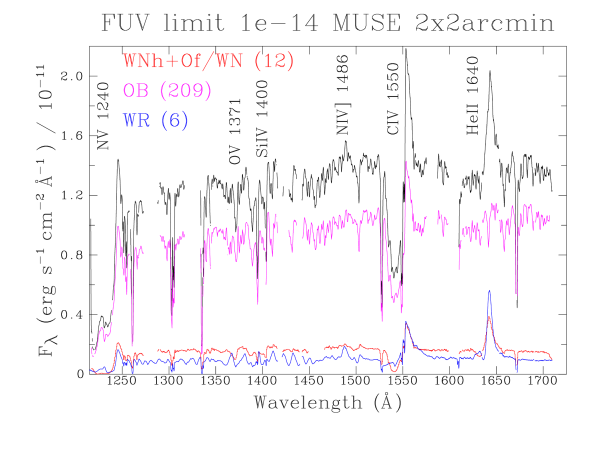
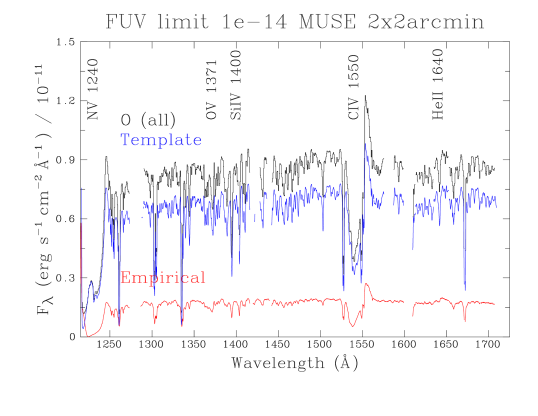
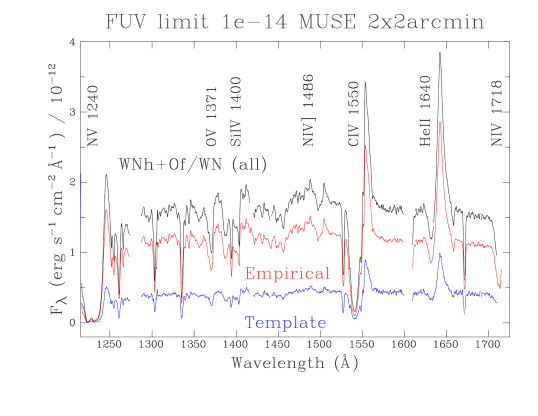
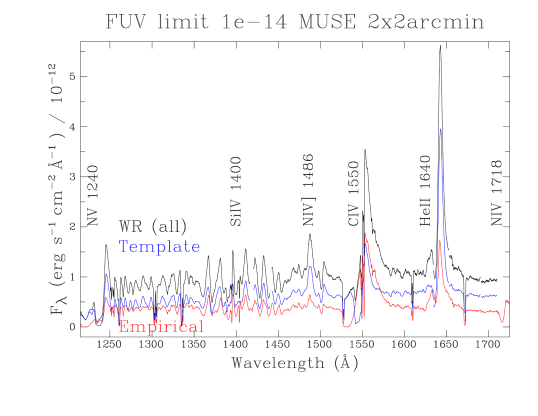
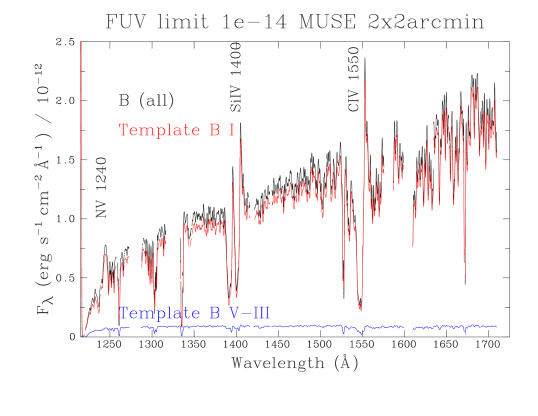
Fig. 4 presents the cumulative far-UV spectrum of the MUSE field, including contributions from OB-type (pink), classical WR (blue) stars plus main sequence WNh and Of/WN stars (red). We have split relative contributions from O and WNh stars to the core of R136a by adjusting their combined HST STIS/G140L spectra from (Crowther et al., 2016) to the flux of the HST/GHRS spectrum. He ii 1640 is unusually strong ( = 4.70.2Å) and broad (FWHM = 9.30.3Å). Figs 17–20 in Appendix A illustrate the contribution of empirical datasets and templates to the far-UV spectra of individual spectral types. All subtypes contribute to the strong C iv 1550 P Cygni profile, although it is apparent that He ii 1640 emission is dominated by classical WR stars (56%) plus WNh and Of/WN stars (31%). All subtypes contribute to N v 1240, aside from B supergiants, although B supergiants and classical WR stars are the primary contributors to P Cygni Si iv 1400.
In Table 7 we have flagged 18 Very Massive Stars (VMS) with initial masses in excess of on the basis of spectroscopic results (Bestenlehner et al., 2014; Tehrani et al., 2019; Brands et al., 2022). The majority of these have WN5h, Of/WN or O2–4 If spectral types, exceptions include R136a7 (O3 III(f*)), R136a4 (O3 V) and VFTS 506 (ON2 V). In spite of their scarcity, 18% of the NGC 2070 far UV flux arises from VMS.
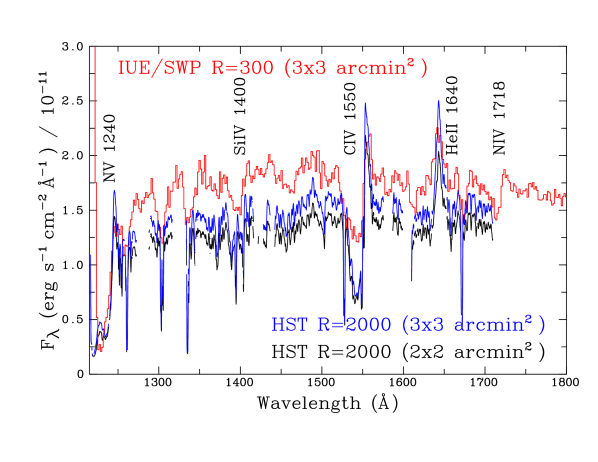
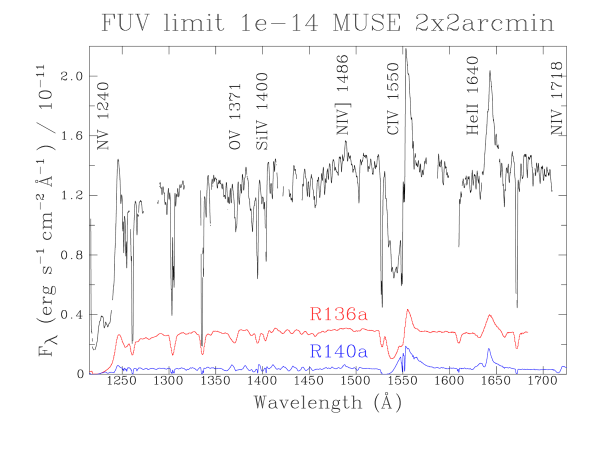
Fig. 5 compares the cumulative far-UV spectrum to the integrated STIS/G140L spectrum of R136a from Crowther et al. (2016), contributing 22% of the far-UV continuum flux, plus the STIS/E140M spectrum of R140a (VFTS 507), the brightest individual source in the MUSE field (3% of far-UV continuum flux), host to classical WN+WC stars. Neither of the WR stars within R140a are known to be binaries (Bartzakos et al., 2001; Shenar et al., 2019), although the complete stellar content of R140a remains uncertain. R136a possesses an extremely strong He ii 1640 emission with respect to typical young star clusters, but the richness of the surrounding massive star population in NGC 2070 is such that it only contributes a quarter of the integrated emission line flux of He ii 1640. Table 2 lists the primary contributors to , the majority of which originates from classical WR stars, notably R140a.
Vacca et al. (1995) have previously scanned NGC 2070 with IUE with the short wavelength camera (SWP), at low spectral resolution () using the large aperture, providing integrated spectra for the central , , and regions. Fig. 6 compares the integrated spectrum of the central region (red) with our cumulative far-UV spectrum of the 2 MUSE region (black). The overall shape of the spectra are similar, but the continuum flux of our far-UV spectrum is only 80% of the large IUE aperture. N iv 1718 is prominent in the large aperture IUE dataset despite its low spectral resolution.
Table 8 lists additional stars with known spectral types brighter than erg s-1 cm-2Å-1 within the large IUE aperture. These increase the far-UV continuum flux by erg s-1 cm-2Å-1, the majority of which is supplied by R135, R139 and R145. Owing to their relative isolation (Fig. 1), far-UV flux levels for these three bright stars are drawn from low-resolution IUE/SWP large aperture spectroscopy (Fitzpatrick & Savage, 1984).
The blue spectrum in Fig. 6 additionally incorporates all stars listed in Table 8, and reveals a difference of 15% in global far-UV flux levels between IUE and our approach using HST observations. The difference likely arises from the combination of absolute flux calibration and the omission of a diffuse far-UV background from unresolved stars in our study – recall 20% of the integrated far-UV continuum of the rich R136 cluster was from an intra-cluster background (Crowther et al., 2016). Collectively, B-type main sequence stars – lacking strong UV wind features – will dominate this population.
3 Analysis of integrated visual spectroscopy
3.1 Nebular properties
As shown in Fig. 2, the integrated MUSE spectrum of NGC 2070 is dominated by nebular emission lines, plus broad, weak Wolf-Rayet features. Here we undertake an analysis of the nebular spectrum with a focus on the inferred metallicity and age/mass of the ionizing stellar population using commonly used spectral synthesis tools Starburst99 (version 7.0.1, Leitherer et al., 1999, 2014), Charlot & Bruzual (Bruzual & Charlot, 2003; Plat et al., 2019, CB19,[) and BPASS (v.2.2.1, Eldridge et al., 2017; Stanway & Eldridge, 2018). A detailed study of the integrated 30 Doradus nebula has been undertaken by Pellegrini et al. (2011) while Peimbert (2003) utilise VLT/UVES spectroscopy for a detailed chemical analysis.
| Line | Notes | |||
|---|---|---|---|---|
| erg s-1 cm-2 | erg s-1 cm-2 | erg s-1 | ||
| N iii 4634-41 | WR | |||
| [Fe iii] 4658 | ||||
| He ii 4686 | WR | |||
| [Ar iv] 4711 | ||||
| [Ar iv] 4740 | ||||
| H | ||||
| [O iii] 4959 | ||||
| [Fe iii] 4986 | ||||
| [O iii] 5007 | ||||
| He ii 5412 | WR | |||
| [Cl iii] 5518 | ||||
| [Cl iii] 5538 | ||||
| [N ii] 5755 | ||||
| C iv 5801–12 | WR | |||
| He i 5876 | ||||
| [O i] 6300 | ||||
| [S iii] 6312 | ||||
| [N ii] 6548 | ||||
| H | ||||
| [N ii] 6584 | ||||
| He i 6678 | ||||
| [S ii] 6717 | ||||
| [S ii] 6731 | ||||
| He i 7065 | ||||
| [Ar iii] 7135 | ||||
| [S iii] 9069 |
Table 3 presents measured MUSE line fluxes, intensities and luminosities (assuming 50 kpc), the former obtained using the elf suite within the Starlink package dipso (Howarth et al., 2004). Although 30 Doradus is known to have a non-standard dust extinction (Maíz Apellániz et al., 2014; De Marchi & Panagia, 2014; Brands et al., 2023), we shall adopt a standard LMC extinction law with = 3.1 (Howarth, 1983) for the nebular analysis. We obtain =0.54 from (H)/(H) = 2.86 for Case B recombination theory for a standard cm-3 and K – these results are consistent with averages of resolved maps from Castro et al. (2018).
(H) = 1.37 erg s-1 equates to an ionizing output of ph s-1, corresponding to a star formation rate of 0.005 yr-1 using standard conversions from Kennicutt (1998). Our MUSE dataset of the central region of NGC 2070 (3030 pc2) lies within the extended 30 Doradus region. Pellegrini et al. (2010) have investigated a much larger 14080 pc2 region, and highlighted that 50% of the integrated H emission originates from relatively low surface brightness regions.
We used the temden routine in iraf to determine the nebular density and temperature. We obtain cm-3 from the standard [S ii] 6717/6731 diagnostic, and cm-3 from the weak [Cl iii] 5518/5538 diagnostic. Comparable results are obtained from the [Fe iii] 4658/4986 ratio (Keenan et al., 2001). The usual [O iii] 4363/5007 temperature diagnostic is not available for MUSE observations at = 0 , so we use [N ii] 5755/6584 to obtain K and [S iii] 6312/9069 to obtain K. For reference, Peimbert (2003) obtained ([S ii]) and K ([N ii]).
We are unable to determine the oxygen abundance from the use of auroral diagnostics (4363 [O iii] is not available to MUSE at zero redshift). Instead, we rely on strong line calibrations (Maiolino & Mannucci, 2019), which are widely used for extragalactic H ii regions for which direct temperature determinations are not feasible. The calibration of the N2 index (–1.59) by Marino et al. (2013) implies , versus following Curti et al. (2017). The O3N2 index (+2.3) lies beyond the calibrated range of Marino et al. (2013), with obtained from Curti et al. (2017), values typical of the present-day Small Magellanic Cloud (SMC) rather than the LMC (Russell & Dopita, 1990; Pagel et al., 1978). Use of the integrated 30 Dor nebular fluxes from Pellegrini et al. (2010) provides N2 and O3N2 indices of –1.42 and 2.09, indicating or , respectively, following the Curti et al. (2017) calibrations.
Contemporary baseline LMC abundances (Vink et al., 2023, Table 1) including correspond to a mass fraction of Z=0.008, although the directly determined gas phase oxygen abundance within 30 Doradus ranges from = 8.26 (Vermeij & van der Hulst, 2002) to 8.5 (Peimbert, 2003). It is clear that standard strong line calibrations significantly underestimate the true oxygen content of NGC 2070, since these are sensitive to ionization parameter as well as abundance (Kewley & Dopita, 2002). Consequently caution should be used when inferring metallicities of low-redshift star forming galaxies from diagnostics within the MUSE spectral range (see Easeman et al., 2023). By way of a test, spectral synthesis calculations are made for both Z=0.008 (well matched to NGC 2070) and Z=0.002 (significantly lower than NGC 2070, albeit inferred from strong line methods).
3.2 Population synthesis
In order to estimate the age and mass of the starburst region consistent with MUSE observations, we have employed several widely used population synthesis packages. Age estimates from H are relatively metallicity insensitive, but WR bumps and UV diagnostics are strongly metallicity-dependent. Starburst99 (v7.0.1, Leitherer et al., 1999, 2014) involves a burst of star formation, an initial mass function (IMF) from Kroupa (2008) with an upper mass limit of 120 . Modern non-rotating and rotating Geneva evolutionary models at Solar (Z=0.014 Ekström et al., 2012) and SMC (Z=0.002 Georgy et al., 2013) metallicities are available555Z=0.008 models appropriate for the LMC have only recently become available (Eggenberger et al., 2021), with the full range of metallicities for historical models available with either standard (Schaller et al., 1992) or enhanced mass-loss (Meynet et al., 1994).
Starburst99 model atmospheres are obtained from either WM-Basic (O, Pauldrach et al., 2001) or PoWR (WR, Gräfener et al., 2002), with ionizing fluxes from Smith et al. (2002) and Leitherer et al. (2010) and empirical UV spectral templates drawn from either the Milky Way or Magellanic Clouds (Robert et al., 1993).
Observed rotational velocities (e.g. Ramírez-Agudelo et al., 2017; Sabín-Sanjulián et al., 2017) are intermediate between non-rotating and rapidly rotating models (40% critical), and evidence points to a higher mass limit than 120 (Crowther et al., 2010; Brands et al., 2022).
We also make use of the latest CB19 grid of Charlot & Bruzual models (Bruzual & Charlot, 2003; Plat et al., 2019) which employ non-rotating PARSEC stellar evolutionary tracks from Chen et al. (2015) calculated for a range of metallicities, synthetic hot luminous star templates from WM-Basic, TLUSTY (OB), PoWR (WR) (Sánchez et al., 2022) with integrated populations drawn from either a Salpeter, Kroupa or Chabrier IMF for stars up to = 100, 300 or 600 (Sánchez et al., 2022).
Crucially, binary evolution is neglected in both Starburst99 and Charlot & Bruzual models, despite observational evidence indicating a high fraction of close binaries amongst massive stars at the LMC metallicity (Sana et al., 2013). Therefore we also consider BPASS (v2.2.1, Eldridge et al., 2017; Stanway & Eldridge, 2018) models incorporating binary evolution, a Kroupa IMF and an upper mass limit of = 100 or 300 . Stellar atmosphere models incorporated into BPASS that are relevant for young populations are WM-Basic (O), PoWR (WR) and ATLAS (B).
The H equivalent width is a sensitive indicator of age for a young star burst. We measure (H Å. We initially focus on Z=0.002 predictions from Starburst99 on the basis of the strong line calibrations, so adopt contemporary non-rotating models from Georgy et al. (2013). We obtain an age of 4.2 Myr, such that the H luminosity (Table 3) corresponds to a stellar mass of . Broadly similar results are obtained for historical Z=0.008 models (Meynet et al., 1994) aside from a higher mass of . Comparable results are obtained from the H equivalent width, (HÅ. Revised ages accounting for underlying absorption in H are barely affected owing to the exceptionally strong Balmer emission.
In reality the stellar population within NGC 2070 is not coeval - see (Schneider et al., 2018b, their fig. 4) and (Castro et al., 2021b, their fig. 10). In particular the ages of OB stars within 1.2 arcmin of R136 (broadly comparable to MUSE pointing) span 1–7 Myr from comparison with evolutionary predictions for LMC metallicity OB stars (Brott et al., 2011), excluding the R136 star cluster whose age is 1.5 Myr (Crowther et al., 2016; Brands et al., 2022). Nevertheless, the median age of massive stars in NGC 2070 (3.6 Myr, Schneider et al., 2018b) is in good agreement with the age inferred from H using Z=0.002 or Z=0.008 metallicity models.
3.3 WR properties
The spectral resolution of MUSE prevents the detection of photospheric absorption lines, but the high S/N does reveal broad WR bumps (Fig. 2). The blue bump is dominated by broad He ii 4686 (FWHM 25Å, Å), with no nebular component detected. Broad N iii 4634-41 is also observed, suggesting a dominant late WN population, while the yellow WR bump is dominated by C iv 5801-12 (FWHM80Å, Å) from WC stars. The high S/N of our MUSE integrated dataset unusually also permits broad He ii 5411 emission to be detected. Optical emission line fluxes from individual stars are provided in Table 2 of Castro et al. (2018).
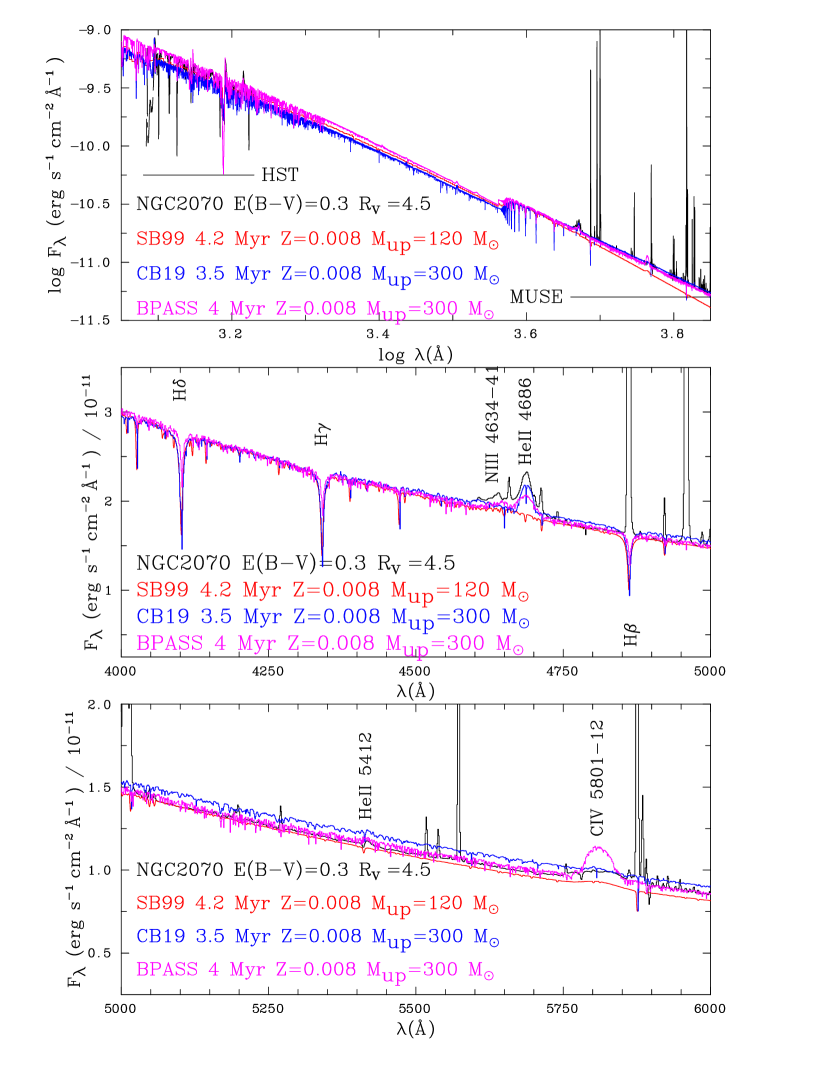
Both classical WR stars and main sequence very massive stars (WN5h and Of/WN) are major contributors to He ii 4686, with R136a contributing 20% of the total, whereas the blend of N iii 4634–41 and C iii 4647–51 and C iv 5801–20 are dominated by classical WR stars (primarily R140a). The presence of WR features in Starburst99, CB19 and BPASS synthetic spectroscopy provide independent age indicators (Schaerer & Vacca, 1998). We require a non-standard extinction law in order to reconcile the UV and optical spectrophotometry of NGC 2070 with predictions. We adopt an LMC law with = 4.5 (Maíz Apellániz et al., 2014; De Marchi & Panagia, 2014; Brands et al., 2023), and obtain = 0.3 mag ( = 1.35 mag) for spectral energy distribution comparisons in the top panel of Fig. 7. Masses inferred from Starburst99, CB19 and BPASS stellar continua are , and , respectively, in reasonable agreement with (H) derived masses. The nebular continuum is not included in Fig. 7 since it has a negligible contribution to the far-UV and Paschen continua.
Z=0.002 metallicity models predict extremely weak WR emission for all population synthesis models. Consequently we adopt more realistic Z=0.008 models for age determinations based on WR stars, although different models have different time resolutions (e.g. 1 Myr intervals for BPASS). The peak strength of optical WR bumps occurs at 4.2 Myr, 3 Myr and 4 Myr for Starburst99, CP19 and BPASS models. Starburst99 models at solar metallicity (Z=0.014, Ekström et al., 2012). allow comparisons between peak WR ages associated with non-rotating (4.50.5 Myr) and rotating (52 Myr) models.
We compare the Starburst99 synthetic spectrum associated with the 4.2 Myr age corresponding to the maximum WR population from the Meynet et al. (1994) evolutionary models in the central and bottom panels of Fig. 7, which coincide with the H-inferred age. Both WR bumps are predicted, albeit significantly weaker than observed for the He ii 4686 + N iii 4634-41 bump. It is clear that either the number of WR stars predicted from single star models at low metallicity or their line luminosities, or both, are underestimated (stronger emission is predicted for solar metallicity models). The synthetic spectrum also highlights strong photospheric absorption lines associated with Balmer lines.
In contrast, the 3.5 Myr CB19 synthetic spectrum (blue) based on PARSEC evolutionary models at Z=0.008 with (Chen et al., 2015) provides a stronger He ii 4686 emission in the central panel of Fig. 7, albeit too weak and with negligible N iii 4634-41 and C iv 5801-12 emission in lower panel. This age is close to the median 3.6 Myr age of massive stars in NGC 2070 according to Schneider et al. (2018b). Comparable WR emission is predicted at this age for CB19 models with , since very massive stars have somewhat shorter lifetimes.
For the BPASS single star models with , WR emission is most prominent at 4 Myr, with comparable C iv 5801-12 emission predicted (too strong), and a higher He ii 4686 equivalent width, albeit comparable to predictions from CB19 models (central and bottom panels of Fig. 7). The H luminosity at this age for the model corresponds to a stellar mass of .
Alternatively, it is possible to empirically estimate WR populations if line luminosity calibrations are available (Schaerer & Vacca, 1998). Assuming the blue bump is dominated by WN stars, one obtains a population of 20 WN6–8 stars (or 12 WN5–7h stars) based on the latest WR line luminosities at the LMC metallicity from Crowther et al. (2023). The yellow bump is dominated by WC stars, from which a population of 4 WC4–5 stars is obtained. In reality, WC stars also contribute 15% to the blue bump via C iii 4650 and He ii 4686. Consequently the inferred number of WN stars is reduced to 17 WN6–8 stars (or 10 WN5–7h stars). These calibrations are within a factor of two of the known population (11 WN stars, 2 WC4 including individual components of multiple WR systems R140a and Mk 34).
4 Analysis of integrated far-UV spectroscopy
In common with previous studies of young extragalactic stellar populations in the ultraviolet, we again utilise predictions of the emergent far-UV spectrum from the population synthesis tool Starburst99 (version 7.0.1, Leitherer et al., 1999, 2014), Charlot & Bruzual (CB19, Bruzual & Charlot, 2003; Plat et al., 2019) and BPASS (v2.2.1, Eldridge et al., 2017; Stanway & Eldridge, 2018) once our empirical dataset has been dereddened according to an LMC extinction law with = 4.5 and = 0.3 mag, as for the optical comparison. The 1500 luminosity of the NGC 2070 empirical dataset corresponds to erg s-1.
Strong interstellar Ly absorption impacts the observed N v 1238-42 profile (e.g. Wofford et al., 2023, their fig. 3). We have estimated (H i)/cm2 = 21.750.05 from Ly fits to COS/G130M and STIS/E140M observations of individual stars within the MUSE field-of-view (Table 9). However, application to theoretical predictions leads to a suppressed continuum extending to 1300Å, contrary to observations. This is because LMC templates, which dominate the cumulative far-UV spectrum, span a broad range of (H i) column densities (Welty et al., 2012). Consequently no corrections to Ly have been applied, of relevance to detailed comparisons between observed and predicted N v 1238-42 profiles.
Once again, although the optical strong line calibrations favour an unphysical SMC-like metallicity, we discuss both Z=0.002 and Z=0.008 metallicity predictions in the far-UV in order to test predictions. We limit our discussion to single bursts, although in reality NGC 2070 and other far-UV observations involve a mixed population. Dual or multiple age populations are occasionally implemented for spectral fitting (e.g. Chisholm et al., 2019; Sirressi et al., 2022), but NGC 2070 comprises a star cluster embedded within an extended (spatially and temporally) star forming region.
4.1 Starburst99
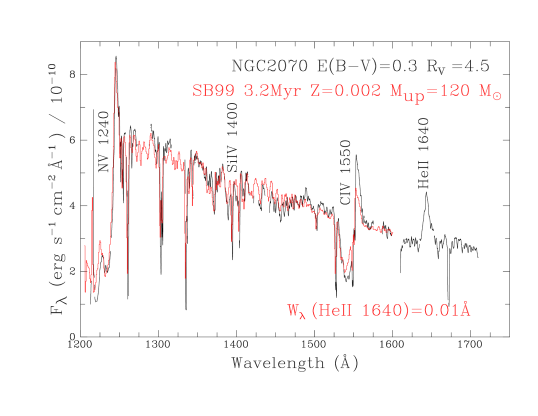
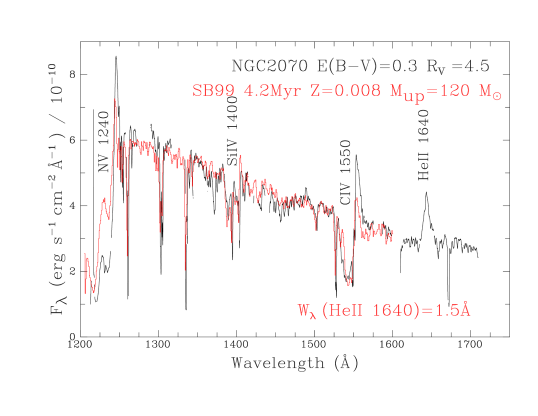
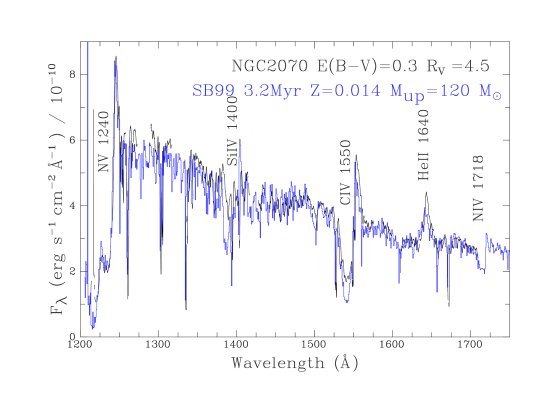
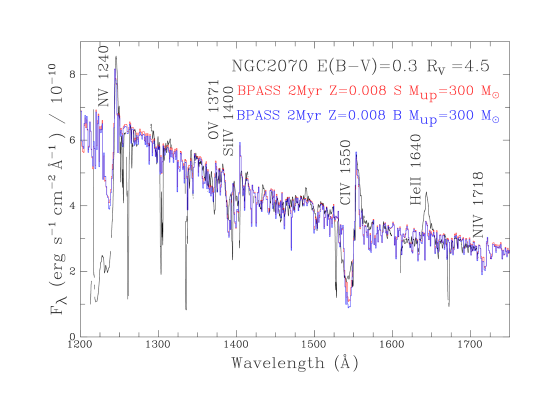
The primary age indicators in the far-UV are N v 1238–42, Si iv 1393–1402 and C iv 1548–51 for metal-poor populations with Starburst99 since empirical LMC/SMC stellar libraries cutoff at 1600, preventing spectral comparisons for He ii 1640, although predicted equivalent widths of several WR lines are available, including He ii 1640. The maximum He ii 1640 emission occurs at an age of 3.2 Myr for the Z=0.002 (Georgy et al., 2013) Starburst99 model. Fig. 8 provides a comparison between this model and dereddened NGC 2070 spectrum, revealing a good match to N v 1238–42, a weak P Cygni C iv 1548–51 profile, and a somewhat too weak Si iv 1393–1402 wind signature. He ii 1640 represents a major discrepancy, since the predicted emission of = 0.01Å, is negligible with respect to the observed strength ( = 4.70.2Å).
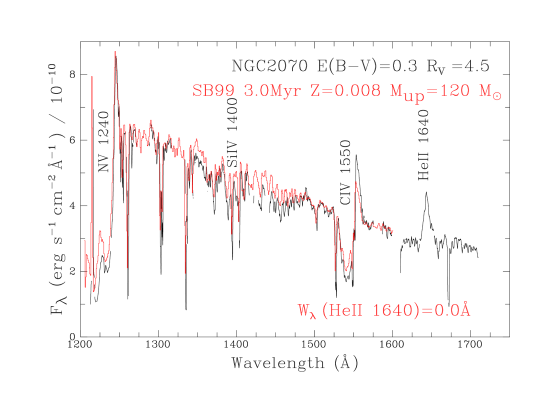
In view of the overall poor match to observations at Z=0.002, in Fig. 9 we compare the dereddened NGC 2070 spectrum to predictions for non-rotating Z=0.008 metallicity models (Meynet et al., 1994) plus LMC/SMC empirical templates at 3 Myr (start of WR emission) and 4.2 Myr (peak WR emission). At 3 Myr results are broadly similar to the Z=0.002 case, whereas at 4.2 Myr (H-inferred age from Section 3.2) the P Cygni Si iv 1393–1402 is well reproduced owing to OB supergiants being present in sizeable numbers, but the strength of both the N v 1238–42 and C iv 1548–51 P Cygni profiles are underpredicted. The He ii 1640 emission strength remains underestimated, albeit with an improved predicted equivalent width of 1.5Å.
Overall, metal poor Starburst99 models fare rather poorly in quantitatively reproducing the empirical dataset. The origin of this disagreement has multiple causes:
-
1.
The central region of NGC 2070 is not a coeval burst, since it hosts a young, potentially coeval, star cluster R136 contributing 1/3 of the far-UV continuum (Fig. 5) with the remainder spanning ages of 1–7 Myr (Schneider et al., 2018b). Improved agreement could be obtained by adopting dual age populations representing the cluster and extended star-forming region.
-
2.
NGC 2070 is host to a number of VMS, within R136 and beyond, which possess very strong winds owing to their proximity to the Eddington limit (Bestenlehner, 2020; Brands et al., 2022). These stars produce strong He ii 1640 emission whilst on the main-sequence (Crowther et al., 2016). In addition we have shown that VMS contribute 18% of the far-UV continuum of NGC 2070, such that models with upper mass cutoffs at will underestimate the far-UV continuum. In order to reproduce He ii 1640 in very young populations one needs to extend the IMF in population synthesis calculations to higher masses, and incorporate revised mass-loss prescriptions (Wofford et al., 2023).
-
3.
The empirical UV template spectra at low metallicity in Starburst99 are a mix of SMC and LMC stars, since these were incorporated at a time prior to the availability of large numbers of high quality far-UV templates (Roman-Duval et al., 2020). OB stars in the SMC possess significantly weaker winds than LMC counterparts (Prinja & Crowther, 1998; Mokiem et al., 2007), so the use of SMC templates will yield weaker P Cygni profiles than observations at LMC composition. Alternatively theoretical spectra could lead to improved agreement (e.g. Leitherer et al., 2010), especially at low metallicities where empirical templates are scarce or unavailable.
-
4.
It is well known that evolutionary models for single stars struggle to reproduce observed WR populations (Hamann et al., 2019). In reality, binary channels (including mergers) will increase the production of WR and lower mass He stars, which will enhance the strength of He ii 1640 from all WR subtypes, as well as other far-UV P Cygni profiles (N v 1238–42 from WN stars, C iv 1548–51 from WC stars).
Previous analyses of extragalactic star clusters (e.g. Smith et al., 2016; Sirressi et al., 2022) or entire galaxies (e.g. James et al., 2014; Chisholm et al., 2019) are often more successful at reproducing far-UV observations than we have achieved for NGC 2070, albeit not universally so (Sidoli et al., 2006; Wofford et al., 2014; Leitherer et al., 2018). In part, this is achieved since the metallicity is varied, with high metallicities preferred in cases of strong stellar wind signatures, irrespective of nebular results for the regions in question.
To illustrate the role played by metallicity, we compare the dereddened UV spectrum of NGC 2070 with prediction of a 3.2 Myr model at Z=0.014 (Ekström et al., 2012) plus Milky Way UV templates in Fig. 10. In contrast to Fig.9, N v 1238–42, C iv 1548–51 and He ii 1640 are now reasonably well predicted, with Si iv 1393–1402 a little too strong and the far-UV iron forest also over predicted. N iv 1718 is also prominent (recall Fig. 6), in contrast to metal poor predictions. Nevertheless, the overall match is satisfactory for an age close to the median of OB stars in NGC 2070 (Schneider et al., 2018b), albeit reliant on unphysical evolutionary models and templates.
4.2 Charlot & Bruzual
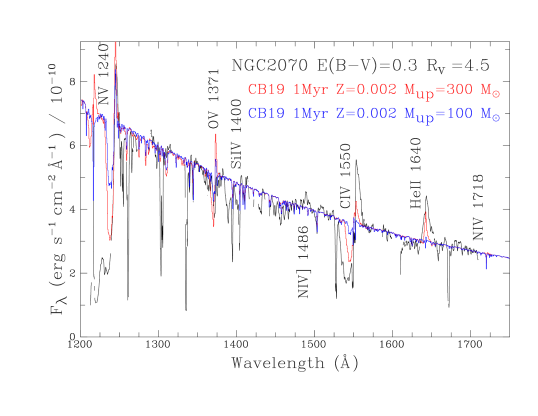
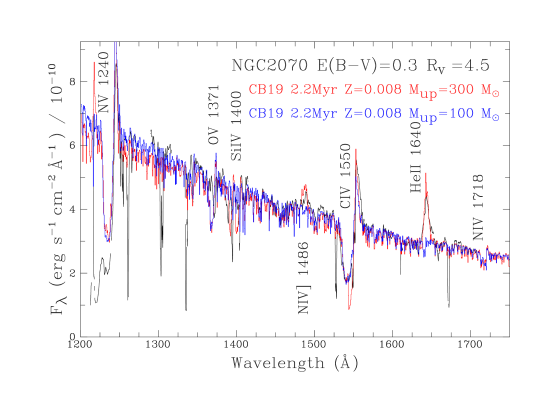
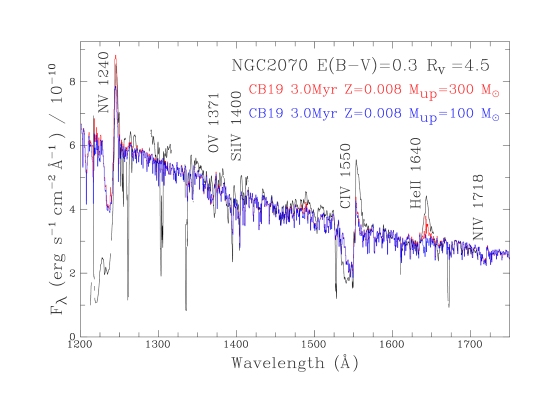
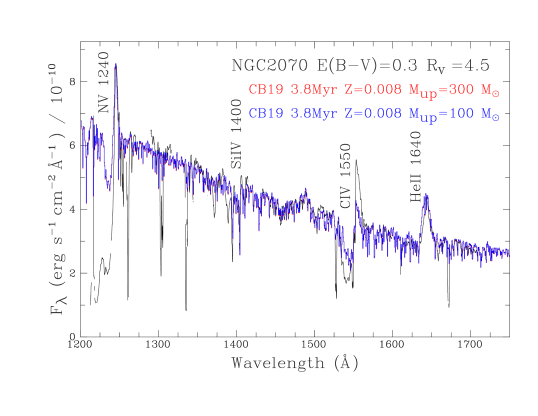
The extension of Charlot & Bruzual 2019 models to IMFs with high upper mass limits at a wide range of metallicities permits some deficiencies of current Starburst99 models to be addressed. As demonstrated by Wofford et al. (2023), the difference in predicted He ii 1640 emission at ages of 1–3 Myr between = 100 and 300 at LMC metallicity (Z=0.008) is striking (their fig 4). This arises from the inclusion of mass-loss prescriptions for very massive stars (Vink et al., 2011). We compare far-UV CB19 (Z=0.002, Kroupa IMF) predictions for = 100 and 300 at 1.0 Myr and 2.5 Myr with NGC 2070 observations in Fig. 11. These ages correspond to the maximum He ii 1640 emission due to very massive stars (1 Myr) and classical WR stars (2.5 Myr) for = 300 . At 1 Myr the high upper mass limit prediction provides a closer agreement with observations, albeit with O v 1371 too strong, He ii 1640 too weak and C iv 1548–51 extremely weak. At 2.5 Myr, all wind features are far too weak, with the exception of He ii 1640 for the = 300 case which has a satisfactory emission equivalent width, albeit far broader than observed.
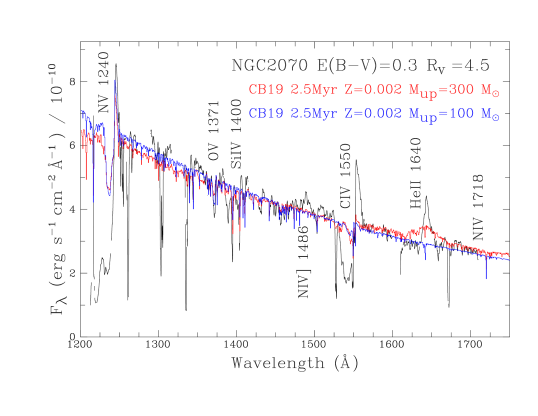
Consequently we also consider Z=0.008 predictions from CB19 with = 100 and 300 . Fig. 12 compares predictions at 2.2, 3.0 and 3.8 Myr with observations, which span the range of ages at which prominent He ii 1640 emission is predicted. At all ages the = 300 model provides a better match to observations. Wofford et al. (2023, their fig. 4) highlight the sharp peak in He ii 1640 at 2.2 Myr once very massive stars enter the late WN phase (see also Smith et al., 2023). Consequently the predicted He ii 1640 is in good agreement with observations at this precise age, as is C iv 1550, albeit with O v 1371 over predicted, and Si iv 1393–1402 under predicted. N iv] 1486 is observed in NGC 2070, though is overpredicted in models at this age that extend to = 300 .
Turning to later ages, O v 1371 has faded in strength after 3 Myr, with Si iv 1393–1402 now well reproduced, with He ii 1640 emission a little too weak, with C iv 1548–51 also too weak, alongside Si iv 1640. C iv 1548–51 continues to weaken at later ages (3.8 Myr) with He ii 1640 from classical WR stars now well reproduced and Si iv 1393–1402 still matched. Overall, use of CB19 models at Z=0.008 favour an age of 2.2 Myr for NGC 2070 plus a high upper mass limit, in spite of the poor match to O v 1371 and very weak N iv 1718 (in contrast to IUE observations in Fig. 6).
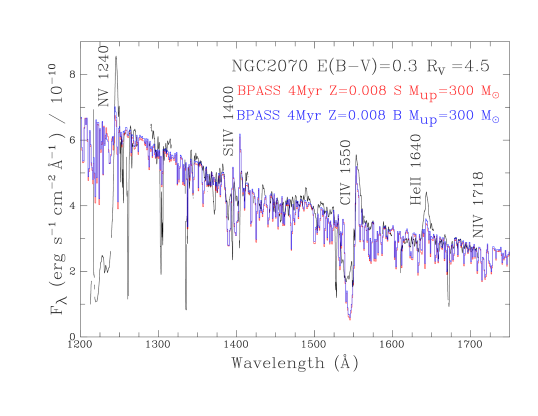
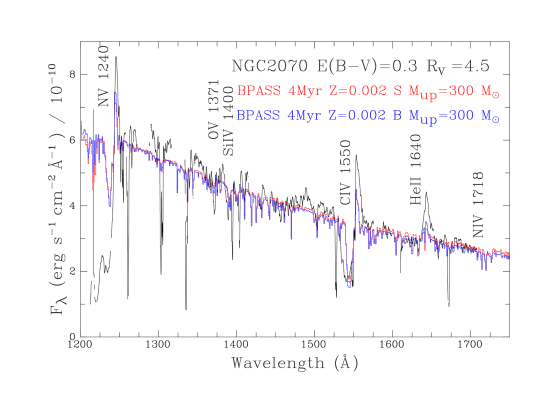
4.3 BPASS
Finally, we consider BPASS (v.2.2.1 Eldridge et al., 2017; Stanway & Eldridge, 2018) models for single or binary populations at Z=0.002 and Z=0.008, with a Kroupa IMF and = 300 . The maximum He ii 1640 emission at Z=0.002 is predicted at an age of 4 Myr (single or binary case), as shown in Fig. 13. At this metallicity all wind lines are predicted to be too weak, albeit with He ii 1640 only a factor of two weaker than observed, since several H-rich WN stars are predicted for cluster mass of which reproduces the far-UV luminosity of NGC 2070. At Z=0.008, predictions are improved, as shown in Fig. 14 for ages of 2 Myr (upper panel) and 4 Myr (lower panel). For the 2 Myr case C iv 1548–51, N v 1238–42 and Si iv 1393–1402 are reasonably well reproduced, although He ii 1640 emission is only weakly present despite the inclusion of very massive stars, and N iv 1718 is very weak (in contrast with IUE observations in Fig. 6).
Binary models predict 6 very massive stars at 2 Myr for a stellar mass of that reproduces the far-UV luminosity of NGC 2070, categorized as a mix of O, Of and H-rich WN-types. In contrast with CB19 models, BPASS mass-loss prescriptions fail to account for the proximity of very massive stars to the Eddington limit (Bestenlehner, 2020; Brands et al., 2023). Predictions from single models are very similar to those from binary stars at such ages. At 4 Myr, preferred from predicted optical WR bumps, N v 1238–42 is now too weak, Si iv 1393–1402 is too strong, with He ii 1640 again too weak despite arising from classical WR stars. A stellar mass of 9 is required for the binary models to reproduce the far-UV luminosity of NGC 2070 at 4 Myr, with 10 classical WR stars predicted (mix of WN and WC). Overall the 2 Myr BPASS models (single or binary) provide the closest match to UV observations, aside from the weakness of He ii 1640.
5 Discussion and conclusions
We present the integrated VLT/MUSE spectrum of the central 22 arcmin2 (3030 pc2) region of NGC 2070, the dominant giant H ii region of the Tarantula (30 Doradus) region in the LMC, and construct an empirical far-UV spectrum of this region by combining observations of individual stars with templates from the ULLYSES survey (Roman-Duval et al., 2020). This region is unique in the sense that we are able to compare results from an individual treatment of stars with an integrated approach, plus both classical Wolf-Rayet stars and VMS have been identified within this region. A summary of UV and optical results is presented in Table 4.
Martins et al. (2023) consider UV and optical spectroscopic indicators of WR and very massive stars in nearby star-forming regions, favouring optical diagnostics to identify the latter. Neither the far-UV (HST) nor optical (MUSE) spectroscopy of NGC 2070 permit unique diagnostics of VMS since both populations have similar He ii 1640 morphologies (Fig. 4) and metal lines in the vicinity of He ii 4686 are dominated by classical WR stars (Fig. 2). Consequently, despite NGC 2070 having the richest VMS population in the Local Group, their presence is masked by its mixed age population, which includes classical WR stars. Nevertheless, unambigious diagnostics of very young populations (required for VMS) exist in the optical (Martins et al., 2023) and far-UV (Crowther et al., 2016), the latter involving the presence of P Cygni O v 1371 and He ii 1640 emission with Si iv 1393-1402 absent.
If we were reliant solely on integrated visual spectroscopy of NGC 2070 we would substantially underestimate its metallicity from strong line diagnostics (Marino et al., 2013; Curti et al., 2017) but obtain an age of the stellar population (4 Myr from Starburst99 and BPASS, 3.5 Myr from CB19) in close agreement with the median age of massive stars within the region. The Starburst99 inferred mass is broadly consistent with that of the star cluster R136 (Hunter et al., 1995; Andersen et al., 2009) which likely dominates the stellar mass of the region. The strength of WR bumps from historical LMC metallicity models (Meynet et al., 1994) implemented in Starburst99 are underestimated, although results from contemporary LMC models (Chen et al., 2015) plus a high = 300 in CB19 and BPASS models are improved for He ii 4686 and C iv 5801-12. The number of WR stars estimated from line luminosities of blue and yellow WR bumps is in good agreement with latest empirical calibrations for LMC metallicity (Crowther et al., 2023).
Starburst99 predictions from Z=0.008 metallicity evolutionary models (Meynet et al., 1994) plus Magellanic Cloud empirical UV templates are incapable of reproducing the primary wind features in the integrated far-UV spectrum of NGC 2070 at a single age. For example, the maximum predicted emission (He ii 1640) = 1.5Å, a factor of three lower than observed (4.70.2Å). Starburst99 models using contemporary solar metallicity models (Ekström et al., 2012) and Milky Way templates at 3.2 Myr provide a better match despite an unphysical metallicity. Various reasons for these deficiencies are set out in Section 4 including the mixed age of massive stars contributing to the integrated light (only 1/5 arises from the R136 cluster), plus the lack of high quality empirical templates (e.g. ULLYSES, Roman-Duval et al., 2020), neglect of very massive stars and the lack of binary evolutionary models.
CB19 models accounting for Z=0.008 evolutionary models (Chen et al., 2015) and synthetic spectra are more successful at reproducing He ii 1640 emission at 2.2 Myr since they extend to higher initial masses = 300 ) and fold in contemporary mass-loss prescriptions for very massive stars, although no single age provides a satisfactory solution for all UV diagnostics. BPASS (Eldridge et al., 2017) models incorporate binary evolution, but do not currently incorporate enhanced mass-loss for very massive stars resulting from their proximity to the Eddington limit. Consequently BPASS models are unable to reproduce strong He ii 1640 in metal poor models even with = 300 ).
Fixing Z=0.008 and combining UV and optical spectroscopic diagnostics, Starburst99 models at 4.2 Myr are capable of reproducing some optical (H, C iv 5801-12) and UV (Si iv 1393-1402) features of NGC 2070, although He ii 1640, 4686 and C iv 1548–51 are too weak. CB19 models at 3.8 Myr provide a better match to He ii 1640 and 4686, although C iv 1548–51 and 5801-12 are too weak, while BPASS models at 4 Myr underpredict He ii 1640, 4686, overpredicts C iv 58012-12, with Si iv 1393-1402 and C iv 1548-51 broadly satisfactory. In view of our results, caution should be given to specific ages and metallicities of young, unresolved stellar populations (see Martins & Palacios, 2022; Wofford et al., 2023). Should observed regions include multiple star clusters or clusters embedded within extended star-forming regions, it would be more realistic to incorporate either a dual or multiple populations (e.g. Chisholm et al., 2019; Sirressi et al., 2022), although the extended population of NGC 2070 is far from coeval (Schneider et al., 2018b).
| Property | Individual | Ref | Integrated | This study |
|---|---|---|---|---|
| Visual (MUSE) | ||||
| Age (Myr) | 1–7, 1–2.5 | a,b | 4.2, 3.0, 4 | SB99, CB19, BPASS |
| Mass () | 0.5–1.0 | c,d | 0.85, 0.6, 1.1 | SB99, CB19, BPASS |
| ) | 270 | b | 100–300 | CB19 |
| N(WN) | 11 | e | 10–17 | WR templates |
| N(WC4) | 2 | e | 4 | WR templates |
| (O/H)+12 | 8.26–8.5 | f,g | 7.9–8.1 | N2, O3N2 diagnostics |
| Far-UV (HST) | ||||
| Age (Myr) | 1.5 | h | 4.2, 2.2, 2 | SB99, CB19, BPASS |
| Mass () | 0.85, 0.4, 0.5 | SB99, CB19, BPASS | ||
| ) | 250 | h | 300 | CB19 |
| 0.014 | SB99 | |||
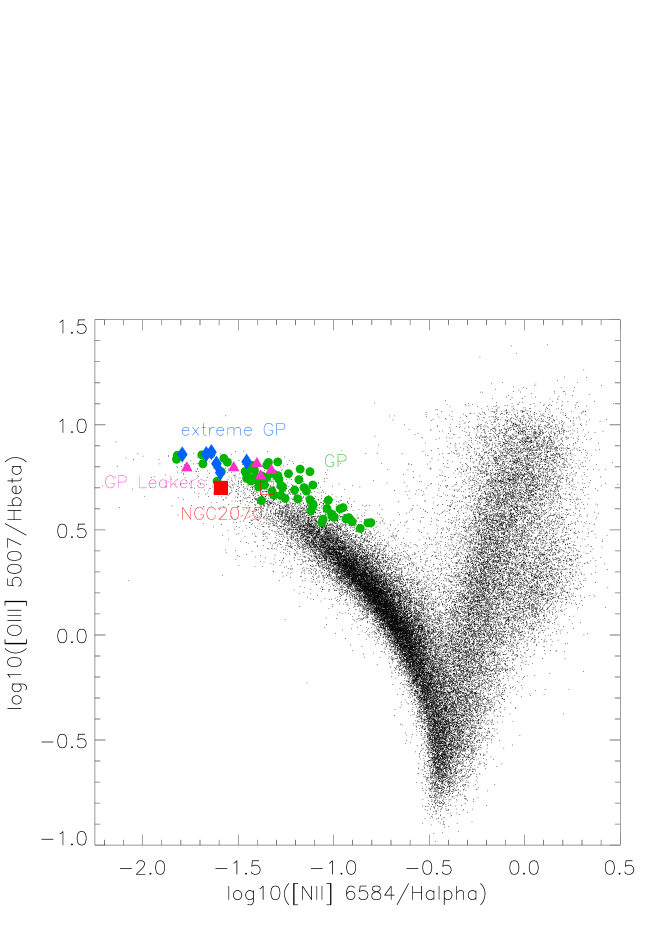
Although NGC 2070 is located in the LMC, our nearest extragalactic star-forming galaxy, if one compares its nebular properties in the BPT diagram (Baldwin et al., 1981), it is located close to extreme Green Pea galaxies (Cardamone et al., 2009) as shown in Fig. 15. Green Pea galaxies have received considerable interest since a subset have been established as Lyman continuum leakers (Izotov et al., 2016). H observations of NGC 2070 (Fig. 1) suggests a significant fraction of ionizing photons escape the region. By way of example, BPASS models at 4 Myr favour a stellar mass of from FUV–optical continua, but only from its H luminosity, favouring a sizeable escape fraction of ionizing photons (see also Doran et al., 2013).
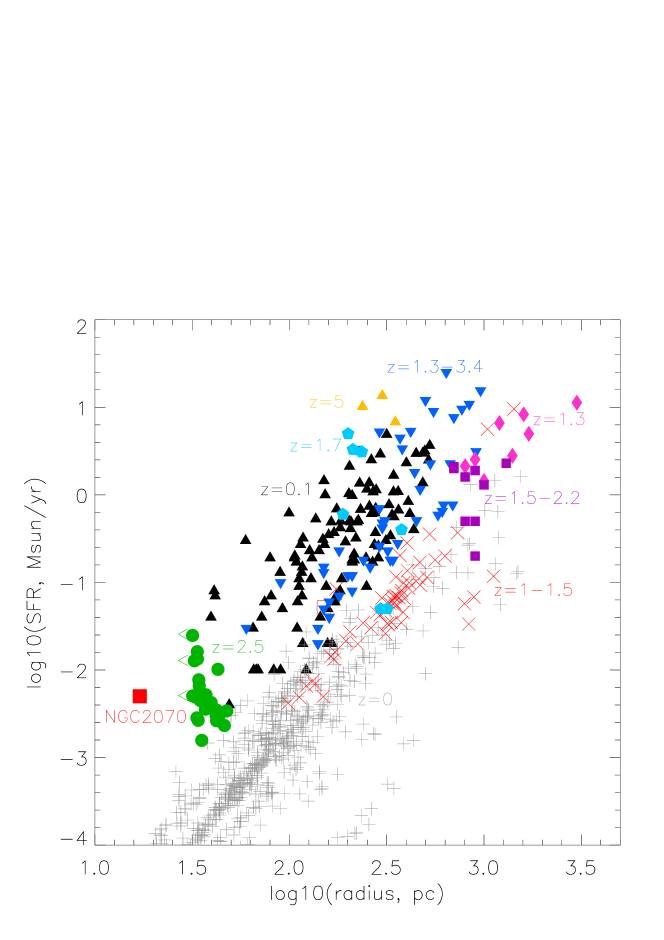
The relatively high star-formation rate of NGC 2070 for its size is also more comparable to the properties of star-forming knots at high redshift with respect to local star-forming galaxies (Kennicutt et al., 2003), as shown in Fig. 16. Specifically, NGC 2070 properties are close to clumps in the lensed galaxy SDSS J1110+6459 at 2.5 (Johnson et al., 2017). Star-forming knots in the lensed Sunburst arc have a similar size to NGC 2070 but are significantly more intensive (Rivera-Thorsen et al., 2017, 2019; Vanzella et al., 2022).
As we have shown, the ULLYSES survey (Roman-Duval et al., 2020) provides high quality far-UV empirical templates for OB stars at half-solar metallicity, which serve as alternatives to widely used theoretical models (Leitherer et al., 2010) in population synthesis tools. High quality optical VLT/Shooter spectroscopy of ULLYSES targets has also been acquired (XshootU, Vink et al., 2023), which complement the present MUSE observations since templates achieve higher spectral resolution, extend to the violet and complement existing optical spectroscopic libraries of massive stars (e.g. Verro et al., 2022).
Indeed, ULLYSES/XshootU spectroscopy have been secured for a large number of OB stars in the SMC. Ideally we would wish to extend this study to the 1/5 solar metallicity of the SMC. The richest young star formation region in the SMC is NGC 346 (Massey et al., 1989). STIS/G140L spectroscopy has recently been obtained for the O stars within the central region of this giant H ii region (Rickard et al., 2022), whose central 11 arcmin2 (2020 pc2) has been observed with VLT/MUSE. Unfortunately, NGC 346 lacks a massive young star cluster at its heart such that any analysis would need to reflect stochasticity in both its star formation history and IMF (e.g. da Silva et al., 2014; Krumholz et al., 2015; Orozco-Duarte et al., 2022).
Nevertheless, there are other large star-forming complexes in the Magellanic Clouds (Evans et al., 2006), for which quantitative UV-optical analysis could be undertaken based on ULLYSES templates plus integral field observations from the upcoming SDSS-V Local Volume Mapper (LVM, Kollmeier et al., 2017).
Acknowledgements
This study has been made possible courtesy of: (i) Science Verification MUSE observations of NGC 2070 (proposal led by Jorge Melnick and Chris Evans); (ii) the Director’s Discretionary ULLYSES survey, which was implemented by a Space Telescope Science Institute (STScI) team led by Julia Roman-Duval, having been recommended by the Hubble UV Legacy Science Definition Working Group chaired by Sally Oey, convened in 2018 by the then STScI Director Ken Sembach. Thanks to Linda Smith for providing useful comments on a draft version of the manuscript, and the referee for feedback which helped to improve the clarity of the paper.
Based on observations made with ESO telescopes at the Paranal observatory under programme ID 60.A-9351(A) and observations obtained with the NASA/ESA Hubble Space Telescope, retrieved from the Mikulski Archive for Space Telescopes (MAST) at the STScI. STScI is operated by the Association of Universities for Research in Astronomy, Inc. under NASA contract NAS 5-26555. PAC is supported by the Science and Technology Facilities Council research grant ST/V000853/1 (PI. V. Dhillon). NC gratefully acknowledges funding from the Deutsche Forschungsgemeinschaft (DFG) CA 255/1-1.
This research has made use of the SIMBAD database, operated at CDS, Strasbourg, France. Starlink software is currently supported by the East Asian Observatory. iraf was distributed by the National Optical Astronomy Observatory, which was managed by the Association of Universities for Research in Astronomy (AURA) under a cooperative agreement with the National Science Foundation. For the purpose of open access, the author has applied a Creative Commons Attribution (CC BY) license to any Author Accepted Manuscript version arising.
Data Availability
The integrated MUSE and far-UV spectroscopy of NGC 2070 are available in ascii format (wavelength in Å, flux in erg s-1 cm-2 Å-1) at 10.5281/zenodo.10204404.
References
- Abazajian et al. (2009) Abazajian K. N., et al., 2009, ApJS, 182, 543
- Andersen et al. (2009) Andersen M., Zinnecker H., Moneti A., McCaughrean M. J., Brandl B., Brandner W., Meylan G., Hunter D., 2009, ApJ, 707, 1347
- Bacon et al. (2010) Bacon R., et al., 2010, in McLean I. S., Ramsay S. K., Takami H., eds, Society of Photo-Optical Instrumentation Engineers (SPIE) Conference Series Vol. 7735, Ground-based and Airborne Instrumentation for Astronomy III. p. 773508 (arXiv:2211.16795), doi:10.1117/12.856027
- Baldwin et al. (1981) Baldwin J. A., Phillips M. M., Terlevich R., 1981, PASP, 93, 5
- Bartzakos et al. (2001) Bartzakos P., Moffat A. F. J., Niemela V. S., 2001, MNRAS, 324, 18
- Berg et al. (2022) Berg D. A., et al., 2022, ApJS, 261, 31
- Bestenlehner (2020) Bestenlehner J. M., 2020, MNRAS, 493, 3938
- Bestenlehner et al. (2014) Bestenlehner J. M., et al., 2014, A&A, 570, A38
- Bestenlehner et al. (2020) Bestenlehner J. M., et al., 2020, MNRAS, 499, 1918
- Bestenlehner et al. (2022) Bestenlehner J. M., Crowther P. A., Broos P. S., Pollock A. M. T., Townsley L. K., 2022, MNRAS, 510, 6133
- Bosch et al. (1999) Bosch G., Terlevich R., Melnick J., Selman F., 1999, A&AS, 137, 21
- Brands et al. (2022) Brands S. A., et al., 2022, A&A, 663, A36
- Brands et al. (2023) Brands S. A., de Koter A., Bestenlehner J. M., Crowther P. A., Kaper L., Caballero-Nieves S. M., Gräfener G., 2023, A&A, 673, A132
- Brott et al. (2011) Brott I., et al., 2011, A&A, 530, A115
- Bruzual & Charlot (2003) Bruzual G., Charlot S., 2003, MNRAS, 344, 1000
- Cardamone et al. (2009) Cardamone C., et al., 2009, MNRAS, 399, 1191
- Carnall et al. (2023) Carnall A. C., et al., 2023, MNRAS, 518, L45
- Castro et al. (2018) Castro N., Crowther P. A., Evans C. J., Mackey J., Castro-Rodriguez N., Vink J. S., Melnick J., Selman F., 2018, A&A, 614, A147
- Castro et al. (2021a) Castro N., et al., 2021a, The Messenger, 182, 50
- Castro et al. (2021b) Castro N., et al., 2021b, A&A, 648, A65
- Chandar et al. (2004) Chandar R., Leitherer C., Tremonti C. A., 2004, ApJ, 604, 153
- Chen et al. (2015) Chen Y., Bressan A., Girardi L., Marigo P., Kong X., Lanza A., 2015, MNRAS, 452, 1068
- Chisholm et al. (2019) Chisholm J., Rigby J. R., Bayliss M., Berg D. A., Dahle H., Gladders M., Sharon K., 2019, ApJ, 882, 182
- Crowther (2019) Crowther P. A., 2019, Galaxies, 7, 88
- Crowther (2022) Crowther P. A., 2022, arXiv e-prints, p. arXiv:2207.08690
- Crowther & Dessart (1998) Crowther P. A., Dessart L., 1998, MNRAS, 296, 622
- Crowther & Smith (1997) Crowther P. A., Smith L. J., 1997, A&A, 320, 500
- Crowther & Walborn (2011) Crowther P. A., Walborn N. R., 2011, MNRAS, 416, 1311
- Crowther et al. (2010) Crowther P. A., Schnurr O., Hirschi R., Yusof N., Parker R. J., Goodwin S. P., Kassim H. A., 2010, MNRAS, 408, 731
- Crowther et al. (2016) Crowther P. A., et al., 2016, MNRAS, 458, 624
- Crowther et al. (2017) Crowther P. A., Castro N., Evans C. J., Vink J. S., Melnick J., Selman F., 2017, The Messenger, 170, 40
- Crowther et al. (2022) Crowther P. A., Broos P. S., Townsley L. K., Pollock A. M. T., Tehrani K. A., Gagné M., 2022, MNRAS, 515, 4130
- Crowther et al. (2023) Crowther P. A., Rate G., Bestenlehner J. M., 2023, MNRAS, 521, 585
- Curti et al. (2017) Curti M., Cresci G., Mannucci F., Marconi A., Maiolino R., Esposito S., 2017, MNRAS, 465, 1384
- Curtis-Lake et al. (2023) Curtis-Lake E., et al., 2023, Nature Astronomy, 7, 622
- da Silva et al. (2014) da Silva R. L., Fumagalli M., Krumholz M. R., 2014, MNRAS, 444, 3275
- de Koter et al. (1997) de Koter A., Heap S. R., Hubeny I., 1997, ApJ, 477, 792
- de Koter et al. (1998) de Koter A., Heap S. R., Hubeny I., 1998, ApJ, 509, 879
- De Marchi & Panagia (2014) De Marchi G., Panagia N., 2014, MNRAS, 445, 93
- De Marchi et al. (2011) De Marchi G., et al., 2011, ApJ, 739, 27
- Doran et al. (2013) Doran E. I., et al., 2013, A&A, 558, A134
- Easeman et al. (2023) Easeman B., Schady P., Wuyts S., Yates R., 2023, MNRAS, arXiv:2311.03514
- Eggenberger et al. (2021) Eggenberger P., et al., 2021, A&A, 652, A137
- Ekström et al. (2012) Ekström S., et al., 2012, A&A, 537, A146
- Eldridge et al. (2017) Eldridge J. J., Stanway E. R., Xiao L., McClelland L. A. S., Taylor G., Ng M., Greis S. M. L., Bray J. C., 2017, Publ. Astron. Soc. Australia, 34, e058
- Evans et al. (2006) Evans C. J., Lennon D. J., Smartt S. J., Trundle C., 2006, A&A, 456, 623
- Evans et al. (2011) Evans C. J., et al., 2011, A&A, 530, A108
- Evans et al. (2015) Evans C. J., et al., 2015, A&A, 574, A13
- Fahrion & De Marchi (2023) Fahrion K., De Marchi G., 2023, arXiv e-prints, arXiv:2311.06336
- Feast et al. (1960) Feast M. W., Thackeray A. D., Wesselink A. J., 1960, MNRAS, 121, 337
- Fitzpatrick & Savage (1984) Fitzpatrick E. L., Savage B. D., 1984, ApJ, 279, 578
- Georgy et al. (2013) Georgy C., et al., 2013, A&A, 558, A103
- Gräfener et al. (2002) Gräfener G., Koesterke L., Hamann W. R., 2002, A&A, 387, 244
- Hamann et al. (2019) Hamann W. R., et al., 2019, A&A, 625, A57
- Heap et al. (1992) Heap S. R., Ebbets D., Malumuth E., 1992, in European Southern Observatory Conference and Workshop Proceedings. p. 347
- Hénault-Brunet et al. (2012) Hénault-Brunet V., et al., 2012, A&A, 546, A73
- Hillier & Miller (1998) Hillier D. J., Miller D. L., 1998, ApJ, 496, 407
- Howarth (1983) Howarth I. D., 1983, MNRAS, 203, 301
- Howarth et al. (2004) Howarth I. D., Murray J., Mills D., Berry D. S., 2004, Starlink User Note, 50
- Hunter et al. (1995) Hunter D. A., Shaya E. J., Holtzman J. A., Light R. M., O’Neil Earl J. J., Lynds R., 1995, ApJ, 448, 179
- Izotov et al. (2016) Izotov Y. I., Schaerer D., Thuan T. X., Worseck G., Guseva N. G., Orlitová I., Verhamme A., 2016, MNRAS, 461, 3683
- James et al. (2014) James B. L., Aloisi A., Heckman T., Sohn S. T., Wolfe M. A., 2014, ApJ, 795, 109
- Johnson et al. (2017) Johnson T. L., et al., 2017, ApJ, 843, L21
- Kalari et al. (2022) Kalari V. M., Horch E. P., Salinas R., Vink J. S., Andersen M., Bestenlehner J. M., Rubio M., 2022, ApJ, 935, 162
- Keenan et al. (2001) Keenan F. P., Aller L. H., Ryans R. S. I., Hyung S., 2001, Proceedings of the National Academy of Science, 98, 9476
- Kennicutt (1998) Kennicutt R. C. Jr., 1998, ARA&A, 36, 189
- Kennicutt et al. (1995) Kennicutt R. C. Jr., Bresolin F., Bomans D. J., Bothun G. D., Thompson I. B., 1995, AJ, 109, 594
- Kennicutt et al. (2003) Kennicutt R. C. Jr., et al., 2003, PASP, 115, 928
- Kewley & Dopita (2002) Kewley L. J., Dopita M. A., 2002, ApJS, 142, 35
- Kollmeier et al. (2017) Kollmeier J. A., et al., 2017, arXiv e-prints, p. arXiv:1711.03234
- Kroupa (2008) Kroupa P., 2008, in Knapen J. H., Mahoney T. J., Vazdekis A., eds, Astronomical Society of the Pacific Conference Series Vol. 390, Pathways Through an Eclectic Universe. p. 3 (arXiv:0708.1164), doi:10.48550/arXiv.0708.1164
- Krumholz et al. (2015) Krumholz M. R., Fumagalli M., da Silva R. L., Rendahl T., Parra J., 2015, MNRAS, 452, 1447
- Lanz & Hubeny (2007) Lanz T., Hubeny I., 2007, ApJS, 169, 83
- Leitherer et al. (1999) Leitherer C., et al., 1999, ApJS, 123, 3
- Leitherer et al. (2010) Leitherer C., Ortiz Otálvaro P. A., Bresolin F., Kudritzki R.-P., Lo Faro B., Pauldrach A. W. A., Pettini M., Rix S. A., 2010, ApJS, 189, 309
- Leitherer et al. (2014) Leitherer C., Ekström S., Meynet G., Schaerer D., Agienko K. B., Levesque E. M., 2014, ApJS, 212, 14
- Leitherer et al. (2018) Leitherer C., Byler N., Lee J. C., Levesque E. M., 2018, ApJ, 865, 55
- Maiolino & Mannucci (2019) Maiolino R., Mannucci F., 2019, A&ARv, 27, 3
- Maíz Apellániz et al. (2014) Maíz Apellániz J., et al., 2014, A&A, 564, A63
- Marino et al. (2013) Marino R. A., et al., 2013, A&A, 559, A114
- Martins & Palacios (2022) Martins F., Palacios A., 2022, A&A, 659, A163
- Martins et al. (2023) Martins F., Schaerer D., Marques-Chaves R., Upadhyaya A., 2023, A&A, 678, A159
- Massey & Hunter (1998) Massey P., Hunter D. A., 1998, ApJ, 493, 180
- Massey et al. (1989) Massey P., Parker J. W., Garmany C. D., 1989, AJ, 98, 1305
- Massey et al. (2002) Massey P., Penny L. R., Vukovich J., 2002, ApJ, 565, 982
- Massey et al. (2005) Massey P., Puls J., Pauldrach A. W. A., Bresolin F., Kudritzki R. P., Simon T., 2005, ApJ, 627, 477
- Massey et al. (2012) Massey P., Morrell N. I., Neugent K. F., Penny L. R., DeGioia-Eastwood K., Gies D. R., 2012, ApJ, 748, 96
- Melnick (1985) Melnick J., 1985, A&A, 153, 235
- Meynet et al. (1994) Meynet G., Maeder A., Schaller G., Schaerer D., Charbonnel C., 1994, A&AS, 103, 97
- Micheva et al. (2017) Micheva G., Oey M. S., Jaskot A. E., James B. L., 2017, ApJ, 845, 165
- Mokiem et al. (2007) Mokiem M. R., et al., 2007, A&A, 473, 603
- Orozco-Duarte et al. (2022) Orozco-Duarte R., et al., 2022, MNRAS, 509, 522
- Pagel et al. (1978) Pagel B. E. J., Edmunds M. G., Fosbury R. A. E., Webster B. L., 1978, MNRAS, 184, 569
- Parker (1993) Parker J. W., 1993, AJ, 106, 560
- Pauldrach et al. (2001) Pauldrach A. W. A., Hoffmann T. L., Lennon M., 2001, A&A, 375, 161
- Peimbert (2003) Peimbert A., 2003, ApJ, 584, 735
- Pellegrini et al. (2010) Pellegrini E. W., Baldwin J. A., Ferland G. J., 2010, ApJS, 191, 160
- Pellegrini et al. (2011) Pellegrini E. W., Baldwin J. A., Ferland G. J., 2011, ApJ, 738, 34
- Plat et al. (2019) Plat A., Charlot S., Bruzual G., Feltre A., Vidal-García A., Morisset C., Chevallard J., Todt H., 2019, MNRAS, 490, 978
- Prinja & Crowther (1998) Prinja R. K., Crowther P. A., 1998, MNRAS, 300, 828
- Ramírez-Agudelo et al. (2017) Ramírez-Agudelo O. H., et al., 2017, A&A, 600, A81
- Rickard et al. (2022) Rickard M. J., et al., 2022, A&A, 666, A189
- Rivera-Thorsen et al. (2017) Rivera-Thorsen T. E., et al., 2017, A&A, 608, L4
- Rivera-Thorsen et al. (2019) Rivera-Thorsen T. E., et al., 2019, Science, 366, 738
- Robert et al. (1993) Robert C., Leitherer C., Heckman T. M., 1993, ApJ, 418, 749
- Roman-Duval et al. (2020) Roman-Duval J., et al., 2020, Research Notes of the American Astronomical Society, 4, 205
- Russell & Dopita (1990) Russell S. C., Dopita M. A., 1990, ApJS, 74, 93
- Sabbi et al. (2013) Sabbi E., et al., 2013, AJ, 146, 53
- Sabbi et al. (2016) Sabbi E., et al., 2016, ApJS, 222, 11
- Sabín-Sanjulián et al. (2017) Sabín-Sanjulián C., et al., 2017, A&A, 601, A79
- Sana et al. (2013) Sana H., et al., 2013, A&A, 550, A107
- Sánchez et al. (2022) Sánchez S. F., et al., 2022, ApJS, 262, 36
- Saxena et al. (2020) Saxena A., et al., 2020, A&A, 636, A47
- Schaerer & Vacca (1998) Schaerer D., Vacca W. D., 1998, ApJ, 497, 618
- Schaller et al. (1992) Schaller G., Schaerer D., Meynet G., Maeder A., 1992, A&AS, 96, 269
- Schneider et al. (2018a) Schneider F. R. N., et al., 2018a, Science, 359, 69
- Schneider et al. (2018b) Schneider F. R. N., et al., 2018b, A&A, 618, A73
- Selman et al. (1999) Selman F., Melnick J., Bosch G., Terlevich R., 1999, A&A, 341, 98
- Shenar et al. (2017) Shenar T., et al., 2017, A&A, 598, A85
- Shenar et al. (2019) Shenar T., et al., 2019, A&A, 627, A151
- Shenar et al. (2022) Shenar T., et al., 2022, A&A, 665, A148
- Sidoli et al. (2006) Sidoli F., Smith L. J., Crowther P. A., 2006, MNRAS, 370, 799
- Sirressi et al. (2022) Sirressi M., et al., 2022, AJ, 164, 208
- Smith et al. (2002) Smith L. J., Norris R. P. F., Crowther P. A., 2002, MNRAS, 337, 1309
- Smith et al. (2016) Smith L. J., Crowther P. A., Calzetti D., Sidoli F., 2016, ApJ, 823, 38
- Smith et al. (2023) Smith L. J., et al., 2023, arXiv e-prints, arXiv:2310.03413
- Stanway & Eldridge (2018) Stanway E. R., Eldridge J. J., 2018, MNRAS, 479, 75
- Steidel et al. (2016) Steidel C. C., Strom A. L., Pettini M., Rudie G. C., Reddy N. A., Trainor R. F., 2016, ApJ, 826, 159
- Tehrani et al. (2019) Tehrani K. A., Crowther P. A., Bestenlehner J. M., Littlefair S. P., Pollock A. M. T., Parker R. J., Schnurr O., 2019, MNRAS, 484, 2692
- Vacca et al. (1995) Vacca W. D., Robert C., Leitherer C., Conti P. S., 1995, ApJ, 444, 647
- Vanzella et al. (2022) Vanzella E., et al., 2022, A&A, 659, A2
- Vermeij & van der Hulst (2002) Vermeij R., van der Hulst J. M., 2002, A&A, 391, 1081
- Verro et al. (2022) Verro K., et al., 2022, A&A, 661, A50
- Vink et al. (2011) Vink J. S., Muijres L. E., Anthonisse B., de Koter A., Gräfener G., Langer N., 2011, A&A, 531, A132
- Vink et al. (2023) Vink J. S., et al., 2023, A&A, 675, A154
- Walborn & Blades (1997) Walborn N. R., Blades J. C., 1997, ApJS, 112, 457
- Walborn et al. (2014) Walborn N. R., et al., 2014, A&A, 564, A40
- Welty et al. (2012) Welty D. E., Xue R., Wong T., 2012, ApJ, 745, 173
- Wofford et al. (2013) Wofford A., Leitherer C., Salzer J., 2013, ApJ, 765, 118
- Wofford et al. (2014) Wofford A., Leitherer C., Chandar R., Bouret J.-C., 2014, ApJ, 781, 122
- Wofford et al. (2023) Wofford A., et al., 2023, MNRAS, 523, 3949
- Wong et al. (2022) Wong T., et al., 2022, ApJ, 932, 47
Appendix A Template UV spectra
The NGC 2070 far-ultraviolet spectrum has been constructed from a combination of empirical spectra (of individual stars) and use of template OB stars (Table 5) and Of/WN and WR stars (Table 6 for the remainder, primarily drawn from Data Release 6 (DR6) of the ULLYSES survey (Roman-Duval et al., 2020). Figures 17–20 present cumulative far-UV spectra for O, Of/WN, WR and B stars, respectively, including breakdowns between empirical datasets and templates (separated into supergiants and non-supergiants for B stars).
| — Dwarf — | — Giant — | — Supergiant — | ||||
| Template | Star (Sp Type) | Instrument/Grating | Star (Sp Type) | Instrument/Grating | Star (Sp Type) | Instrument/Grating |
| O2 | BI 237 (O2 V) | COS G1#0M | VFTS 72 (O2 V–III) | COS G1#0M | Mk 42 (O2 If*) | STIS/E140M |
| O2.5 | VFTS 169 (O2.5 V) | COS G1#0M | N11 ELS 26 (O2.5 III) | COS G1#0M | ||
| O3 | N11 ELS 60 (O3 V) | COS G1#0M | VFTS 267 (O3 III-I) | COS G1#0M | VFTS 180 (O3 If*) | STIS E140M |
| O3.5 | VFTS 404 (O3.5: V:) | COS G1#0M | ||||
| O4 | W61 28-5 (O4 V) | COS G1#0M | Sk –67∘ 69 (O4 III) | STIS E140M | Sk –67∘ 166 (O4 I) | STIS E140M |
| O4.5 | Sk –70∘ 60 (O4–5 V) | STIS E140M | ||||
| O5 | PGMW 3120 (O5.5 V) | STIS E140M | N11 ELS 38 (O5 III) | COS G1#0M | [ST92] 4-18 (O5 If) | COS G1#0M |
| O6 | PGMW 3070 (O6 V) | STIS E140M | Sk –71∘ 19 (O6 III) | COS G1#0M | Sk –67∘ 111 (O6 Iafpv) | STIS E140M |
| O6.5 | Sk –71∘ 50 (O6.5 III) | STIS E140M | ||||
| O7 | Sk –67∘ 118 (O7 V) | STIS E140M | BI 272 (O7 II) | STIS E140M | Sk –69∘ 83 (O7.5 Iaf) | STIS E140M |
| O8 | BI 184 (O8 V) | COS G1#0M | Sk –67∘ 101 (O8 II) | STIS E140M | PGMW 1363 (O8.5 Iaf) | STIS E140M |
| O9 | VFTS 66 (O9 V) | COS G1#0M | Sk –71∘ 8 (O9 II) | STIS E140M | Sk –67∘ 107 (O9 Ib) | STIS E140M |
| O9.5 | Sk –66∘ 17 (OC9.5 II) | COS G1#0M | Sk –67∘ 5 (O9.7 Ib) | STIS E140M | ||
| B0 | HV 5622 (B0 V) | COS G1#0M | Sk –70∘ 79 (B0 III) | STIS E140M | Sk –68∘ 52 (B0 Ia) | STIS E140M |
| B0.5 | Sk –67∘ 216 (B0.5 V) | STIS E140M | Sk –68∘ 155 (B0.5 I) | COS G1#0M | ||
| B0.7 | Sk –68∘ 140 (B0.7 Ib-Iab) | COS G1#0M | ||||
| B1 | Sk –65∘ 2 (B1 V) | STIS E140M | Sk –71∘ 35 (B1 II) | COS G1#0M | Sk –66∘ 35 (BC1 Ia) | COS G1#0M |
| B1.5 | Sk –67∘ 14 (B1.5 Ia) | STIS E140M | ||||
| B2 | Sk –68∘ 26 (BC2 Ia) | COS G1#0M | ||||
| B9 | Sk –67∘ 207 (B9 Ia) | COS G1#0M | ||||
| Template | Star (Sp Type) | Instrument/Grating |
|---|---|---|
| O2 If/WN5 | Sk -67∘ 22 (O2 If/WN5) | STIS/E140M |
| O2.5 If/WN6 | Mk 39 (O2.5 If/WN6) | COS G130M+G160M |
| O3.5 If/WN7 | Mk 51 (O3.5 If/WN7) | COS G140Lc |
| O4 If/WN8 | R136b (O4 If/WN8) | GHRS G140La |
| WN5h | R136a3 (WN5h) | GHRS G140Lb |
| WN6 | Sk -71∘ 21 (WN6h) | STIS E140M |
| WN7–8 | VFTS 108 (WN7h) | COS G140Lc |
| WC4 | Sk -69∘ 191 (WC4) | STIS E140M |
Appendix B Census of far-UV brightest sources of NGC 2070
Table 7 lists stars of known spectral type within the MUSE footprint, sorted by far-UV flux, based on a calibration of F275W or F336W photometry drawn from HTTP (Sabbi et al., 2013, 2016). HSH95-17 is included since it lies within R136 GHRS/G140L 22 arcsec2 region and is considered to be an early O star (Kalari et al., 2022), although a few other sources exceeding erg s-1 cm-2Å-1 have been excluded since their spectral types are unknown. These include HSH95-76 (P 870, = 13.57 mag, Sabbi et al. (2016)), SMB 136 ( = 13.88 mag, Sabbi et al. (2016)), HSH95-87 ( = 14.27 mag, Sabbi et al. (2016)), HSH95 120 (= 14.55 mag, Sabbi et al. (2016)), HSH95-139 ( = 14.80 mag, Hunter et al. (1995)), HSH95-129 ( = 14.97 mag, Hunter et al. (1995)).
Table 8 lists stars of known spectral type beyond the MUSE footprint but within the arcmin2 region sampled with IUE/SWP (Vacca et al., 1995), sorted by far-UV flux, based on a calibration of F275W or F336W photometry drawn from HTTP (Sabbi et al., 2013, 2016). Bright sources lacking spectral types include SMB-183 ( = 14.11 mag, Sabbi et al. (2016)), SMB-196 ( = 14.27 mag, Sabbi et al. (2016)) and SMB-245 ( = 14.67 mag, Sabbi et al. (2016)).
| R | Mk | P | HSH | SMB | VFTS | CCE | SpT | Ref | HTTP | Ref | Spectrum | Ref | VMS | ||||
|---|---|---|---|---|---|---|---|---|---|---|---|---|---|---|---|---|---|
| mag | mag | mag | (Template) | ||||||||||||||
| 140a | 877 | 6 | 507 | 3191 | WC4+WN6+ | Do13 | 053841.601-690513.43 | 10.97 | 11.28 | 12.20 | S | 3.72 | STIS/E140M | 1 | |||
| 136a1 | 3 | 7 | WN5h | CD98 | 11.20 | 12.28 | D | (3.32) | GHRS/G140L | 4 | |||||||
| 140b | 880 | 8 | 509 | 3174 | WN5(h)+O | Ev11 | 053841.613-690515.17 | 11.09 | 11.43 | 12.47 | S | (3.04) | (WN6) | ||||
| 42 | 922 | 2 | 10 | 2102 | O2 If | CW11 | 053842.104-690555.29 | 11.08 | 11.51 | 12.82 | S | 3.01 | STIS/E140M | 3 | |||
| 136a2 | 5 | WN5h | CD98 | 11.33 | 12.34 | D | (2.93) | GHRS/G140L | 4 | ||||||||
| 39 | 767 | 7 | 14 | 482 | 2003 | O2.5 If/WN6+ | Cr22 | 053840.214-690559.86 | 11.38 | 11.66 | 12.95 | S | 2.74 | COS/G1#0M | 3 | ||
| 142 | 987 | 1 | 3 | 533 | 2912 | B1.5 Ia+ | Ev15 | 053842.738-690542.57 | 10.84 | 11.13 | 11.79 | S | (2.50) | (B1.5 I) | |||
| 134 | 786 | 4 | 1001 | 1978 | WN6(h) | CS97 | 053840.539-690557.18 | 11.45 | 11.62 | 12.70 | S | (2.18) | (WN6) | ||||
| 137 | 548 | 5 | 431 | 2889 | B1.5 Ia | Ev15 | 053836.959-690507.84 | 11.04 | 11.30 | 12.08 | S | (2.08) | (B1.5 I) | ||||
| 25 | 871 | 19 | 506 | 2395 | ON2 V | Wa14 | 053841.545-690519.43 | 11.74 | 12.01 | 13.32 | S | 2.04 | COS/G1#0M | 3 | |||
| 141 | 1253 | 9 | 590 | 2190 | B0.7 Iab | Ev15 | 053845.579-690547.80 | 11.42 | 11.60 | 12.58 | S | (1.92) | (B0.7 I) | ||||
| 136a3 | 6 | WN5h | CD98 | 11.82 | 12.97 | D | (1.87) | GHRS/G140L | 4 | ||||||||
| 30 | 1018 | 15 | 24 | 542 | 2999 | O2 If/WN5 | CW11 | 053843.080-690546.86 | 11.91 | 12.22 | 13.48 | S | 1.85 | COS/G1#0M | 3 | ||
| 12 | 1257 | 11 | 591 | 1279 | B0.2 Ia | Ev15 | 053845.687-690622.49 | 11.68 | 12.56 | S | (1.80) | (B0 I) | |||||
| 35 | 1029 | 12 | 23 | 545 | 1474 | O2 If/WN5 | CW11 | 053843.202-690614.44 | 11.93 | 12.23 | 13.46 | S | (1.40) | (O2 I/WN5) | |||
| 32 | 1130 | 13 | 21 | 1034 | 3043 | O7.5 II | WB97 | 053844.192-690547.06 | 11.96 | 12.23 | 13.40 | S | (1.37) | (O8 III) | |||
| 34 | 1134 | 8 | 17 | 1766 | WN5h+WN5h | Te19 | 053844.252-690605.93 | 12.04 | 12.11 | 13.15 | S | (1.28) | (WN5) | ||||
| 138 | 499 | 4 | 424 | B9 I+p | Ev15 | 053836.132-690558.01 | 11.50 | 11.79 | S | (1.25) | (B9 I) | ||||||
| 37Wa | 917 | 11 | 25 | 1021 | 1349 | O4 If+ | MH98 | 053842.072-690614.32 | 12.16 | 12.35 | 13.36 | S | (1.14) | (O4 I) | |||
| 11 | 1500 | 15 | 641 | 762 | B0.5: I | Ev15 | 053849.723-690642.95 | 12.19 | 13.18 | S | (1.13) | (B0.5 I) | |||||
| 35Sa | 1036 | 23 | 37 | 1028 | 1423 | O4–5 V | WB97 | 053843.263-690616.51 | 12.18 | 12.53 | 13.85 | S | (1.12) | (O4.5 V) | |||
| 1080 | 25 | 39 | 1031 | 2186 | O3–4 V | Bo99 | 053843.684-690547.89 | 12.20 | 12.56 | 14.23 | S | (1.10) | (O3 V) | ||||
| 13 | 1311 | 40 | 599 | 1433 | O3 III | Wa14 | 053846.177-690617.39 | 12.28 | 12.63 | 13.85 | S | (1.02) | (O3 III) | ||||
| 26 | 1150 | 32 | 562 | 2819 | O4 III | WB97 | 053844.406-690536.22 | 12.28 | 12.46 | 13.70 | S | (1.02) | (O4 III) | ||||
| 136a5 | 20 | O2 If | Cr16 | 12.49 | 13.71 | D | (1.01) | GHRS/G140L | 4 | ||||||||
| 136c | 998 | 10 | 27 | 1025 | 1737 | WN5h+? | Cr10 | 12.54 | 13.43 | D | (0.97) | (WN5) | |||||
| 47 | 607 | 29 | 440 | 2417 | O6–6.5 III | Wa14 | 053837.729-690521.03 | 12.15 | 12.44 | 13.69 | S | 0.96 | STIS/E140M | 2 | |||
| 33Na | 1140 | 16 | 33 | 1943 | OC2.5 If+O4 V | Br22 | 053844.329-690554.66 | 12.37 | 12.55 | 13.64 | S | (0.94) | (O3 I) | ||||
| 54 | 488 | 16 | 420 | 1689 | B0.5 Ia | Ev15 | 053835.941-690609.23 | 12.20 | 12.26 | 13.10 | S | (0.93) | (B0.5 I) | ||||
| 27 | 850 | 38 | 502 | 2653 | O9.7 II | Wa14 | 053841.271-690532.44 | 12.39 | 12.67 | 13.82 | S | (0.92) | (O9.5 III) | ||||
| 1014 | 41 | 3062 | O8: | Ca21 | 053843.030-690540.44 | 12.43 | 12.57 | 13.60 | S | (0.89) | (O8 III) | ||||||
| 136a7 | 24 | 20 | O3 III(f*) | Be20 | 12.64 | 13.97 | S | (0.88) | GHRS/G140L | 4 | |||||||
| 860 | 28 | 53 | 1912 | O3 V | MH98 | 053841.490-690556.90 | 12.45 | 12.80 | 14.04 | S | (0.87) | (O3 V) | |||||
| 1231 | 31 | 585 | 2193 | O7 V | Wa14 | 053845.279-690546.53 | 12.66 | 13.78 | S | (0.87) | (O7 V) | ||||||
| 136b | 985 | 9 | 18 | 1669 | O4 If/WN8 | Cr16 | 12.27 | 13.24 | D | 0.86 | GHRS/G140L | 5 | |||||
| 37a | 949 | 14 | 28 | 1022 | 1442 | O3.5 If/WN7 | CW11 | 053842.397-690615.08 | 12.33 | 12.48 | 13.52 | S | 0.82 | (O3.5 If/WN7) | 6 | ||
| 24 | 1260 | 47 | 2760 | O3 V | WB97 | 053845.687-690539.02 | 12.53 | 12.73 | 13.96 | S | (0.81) | (O3 V) | |||||
| 140c | 908 | 55 | 519 | 3112 | O3–4((f))+OB | Wa14 | 053841.934-690513.02 | 12.53 | 12.81 | 14.18 | S | (0.81) | (O3.5 V) | ||||
| 863 | 29 | 56 | 1014 | 1956: | O3 V | MH98 | 053841.507-690600.92 | 12.55 | 12.90 | 14.18 | S | (0.80) | (O3 V) | ||||
| 33Sa | 1120 | 18 | 44 | 2177 | O3 III | Ma15 | 053844.123-690556.63 | 12.48 | 12.76 | 13.81 | S | 0.79 | (O3 III) | 6 | |||
| 50 | 643 | 34 | 450 | 1293 | O9.7 III:+O7:: | Wa14 | 053838.476-690621.96 | 12.57 | 12.75 | 13.69 | S | (0.78) | (O9.5 III) | ||||
| 136a4 | 21 | O3 V | Be20 | 12.81 | 13.96 | H | (0.75) | GHRS/G140L | 4 | ||||||||
| 923 | 33 | 60 | 1793 | O3 V | Ma05 | 053842.119-690600.73 | 13.09 | 14.33 | S | 0.75 | (O3 V) | 6 | |||||
| 136a6 #1 | 19 | O2 I(n)f*p+? | Be20 | 12.86 | 13.92 | H | (0.72) | GHRS/G140L | 4 | ||||||||
| 49 | 691 | 30 | 1261 | WN6(h) | CS97 | 053839.143-690621.24 | 12.66 | 12.62 | 13.41 | S | (0.71) | (WN6) | |||||
| 136a6 #2 | 26 | O2 I(n)f*p+? | Be20 | 12.89 | 14.19 | H | (0.70) | GHRS/G140L | 4 | ||||||||
| 912 | 38 | 70 | 1019 | 1608 | O3 V+O6 V | Ma02 | 053842.004-690607.56 | 12.72 | 13.02 | 14.30 | S | (0.68) | (O3 V) | ||||
| 6 | 1563 | 61 | 656 | 1979 | O7.5 IIIp | Wa14 | 053851.200-690559.28 | 12.73 | 13.11 | 14.36 | S | (0.68) | (O7 III) | ||||
| 8 | 1531 | 58 | 648 | 2780 | O5.5 IV | Wa14 | 053850.400-690538.17 | 12.73 | 12.96 | 14.23 | S | (0.67) | (O5.5 V) | ||||
| 38 | 930 | 45 | 525 | 1184 | B0 Ia | Wa14 | 053842.209-690625.56 | 12.55 | 12.79 | 13.83 | S | (0.67) | (B0 I) | ||||
| 136a8 | 27 | O2–3 V | Cr16 | 12.93 | 14.22 | H | (0.67) | GHRS/G140L | 4 | ||||||||
| 17 | O | Ka22 | 13.00 | 13.78 | H | (0.63) | GHRS/G140L | 4 | |||||||||
| 1273 | 59 | 1223 | O7: | Ca21 | 053845.842-690620.83 | 12.82 | 13.05 | 14.05 | S | (0.62) | (O7 III) | ||||||
| 30 | O6.5 Vz | Be20 | 13.02 | 14.21 | D | (0.62) | GHRS/G140L | 4 | |||||||||
| 31 | 35 | O2 V | Be20 | 053842.471-690604.53 | 12.89 | 14.05 | S | 0.61 | (O2 V) |
| R | Mk | P | HSH | SMB | VFTS | CCE | SpT | Ref | HTTP | Ref | Spectrum | Ref | VMS | ||||
|---|---|---|---|---|---|---|---|---|---|---|---|---|---|---|---|---|---|
| mag | mag | mag | (Template) | ||||||||||||||
| 713 | 72 | 2245 | O5 V | Bo99 | 053839.478-690510.36 | 12.85 | 13.20 | 14.60 | S | (0.60) | (O4.5 V) | ||||||
| 36 | O2 If | Be20 | 13.06 | 14.41 | S | (0.59) | (O2 I) | ||||||||||
| 35 | O3 V | Be20 | 13.12 | 14.43 | D | 0.55 | GHRS/G140L | 4 | |||||||||
| 975 | 71 | 2748 | O6–7 V | Bo99 | 053842.616-690536.74 | 12.93 | 13.18 | 14.50 | S | (0.56) | (O6 V) | ||||||
| 15 | 1312 | 43 | 2165 | O7 V | WB97 | 053846.158-690551.37 | 13.14 | 14.13 | S | (0.55) | (O7 V) | ||||||
| 1113 | 53 | 78 | 1032 | 2977 | O8 III | Le21 | 053844.063-690544.82 | 12.97 | 13.32 | 14.63 | S | (0.54) | (O8 III) | ||||
| 140d | 81 | 497 | 2231 | O3.5 Vz+OB | Wa14 | 053841.126-690513.17 | 12.97 | 13.28 | 14.65 | S | (0.54) | (O3.5 V) | |||||
| 42 | O3 V+O3 V | Ma02 | 053842.119-690600.73 | 12.98 | 13.34 | 14.71 | S,D | (0.54) | (O3 V) | ||||||||
| 75 | O6 V | Be20 | 053842.178-690601.90 | 13.01 | 13.86 | 15.08 | S,D | (0.52) | (O6 V) | ||||||||
| 288 | 84 | 385 | 2451 | O4–5V | Wa14 | O53832.293-690523.85 | 13.22 | 13.38 | 14.65 | S | 0.51 | COS/G140L | 2 | ||||
| 33Nb | 1152 | 32 | 66 | 1896 | O6.5 V | Be20 | 053844.467-690555.50 | 13.03 | 13.28 | 14.36 | S | (0.51) | (O6 V) | ||||
| 1034 | 61 | 85 | 1027 | 2987 | O5 V | Le21 | 053843.195-690542.61 | 13.05 | 13.38 | 14.68 | S | (0.50) | (O4.5 V) | ||||
| 39 | 1005 | O3 V+O5.5 V | Ma02 | 13.26 | 14.50 | D | (0.50) | (O3 V) | |||||||||
| 53 | 51 | 427 | 389 | WN8(h) | Ev11 | 053836.407-690657.48 | 13.27 | 13.77 | S | (0.49) | (WN7–8) | ||||||
| 35N | 1013 | 41 | 76 | 1026 | 1494 | O3 III(f*) | MH98 | 053843.075-690611.28 | 13.29 | 13.97 | S,D | (0.48) | (O3 III) | ||||
| 1042 | 56 | 87 | 1029 | 2128 | O3.5I+OB | Wa14 | 053843.343-690547.55 | 13.10 | 13.39 | 14.71 | S,D | (0.48) | (O3 I) | ||||
| 40 | O3 V | Be20 | 13.30 | 14.56 | D | (0.48) | (O3 V) | ||||||||||
| 1195 | 43 | 83 | 2112 | O3 V | MH98 | 053844.950-690554.11 | 13.12 | 13.37 | 14.57 | S | (0.47) | (O3 V) | |||||
| 1123 | 74 | 1033 | 2913 | O7 III | Le21 | 053844.172-690542.17 | 13.13 | 13.42 | 14.53 | S | (0.46) | (O7 III) | |||||
| 885 | 68 | 512 | 1199 | O2 V-III | Wa14 | 053841.734-690625.01 | 13.15 | 13.30 | 14.34 | S | (0.46) | (O2 V) | |||||
| 51 | 666 | 50 | 457 | 603 | O3.5 If/WN7 | CW11 | 053838.838-690649.49 | 12.98 | 13.81 | S | 0.45 | COS/G140L | 2 | ||||
| 724 | 75 | 1274 | O7 III | Bo99 | 053839.692-690624.01 | 13.17 | 13.37 | 14.41 | S | (0.45) | (O7 III) | ||||||
| 14S | 1350 | 64 | 608 | 1827 | O4 III | Wa14 | 053846.785-690603.10 | 13.01 | 13.19 | 14.29 | S | 0.43 | COS/G140L | 2 | |||
| 723 | 92 | 2570 | O5: | Ca21 | 053839.638-690526.37 | 13.21 | 13.53 | 14.77 | S | (0.43) | (O5 III) | ||||||
| 36 | 706 | 86 | 468 | 1749 | O2 V | Wa14 | 053839.369-690606.49 | 13.21 | 13.39 | 14.58 | S | (0.43) | (O2 V) | ||||
| 812 | 51 | 89 | O3 V | MH98 | 053840.895-690555.93 | 13.23 | 13.48 | 14.70 | S | (0.43) | (O3 V) | ||||||
| 27E | 858 | 100 | 503 | O9 III | Wa14 | 053841.367-690532.44 | 13.23 | 13.57 | 14.87 | S,D | (0.43) | (O9 III) | |||||
| 1267 | 90 | 2911 | O7: V | Pa93 | 053845.757-690540.82 | 13.24 | 13.52 | 14.72 | S | (0.42) | (O7 V) | ||||||
| 28 | 805 | 80 | 2447 | O5–6 V | Bo99 | 053840.798-690525.10 | 13.24 | 13.40 | 14.61 | S | (0.42) | (O5.5 V) | |||||
| 787 | 103 | 2233 | O9–B0 V | Bo99 | 053850.435-690534.56 | 13.25 | 13.60 | 14.98 | S | (0.42) | (O9 V) | ||||||
| 4 | 1607 | 65 | 664 | 774 | O7 II | Wa14 | 053852.724-690643.13 | 13.37 | 14.38 | S | 0.41 | COS/G140L | 2 | ||||
| 52 | O3–4 Vz | Be20 | 13.46 | 14.72 | D | (0.41) | GHRS/G140L | 4 | |||||||||
| 45 | O4: Vz | Be20 | 13.48 | 13.65 | D | (0.40) | (O4 V) | ||||||||||
| 900 | 37 | 77 | 1018 | 1459 | O2–4.5 | He12 | 053841.874-690612.52 | 13.29 | 13.42 | 14.49 | D | (0.40) | (O3 III) | ||||
| 49 | O3 V | Be20 | 13.49 | 14.75 | D | (0.40) | (O3 V) | ||||||||||
| 50 | O3–4 V | Be20 | 13.51 | 14.65 | D | (0.39) | GHRS/G140L | 4 | |||||||||
| 55 | O2 Vz | Be20 | 13.52 | 14.74 | D | (0.39) | (O2 V) | ||||||||||
| 5 | 1552 | 54 | 652 | 1405 | B2 Ip+O9III: | Wa14 | 053851.043-690620.40 | 13.06 | 14.15 | S | (0.39) | (B2 I) | |||||
| 46 | O2–3 III | Be20 | 13.53 | 14.56 | S | (0.39) | (O2.5 III) | ||||||||||
| 506 | 82 | 1632 | O8: | Ca21 | 053836.237-690608.42 | 13.35 | 13.52 | 14.55 | S | (0.38) | (O8 III) | ||||||
| 14N | 1317 | 91 | 601 | 1890 | O5–6 V | Wa14 | 053846.280-690559.32 | 13.36 | 13.56 | 14.68 | S | (0.38) | (O5.5 V) | ||||
| 7 | 1553 | 94 | 651 | 2057 | O7 V | Wa14 | 053851.029-690554.70 | 13.36 | 13.59 | 14.74 | S | (0.38) | (O7 V) | ||||
| 47 | 111 | O2 V | Be20 | 053842.630-690601.92 | 13.39 | 13.66 | 14.72 | S | (0.37) | (O2 V) | |||||||
| 48 | O2–3 III | Be20 | 13.60 | 14.75 | D | (0.36) | (O2.5 III) | ||||||||||
| 58 | O2–3 V | Be20 | 13.61 | 14.80 | D | (0.36) | GHRS/G140L | 4 | |||||||||
| 467 | 93 | 416 | 1700 | O8.5 V | Ma12 | 053835.570-690606.65 | 13.41 | 13.57 | 14.74 | S | (0.36) | (O8 V) | |||||
| 106 | 583 | 2107 | O8 V+O8.5 V | Wa14 | 053845.211-690548.48 | 13.44 | 13.71 | 14.92 | S | (0.35) | (O8 V) | ||||||
| 62 | O2–3 V | Be20 | 13.65 | 14.91 | D | (0.35) | GHRS/G140L | 4 | |||||||||
| 52 | 493 | 48 | 423 | 660 | B1 Ia | Ev15 | 053836.053-690646.50 | 13.19 | 13.64 | S | (0.34) | (B1 I) | |||||
| 1340 | 110 | 604 | 2884 | O8.5 V | Wa14 | 053846.567-690537.10 | 13.47 | 13.71 | 14.95 | S | (0.34) | (O8 V) | |||||
| 1248 | 112 | 3034 | O6: | Ca21 | 053845.494-690543.99 | 13.48 | 13.73 | 15.00 | S | (0.34) | (O6 III) | ||||||
| 1614 | 118 | 667 | 1699 | O6 V | Wa14 | 053852.832-690612.01 | 13.95 | 15.08 | S | 0.33 | COS/G140L | 2 | |||||
| 86 | O5: V | Be20 | 13.72 | 14.73 | D | (0.33) | GHRS/G140L | 4 | |||||||||
| 827 | 60 | 95 | 1007 | 1763 | O6.5 V-III | He12 | 053841.066-690601.89 | 13.72 | 14.86 | S,D | (0.32) | (O6.5 III) | |||||
| 67 | 96 | 1857: | O6: | Ca21 | 053841.324-690557.59 | 13.52 | 13.86 | 15.09 | S,D | (0.32) | (O6 III) | ||||||
| 661 | 108 | 455 | 1572 | O5:V:n | Wa14 | 053838.759-690613.22 | 13.55 | 13.75 | 15.08 | S | (0.32) | (O4.5 V) | |||||
| 1281 | 114 | 2033 | O7: | Ca21 | 053845.907-690550.77 | 13.56 | 13.76 | 14.90 | S | (0.31) | (O7 III) | ||||||
| 37Wb | 897 | 44 | 88 | 1017 | 1374 | O2 If/WN5 | CW11 | 053841.862-690614.41 | 13.56 | 13.60 | 14.53 | S | (0.31) | (O2 If/WN5) | |||
| 761 | 63 | 105 | 2077 | O3–6 V | WB97 | 053840.143-690551.26 | 13.56 | 13.76 | 14.86 | S | (0.31) | (O4.5 V) | |||||
| 781 | 72 | 113 | 1974 | O6: | Ca21 | 053840.477-690553.42 | 13.57 | 13.83 | 14.99 | S | (0.31) | (O6 III) |
| R | Mk | P | HSH | SMB | VFTS | CCE | SpT | Ref | HTTP | Ref | Spectrum | Ref | VMS | ||||
|---|---|---|---|---|---|---|---|---|---|---|---|---|---|---|---|---|---|
| mag | mag | mag | (Template) | ||||||||||||||
| 70 | O5 Vz | Be20 | 13.81 | 14.96 | D | (0.30) | GHRS/G140L | 4 | |||||||||
| 74 | 121 | O6 V | MH98 | 13.82 | 15.11 | D | (0.30) | (O6 V) | |||||||||
| 1329 | 122 | 2718 | O9: | Ca21 | 053849.107-690547.18 | 13.63 | 13.86 | 15.23 | S | (0.29) | (O9 III) | ||||||
| 1023 | 59 | 99 | 1703 | O3 III | MH98 | 053843.168-690603.65 | 13.63 | 13.73 | 14.76 | S,D | (0.29) | (O3 III) | |||||
| 974 | 104 | 532 | 963 | O3 V(n)z+OB | Wa14 | 053842.657-690635.83 | 13.85 | 14.81 | S | (0.29) | (O3 V) | ||||||
| 978 | 54 | 109 | 1963 | O4: | Ca21 | 053842.679-690556.30 | 13.67 | 13.80 | 14.79 | S | (0.28) | (O4 III) | |||||
| 71 | O2–3 V | Be20 | 053842.365-690604.90 | 13.70 | 13.98 | 15.16 | S,D | (0.28) | (O2.5 V) | ||||||||
| 57 | O3 III(f*) | MH98 | 13.90 | 14.80 | D | (0.28) | (O3 III) | ||||||||||
| 776 | 124 | 484 | 3081 | O6–7 V | Wa14 | 053840.354-690543.79 | 13.71 | 13.94 | 15.09 | D | (0.27) | (O6 V) | |||||
| 921 | 82 | 134 | 522 | 3030 | O6 II-Iab+O5.5 V | Wa14 | 053842.082-690545.47 | 13.72 | 14.01 | 15.26 | S | (0.27) | (O6 III) | ||||
| 77 | O5.5 V+O5.5 V | Ma02 | 13.94 | 15.21 | D | (0.27) | (O5.5 V) | ||||||||||
| 1196 | 130 | 2763 | O6: | Ca21 | 053844.958-690538.63 | 13.75 | 13.89 | 15.14 | S | (0.26) | (O6 III) | ||||||
| 80 | O8 V | Be20 | 13.95 | 15.17 | D | (0.26) | (O8 V) | ||||||||||
| 973 | 129 | 2545 | O8: | Ca21 | 053842.607-690522.21 | 13.75 | 14.05 | 15.25 | S | (0.26) | (O8 III) | ||||||
| 66 | O2 V-III | Be20 | 13.95 | 15.06 | D | (0.26) | GHRS/G140L | 4 | |||||||||
| 33Sb | 1111 | 34 | WC5 | MH98 | 053844.062-690555.64 | 13.76 | 13.82 | 14.49 | S | (0.26) | (WC4) | ||||||
| 600 | 123 | 2946 | O3–5 V | Bo99 | 053837.658-690542.06 | 13.96 | 15.04 | S | (0.26) | (O4 V) | |||||||
| 15S | 1306 | 117 | 2053 | O8 III | WB97 | 053846.113-690554.44 | 13.79 | 13.93 | 14.95 | S | (0.25) | (O8 III) | |||||
| 89 | O4 V | Cr16 | 13.99 | 14.76 | D | (0.25) | GHRS/G140L | 4 | |||||||||
| 621 | 97 | 445 | 2981 | O3–4 V+O4–7 V | Wa14 | 053838.026-690543.30 | 13.80 | 13.58 | 14.79 | S | (0.25) | (O3.5 V) | |||||
| 69 | O4–5 V | Be20 | 14.02 | 15.05 | D,H | (0.25) | GHRS/G140L | 4 | |||||||||
| 65 | O4 V | Cr16 | 14.03 | 15.18 | D | (0.24) | (O4 V) | ||||||||||
| 64 | O4–5 V | Be20 | 053842.646-690601.05 | 13.83 | 13.95 | 14.53 | S | (0.24) | (O4 V) | ||||||||
| 78 | O4: V | Be20 | 14.04 | 15.26 | D | (0.24) | GHRS/G140L | 4 | |||||||||
| 324 | 131 | 393 | 2256 | O9.5(n) | Wa14 | 053832.992-690513.05 | 13.87 | 14.04 | 15.26 | S | (0.24) | (O9.5 III) | |||||
| 977 | 139 | 2893 | O6: V | Bo99 | 053842.636-690538.69 | 13.88 | 14.12 | 15.36 | S | (0.23) | (O6 V) | ||||||
| 1222 | 116 | 3180 | O3–6 V | WB97 | 053845.150-690508.34 | 13.88 | 14.08 | 14.99 | S | (0.23) | (O4.5 V) | ||||||
| 73 | O9.7–B0 V | Be20 | 14.12 | 15.13 | D | (0.23) | GHRS/G140L | 4 | |||||||||
| 1594 | 125 | 661 | 2691 | O6.5 V+O9.7 V | Wa14 | 053852.049-690533.79 | 13.94 | 14.00 | 15.19 | S | (0.22) | (O6 V) | |||||
| 1295 | 137 | 596 | 1325 | O7–8 V | Wa14 | 053846.059-690615.55 | 13.97 | 14.25 | 15.35 | S | (0.21) | (O7 V) | |||||
| 884 | 143 | 511 | 1008 | O5 Vz | Wa14 | 053841.717-690628.13 | 13.98 | 14.21 | 15.31 | S | (0.21) | (O4.5 V) | |||||
| 95 | 155 | 1920 | O4: | Ca21 | 053840.949-690555.14 | 14.00 | 14.26 | 15.43 | S | (0.21) | (O4 IIII) | ||||||
| 84 | 145 | 1956: | O5: | Ca21 | 14.20 | 14.80 | H | (0.21) | (O5 III) | ||||||||
| 92 | O6 Vz | Be20 | 14.20 | 15.46 | D | (0.21) | GHRS/G140L | 4 | |||||||||
| 1026 | 68 | 127 | 1787 | O4–5 V | Be20 | 053843.180-690601.73 | 14.01 | 14.10 | 14.80 | S | (0.21) | (O4.5 V) | |||||
| 1141 | 109 | 169 | 1035 | 2129 | O8.5 I-II | He12 | 053844.312-690545.10 | 14.01 | 14.29 | 15.57 | S | (0.21) | (O8.5 I) | ||||
| 970 | 83 | 142 | 1023 | 1580 | O8 III-V | He12 | 053842.618-690610.00 | 14.02 | 14.22 | 15.31 | S | (0.20) | (O8 III) | ||||
| 90 | O4: V: | Be20 | 14.24 | 15.48 | D | (0.20) | GHRS/G140L | 4 | |||||||||
| 141 | 373 | 2090 | O9.5n | Wa14 | 053831.224-690553.03 | 14.24 | 15.27 | S | (0.20) | (O9.5 III) | |||||||
| 1191 | 128 | 575 | 2804 | B0.7 III | Ev15 | 053844.904-690533.13 | 13.76 | 13.99 | 15.12 | S | (0.20) | (B1 III) | |||||
| 88 | 165 | 1009 | 1732 | O6.5 V–IIII | He12 | 053841.147-690602.91 | 14.07 | 14.23 | 15.42 | S | (0.20) | (O6.5 III) | |||||
| 108 | O7–8 V | Cr16 | 14.27 | 15.44 | D | (0.20) | (O7 V) | ||||||||||
| 729 | 138 | 144 | 1535 | O5: | Ca21 | 053839.700-690608.63 | 14.08 | 14.20 | 15.31 | S | (0.19) | (O5 III) | |||||
| 96 | 163 | 1008 | 1852 | ON6.5 II–I | He12 | 053841.093-690558.40 | 14.09 | 14.32 | S | (0.19) | (O6 I) | ||||||
| 957 | 99 | 167 | 1527 | O8 V | MH98 | 053842.445-690609.22 | 14.11 | 14.32 | 15.41 | S | (0.19) | (O8 V) | |||||
| 1527 | 119 | 646 | 1951 | B0.5 III(n) | Ev15 | 053850.263-690604.37 | 13.84 | 14.03 | 14.99 | S | (0.19) | (B0 III) | |||||
| 93 | O4–5 V | Cr16a | 14.34 | 15.60 | H | (0.18) | GHRS/G140L | 4 | |||||||||
| 531 | 166 | 1941 | O8 V | Bo99 | 053836.728-690556.46 | 14.15 | 14.32 | 15.54 | S | (0.18) | (O8 V) | ||||||
| 740 | 159 | 1537 | O6: | Ca21 | 053839.837-690607.99 | 14.15 | 14.29 | 15.41 | S | (0.18) | (O6 III) | ||||||
| 94 | O4–5 Vz | Be20 | 14.36 | 15.57 | D | (0.18) | GHRS/G140L | 4 | |||||||||
| 1031 | 152 | 543 | 2521 | O9 IV+O9.7: V | Wa14 | 053843.190-690527.52 | 14.17 | 14.26 | 15.44 | S | (0.18) | (O9 V) | |||||
| 1288 | 175 | 597 | 375 | O8–9 V(n) | Wa14 | 053846.063-690656.16 | 14.38 | 15.62 | S | (0.18) | (O9 V) | ||||||
| 1468 | 174 | 635 | 1334 | O9.5 IV | Wa14 | 053849.039-690619.57 | 14.39 | 15.56 | S | (0.18) | (O9 V) | ||||||
| 101 | 178 | 1020 | 1401 | O3–4 | He12 | 053842.012-690616.83 | 14.21 | 14.40 | 15.53 | S | (0.17) | (O3.5 V) | |||||
| 1145 | 168 | 561 | 2301 | O9:(n) | Wa14 | 053844.368-690514.36 | 14.41 | 15.46 | S | (0.17) | (O9 III) | ||||||
| 901 | 138 | 518 | 1068 | O3.5 III(f*) | Wa14 | 053841.934-690629.70 | 14.21 | 14.24 | 15.15 | S | (0.17) | (O3 III) | |||||
| 887 | 85 | 154 | 1016 | 1371 | O8 V | Bo99 | 053841.755-690619.06 | 14.22 | 14.33 | 15.31 | S | (0.17) | (O8 V) | ||||
| 1336 | 176 | 2945 | O8: | Ca21 | 053846.481-690542.20 | 14.22 | 14.39 | 15.54 | S | (0.17) | (O8 III) | ||||||
| 114 | O5–6 V | Be20 | 14.43 | 15.68 | D | (0.17) | (O5.5 V) | ||||||||||
| 198 | 3167 | O8: | Ca21 | 053841.818-690507.18 | 14.23 | 14.48 | 15.76 | S | (0.17) | (O8 III) |
| R | Mk | P | HSH | SMB | VFTS | CCE | SpT | Ref | HTTP | Ref | Spectrum | Ref | VMS | ||||
|---|---|---|---|---|---|---|---|---|---|---|---|---|---|---|---|---|---|
| mag | mag | mag | (Template) | ||||||||||||||
| 841 | 98 | 157 | 2016 | O4–6(n)(f)p | WB97 | 053841.186-690552.12 | 14.25 | 14.42 | 15.45 | S | (0.17) | (O5 III) | |||||
| 100 | B0 V | MH98 | 053842.206-690614.82 | 14.27 | 14.52 | 15.64 | S,H | (0.17) | (B0 V) | ||||||||
| 992 | 182 | 2665 | O7: | Ca21 | 053842.838-690530.36 | 14.29 | 14.44 | 15.56 | S | (0.16) | (O7 III) | ||||||
| 485 | 158 | 419 | 2897 | O9: V(n) | Wa14 | 053835.906-690534.95 | 14.32 | 14.33 | 15.41 | S | (0.16) | (O9 V) | |||||
| 113 | 190 | 1503 | O9 V | MH98 | 053842.243-690612.23 | 14.32 | 14.53 | 15.62 | S | (0.16) | (O9 V) | ||||||
| 796 | 185 | 2565 | O6: | Ca21 | 053840.665-690531.16 | 14.32 | 14.42 | 15.59 | S | (0.16) | (O6 III) | ||||||
| 670 | 172 | 456 | 2385 | Onn(f) | Wa14 | 053838.818-690525.56 | 14.34 | 14.42 | 15.45 | S | (0.15) | (O6 III) | |||||
| 994 | 146 | 2270 | B0: V | Bo99 | 053842.841-690514.80 | 14.07 | 14.19 | 15.44 | S | (0.15) | (B0 V) | ||||||
| 1201 | 171 | 579 | 3116 | O9:((n)) | Wa14 | 053844.969-690507.65 | 14.36 | 14.56 | 15.47 | S | (0.15) | (O9 V) | |||||
| 141 | O5–6 V | Cr16 | 14.56 | 15.82 | D | (0.15) | GHRS/G140L | 4 | |||||||||
| 116 | O7 V | Be20 | 14.57 | 15.79 | D | (0.15) | (O7 V) | ||||||||||
| 115 | O9+ V | Cr16 | 14.57 | 15.76 | D | (0.15) | (O9 V) | ||||||||||
| 1359 | 202 | 2782 | O8: | Ca21 | 053846.901-690536.82 | 14.37 | 14.59 | 15.78 | S | (0.15) | (O8 III) | ||||||
| 1560 | 200 | 654 | 3010 | O9 Vnn | Wa14 | 053851.159-690541.81 | 14.38 | 14.62 | 15.77 | S | (0.15) | (O9 V) | |||||
| 179 | 570 | 3134 | O9.5ne+ | Wa14 | 053844.684-690545.19 | 14.39 | 14.42 | S | (0.15) | (O9.5 III) | |||||||
| 578 | 209 | 436 | 2223 | O7–8 V | Wa14 | 053837.348-690521.29 | 14.39 | 14.58 | 15.93 | S | (0.15) | (O7 V) | |||||
| 112 | O7–9 Vz | Be20 | 14.61 | 15.74 | D | (0.14) | GHRS/G140L | 4 | |||||||||
| 224 | 660 | 3027 | O9.5 Vnn | Wa14 | 053851.812-690546.85 | 14.43 | 14.76 | 16.00 | S | (0.14) | (O9 V) | ||||||
| 132 | O7: V | Be20 | 14.64 | 15.86 | D | (0.14) | (O7 V) | ||||||||||
| 348 | 227 | 400 | 2607 | O9.7 | Be20 | 053833..536-690521.73 | 14.45 | 14.79 | 16.05 | S | (0.14) | (O9.5 III) | |||||
| 212 | 2776 | O8: | Ca21 | 053843.127-690537.76 | 14.51 | 14.67 | 15.89 | S | (0.13) | (O8 III) | |||||||
| 490 | 140 | 422 | 1373 | O4 III(f) | Wa14 | 053835.993-690616.91 | 14.15 | 14.23 | 15.15 | S | 0.13 | COS/G140L | 2 | ||||
| 123 | O6 V | Be20 | 053842.043-690604.58 | 14.52 | 14.71 | 15.76 | S | (0.13) | (O6 V) | ||||||||
| 121 | O9.5 V | Be20 | 14.73 | 15.85 | D | (0.13) | (O9 V) | ||||||||||
| 134 | O7 Vz | Be20 | 053842.182-690604.95 | 14.52 | 14.74 | 15.44 | S | (0.13) | (O7 V) | ||||||||
| 206 | 476 | 2789 | O((n)) | Wa14 | 053839.734-690539.27 | 14.53 | 14.73 | 15.72 | S | (0.13) | (O6 III) | ||||||
| 444 | O9.7 | Wa14 | 053838.011-690508.53 | 14.55 | 14.86 | 16.12 | S | (0.13) | (B0 V) | ||||||||
| 218 | 615 | 1398 | O9.5 IIInn | Wa14 | 053847.320-690617.74 | 14.78 | 15.64 | S | (0.12) | (O9.5 III) | |||||||
| 881 | 215 | 2389 | O9: | Ca21 | 053841.643-690523.77 | 14.58 | 14.69 | 15.87 | S | (0.12) | (O9 III) | ||||||
| 118 | O7–8 V | Cr16 | 14.79 | 15.89 | D | (0.12) | (O8 V) | ||||||||||
| 211 | 1415 | O7: | Ca21 | 053843.317-690611.65 | 14.61 | 14.80 | 15.92 | S | (0.12) | (O7 III) | |||||||
| 743 | 151 | 1523 | O6: | Ca21 | 053839.846-690609.50 | 14.61 | 14.83 | 15.40 | S | (0.12) | (O6 III) | ||||||
| 918: | 311: | 1522 | O7: | Ca21 | 053842.067-690608.95 | 14.82 | 15.81 | S | (0.12) | (O7 III) | |||||||
| 194 | 446 | 1339 | Onn | Wa14 | 053838.245-690617.36 | 14.62 | 14.63 | 15.46 | S | (0.12) | (O9.5 V) | ||||||
| 915 | 144 | 238 | 2130 | O8: | Ca21 | 053842.061-690552.23 | 14.62 | 14.85 | 15.97 | S | (0.12) | (O8 III) | |||||
| 103 | 189 | 1010 | 1346 | O7 V–III | Ma12 | 053841.255-690617.02 | 14.65 | 14.69 | 15.55 | S | (0.11) | (O7 III) | |||||
| 226 | 382 | 2901 | O4–5 V | Wa14 | 053832.253-690544.58 | 14.66 | 14.82 | 15.93 | S | (0.11) | (O4.5 V) | ||||||
| 140 | 187 | 1015 | 1734 | O8: V | Le21 | 053841.637-690603.25 | 14.66 | 14.83 | 15.76 | S | (0.11) | (O8 V) | |||||
| 208 | 443 | 1557 | O7: V | Wa14 | 053837.972-690615.30 | 14.67 | 14.75 | 15.73 | S | (0.11) | (O7 V) | ||||||
| 547 | 214 | 432 | 466 | O8–9 V | Wa14 | 053837.030-690650.70 | 14.88 | 15.73 | S | (0.11) | (O8 V) | ||||||
| 1369 | 219 | 613 | 2005 | O8.5 Vz | Wa14 | 053847.161-690554.46 | 14.68 | 14.80 | 15.80 | S | (0.11) | (O8 V) | |||||
| 853 | 177 | 1011 | 1447 | O5 V | Le21 | 053841.348-690614.04 | 14.70 | 14.75 | 15.39 | S | (0.11) | (O4.5 V) | |||||
| 126 | 193 | 1004 | 1725 | O9.5 V-III | He12 | 053840.831-690604.60 | 14.70 | 14.82 | 15.59 | S | (0.11) | (O9.5 III) | |||||
| 803 | 213 | 491 | 276 | O6 V | Wa14 | 053840.846-690657.51 | 14.96 | 15.69 | S | (0.10) | (O6 V) | ||||||
| 239 | 649 | 2038 | O9.5 V | Wa14 | 053850.610-690554.57 | 14.77 | 15.02 | 16.14 | S | (0.10) | (O9 V) | ||||||
| 1224 | 231 | 1472 | O6: | Ca21 | 053845.213-690613.62 | 14.78 | 14.90 | 15.99 | S | (0.10) | (O6 III) | ||||||
| 277 | 2453 | O8: | Ca21 | 053840.166-690520.63 | 14.78 | 15.04 | 16.34 | S | (0.10) | (O8 III) | |||||||
| 1401 | 234 | 619 | 689 | O7–8 V(n) | Wa14 | 053847.717-690644.94 | 14.99 | 16.07 | S | (0.10) | (O8 V) | ||||||
| 102 | 207 | O2–3 III | Cr16 | 053843.165-690600.85 | 14.79 | 14.79 | 15.52 | S | (0.10) | (O2.5 III) | |||||||
| 1087 | 272 | 1275 | O8: | Ca21 | 053843.749-690621.89 | 14.79 | 15.06 | 16.27 | S | (0.10) | (O8 III) | ||||||
| 1086 | 247 | 2454 | O7: | Ca21 | 053843.709-690521.64 | 14.80 | 14.97 | 16.16 | S | (0.10) | (O7 III) | ||||||
| 982 | 160 | 258 | 2044 | O4: V | Pa93 | 053842.721-690552.80 | 14.80 | 14.98 | 16.14 | S | (0.10) | (O4 V) |
Sp Types:
Be20: Bestenlehner
et al. (2020);
Be22: Bestenlehner et al. (2022);
Bo99: Bosch et al. (1999);
Ca21 Castro
et al. (2021b);
Cr10: Crowther
et al. (2010);
Cr16: Crowther
et al. (2016);
Cr22: Crowther et al. (2022);
CD98: Crowther &
Dessart (1998);
CS97: Crowther &
Smith (1997);
CW11: Crowther &
Walborn (2011);
De97: de Koter
et al. (1997);
Do13:Doran
et al. (2013)
Ev11: Evans
et al. (2011);
Ev15: Evans
et al. (2015);
He12: Hénault-Brunet et al. (2012);
Ka22 Kalari
et al. (2022);
Le21 : D. Lennon (priv comm, 2021);
Ma02: Massey
et al. (2002);
Ma05: Massey et al. (2005);
Ma12: Massey et al. (2012);
MH98 : Massey &
Hunter (1998);
Pa93: Parker (1993);
Te19: Tehrani
et al. (2019);
Wa14: Walborn
et al. (2014);
WB97: Walborn &
Blades (1997)
Spectroscopy: 1. GO 16272 (Shenar); 2. GO 15629 (Mahy); 3. Roman-Duval
et al. (2020); 4. Heap
et al. (1992); 5. de Koter
et al. (1998); 6. Massey et al. (2005).
Note: (a) spectral type of HSH 119 (fainter component of blend with = 15.0 mag)
Photometry: D: De Marchi
et al. (2011); H: Hunter et al. (1995); S: Sabbi
et al. (2016)
| R | Mk | P | HSH | SMB | VFTS | CCE | SpT | Ref | HTTP | Ref | Spectrum | Ref | VMS | ||||
|---|---|---|---|---|---|---|---|---|---|---|---|---|---|---|---|---|---|
| mag | mag | mag | (Template) | ||||||||||||||
| 139 | 952 | 2 | 527 | O6.5 Iafc+O7 Iaf | Wa14 | 053842.351-690458.19 | 10.97 | 10.86 | 12.02 | S | 6.21 | (O7 I) | 1 | ||||
| 145 | 1788 | 695 | WN6h+O3/5 If/WN7 | Sh17 | 053857.072-690605.58 | 10.88 | 11.94 | S | 4.21 | (WN6) | 1 | ||||||
| 135 | 355 | 12 | 402 | WN5:+WN7 | Sh19 | 053833.615-690450.47 | 11.63 | 11.68 | 12.82 | S | 2.34 | (WN6) | 1 | ||||
| 23 | 1163 | 42 | 566 | O3 III(f*) | Wa14 | 053844.558-690451.19 | 12.40 | 12.68 | 14.03 | S | (0.91) | (O3 III) | |||||
| 1035 | O3–6 V | WB97 | 053843.159-690441.82 | 12.93 | 13.35 | 14.75 | S | (0.56) | (O4.5 V) | ||||||||
| 57 | 541 | 79 | 429 | O7: V+B1: V | Sh22 | 053836.854-690458.28 | 12.95 | 13.32 | 14.70 | S | (0.55) | (O7 V) | |||||
| 809 | 133 | O8–9 V | Bo99 | 053840.773-690452.83 | 13.67 | 14.01 | 15.34 | S | (0.28) | (O9 V) | |||||||
| 1077 | 550 | O5 V((f))z | Wa14 | 053843.599-690442.44 | 13.78 | 14.12 | 15.42 | S | (0.26) | (O5 V) | |||||||
| 124 | 350 | O8.5 V+O9.5 V | Sh22 | 053828.057-690629.05 | 13.79 | 14.09 | 15.03 | S | (0.25) | (O9 V) | |||||||
| 83 | 339 | O9.5 IV | Wa14 | 053826.218-690501.84 | 13.83 | 14.15 | 15.52 | S | (0.24) | (O9 V) | |||||||
| 169 | 107 | 360 | O9.7 | Wa14 | 053829.421-690521.20 | 13.84 | 13.85 | 14.85 | S | (0.24) | (O9.5 III) | ||||||
| 466 | 150 | 415 | O9.5 V | Wa14 | 053835.480-690457.67 | 13.90 | 14.17 | 15.50 | S | (0.23) | (O9 V) | ||||||
| 60 | 195 | 98 | 363 | B0.2 III-II | Ev15 | 053829.986-690505.18 | 13.61 | 13.68 | 14.86 | S | (0.23) | (B0 III) | |||||
| 1052 | 546 | O8–9 III | Wa14 | 053843.373-690446.34 | 14.02 | 14.21 | 15.41 | S | (0.20) | (O8 III) | |||||||
| 1729 | 686 | B0.7 III | Ev15 | 053855.634-690723.71 | 14.05 | 14.15 | 15.05 | S | (0.15) | (B1 III) | |||||||
| 1756 | 688 | O9.7 III | Wa14 | 053856.058-690554.04 | 14.45 | 14.70 | 15.64 | S | (0.14) | (O9.5 III) | |||||||
| 955 | 529 | O9.5(n) | Wa14 | 053842.374-690443.12 | 14.55 | 14.89 | 16.09 | S | (0.13) | (O9.5 III) | |||||||
| 905 | 521 | O9 V(n) | Wa14 | 053841.955-690704.97 | 14.82 | 15.90 | S | (0.12) | (O9 V) | ||||||||
| 171 | 216 | 361 | O8.5 V | Wa14 | 053829.482-690620.55 | 14.63 | 14.81 | 15.75 | S | (0.12) | (O8 V) | ||||||
| 1840 | 707 | B0.5 V | Ev15 | 053858.907-690642.05 | 14.55 | 15.65 | S | (0.12) | (B0.5 V) | ||||||||
| 486 | B1-2ne+ | Ev15 | 053840.604-690456.02 | 14.20 | 14.16 | 15.28 | S | (0.11) | (B1 III) | ||||||||
| 319 | 412 | O9.7 | Wa14 | 053834.901-690453.74 | 14.71 | 15.14 | 16.47 | S | (0.11) | (O9.5 III) | |||||||
| 1209 | 205 | O9–B0 V | Bo99 | 053845.055-690446.88 | 14.74 | 14.85 | 15.67 | S | (0.11) | (O9 V) | |||||||
| 1429 | 621 | O2 V((f))z | Wa14 | 053848.089-690442.18 | 14.80 | 14.86 | 15.59 | S | (0.10) | (O2 V) |
Appendix C Far-UV calibrations
We calibrate fluxes against or photometry using reference O stars in 30 Doradus that have been observed in the far-UV. These are listed in Table 9, sorted by with references to spectral types, photometry and HST datasets identical to Table 7. Column densities, (H i) from fits to Ly are included and should be reliable to 0.05 dex (e.g. Welty et al. (2012) obtain (H i/cm2) = 21.79 for Mk 42). Comparisons are presented in Fig. 3, with calibrations presented in Eqn 1-2. Since we utilise templates spanning a range of extinctions, we also adjust far-UV slopes (1160-1700) of templates to individual O stars within the MUSE field from their colours. These are presented in Fig. 21 with the fit obtained as follows
| (3) |
30 Doradus O stars external to the MUSE field reveal a somewhat different behaviour, likely as a result of lower dust extinction.
| Star | Sp Type | Ref | Ref | (H i) | HST dataset | Ref | MUSE | |||||
|---|---|---|---|---|---|---|---|---|---|---|---|---|
| (mag) | (mag) | (mag) | cm-2 | |||||||||
| Mk 42 | O2 If | CW11 | 11.08 | 11.51 | 12.82 | S | 3.01 | 1.00 | 21.75 | STIS/E140M | 3 | |
| Mk 39 | O2.5 If/WN6+ | Cr22 | 11.38 | 11.66 | 12.95 | S | 2.74 | 1.13 | 21.75 | COS/G130M+G160M | 3 | |
| VFTS 506 | ON2 V | Wa14 | 11.74 | 12.01 | 13.32 | S | 2.04 | 1.06 | 21.8 | COS/G130M+G160M | 3 | |
| Mk 30 | O2 If/WN5 | CW11 | 11.91 | 12.22 | 13.48 | S | 1.85 | 0.98 | 21.75 | COS/G130M+G160M | 3 | |
| VFTS 180 | O3 If* | Wa14 | 12.11 | 13.52 | S | 1.57 | 1.12 | 21.6 | COS/G130M+G160M | 3 | ||
| VFTS 87 | O9.7 Ib-II | Wa14 | 11.97 | 12.09 | 13.60 | S | 1.52 | 1.02 | 21.6 | STIS/E140M | 3 | |
| VFTS 267 | O3 III-I | Wa14 | 12.15 | 13.49 | S | 1.39 | 1.33 | 21.75 | COS/G130M+G160M | 3 | ||
| VFTS 440 | O6–6.5 III | Wa14 | 12.15 | 12.44 | 13.69 | S | 0.96 | 1.17 | 21.75 | STIS/E140M | 2 | |
| Mk 37a | O3.5 If/WN7 | CW11 | 12.33 | 12.48 | 13.52 | S | 0.82 | 1.50 | STIS/G140L | 6 | ||
| Mk 33S | O3 III | Ma15 | 12.48 | 12.76 | 13.81 | S | 0.79 | 1.20 | STIS/G140L | 6 | ||
| VFTS 586 | O4 Vz | Wa14 | 13.06 | 13.50 | 15.02 | S | 0.76 | 0.91 | 21.75 | COS/G130M+G160M | 3 | |
| VFTS 352 | O4.5 Vz+O5.5 Vz | Wa14 | 12.75 | 13.13 | 14.46 | S | 0.70 | 1.02 | 21.8 | COS/G130M+G160M | 3 | |
| Mk 55 | O6 Vnn | Wa14 | 12.79 | 13.04 | 14.34 | S | 0.61 | 1.32 | 21.75 | COS/G130M+G160M | 3 | |
| VFTS 385 | O4–5 V | Wa14 | 13.22 | 13.38 | 14.65 | S | 0.51 | 1.20 | 21.8: | COS/G140L | 2 | |
| VFTS 404 | O3.5 V | Wa14 | 12.76 | 12.95 | 14.13 | S | 0.49 | 1.74 | 21.9 | COS/G130M+G160M | 3 | |
| Mk 51 | O3.5 If/WN7 | CW11 | 12.98 | 13.81 | S | 0.45 | 1.73 | 21.9: | COS/G140L | 2 | ||
| Mk14S | O4 III | Wa14 | 13.01 | 13.19 | 14.29 | S | 0.43 | 1.54 | 21.9: | COS/G140L | 2 | |
| Mk 4 | O7 II | Wa14 | 13.37 | 14.38 | S | 0.41 | 1.53 | 22.0: | COS/G140L | 2 | ||
| VFTS 667 | O6 V | Wa14 | 13.95 | 15.08 | S | 0.33 | 1.09 | 21.9: | COS/G140L | 2 | ||
| VFTS 169 | O2.5 V | Wa14 | 13.64 | 13.46 | 14.60 | S | 0.32 | 1.75 | 22.0 | COS/G130M+G160M | 3 | |
| VFTS 190 | O7 Vnnp | Wa14 | 13.70 | 13.43 | 14.70 | S | 0.28 | 1.78 | 21.7 | COS/G130M+G160M | 3 | |
| VFTS 66 | O9.5 III | Wa14 | 14.40 | 14.49 | 15.61 | S | 0.14 | 1.67 | 22.0 | COS/G130M+G160M | 3 | |
| VFTS 422 | O4III(f) | Wa14 | 14.15 | 14.23 | 15.15 | S | 0.13 | 2.10 | 21.9: | COS/G140L | 2 |
