A cool dark sector, concordance, and a low
Abstract
We investigate a cosmological model in which a fraction of the dark matter is atomic dark matter (ADM). This ADM consists of dark versions of the electron and of the proton, interacting with each other and with dark photons just as their light sector versions do, but interacting with everything else only gravitationally. We find constraints given current cosmic microwave background (CMB) and baryon acoustic oscillation (BAO) data, with and without an prior, and with and without enforcing a big bang nucleosynthesis consistent helium abundance. We find that, at low dark photon temperature, one can have consistency with BAO and CMB data, with a fraction of dark matter that is ADM () as large as . Such a large leads to a suppression of density fluctuations today on scales below about 60 Mpc that may be of relevance to the tension. Our work motivates calculation of nonlinear corrections to matter power spectrum predictions in the ADM model. We forecast parameter constraints to come from future ground-based CMB surveys, and find that if ADM is indeed the cause of the tension, the influence of the ADM, primarily on CMB lensing, will likely be detectable at high significance.
I Introduction
The physics of dark matter remains a mystery. While weakly interacting massive particles (WIMPs) [1, 2] and the quantum chromodynamic axion [3, 4] remain leading dark matter candidates, the possibility that dark matter could be part of an extended “dark sector” has gained traction in the last decade [5]. One intriguing possibility is that this dark sector could contain a copy of the Standard Model field content, such as in the twin Higgs model (see e.g. Refs. [6, 7, 8, 9, 10, 11, 12, 13, 14, 15, 16, 17, 18, 19, 20, 21, 22, 23, 24, 25, 26, 27, 28, 29, 30, 31, 32, 33, 34, 35, 36]). In such scenarios, part of the dark matter can be charged under a new gauge interaction [37, 38, 39, 40, 41, 42, 43, 44, 45, 46, 47, 48, 49, 50, 51, 52, 53, 54, 55, 56, 57] and even form atom-like bound states [58, 59, 60, 61, 62, 63, 64, 65, 66, 67, 68, 69, 70, 71, 72, 73, 74, 75, 76, 77, 78, 79, 80, 81]. In its simplest incarnation, this “atomic” dark matter (ADM) involves two massive dark fermions (a “dark proton” and a “dark electron”) interacting with a massless dark photon. In the early Universe, such a dark sector forms an ionized plasma in which the dark fermions are tightly coupled with the dark photon bath. Once its temperature falls below the binding energy between the two dark fermions, neutral dark atoms can form in a process similar to standard hydrogen recombination [82].
This ADM scenario can have important impact on the way structure assembles in our Universe. At early times, radiation pressure from the dark photon bath opposes gravitational infall of dark matter into potential wells, hence slowing down the growth of structure and modifying the anisotropies of the cosmic microwave background (CMB). At late times, dark atoms behave as a form of dissipative dark matter, allowing it to cool and form structures such as dark disks [71, 72, 74, 83, 84, 85, 86], mirror stars [87, 88], and exotic compact objects [89, 90, 91, 92, 93, 94, 95].
Given its possible impact on a broad range of scales, it is natural to ask if ADM, whether it forms part or the entirety of the dark matter, could be playing a role in some of the tensions facing the Cold Dark Matter (CDM) cosmological model [96]. A particularly relevant one is the so-called tension, which refers to a potential discrepancy between different measurements of the matter fluctuation amplitude on scales [97]. Assuming standard CDM cosmology, CMB observations from Planck find [98]. However, measurements of cosmic shear from the KiDS-1000 survey find [99]. Although these two specific measurements are only in disagreement, multiple observations of the large-scale structure of the Universe using a variety of techniques have found values that are consistently lower than those inferred from the CMB [100, 99, 101, 102, 103, 104, 105], potentially pointing to an underlying problem with CDM as the standard model of cosmology.
The cosmological impact of ADM on the large-scale structure of the Universe has been extensively studied in the literature (see e.g. Refs. [62, 64, 68, 70, 22, 106, 107]). Much like in the visible sector where the baryon acoustic oscillations (BAO) get imprinted on the matter power spectrum, the large dark photon radiation pressure at early times can leave a dark acoustic oscillation (DAO) pattern on the spectrum of matter fluctuations. On scales smaller than this “dark” acoustic horizon, such a DAO pattern is typically damped due to the finite mean free path of dark photons, in a process reminiscent of Silk damping [108]. However, if the dark sector is significantly cooler than the visible sector, the relatively weak pressure support (which scales as the fourth power of the dark sector temperature) leads to a heavily damped DAO spectrum. In this case, the main impact of ADM on structure formation is a suppressed matter power spectrum on scales smaller than the dark acoustic horizon. This suppression, which also occurs in other models involving dark matter-dark radiation interaction (see e.g. Refs. [109, 110, 111, 112, 113, 114, 115, 116, 117, 118]), could play an important role in addressing the tension.
In this paper, we study the impact that ADM could have on the tension while maintaining concordance with a broad range of cosmological data including CMB, BAO, Cepheid-calibrated supernovae constraints on the Hubble constant, and the primordial abundance of helium. We show that a cool dark sector made of dark atoms could offer a possible solution to the tension. We also present forecasts for how future observations could help constrain this scenario.
This paper is organized as follows. In Sec. II, we outline the parameter space explored and the physics of the ADM model. In Sec. III, we present the constraints placed by current data on ADM parameters, including an allowed region of low and low dark photon temperature. In Sec. IV, we confirm the observational viability of this allowed region and explore its impacts on matter power spectra and CMB power spectra. In Sec. V, we forecast the sensitivity of future CMB experiments to ADM in the low and low dark photon temperature regime. In Sec. VI, we summarize and conclude.
II Physical effects of changing atomic dark matter parameters
We examine in this section the impact ADM has on CMB and matter power spectra, and how those impacts depend on ADM parameters. Because of the possibility for resolving the tension, we focus on the “cool” dark sector regime, as mentioned in the introduction, where the dark photon temperature today is between 0.6 K and 1.0 K. Prior work by some of us [119] identified the fraction of non-relativistic matter that is pressure supported as a useful quantity for understanding changes in observables. We will indeed find that to be the case here.
Before focusing on the cool regime, we begin with a quick overview of the ADM model and its phenomenology. More detailed discussions can be found in Refs. [58, 59, 60, 61, 62, 63, 64, 65, 66, 67, 68, 69, 70, 71, 72, 73, 74, 75, 76, 77, 78, 79, 80, 25, 81]. The ADM consists of massive dark protons and dark electrons interacting with massless dark photons. At early times, dark sector particles are highly coupled together, forming a dark plasma. Via a Thompson-scattering-like interaction, dark electrons scatter off dark photons at a per-particle rate higher than the cosmic expansion rate. When the dark photons cool down, dark protons and dark electrons can form bound states, similar to the recombination process in the visible sector. After decoupling from the dark baryons, dark photons freely stream with a mean free path larger than the Hubble distance. Dark baryons, after dark recombination, experience very little pressure support and so evolve much like cold dark matter (CDM).
There are four parameters to characterize the atomic dark sector: the temperature of the dark photons today , the binding energy of dark hydrogen , the mass of dark hydrogen , and the dark fine structure constant . In this work we set and to have the same values as in the visible sector.
In previous work [120, 119], the ADM model was used to mimic a scaling transformation that preserves dimensionless cosmological observables. To do so, both the dark hydrogen binding energy to dark photon temperature ratio () and the dark baryon-to-photon number ratio () are set to their values in the visible sector. The same ensures recombination happens around the same time in both dark and visible sectors. The same baryon-to-photon ratio ensures that the photon and baryon perturbations are in phase in both sectors. In this work, we drop these requirements on the values of and , allowing them to vary freely. As a result, the redshift of dark recombination is free to vary, as is the dark photon temperature. This section is aimed at elucidating the impact on power spectra of variation of these two parameters.
Let us specify our fiducial CDM and ADM models. The fiducial CDM model is the CDM model that best fits the Planck 2018 TT,TE,EE+lowE+lensing [121] likelihoods. We refer to it as the base model. It has parameter values
| (1) | ||||
For the base model, the dark matter consists only of CDM, namely . For ADM models, we use three additional parameters to specify the dark sector properties: , , and the fraction of dark matter in dark baryons
| (2) |
For the fiducial ADM model, we fix the total dark matter density to be the same as in the base model,
| (3) |
fix other cosmological parameters to the values in Eq. (1), and pick the following ADM parameters:
| (4) |
By setting , we assume that 10% of the total dark matter is dark baryons. Comparing to the base model, 10% of the base model CDM is replaced by dark baryons in the ADM model. In the following discussion, we will change and separately to see the impacts on observables.
We also remind the reader that the matter fluctuation amplitude is the rms fractional mass variance, computed in linear perturbation theory, of a mass field convolved with a tophat sphere of radius Mpc/, where . This is related to the matter power spectrum via
| (5) |
where is the Fourier transform of the tophat window function of radius 8 Mpc/ and is the linear-theory matter power spectrum today [e.g. 122].
II.1 Altering the dark baryon-to-photon ratio
First, we investigate the impacts of changing , with all other parameters in Eqs. (1), (3), and (4) held fixed at their fiducial values. Note that this means keeping fixed and, therefore, adjusting the binding energy accordingly. By varying , we also effectively change , since the dark baryon density is fixed. To keep fixed while varying the dark photon temperature today, we adjust according to
| (6) |
where K is the temperature of the CMB photons today [123]. We look into three specific cases with dark photon temperature of 0.6 K, 0.8 K and 1.0 K, which correspond to a dark photon energy density that is of the energy density in light relics.
We find that the main effect, on CMB observables, of changing is due to CMB lensing effects. In general, most of the CMB lensing is generated during the matter-dominated era when matter perturbations are the main source of gravitational potentials. Therefore, we will look at the matter power spectra first.
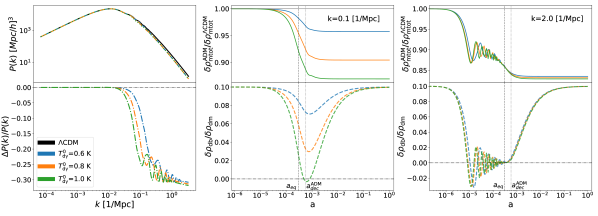
In Fig. 1, matter power spectra for different are shown in the left panel. At small scales, there is a suppression of power in ADM predictions compared to the base model prediction. This suppression is fundamentally due to the pressure support that the ADM receives from the dark photons, which slows the growth of . This in turn inhibits growth of as well, since the ADM is still contributing to the expansion rate (which acts against growth), while its contribution to gravitational potential gradients is suppressed. In the base model, all of the dark matter freely falls into the gravitational potential wells after horizon entry. However, in the ADM models, the freely falling CDM is just 90% of the total dark matter (by mass), while 10% of the dark matter mass is dark baryons, which receive at least some amount of pressure support until dark recombination.
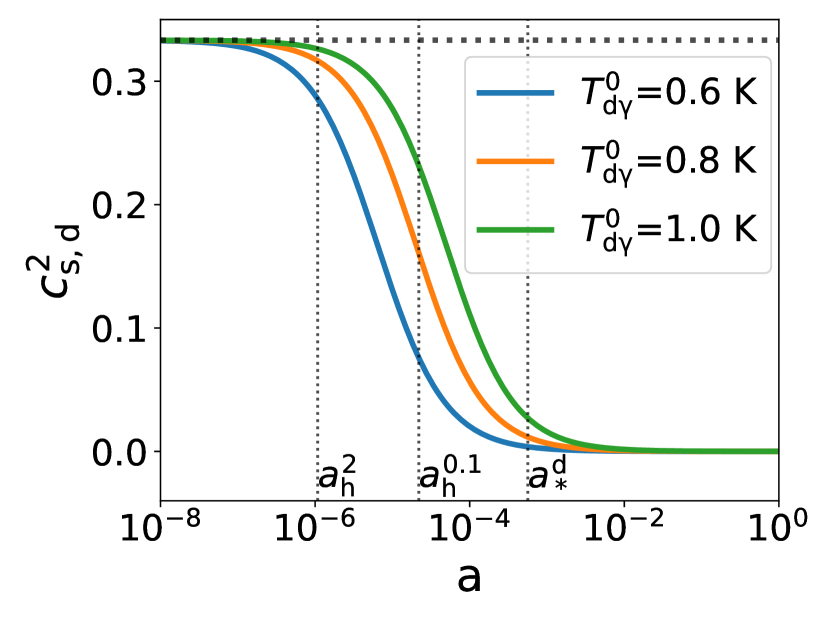
The dependence of suppression on arises from the dependence of that pressure support on temperature. In the tight-coupling limit, pressure gradients are proportional to the square of the dark sound speed, which is given by
| (7) |
where
| (8) |
The evolution of is shown in Fig. 3. The dark sound speed is higher when the dark photon temperature is higher, which leads to greater pressure support of the ADM while it is tightly coupled to the dark photons.
At large scales, the ADM predicted matter power spectra are similar to those predicted by the base model. This is because these modes enter the horizon after dark recombination, when dark baryons behave just like CDM because they have decoupled from the dark photons. The transition between these two regimes of large scales, where the ADM has no impact, and small scales, where there is suppression, is set by the wavenumber of the modes crossing the horizon during dark recombination, .
To understand the impact on in more detail, we show in the center and right panels of Fig. 1 the evolution of a mode in the transition region, with , and a mode more fully in the high- suppression region, with . In the top plots, we show the ratios of the dimensional perturbations of the total matter between the ADM models and the base model. For both modes, the dimensional perturbations of the total matter in the ADM models () are suppressed compared to the base model prediction (), and the ADM models with higher show a larger suppression. For the different modes within the same ADM model, the deviation of relative to at is larger for the mode than for the mode. This is caused by the different scale factor of horizon entry for the two modes. The mode enters the horizon earlier than the mode. Therefore, there is a longer duration of pressure support for the mode. As a result, the ratio is smaller at in the mode than in the mode of the same ADM model. Given the same background matter density in each model, this is consistent with the matter power spectra shown in the left panel of the figure.
For the modes, horizon entry happens early when the sound speed of the dark plasma is still large. The dark baryons oscillate due to the dark photon pressure support, while the CDM perturbation is able to grow. As a result, the ratio quickly decreases and oscillates around zero with decreasing amplitude. This is shown in the bottom right panel of Fig. 1. At horizon entry, the sound speeds of the three ADM models are similarly large. As a result, the dark photon pressure-induced suppression on the gravitational potential is similar for all the three ADM models. The relative differences in and among the three ADM models are small.
For the modes, horizon entry is later, occurring after a greater decrease in the dark sound speed than for the modes. For these modes in the transition region, the decay is not only larger than in the case, but the amount of decay depends significantly on . As shown in Fig. 3, for the K model is below 0.1, while it is still above 0.2 for the K model. The difference in dark pressure support is more significant at horizon entry among the three models. Additionally, the late horizon entry leads to a shorter duration of the dark acoustic oscillations, where dark recombination occurs before the completion of the first dark oscillation period. As a result, the fraction , as well as the amount of suppression in compared to the , is significantly different among the three models. This is shown in the middle panel in Fig. 1. The K model has the least amount of dark photon pressure. The dark baryons can cluster more easily with less pressure resistance. Therefore, the ADM model with K has the largest , as well as the smallest suppression in . As a result, the dispersion of is larger among the three ADM models for modes with this wavenumber.
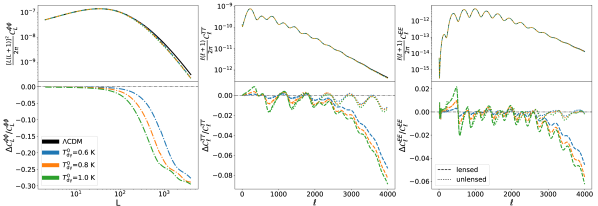
After understanding the differences in the matter power spectra, we now turn to the CMB lensing spectra of the ADM models. In the left panel of Fig. 2, we see that at small scales the lensing potential spectrum amplitudes predicted by the ADM models are lower than the base model amplitude predictions, with a higher leading to a larger suppression. This is consistent with the changes seen in the matter power spectra. Recall that the lensing potential spectrum [124] is
| (9) |
where is the comoving distance, is the conformal time today, is the spherical Bessel function, is the Weyl potential, and the subscript indicates recombination. Most of the lensing effects come from redshift [e.g. 124], deep in the matter-dominated era. Therefore, we can use the Poisson equation to replace with via
| (10) |
Given that the background cosmology is the same in the ADM models and in the base model, the differences in the CMB lensing potential spectra are caused by the matter power spectra differences. Comparing the matter power spectra and the lensing potential spectra, this expected correlation is seen in Figs. 2 and 1.
The CMB TT and EE spectra are shown in the middle and right panels of Fig. 2. In both panels, the fractional changes relative to the base model predictions for the lensed and unlensed spectra are shown. We find that the main effects on the lensed TT and EE spectra are caused by CMB lensing. The unlensed ADM spectra deviate only mildly from base model predictions, but the lensed spectra deviate significantly at small scales. This is expected due to the mixing of power at different scales by CMB lensing [124]. At small scales, where the unlensed CMB spectra are close to zero due to diffusion damping, the lensing effect of power mixing provides the main contribution to the amplitude of the lensed spectra. The lensing potential amplitude is smaller when the dark photon temperature is higher, leading to lower mixing power. As a result, the lensed CMB spectra with lower deviate less from the base model prediction.
II.2 Changing the dark binding energy-to-dark photon temperature ratio
In this subsection we investigate the physical effects on the matter and CMB power spectra of altering the dark binding energy-to-dark photon temperature ratio (). We adjust by varying while keeping all other parameters in Eqs. (1), (3), and (4) fixed. We show spectra for models with set to 3.6, 6, and 8.4 eV. The pressure in the dark baryon-photon plasma prior to dark recombination is the same for all of these models since they all have the same dark photon temperature. However, varying changes the time of dark recombination and, therefore, changes the time at which this pressure support precipitously drops.
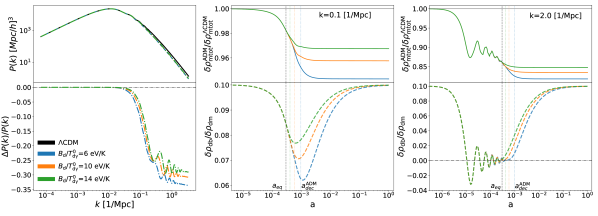
As in Sec. II.1, we first discuss the matter power spectra. In the left panel of Fig. 4, we show the matter power spectrum predictions for the ADM models with different , as well as the prediction from the base model. At large scales, at which the modes enter the horizon after dark recombination, the ADM predicted matter power spectra are identical to those predicted by the base model. At small scales, ADM predicted matter power spectra are suppressed relative to the base model prediction.
The key factor leading to the difference in is the duration of the pressure support between horizon entry and dark recombination. We pick two modes ( and in the middle and right panels of Fig. 4, respectively) to see the perturbation evolution. When the dark binding energy is higher, more energy is required for a dark photon to photoionize a bound state, leading to an earlier dark recombination epoch. After dark recombination, dark photons begin to free stream, and the ADM pressure support drops to near zero, stopping any further suppression of the total matter perturbations compared to the base model prediction. For the same mode, the perturbation evolutions before dark recombination are quite similar among the three ADM models. This is expected because the dark photon pressure amplitudes are the same when the dark photon temperature is fixed. The differences only appear after dark recombination has occurred in one of the models. For the model with dark recombination at a later scale factor, the pressure support lasts longer, leading to a longer suppression of the clustering of ADM despite the same background evolution as other ADM models. Thus, is further suppressed, leading to a smaller .
| Label | Datasets | BBN consistency? |
|---|---|---|
| BBN consistent, with SH0ES data | Planck, BAO, SH0ES | yes |
| BBN consistent, without SH0ES data | Planck, BAO | yes |
| BBN inconsistent, with SH0ES data | Planck, BAO, SH0ES | no |
| BBN inconsistent, without SH0ES data | Planck, BAO | no |
As for dependence on scale, smaller scales enter the horizon earlier, leading to a longer duration of pressure support between horizon entry and dark recombination. Thus, the total matter perturbation is more suppressed and the matter power is lower as the scale becomes smaller. This scale dependence becomes quite weak for modes that enter the horizon deep in the radiation-dominated era since matter is a small fraction of the total density.
In Fig. 5, we show the CMB TT, EE, and lensing potential spectra with three different dark binding energies, , and compare them to the fiducial CDM model. For similar reasons to those discussed in Sec. II.1, the CMB lensing potential spectra are closely related to the matter power spectra. Comparing the lensed and unlensed TT and EE spectra, we find that CMB lensing is the main driver of the differences in the lensed CMB spectra at small scales.
III Constraints placed by current data

In this section, we explore the parameter constraints placed by current observational data on the ADM model described in Sec. II. Note that this parameter space is not just CDM plus three ADM parameters, but CDM + plus three ADM parameters. We let vary freely in addition to the dark photon temperature . In practice we implement this freedom by allowing the number of light neutrino species to adjust away from its CDM value of 3.044 [129]. We included this freedom so that our model space would contain the scaling transformation direction highlighted by Refs. [120] and [119], and its associated large posterior uncertainty. In the explored models, we consider both cases where the primordial helium abundance is predicted by big bang nucleosynthesis (BBN) and where it is a free parameter.
We use CMB data from Planck, namely the Planck 2018 high- TT+TE+EE, low- TT, low- EE, and lensing datasets [98], as well as BAO data from 6dFGS [125], SDSS MGS [126], and BOSS DR12 [127]. Additionally, we consider parameter constraints both with and without the inclusion of the independent 2022 measurement of from SH0ES [128]. While Ref. [128] is no longer the latest SH0ES result, it was the most recent data available at the time we began this work. Hereafter, SH0ES data will refer to Ref. [128]. The datasets and constraints used in the following analyses to obtain joint constraints on parameter values are summarized in Table 1.
We use a modified version of CAMB [130, 68, 70], a publicly available Einstein-Boltzmann solver, to make model predictions and CosmoMC [131] to calculate the posterior probability distributions of the parameters using Markov chain Monte Carlo (MCMC) methods. We applied a flat prior on the ADM parameters as
| (11) |
This choice of prior on allows dark recombination to occur at a wide range of redshifts approximately between 475 and 2700. We set the energy densities of the dark photons and dark baryons to not exceed those of the photons and baryons in the visible sector defined in the base model in Sec. II. The lower bound on is due to a computational limitation, where a lower occasionally results in a failure of the ODE solver for dark ionization history. However, at the lowest allowed , pressure support is significantly reduced (relative to the maximal high-temperature amount) at sufficiently early times to allow for the emergence of the low solution that is a major focus of this paper. We leave improvements to address this numerical difficulty for future work.
In Sec. III.1 we discuss the emergence, in our constraint contours for the BBN-inconsistent model without SH0ES data, of the scaling transformation of Ref. [120]. In Sec. III.2, we examine the ADM parameter space at low and find that lower values of are allowed in this regime. In Sec. III.3 we explore the possibility of easing the tension with ADM.
III.1 Emergence of the scaling symmetry solution
The authors of Ref. [120] introduced a scaling of rates in the Einstein-Boltzmann equations, and associated scaling of the amplitude of the primordial power spectrum, that leaves dimensionless cosmological observables invariant. This FFAT (for Free-Fall rate, Amplitude, and Thomson rate) scaling transformation is given by
| (12) |
where is the scale factor and is the scaling transformation parameter [120].
As explained in Ref. [120], the FFAT scaling transformation can be mimicked in a model with ADM, additional free-streaming light relics, and free helium. Thus, when we allow for BBN inconsistency (so that helium is free) and do not restrict the value of with use of SH0ES (so as not to pin down too tightly), parameters are free to move along a subspace of the expanded parameter space we use here, corresponding to this FFAT-mimicking scaling transformation, with little to no impact on the dimensionless observables in our likelihood.
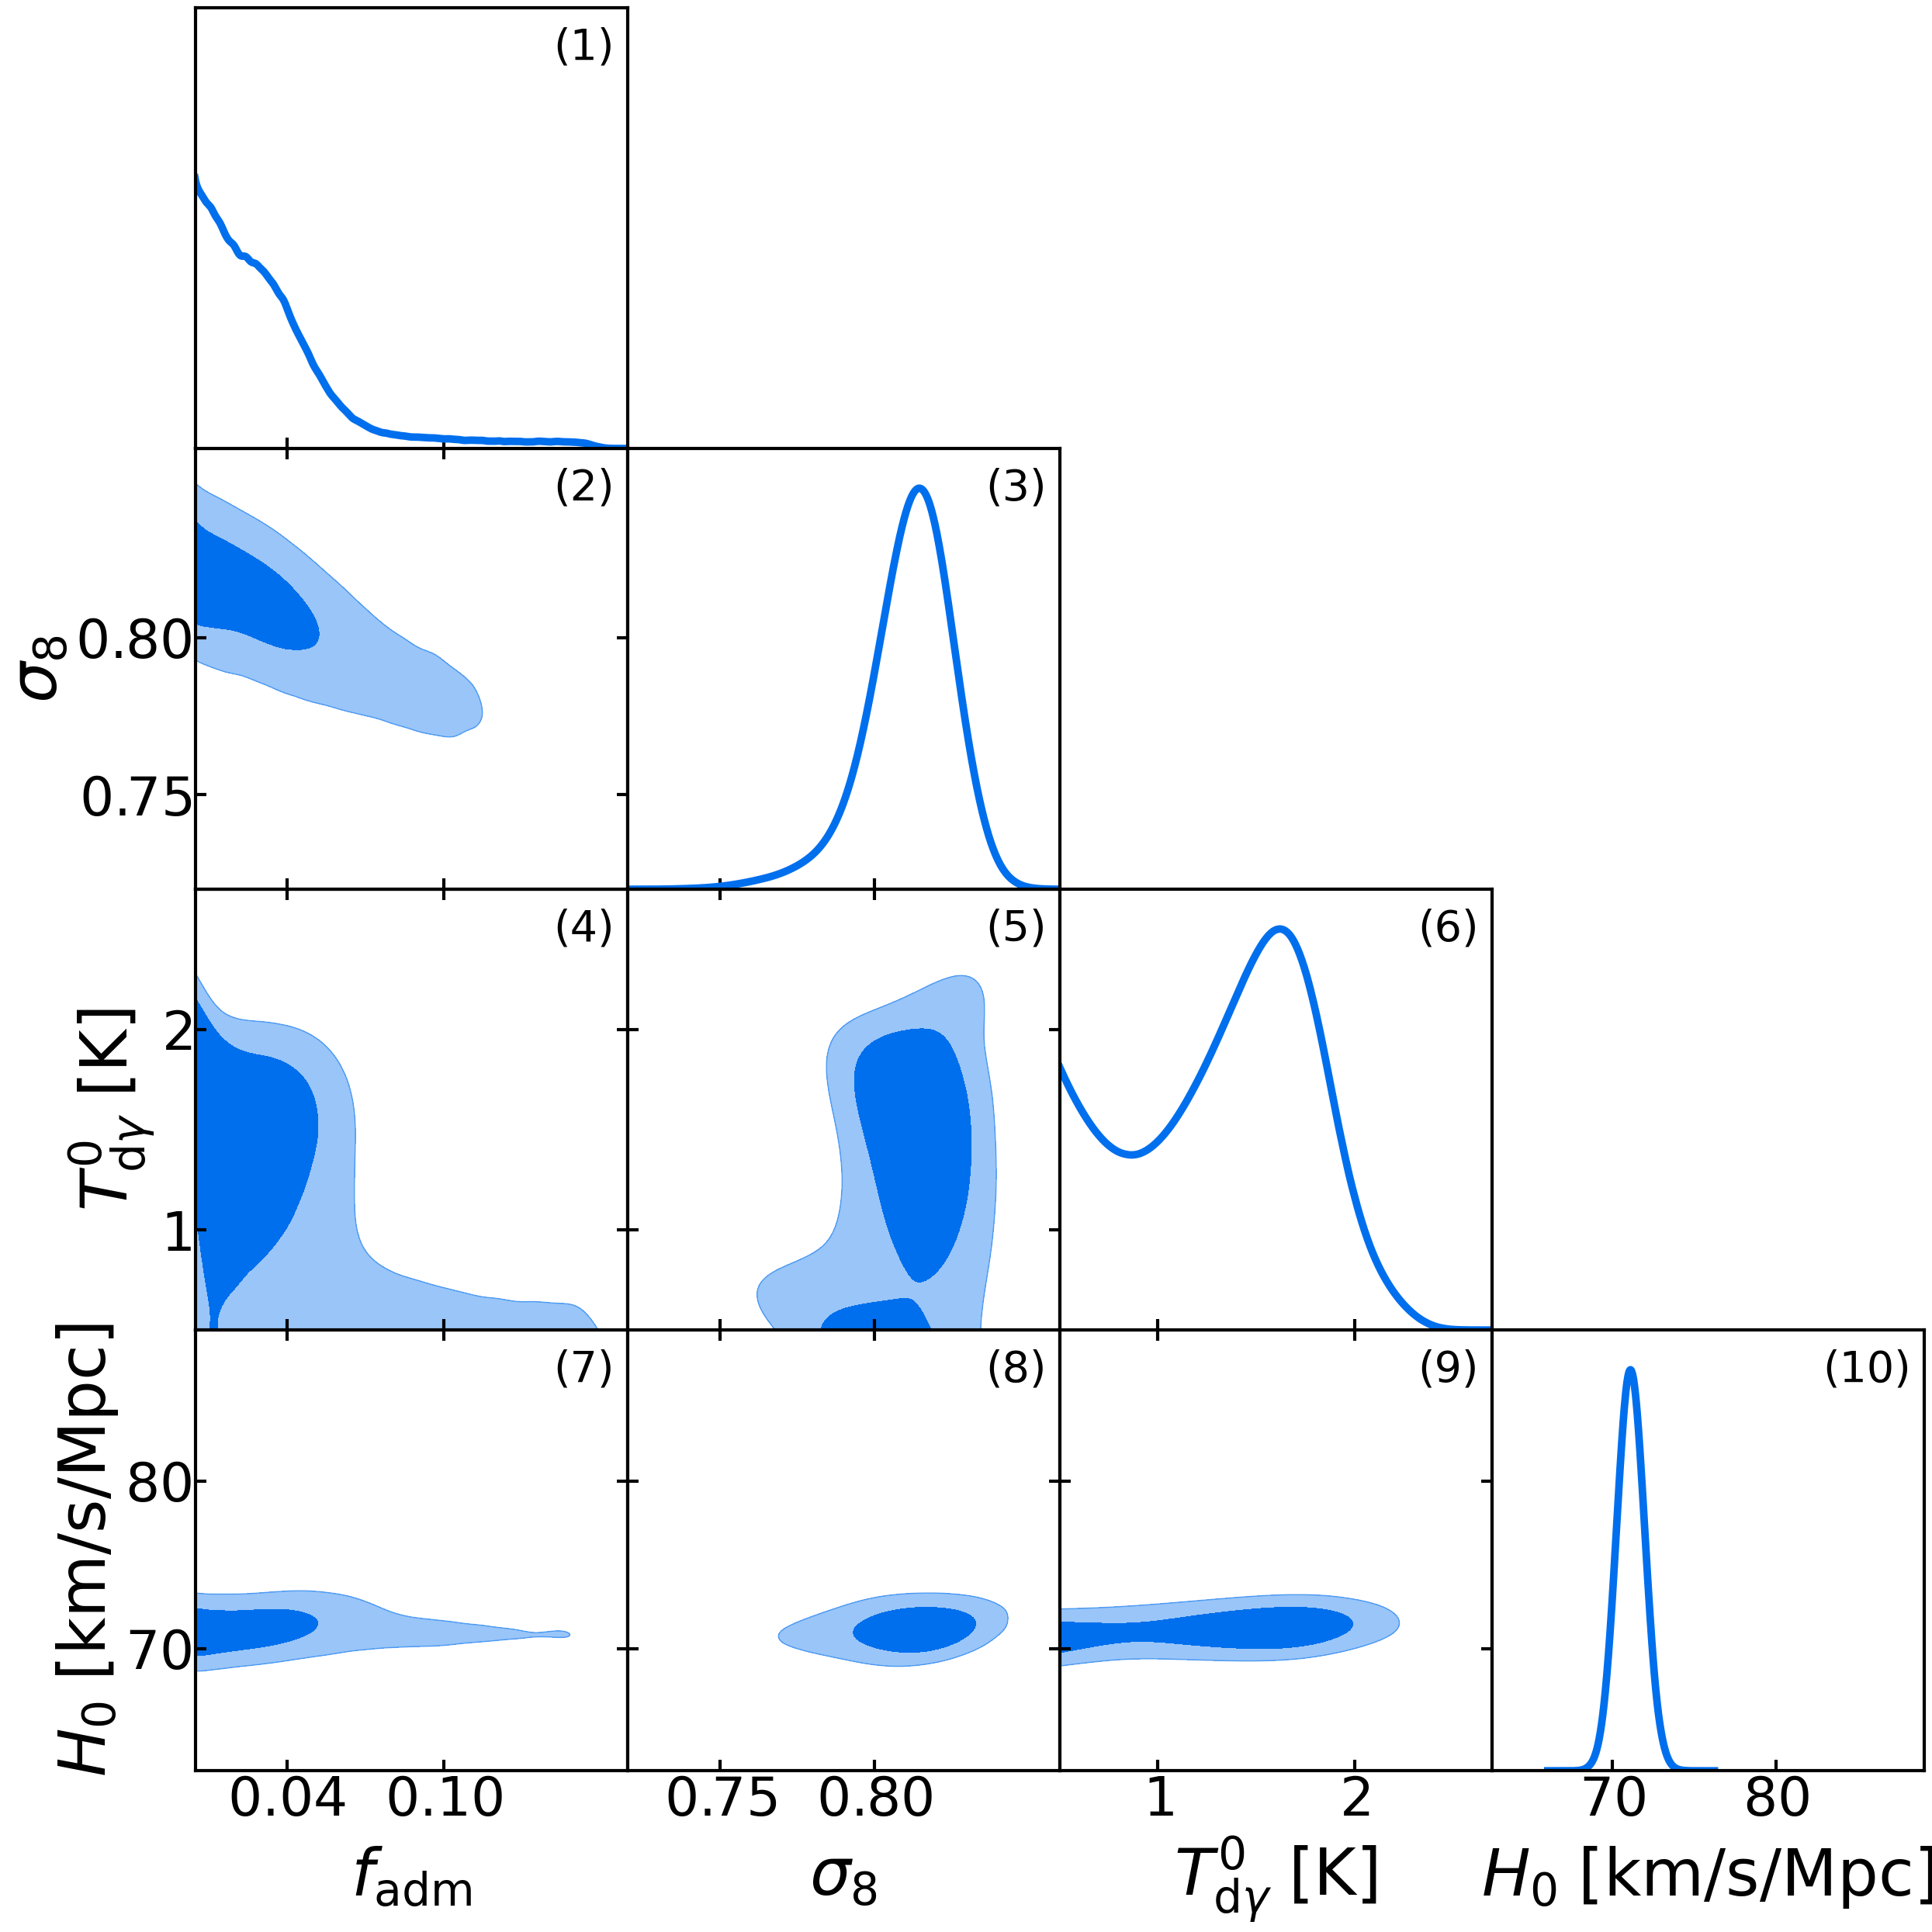
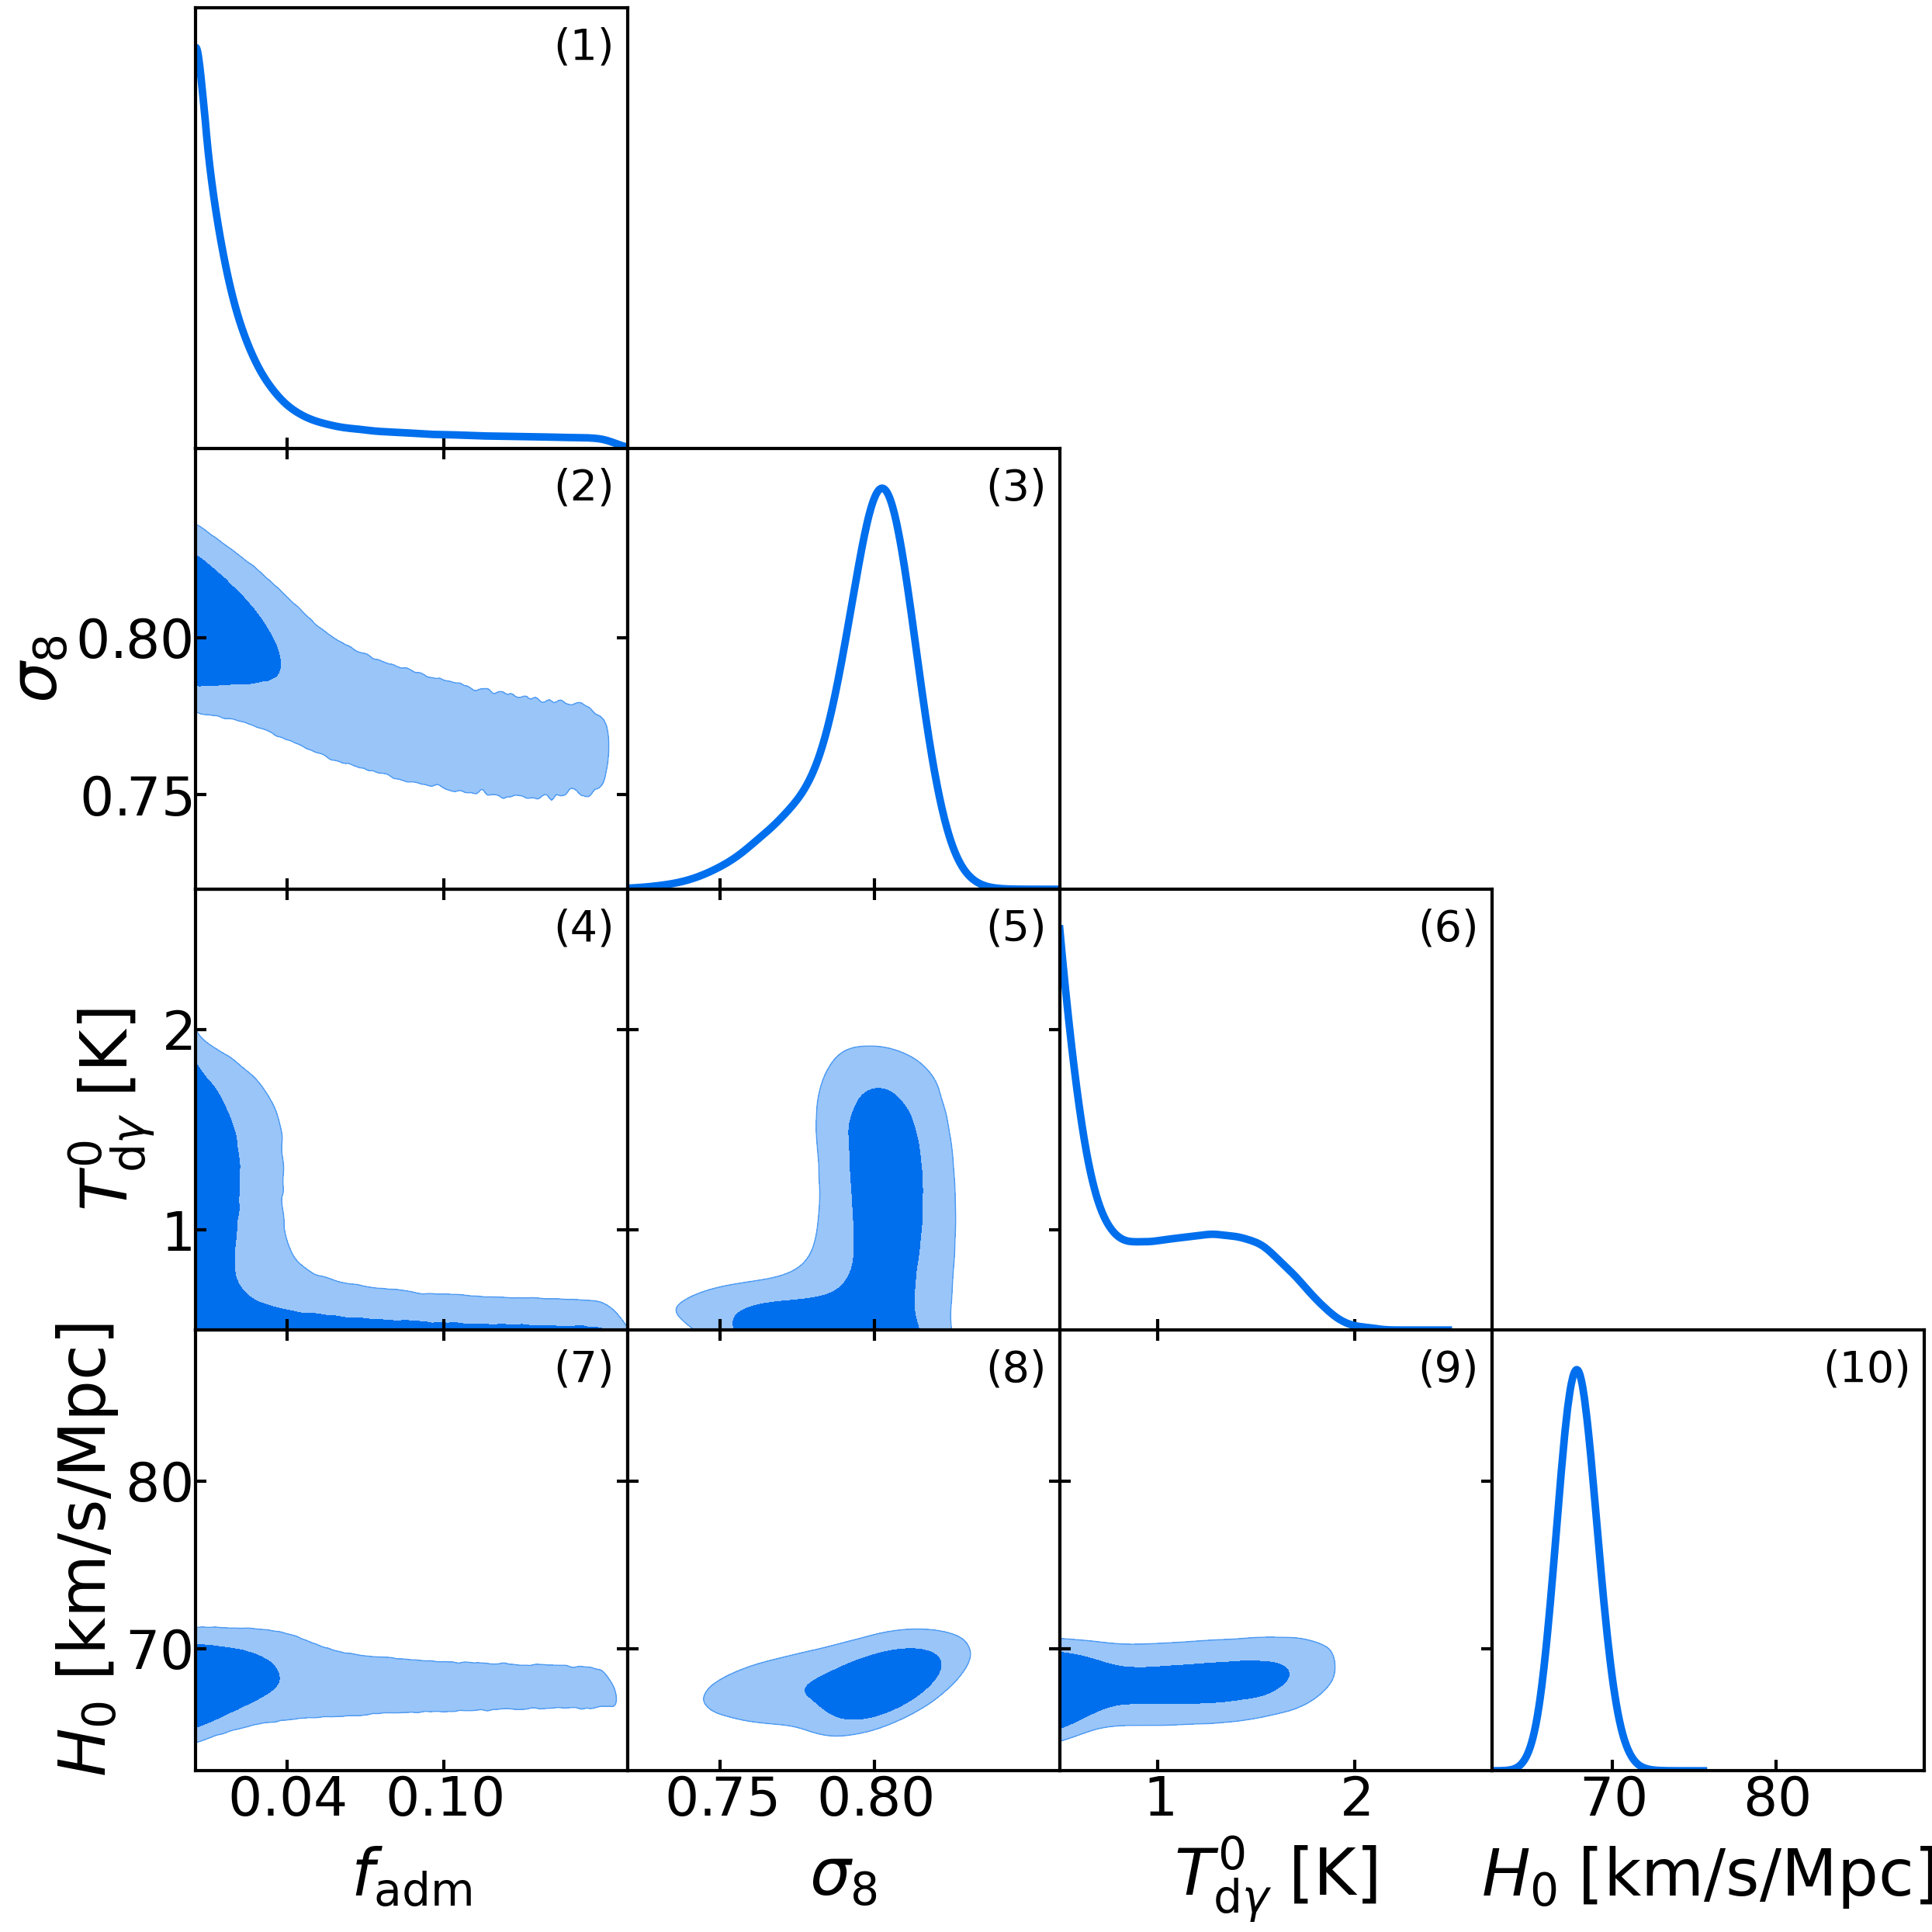
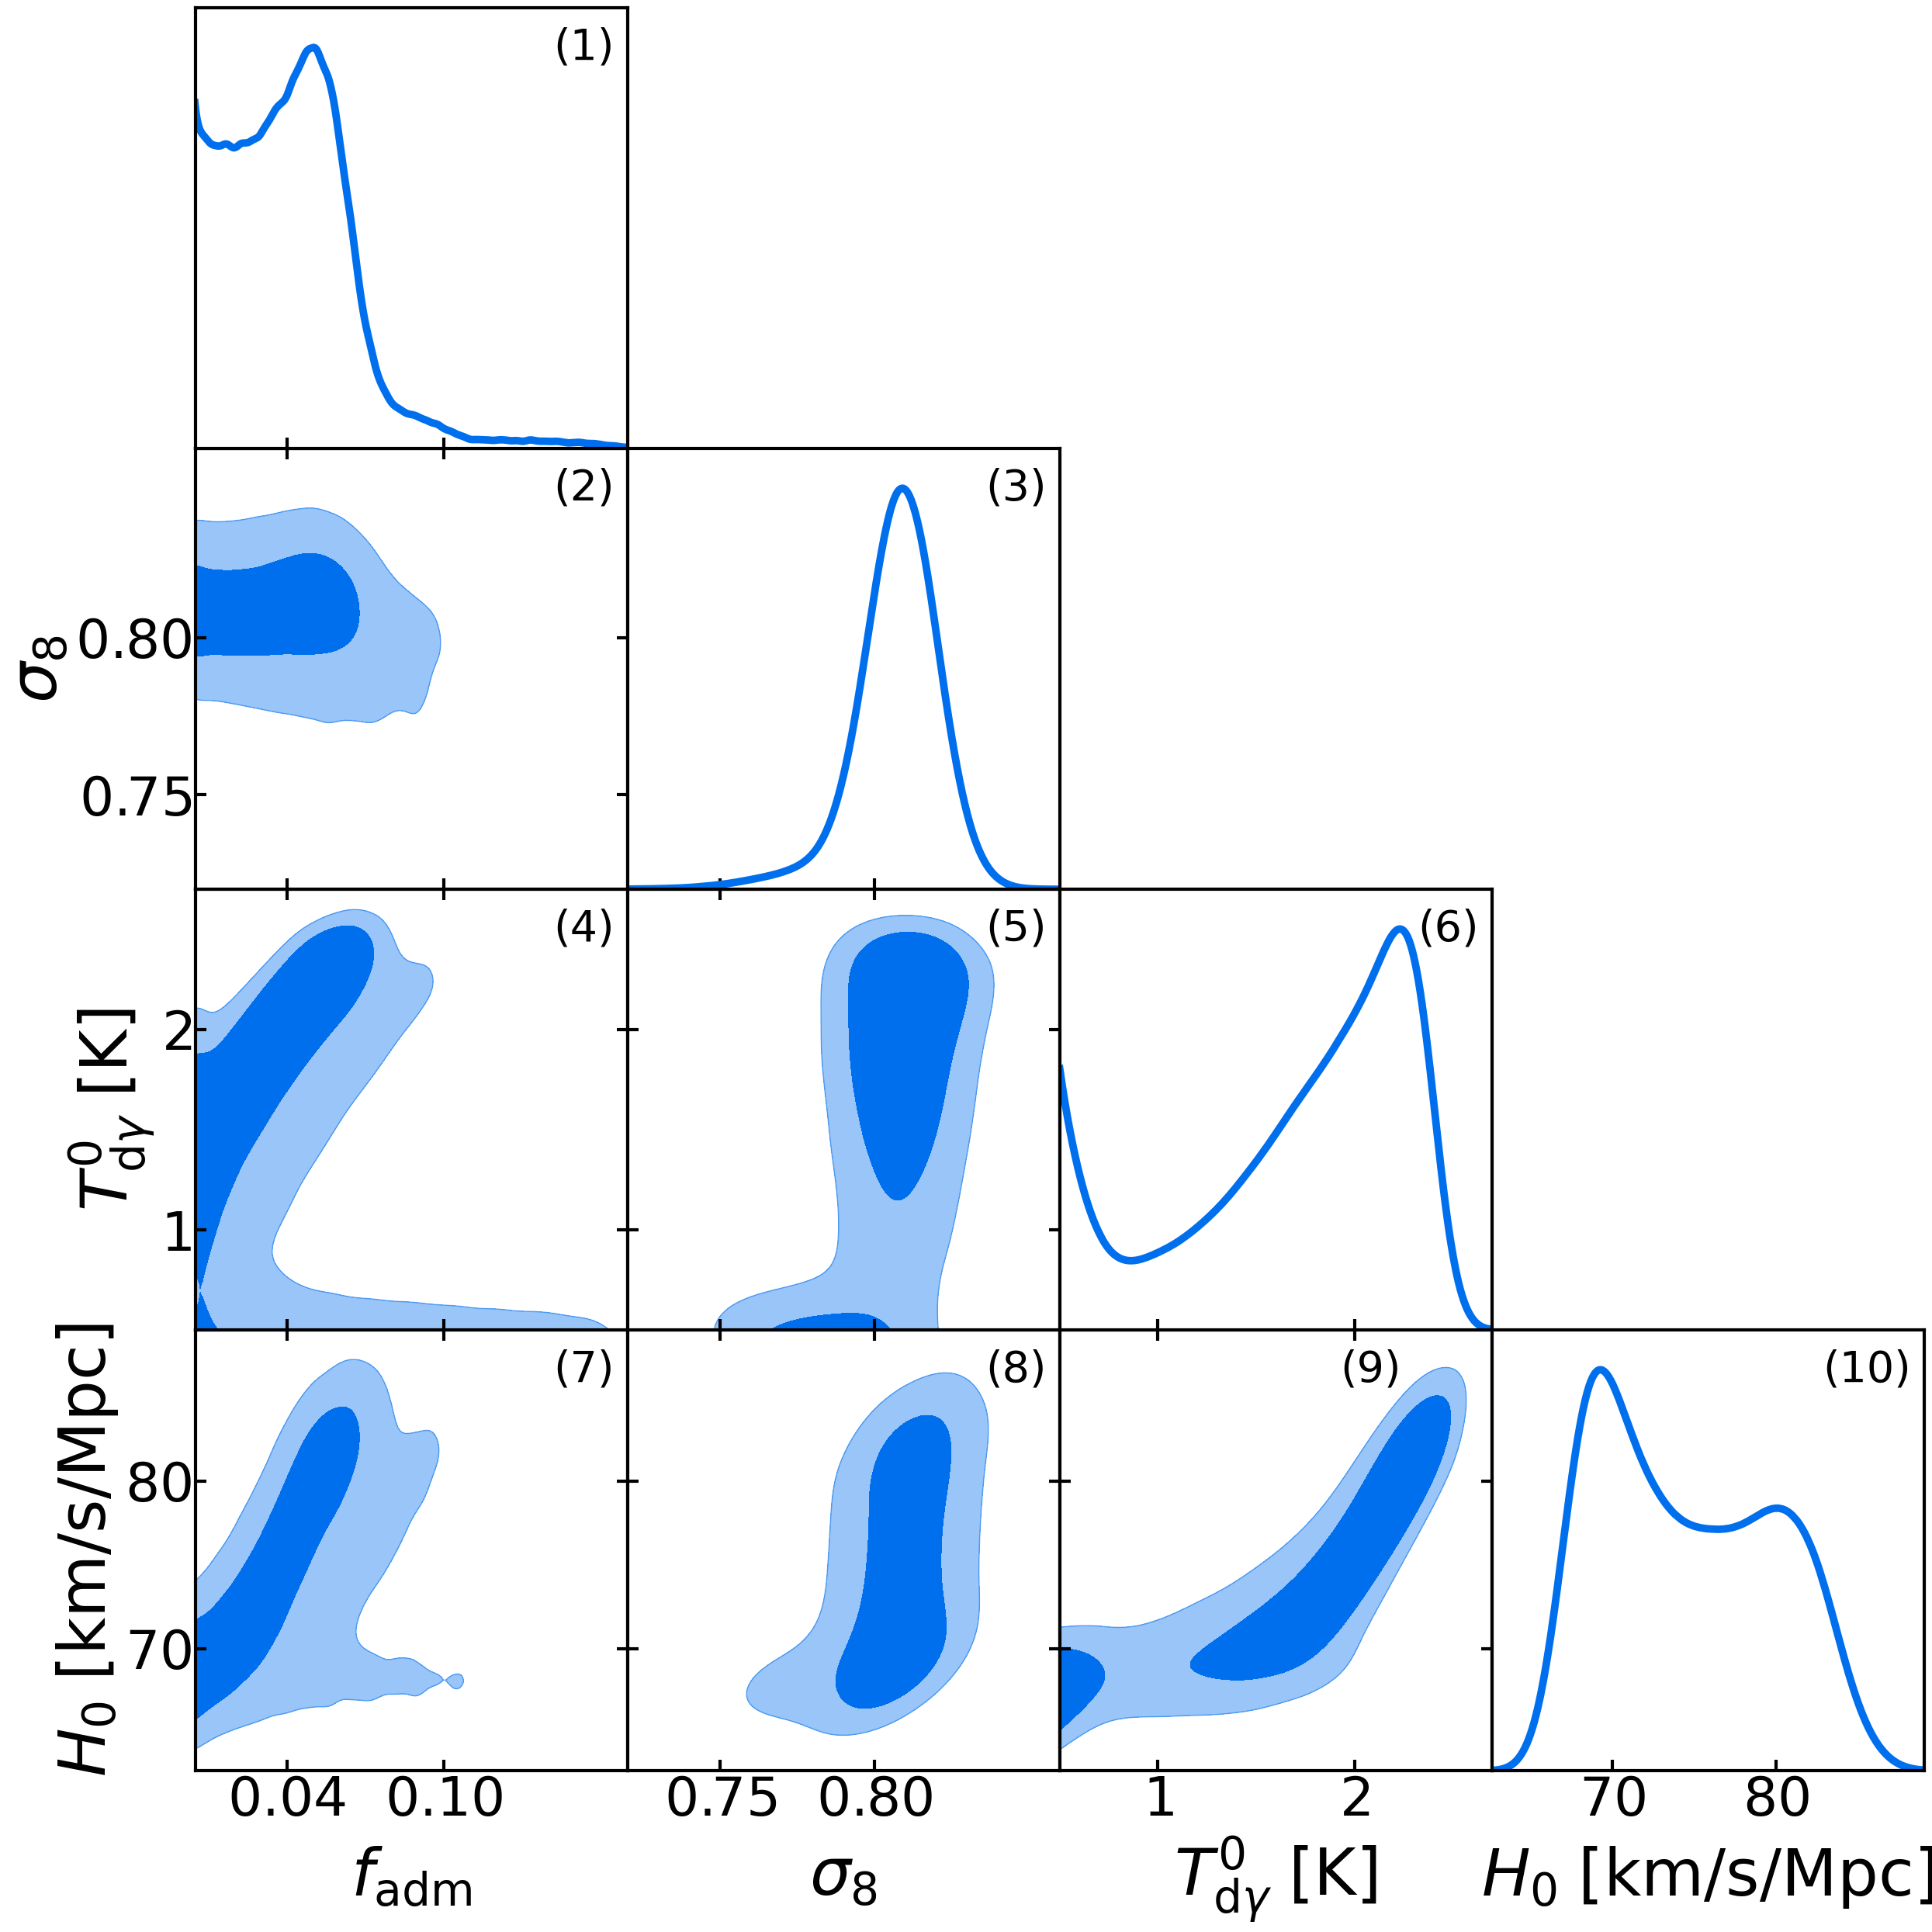
We therefore expect to see this parameter-space direction emerge in the constant probability density contours of our BBN-inconsistent no-SH0ES posterior shown in Fig. 6(d). The elongated features in Figs. 6(d)(4), 6(d)(7), and 6(d)(9) indicate a positive correlation between and , between and , and between and , respectively, consistent with the expectations due to the scaling transformation symmetry.
As pointed out in Ref. [120], the scaling transformation, at least as they implement it, requires BBN-inconsistent helium abundances. Also noteworthy, the helium abundance required for consistency with SH0ES is significantly below determinations from observations [132, 133, 134, 135, 136]. These are formidable challenges to the building of a model that can successfully exploit the FFAT scaling to solve the Hubble tension (see however Ref. [137]). Nevertheless, we see the explanatory power of the FFAT symmetry, as it explains these features of the posterior.
III.2 Constraints at low
As expected from Sec. II.1, with low , dark photons provide only very mild pressure support to dark baryons (and almost none at all after dark recombination). Thus, at low , ADM is semi-degenerate with CDM, and the ADM parameter space opens up significantly as a result, as can be seen with the higher values of allowed in Figs. 6(a)(4), 6(b)(4), and 6(d)(4).
However, there is not a complete degeneracy between ADM and CDM at low , and distinct observational signatures between the two models remain. As discussed in Sec. II.1, even with low , the matter power spectrum in the presence of ADM is damped relative to the CDM matter power spectrum. Therefore, lower values of in line with the KiDS-1000 result [99] are allowed with lower , as can be seen in Figs. 6(a)(5), 6(b)(5), and 6(d)(5).
Furthermore, a higher fraction of pressure-supported dark matter also yields a dampened matter power spectrum, and therefore a reduced , relative to that of CDM. Thus, the above-mentioned tolerance for higher at low also allows for lower , as can be seen in Figs. 6(a)(2), 6(b)(2), and 6(c)(2). This low and low region of parameter space is interesting because it could provide a solution to the tension. We discuss this potential solution more below in Sec. IV. As we will see in Sec. V.4, this mechanism for reducing appears to be testable with future CMB measurements.
We now compare with another recent exploration of the ADM model parameter space [107]. In addition to , , and , they also freed up the dark proton mass and dark fine structure constant. Somewhat surprisingly, since our model space is a subspace of theirs, their marginal posteriors, when using the data sets we use, do not indicate the presence of a low solution. It is possible this is due to differential volume effects as they have two additional dimensions over which to marginalize. For a recent discussion of volume effects and how they can cause interesting solutions to get hidden (if one is “looking” with the posterior probability distribution), see Ref. [138]. Some support for this hypothesis comes from the fact that when they effectively adopt a strong prior on a low , they find their model can accommodate it.
This effective adoption of a strong prior is their use of the Planck 2013 Sunyaev-Zel’dovich (SZ) data [139] that acts as a tight constraint centered on a lower value of . Note that the Planck 2013 SZ likelihood used by [107], unlike other versions in Planck 2015 [140], assumes zero uncertainty in the mass bias parameter which controls the relationship between cluster mass and SZ observables. This assumption leads to a significant underestimate of uncertainty in . Therefore, we chose not to include the Planck 2013 SZ data in our analysis.
III.3 Constraints on
As discussed above in Sec. III.1, for the BBN-inconsistent model without the SH0ES data in Fig. 6(d), a broad range of values is allowed by current CMB and BAO data as a result of the FFAT scaling transformation symmetry in Ref. [120]. Of course, for the cases where we include SH0ES data, the uncertainty decreases dramatically. Even without including SH0ES data, enforcing BBN consistency prevents the Thomson rate from following FFAT scaling, also leading to a dramatic reduction of the posterior width.
While higher values of are not preferred by current CMB and BAO data for the BBN-consistent model without the SH0ES data in Fig. 6(b)(10), tolerance for higher values of , in line with the latest SH0ES measurement [141], is well above what we have in the case of CDM. Thus, the partial opening of the ADM parameter space in this work still could provide a possible, albeit partial, resolution to the tension, as seen in Ref. [120].
It is worth noting that, for the BBN-consistent model without the SH0ES data, higher and lower are not simultaneously allowed by current data, as seen in Fig. 6(b)(8). Similarly, the addition of the SH0ES data in Fig. 6(a)(3) tightens the 1-dimensional constraints on , as compared to the constraints without the SH0ES data in Fig. 6(b)(3), thereby excluding the lowest values of . This effect of partially excluding low with the inclusion of the SH0ES data can also be seen in the 2-dimensional constraints on and in Fig. 6(a)(5). Therefore, the low and low region of parameter space discussed above in Sec. III.2 does not provide a simultaneous solution to both the and tensions.
In order to confirm the effects of lower values of on the CMB and verify the observational viability of the possible solution to the tension discussed in Sec. III.2, we will next explore the best fit with low and low from the BBN-consistent model without inclusion of the SH0ES data to determine whether it does indeed provide a good fit to the Planck CMB data.
IV Observational viability of region of low and low
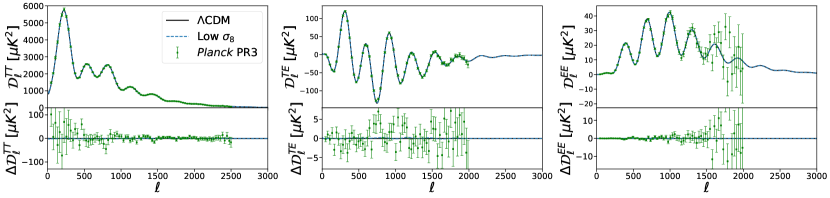
As an assessment of the observational viability of this region of low and low and as an exploration of the quality of the fit to current data provided by models in this region, we assess the best-fit BBN-consistent model with , , and fixed . We chose these bounds to ensure that we selected a model with low and to ensure that the chosen is both comparable to the value of analyzed in Sec. II and is high enough to have detectable effects. We chose to fix to its standard model value of 3.044 [129] in order to reduce the amount of beyond-CDM physics introduced in this assessment. The model parameters for this best-fit model are described in the Fig. 7 caption.
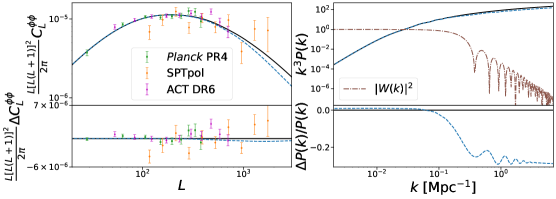
Fig. 7 compares the CDM TT, TE, EE, lensing, and linear matter power spectra with the corresponding power spectra for this best-fit model, as well as with current CMB and lensing data. We see that the ADM and CDM TT, TE, and EE spectra are extremely similar. The lensing power spectra are quite similar as well. In all four cases, both models appear to provide good fits to current data. The CDM and ADM matter power spectra are very similar at low , with the expected differences (see Sec. II) appearing at high .
We do not show a comparison with inferences of from observations. An accurate comparison here would require calculation of nonlinear corrections to the ADM model, a calculation that we have kept beyond the scope of this work. Recently, the authors of Refs. [146, 147] found that the mild tension between values inferred from weak lensing shear measurements and those from Planck CDM cosmology can be reconciled if the nonlinear matter power is more suppressed than hydrodynamical simulations predict. The scale at which this suppression emerges is similar to the scale where we start to see deviations from CDM in the linear ADM . ADM could provide a possible mechanism for this additional suppression.
We now present a more quantitative comparison with the calculation of the difference in values between the best-fit CDM model and our best-fit ADM model with low and low . The for the ADM model is higher than that of the best-fit CDM model. A slightly better fit with can be found if is allowed to vary, with a slightly lower . However, in this case, the reduction is less than the decrease in the number of degrees of freedom, so freeing does not improve the quality of fit by more than one would expect from noise fitting. Note that, while the value of for the best-fit model with fixed is higher than the KiDS-1000 central value, it is less than their 68% confidence upper limit of 0.79 [99]. Since this region of high and low provides an acceptable fit to current CMB data, with a value of in agreement with low-redshift measurements, we see that it contains possible solutions to the tension.
Our claim that the ADM model can improve concordance with cosmic shear measurements is substantiated by the fact that it can accommodate a lower consistent with the values inferred from these measurements. However, this claim should be verified via an analysis that compares with the data at a lower-level of reduction; e.g., with the shear-shear correlation functions they determine. We believe such a study is highly motivated by the analysis we present here.
V Forecasting the sensitivity of future experiments to atomic dark matter
The low , low , high region of parameter space that is consistent with current data raises the question of its detectability with future measurements. We investigate this question for the ongoing surveys of the South Pole Telescope with its 3rd focal plane detector array (SPT-3G), a survey to start in 2024 (the Simons Observatory or SO), and one planned to start near the end of this decade, CMB-S4 [148, 149].
V.1 Experimental setups
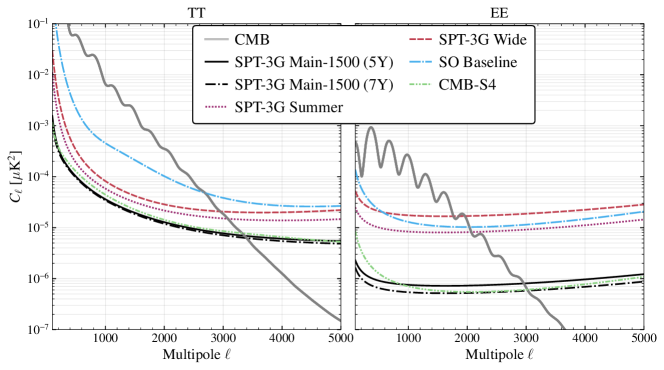
We consider a few current and future CMB surveys: SPT-3G [150], SO [151], and CMB-S4 [152]. For SPT-3G, we perform forecasts for two setups: (A) SPT-3G Ext-4k covering 4000 deg2 and (B) SPT-3G Ext-10k covering 10,000 deg2. SPT-3G Ext-4k is the ongoing SPT survey, a combination of two fields (‘Main-1500’ and ‘Summer’) with different noise levels with a combined coverage slightly greater than 4000 deg2. SPT-3G Ext-10k is the combination of SPT-3G Ext-4k with an additional 6000 deg2 survey expected to be carried out in the 2024 Austral Winter.
Table 2 lists the experimental beam and the white noise levels for all the surveys. Other than the instrumental white noise, the maps also contain atmospheric noise parameterised using and with values given in Table 3 for SPT-3G and CMB-S4. For SO Baseline, we model the atmospheric noise using the procedure described in Ref. [153] and adopt the values of the parameters of this noise model as given in Ref. [151].
The total noise power spectrum in each frequency band is modelled as
| (13) |
where represents the white noise level for a given band in ; and are used to parameterize the atmospheric noise; and is the experimental beam window function with listed in Table 2.
| Survey | Survey period | Beam in arcminutes ( in ) | ||||||
|---|---|---|---|---|---|---|---|---|
| 30 GHz | 40 GHz | 90 GHz | 150 GHz | 220 GHz | 285 GHz | |||
| SPT-3G Main-1500 (5Y) | 0.036 | 2019-23 | - | - | 1.7 (3) | 1.2 (2.2) | 1 (8.8) | - |
| SPT-3G Main-1500 (7Y) | 0.036 | 2019-23, 2025-26 | 1.7 (2.5) | 1.2 (1.85) | 1 (7.4) | |||
| SPT-3G Summer | 0.064 | 2019-23 | 1.7 (8.5) | 1.2 (9.0) | 1 (31) | |||
| SPT-3G Wide | 0.145 | 2024 | 1.7 (14) | 1.2 (12) | 1 (42) | |||
| SO Baseline | 0.4 | 2024-29 | 7.4 (71) | 5.1 (36) | 2.2 (8) | 1.4 (10) | 1 (22) | 0.9 (54) |
| CMB-S4 | 0.57 | 2029-36 | 7.4 (21.3) | 5.1 (11.7) | 2.2 (1.9) | 1.4 (2.1) | 1 (6.9) | 0.9 (16.9) |
| Band [GHz] | SPT-3G | CMB-S4 | ||
|---|---|---|---|---|
| T | P | T | P | |
| 30 | - | - | 415, 3.5 | 700, 1.4 |
| 40 | 391, 3.5 | |||
| 90 | 1200, 3.0 | 300, -1 | 1200, 4.2 | |
| 150 | 2200, 4.0 | 1900, 4.1 | ||
| 220 | 2100, 3.9 | 2100, 4.1 | ||
| 285 | - | 2100, 3.9 | ||
V.2 Foregrounds and Internal Linear Combination
Other than the experimental noise described above, the total variance in the maps also receives contributions from astrophysical and galactic foreground emission.
Extragalactic sources include radio galaxies (RG), dusty star-forming galaxies (DG), and kinematic and thermal Sunyaev-Zel’dovich (kSZ and tSZ) signals. We model these based on the SPT measurements [154]. For more details of the modelling of these temperature foregrounds, we refer the reader to Ref. [153, 155]. For polarization, we assume the 2% polarization fraction for RG and simply scale the temperature power spectrum of accordingly [156, 157]. Other extragalactic foregrounds are assumed to be unpolarized.
Given that surveys like CMB-S4 plan to scan larger regions of sky, it is crucial to consider the impact of galactic foreground signals as well. Important galactic foregrounds include galactic dust and synchrotron signals. While the original CMB-S4 footprint is , we ignore the regions () that are strongly contaminated by our galaxy and only consider 57% for the forecasting purposes here. The SPT-3G Ext-4k, SPT-3G Ext-10k, and SO Baseline footprints, with sky fractions of and respectively, avoid regions with strong galactic foregrounds. We therefore ignore galactic foregrounds for the baseline SPT-3G and SO forecasts, as well as for the CMB-S4 forecasts after the galactic plane cut. However, as a sanity check, we assess the impact of galactic foregrounds using pySM [158] simulations. This is described in Sec. V.4.
To reduce the overall impact of noise and foregrounds, we use the internal linear combination (ILC) technique [159, 160] to optimally combine data from multiple frequency bands to produce the minimum variance (MV-ILC) CMB map as
| (14) |
where is the spherical harmonic transform of the map from the th frequency band and the multipole-dependent weights are tuned in order to minimize the overall variance from noise and foregrounds. The weights are derived as
| (15) |
where is a matrix containing the covariance of foregrounds and beam-deconvolved noise across different frequencies at a given multipole ; is the frequency response of the CMB in different bands, and it is a vector. The sum of residual noise and foregrounds power in the MV-ILC map is given as
| (16) |
which we use for forecasting in the subsequent sections. In Fig. 8, we present for all the experiments considered in this work.
To include CMB lensing information, we feed the MV-ILC residuals into a lensing quadratic estimator (QE) [161, 162] and compute the resultant lensing noise curves . We set for temperature and for polarization during lensing reconstruction. The former choice is to mitigate the impact of mis-modelling the small-scale foregrounds in the temperature maps. For lensing reconstruction from a more optimistic version of CMB-S4, we increase to for both temperature and polarization.
V.3 Forecasting methods
We forecast expected errors on ADM parameters from measurements of CMB intensity and linear polarization maps as follows. First, we calculate the Fisher information matrix via
| (17) |
where ; the are the model parameters; and
| (18) |
where
| (19) |
, is the residual foregrounds and noise spectrum for the MV-ILC map described in Sec. V.2, and is the fraction of the sky observed. We then calculate the parameter covariance matrix as . Our Eq. (18) can be derived from Eqs. 8.20 and 8.21 of Ref. [148]. For all experiments, we include for TT, for EE/TE, and for to match the ranges used for lensing reconstruction. As mentioned earlier in Sec. V.2, we ignore small-scale () temperature information due to the difficulties in modelling the foregrounds. Given that CMB-S4 is a expected to operate in the next decade, we also consider an optimistic case by setting , assuming we will have better foreground mitigation strategies by then. To be specific, we use for TT/EE/TE and for .
This procedure is appropriate for homogeneous coverage, when correlations across multipole moments and types of spectra due to gravitational lensing can be neglected, and when the posterior probability distribution of the model parameters is close to Gaussian. The impacts of lensing-induced correlations increase with decreasing noise levels. Even for CMB-S4, these effects tend to cause at most 20% changes to parameter standard errors [163]. Non-Gaussianity of the parameter posterior distribution is a concern we address below.
V.4 Forecasted sensitivity of future experiments
| Forecasted standard error () | |||||
| Parameter | Fiducial value | SPT-3G Ext-4k | SPT-3G Ext-10k | SO Baseline | CMB-S4 |
| 0.049 | 0.038 | 0.056 | 0.014 | ||
| (eV/K) | 21 | 14 | 12 | 8 | |
| (K) | 0.15 | 0.11 | 0.12 | 0.05 | |
| 0.13 | 0.10 | 0.09 | 0.05 | ||
| 0.025 | 0.018 | 0.017 | 0.009 | ||
| (eV/K) | 5.8 | 3.9 | 3.6 | 2.1 | |
| (K) | 0.41 | 0.29 | 0.26 | 0.14 | |
| 0.18 | 0.13 | 0.13 | 0.06 | ||
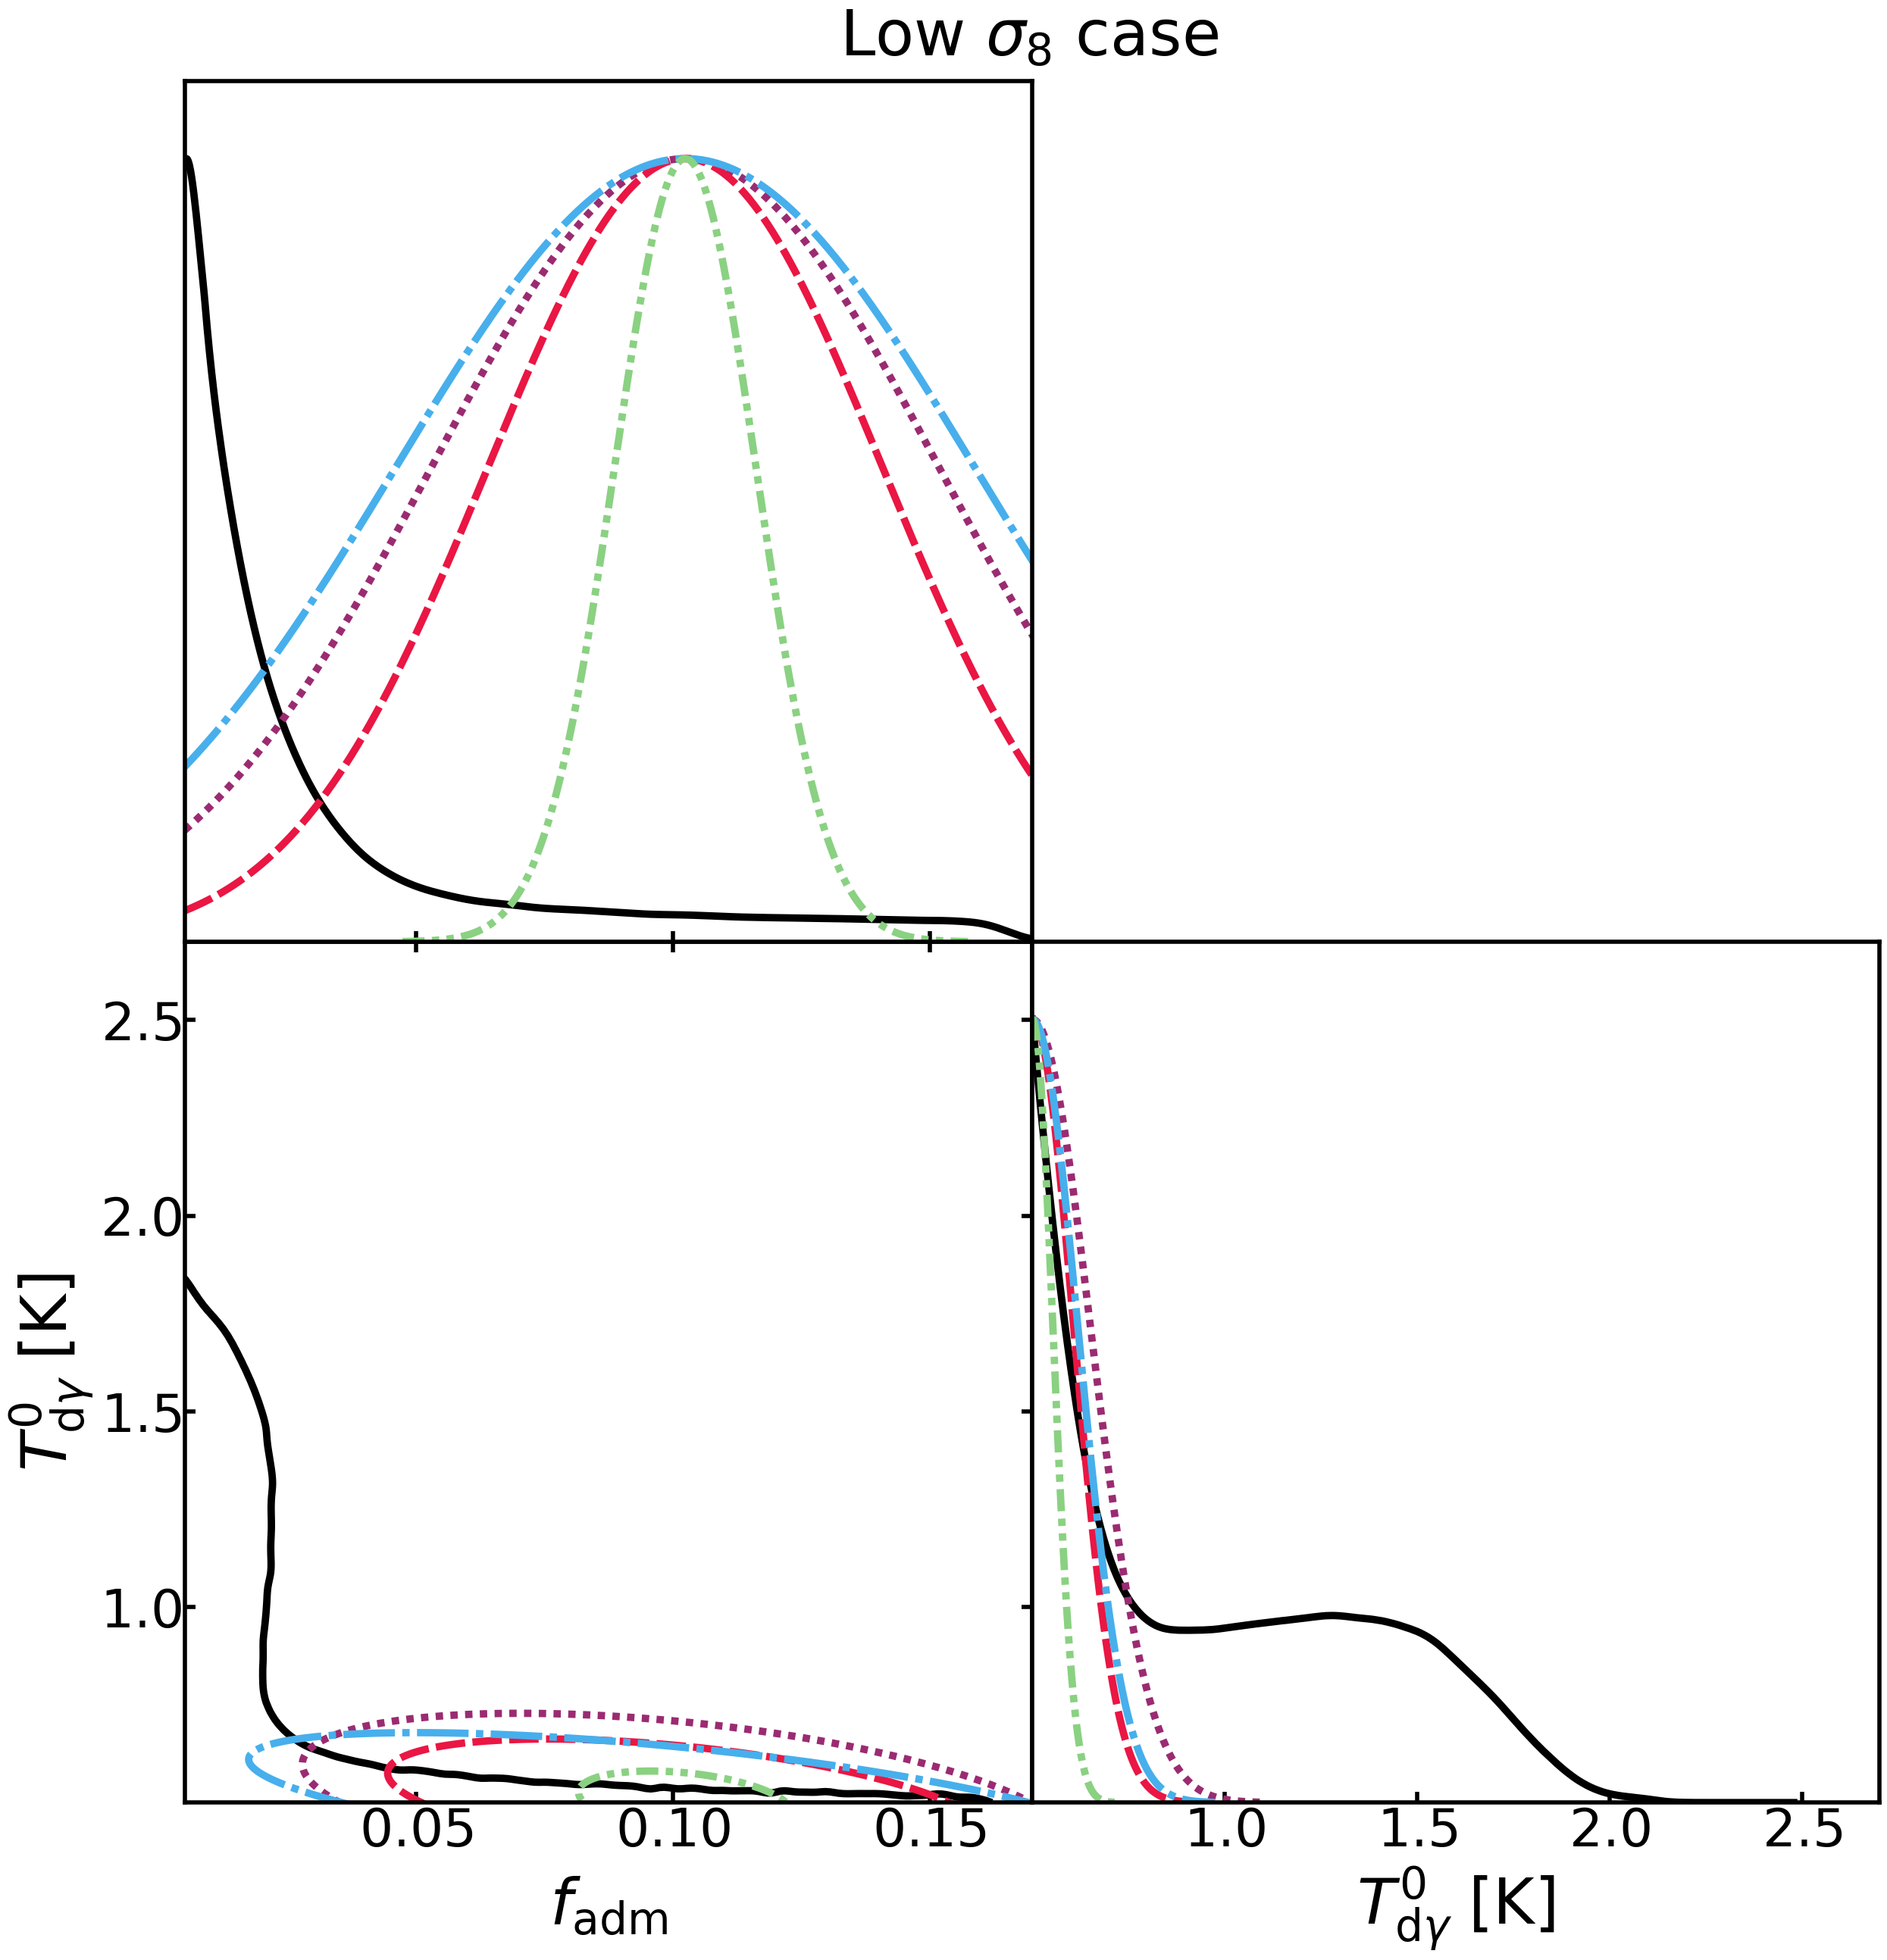
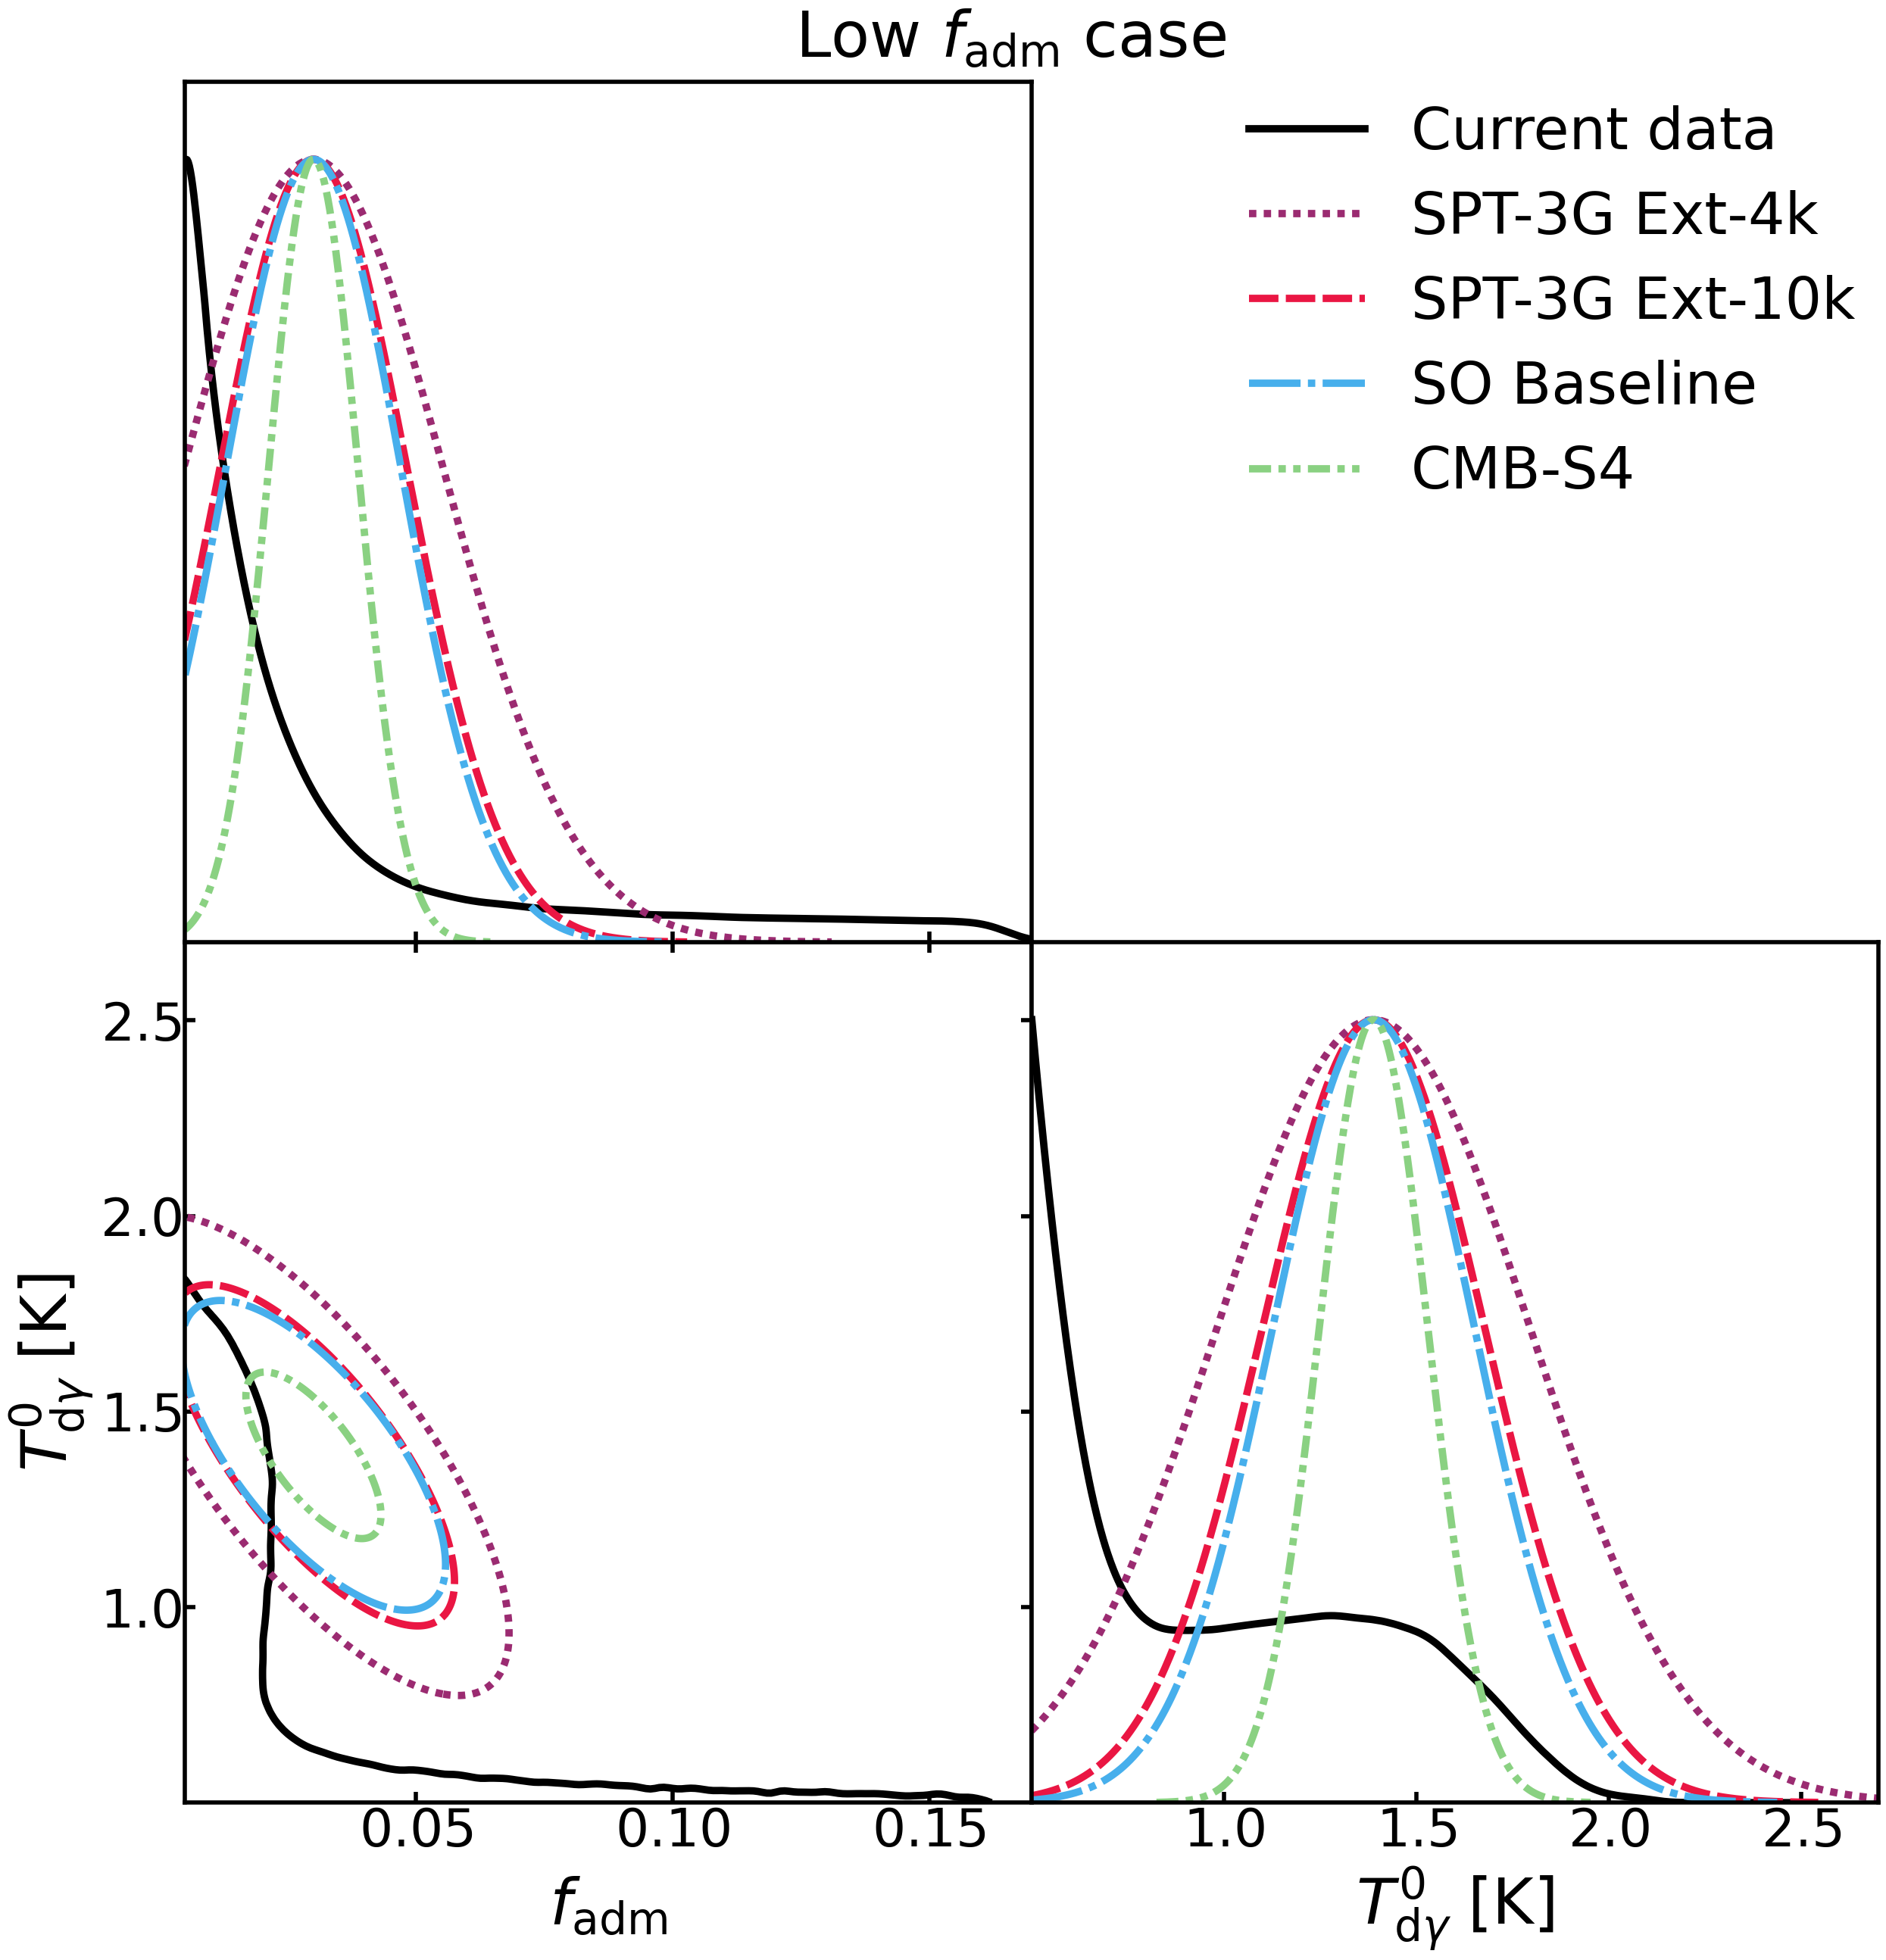
In order to forecast the sensitivity of upcoming CMB experiments to the low and low region of parameter space discussed in Sec. III.2 and Sec. IV, we will forecast the sensitivity of SPT-3G, SO, and CMB-S4 to the best-fit BBN-consistent model with , , and fixed that we explored in Sec. IV, hereafter referred to as the low model. As a second point of reference, we will also forecast the sensitivity of SPT-3G, SO, and CMB-S4 to the best-fit BBN-consistent model with fixed , hereafter referred to as the low model. The fiducial models used for forecasts, as well as one-dimensional marginal errors in ADM parameters and , are outlined in Table 4. Forecast results are also shown in Fig. 9.
Before looking at the ADM parameter constraints, we point out that the forecasted constraints on degrade some from their CDM + expected values due to the additional degrees of freedom. For example, the CMB-S4 forecasted for the low fiducial model is somewhat larger than the forecasted for a fiducial model with no ADM [164]. If we include up to for TT/EE/TE/ and for lensing reconstruction, as done in [155], we find . Presumably this mild degradation to 0.04 from 0.0327 is due to some degree of degeneracy that emerges between and the other cosmological parameters, with the addition of the three ADM parameters. We have checked that when we instead eliminate the ADM, using an unmodified version of CAMB, we recover .
The key question we wish to address here is whether CMB-S4 will be able to detect the influence of ADM if the cause of the tension is indeed due to a low-temperature ADM. We are thus most interested in the constraints on the low fiducial model – the one with used for the left panel of Fig. 9. As can be seen in Table 4, the expected error in this case is 0.014, allowing for a greater than detection. If we include up to for TT/EE/TE/ and lensing reconstruction, which would require successfully cleaning foregrounds out to higher , the expected error halves to 0.007, which would allow for a greater than detection.
The posteriors given current data, as one can see in Figs. 6 and 9, are highly non-Gaussian. The forecasting methods used assume Gaussianity, so the non-Gaussian posterior is a source of concern. However, we expect that as the data become more constraining, the posterior will become more Gaussian. We see evidence of this from the forecasts for our second fiducial model, which has a much lower value of . The error on assuming this fiducial model is 0.009, only slightly different from the higher (low ) case. The marginal posterior for given CMB-S4 data thus appears to be fairly Gaussian, enough so that a detection would almost certainly be a detection of very high significance.
Experiments prior to CMB-S4 also have a chance of seeing some, perhaps only weak, evidence in favor of non-zero . SPT-3G Ext-10k, given the low fiducial model, can nominally be expected to make a detection of non-zero . However, one can see greater fiducial model sensitivity to the error on for SPT-3G Ext-4k, SPT-3G Ext-10k, and SO Baseline, so these constraints are both weaker than those from CMB-S4 and less certain. A clearer picture of expectations in these cases would require calculation of posterior distributions from simulated data.
The relative performance of SO Baseline to the SPT-3G surveys changes significantly between our two fiducial model cases. In the low case (with high ) the main observable impact of varying is in lensing, where the deeper SPT-3G Main-1500 survey leads to stronger lensing constraints at small scales than one expects from SO Baseline. The result is tighter constraints on from the SPT-3G surveys. In the low case, the signals show up more in the field (TT/TE/EE) power spectra where SO’s wider sky coverage is more of an advantage, and so SO’s performance relative to that of the SPT-3G surveys is stronger.
We also note that these forecasts indicate that some fairly precise measurements of may be possible with CMB-S4 data in either fiducial model case; formally, these are constraints. In the low (low ) case, one should be able to both bound the temperature from below, and have clear evidence that the temperature is well below that of the CMB or the cosmic neutrino background. The temperature constraint would be a valuable clue, in either case, about a possible thermal origin for the dark photon relic.
We have also plotted contours from our forecasts and for current data for our two most well-constrained ADM parameters, and , in Fig. 9. One can visually see here the qualitative improvement over constraints from current data expected very soon from the SPT-3G Ext-4k survey, and a continuing progression through to the CMB-S4 constraints.
As mentioned in Sec. V.2, we also check the impact of galactic foregrounds on our constraints. We generate galactic dust and synchrotron signals using publicly available pySM [158] simulations, which are based on Planck sky model code [165]. We calculate the dust and synchrotron foreground power in the SPT and CMB-S4 footprints, and include them along with other components in the ILC step. With the inclusion of galactic foregrounds, we find that the above constraints weaken only marginally by .
It is important to note that all forecasts in this paper are based on linear theory predictions. However, there exist significant nonlinear corrections to the results outlined in this section, meaning that future work on nonlinear predictions is needed to refine these forecasts, as well as for the comparison of theoretical matter power spectra to data mentioned in Sec. IV.
Despite a caveat regarding the varying sensitivity of future experiments to different fiducial ADM models, ultimately, these forecasts demonstrate the promise for the ADM model in general, and the low and low region of parameter space in particular, to be tightly constrained with upcoming CMB experiments. These tighter constraints include the possibility of either confirming or excluding the low and low region of parameter space, meaning that, if this region is the solution to the tension, its effects should be detectable with future experiments.
VI Conclusions
We investigated the observational consequences of an extension to CDM to include both ADM and the possibility of a non-standard energy density in free-streaming massless particles. The ADM consists of dark protons and dark electrons interacting via a dark electromagnetism, and hence the model includes a thermal background of dark photons. Like in the visible sector, these undergo a transition from a tightly-coupled plasma to dark hydrogen plus free-streaming dark photons. Since the dark electrons, protons, and hydrogen are all non-relativistic during the epochs of interest we consider them as contributions to the total density of dark matter, while the massless dark photons contribute to the total radiation density. The free parameters of the model we took to be the fraction of dark matter that is atomic , the temperature of dark photons today , and the binding energy of dark hydrogen , in addition to the standard CDM parameters and .
We examined the impact of ADM on CMB and matter power spectra in the “cool” regime (with in the 0.6 K to 1 K range) in Sec. II. In this regime, the main influence on the CMB temperature and polarization spectra is via gravitational lensing, due to the impact on the matter power spectrum . We saw no change from in our baseline CDM model for modes entering the horizon after dark recombination, and a nearly-uniform suppression of power for modes that enter during radiation domination and while has not yet dropped much below its maximum value of 1/3. The suppression of power is due to the pressure support received by the fraction of the dark matter that is ADM. This pressure support slows down the gravitationally-driven growth of both the ADM and CDM perturbations, as the ADM does not contribute as much as it would otherwise to gravitational potential gradients. Such suppression of power is a general feature of models in which part of the dark matter interacts with dark radiation, which others have also noted might address the tension [e.g. 109, 110, 111, 112, 113, 114, 115, 116, 117, 118, 107].
We also looked at the dependence of these effects on variations in the dark photon temperature in Sec. II.1, and on variations in the dark hydrogen binding energy in Sec. II.2. Because of the primary role of CMB lensing, we also focused here on . Variation in (at fixed ) changes when dark recombination occurs, impacting the duration of pressure support for the ADM and, therefore, the amount of power suppression. Varying also changed the amplitude of dark photon pressure. We looked at the dependence of the square of the sound speed of the dark photon-ADM plasma on dark photon temperature since pressure gradients are proportional to this quantity. No matter the dark photon temperature, at sufficiently early times, reaches its maximal value of 1/3. Modes that enter the horizon after significant reduction of this quantity do not suffer the suppression in growth due to pressure support. Reducing thus moves the onset of suppression to higher .
We then constrained the ADM model using current CMB [98] and BAO [125, 126, 127] data in Sec. III by considering four different model spaces: both with and without BBN constraints on helium abundance, and with and without incorporating the measurement from SH0ES [128]. In Sec. III.1, we saw in elongated probability density contours evidence of a quasi-degeneracy between , , and . We pointed out that this is expected since this model space allows for a scaling transformation that is nearly the FFAT-scaling transformation, with associated symmetry, introduced in Ref. [120] and discussed extensively in Ref. [119]. Likewise, this scaling transformation cannot be followed in the three cases where we included SH0ES data and/or enforced BBN consistency, and hence we do not see the elongated contours in these cases. These results highlight the explanatory power of the FFAT scaling transformation symmetry.
In Sec. III.2 we presented a key finding: at low dark photon temperature, the ADM parameter space opens up significantly, allowing for higher fractions of ADM and therefore a lower . This lower is in line with results from cosmic shear and other large-scale structure measurements [99, 100, 101, 102, 103, 104, 105], providing a possible solution to the tension. We can understand the lower physically because, as we found in Sec. II, is suppressed on small scales with the presence of the pressure-supported ADM.
We subsequently verified the observational viability of the low and low region of parameter space by comparing CMB power spectra for a best-fit model in the region, to current data in Sec. IV. We found that the best-fit model with low , high , and fixed to its standard model value provides a good fit to current data, roughly comparable to that of CDM with only higher. We saw no significant improvement in quality of fit by letting vary. However, it is worth noting, as seen in Sec. III.3, that this possible solution to the tension likely does not provide a simultaneous solution to the and tensions.
This low region of the parameter space requires a dark photon temperature of about 0.5 K. This is below the temperature expected for a boson with two degrees of freedom even if it froze out while all standard model particles were still relativistic. Such a cool component would point to different post-inflation reheating temperatures for the ADM and dark photons, relative to standard model particles, and thus have implications for the reheating process (see e.g. Ref. [166]). A non-thermal mechanism for dark-sector particle production could be a potential solution (see e.g. Refs. [112, 167]).
Our investigation also motivates the development of nonlinear corrections to the linear ADM model predictions presented in this paper, both in order to compare ADM matter power spectra with current data and to improve forecasts, as mentioned in Sec. IV and V.4. Additionally, beyond the analysis via presented in this paper, our work highlights the need for more robust comparison to cosmic shear measurements (possibly via shear-shear correlation functions) to see the extent to which the low region identified in Sec. III.2 improves concordance with these measurements, as mentioned in Sec. IV.
In order to determine whether this possible solution to the tension could be tested with future observations, we forecasted the sensitivity of future CMB experiments to this low region of parameter space. We found in Sec. V.4 that CMB-S4 will be able to tightly constrain both the fraction of ADM and the dark photon temperature, including the possibility of detecting nonzero with high significance. We also see the promise of experiments prior to CMB-S4 – SPT-3G and SO – to provide steadily tighter constraints on the ADM model. Ultimately we find that, if the low and low region of parameter space is the solution to the tension, its effects should be detectable with future CMB experiments.
VII Acknowledgements
This material is based upon work initiated as part of the Physics Research Experiences for Undergraduates (REU) Program at the University of California, Davis and was supported by the National Science Foundation (NSF) under grant PHY-2150515. LK, FG, and EH were supported in part by DOE Office of Science award DE-SC0009999. F.-Y. C.-R. is supported by the NSF under grant AST-2008696. F.-Y. C.-R. also thanks the Robert E. Young Origins of the Universe Chair fund for its generous support. SR is supported by the Center for AstroPhysical Surveys (CAPS) at the National Center for Supercomputing Applications (NCSA), University of Illinois Urbana-Champaign. LK acknowledges the hospitality of TTK at RWTH where some of this work was completed. We thank B. Benson and T. Crawford for feedback on a draft and G. Lynch for useful conversations.
References
- Goodman and Witten [1985] M. W. Goodman and E. Witten, Detectability of certain dark-matter candidates, Phys. Rev. D 31, 3059 (1985).
- Jungman et al. [1996] G. Jungman, M. Kamionkowski, and K. Griest, Supersymmetric dark matter, Phys. Rep. 267, 195 (1996), arXiv:hep-ph/9506380 .
- Peccei and Quinn [1977] R. D. Peccei and H. R. Quinn, Constraints imposed by CP conservation in the presence of pseudoparticles, Phys. Rev. D 16, 1791 (1977).
- Wilczek [1978] F. Wilczek, Problem of strong P and T invariance in the presence of instantons, Phys. Rev. Lett. 40, 279 (1978).
- Arkani-Hamed et al. [2009] N. Arkani-Hamed, D. P. Finkbeiner, T. R. Slatyer, and N. Weiner, A theory of dark matter, Phys. Rev. D 79, 015014 (2009), arXiv:0810.0713 [hep-ph] .
- Chacko et al. [2006a] Z. Chacko, H.-S. Goh, and R. Harnik, The Twin Higgs: Natural electroweak breaking from mirror symmetry, Phys. Rev. Lett. 96, 231802 (2006a), arXiv:hep-ph/0506256 .
- Chacko et al. [2006b] Z. Chacko, Y. Nomura, M. Papucci, and G. Perez, Natural little hierarchy from a partially goldstone twin Higgs, JHEP 2006 (01), 126, arXiv:hep-ph/0510273 .
- Chacko et al. [2006c] Z. Chacko, H.-S. Goh, and R. Harnik, A Twin Higgs model from left-right symmetry, JHEP 2006 (01), 108, arXiv:hep-ph/0512088 .
- Barbieri et al. [2005] R. Barbieri, T. Gregoire, and L. J. Hall, Mirror world at the large hadron collider (2005), arXiv:hep-ph/0509242 .
- Craig and Howe [2014] N. Craig and K. Howe, Doubling down on naturalness with a supersymmetric twin Higgs, JHEP 2014 (03), 140, arXiv:1312.1341 [hep-ph] .
- Craig et al. [2015] N. Craig, A. Katz, M. Strassler, and R. Sundrum, Naturalness in the Dark at the LHC, JHEP 2015 (07), 105, arXiv:1501.05310 [hep-ph] .
- Garcia Garcia et al. [2015] I. Garcia Garcia, R. Lasenby, and J. March-Russell, Twin Higgs WIMP Dark Matter, Phys. Rev. D 92, 055034 (2015), arXiv:1505.07109 [hep-ph] .
- Craig and Katz [2015] N. Craig and A. Katz, The Fraternal WIMP Miracle, JCAP 2015 (10), 054, arXiv:1505.07113 [hep-ph] .
- Farina [2015] M. Farina, Asymmetric Twin Dark Matter, JCAP 2015 (11), 017, arXiv:1506.03520 [hep-ph] .
- Farina et al. [2016] M. Farina, A. Monteux, and C. S. Shin, Twin mechanism for baryon and dark matter asymmetries, Phys. Rev. D 94, 035017 (2016), arXiv:1604.08211 [hep-ph] .
- Prilepina and Tsai [2017] V. Prilepina and Y. Tsai, Reconciling Large And Small-Scale Structure In Twin Higgs Models, JHEP 2017 (09), 033, arXiv:1611.05879 [hep-ph] .
- Barbieri et al. [2016] R. Barbieri, L. J. Hall, and K. Harigaya, Minimal Mirror Twin Higgs, JHEP 2016 (11), 172, arXiv:1609.05589 [hep-ph] .
- Craig et al. [2017] N. Craig, S. Koren, and T. Trott, Cosmological Signals of a Mirror Twin Higgs, JHEP 2017 (05), 038, arXiv:1611.07977 [hep-ph] .
- Berger et al. [2016] J. Berger, K. Jedamzik, and D. G. E. Walker, Cosmological Constraints on Decoupled Dark Photons and Dark Higgs, JCAP 2016 (11), 032, arXiv:1605.07195 [hep-ph] .
- Chacko et al. [2017] Z. Chacko, N. Craig, P. J. Fox, and R. Harnik, Cosmology in Mirror Twin Higgs and Neutrino Masses, JHEP 2017 (07), 023, arXiv:1611.07975 [hep-ph] .
- Csaki et al. [2017] C. Csaki, E. Kuflik, and S. Lombardo, Viable Twin Cosmology from Neutrino Mixing, Phys. Rev. D 96, 055013 (2017), arXiv:1703.06884 [hep-ph] .
- Chacko et al. [2018] Z. Chacko, D. Curtin, M. Geller, and Y. Tsai, Cosmological Signatures of a Mirror Twin Higgs, JHEP 2018 (09), 163, arXiv:1803.03263 [hep-ph] .
- Elor et al. [2018] G. Elor, H. Liu, T. R. Slatyer, and Y. Soreq, Complementarity for Dark Sector Bound States, Phys. Rev. D 98, 036015 (2018), arXiv:1801.07723 [hep-ph] .
- Hochberg et al. [2019] Y. Hochberg, E. Kuflik, and H. Murayama, Twin Higgs model with strongly interacting massive particle dark matter, Phys. Rev. D 99, 015005 (2019), arXiv:1805.09345 [hep-ph] .
- Francis et al. [2018] A. Francis, R. J. Hudspith, R. Lewis, and S. Tulin, Dark Matter from Strong Dynamics: The Minimal Theory of Dark Baryons, JHEP 2018 (12), 118, arXiv:1809.09117 [hep-ph] .
- Harigaya et al. [2020] K. Harigaya, R. Mcgehee, H. Murayama, and K. Schutz, A predictive mirror twin Higgs with small Z2 breaking, JHEP 2020 (05), 155, arXiv:1905.08798 [hep-ph] .
- Ibe et al. [2019] M. Ibe, A. Kamada, S. Kobayashi, T. Kuwahara, and W. Nakano, Baryon-Dark Matter Coincidence in Mirrored Unification, Phys. Rev. D 100, 075022 (2019), arXiv:1907.03404 [hep-ph] .
- Dunsky et al. [2020] D. Dunsky, L. J. Hall, and K. Harigaya, Dark Matter, Dark Radiation and Gravitational Waves from Mirror Higgs Parity, JHEP 2020 (02), 078, arXiv:1908.02756 [hep-ph] .
- Csáki et al. [2020] C. Csáki, C.-S. Guan, T. Ma, and J. Shu, Twin Higgs with exact , JHEP 2020 (12), 005, arXiv:1910.14085 [hep-ph] .
- Koren and McGehee [2020] S. Koren and R. McGehee, Freezing-in twin dark matter, Phys. Rev. D 101, 055024 (2020), arXiv:1908.03559 [hep-ph] .
- Terning et al. [2019] J. Terning, C. B. Verhaaren, and K. Zora, Composite Twin Dark Matter, Phys. Rev. D 99, 095020 (2019), arXiv:1902.08211 [hep-ph] .
- Johns and Koren [2020] L. Johns and S. Koren, The hydrogen mixing portal, its origins, and its cosmological effects (2020), arXiv:2012.06591 [hep-ph] .
- Roux and Cline [2020] J.-S. Roux and J. M. Cline, Constraining galactic structures of mirror dark matter, Phys. Rev. D 102, 063518 (2020), arXiv:2001.11504 [astro-ph.CO] .
- Ritter and Volkas [2021] A. C. Ritter and R. R. Volkas, Implementing asymmetric dark matter and dark electroweak baryogenesis in a mirror two-Higgs-doublet model, Phys. Rev. D 104, 035032 (2021), arXiv:2101.07421 [hep-ph] .
- Curtin and Gryba [2021] D. Curtin and S. Gryba, Twin Higgs portal dark matter, JHEP 2021 (08), 009, arXiv:2101.11019 [hep-ph] .
- Curtin et al. [2022] D. Curtin, S. Gryba, D. Hooper, J. Scholtz, and J. Setford, Resurrecting the fraternal twin WIMP miracle, Phys. Rev. D 105, 035033 (2022), arXiv:2106.12578 [hep-ph] .
- Blinnikov and Khlopov [1983] S. I. Blinnikov and M. Khlopov, Possible astronomical effects of mirror particles, Sov. Astron. 27, 371 (1983).
- Ackerman et al. [2009] L. Ackerman, M. R. Buckley, S. M. Carroll, and M. Kamionkowski, Dark Matter and Dark Radiation, Phys. Rev. D 79, 023519 (2009), arXiv:0810.5126 [hep-ph] .
- Feng et al. [2009] J. L. Feng, M. Kaplinghat, H. Tu, and H.-B. Yu, Hidden Charged Dark Matter, JCAP 2009 (07), 004, arXiv:0905.3039 [hep-ph] .
- Agrawal et al. [2017] P. Agrawal, F.-Y. Cyr-Racine, L. Randall, and J. Scholtz, Make Dark Matter Charged Again, JCAP 2017 (05), 022, arXiv:1610.04611 [hep-ph] .
- Foot and Mitra [2002] R. Foot and S. Mitra, Ordinary atom mirror atom bound states: A New window on the mirror world, Phys. Rev. D 66, 061301 (2002), arXiv:hep-ph/0204256 .
- Foot and Volkas [2003] R. Foot and R. R. Volkas, Was ordinary matter synthesized from mirror matter? An Attempt to explain why , Phys. Rev. D 68, 021304 (2003), arXiv:hep-ph/0304261 .
- Foot [2004] R. Foot, Mirror matter-type dark matter, Int. J. Mod. Phys. D13, 2161 (2004), arXiv:astro-ph/0407623 .
- Foot and Volkas [2004] R. Foot and R. R. Volkas, Spheroidal galactic halos and mirror dark matter, Phys. Rev. D 70, 123508 (2004), arXiv:astro-ph/0407522 .
- Foot et al. [2008] R. Foot, A. Kobakhidze, K. L. McDonald, and R. R. Volkas, A Solution to the hierarchy problem from an almost decoupled hidden sector within a classically scale invariant theory, Phys. Rev. D 77, 035006 (2008), arXiv:0709.2750 [hep-ph] .
- Foot [2012] R. Foot, Mirror dark matter cosmology - predictions for and , Phys. Lett. B711, 238 (2012), arXiv:1111.6366 [astro-ph.CO] .
- Foot [2013] R. Foot, Galactic structure explained with dissipative mirror dark matter, Phys. Rev. D 88, 023520 (2013), arXiv:1304.4717 [astro-ph.CO] .
- Foot [2014] R. Foot, Mirror dark matter: Cosmology, galaxy structure and direct detection, Int. J. Mod. Phys. A29, 1430013 (2014), arXiv:1401.3965 [astro-ph.CO] .
- Foot and Vagnozzi [2015] R. Foot and S. Vagnozzi, Dissipative hidden sector dark matter, Phys. Rev. D 91, 023512 (2015), arXiv:1409.7174 [hep-ph] .
- Foot and Vagnozzi [2016] R. Foot and S. Vagnozzi, Solving the small-scale structure puzzles with dissipative dark matter, JCAP 2016 (07), 013, arXiv:1602.02467 [astro-ph.CO] .
- Ciarcelluti [2005a] P. Ciarcelluti, Cosmology with mirror dark matter. 1. Linear evolution of perturbations, Int. J. Mod. Phys. D 14, 187 (2005a), arXiv:astro-ph/0409630 .
- Ciarcelluti [2005b] P. Ciarcelluti, Cosmology with mirror dark matter. 2. Cosmic microwave background and large scale structure, Int. J. Mod. Phys. D 14, 223 (2005b), arXiv:astro-ph/0409633 .
- Ciarcelluti and Lepidi [2008] P. Ciarcelluti and A. Lepidi, Thermodynamics of the early Universe with mirror dark matter, Phys. Rev. D 78, 123003 (2008), arXiv:0809.0677 [astro-ph] .
- Ciarcelluti [2010] P. Ciarcelluti, Cosmology with mirror dark matter, Int. J. Mod. Phys. D 19, 2151 (2010), arXiv:1102.5530 [astro-ph.CO] .
- Ciarcelluti and Wallemacq [2014a] P. Ciarcelluti and Q. Wallemacq, Is dark matter made of mirror matter? Evidence from cosmological data, Phys. Lett. B 729, 62 (2014a), arXiv:1211.5354 [astro-ph.CO] .
- Ciarcelluti and Wallemacq [2014b] P. Ciarcelluti and Q. Wallemacq, Cosmological constraints on mirror matter parameters, Adv. High Energy Phys. 2014, 148319 (2014b), arXiv:1401.4763 [astro-ph.CO] .
- Cudell et al. [2014] J.-R. Cudell, M. Y. Khlopov, and Q. Wallemacq, Effects of dark atom excitations, Mod. Phys. Lett. A 29, 1440006 (2014), arXiv:1411.1655 [astro-ph.HE] .
- Goldberg and Hall [1986] H. Goldberg and L. J. Hall, A New Candidate for Dark Matter, Phys. Lett. B174, 151 (1986).
- Fargion et al. [2006] D. Fargion, M. Khlopov, and C. A. Stephan, Dark matter with invisible light from heavy double charged leptons of almost-commutative geometry?, Class. Quant. Grav. 23, 7305 (2006), arXiv:astro-ph/0511789 .
- Khlopov [2006] M. Y. Khlopov, Composite dark matter from 4th generation, Pisma Zh. Eksp. Teor. Fiz. 83, 3 (2006), arXiv:astro-ph/0511796 .
- Khlopov and Kouvaris [2008] M. Y. Khlopov and C. Kouvaris, Composite dark matter from a model with composite Higgs boson, Phys. Rev. D 78, 065040 (2008), arXiv:0806.1191 [astro-ph] .
- Kaplan et al. [2010] D. E. Kaplan, G. Z. Krnjaic, K. R. Rehermann, and C. M. Wells, Atomic Dark Matter, JCAP 2010 (05), 021, arXiv:0909.0753 [hep-ph] .
- Khlopov et al. [2010] M. Y. Khlopov, A. G. Mayorov, and E. Y. Soldatov, Composite Dark Matter and Puzzles of Dark Matter Searches, Int. J. Mod. Phys. D 19, 1385 (2010), arXiv:1003.1144 [astro-ph.CO] .
- Kaplan et al. [2011] D. E. Kaplan, G. Z. Krnjaic, K. R. Rehermann, and C. M. Wells, Dark Atoms: Asymmetry and Direct Detection, JCAP 2011 (10), 011, arXiv:1105.2073 [hep-ph] .
- Khlopov [2011] M. Y. Khlopov, Physics of Dark Matter in the Light of Dark Atoms, Mod. Phys. Lett. A 26, 2823 (2011), arXiv:1111.2838 [astro-ph.CO] .
- Behbahani et al. [2011] S. R. Behbahani, M. Jankowiak, T. Rube, and J. G. Wacker, Nearly Supersymmetric Dark Atoms, Adv. High Energy Phys. 2011, 709492 (2011), arXiv:1009.3523 [hep-ph] .
- Cline et al. [2012] J. M. Cline, Z. Liu, and W. Xue, Millicharged Atomic Dark Matter, Phys. Rev. D 85, 101302 (2012), arXiv:1201.4858 [hep-ph] .
- Cyr-Racine and Sigurdson [2013] F.-Y. Cyr-Racine and K. Sigurdson, Cosmology of atomic dark matter, Phys. Rev. D 87, 103515 (2013), arXiv:1209.5752 [astro-ph.CO] .
- Cline et al. [2014] J. M. Cline, Z. Liu, G. Moore, and W. Xue, Scattering properties of dark atoms and molecules, Phys. Rev. D 89, 043514 (2014), arXiv:1311.6468 [hep-ph] .
- Cyr-Racine et al. [2014] F.-Y. Cyr-Racine, R. de Putter, A. Raccanelli, and K. Sigurdson, Constraints on large-scale dark acoustic oscillations from cosmology, Phys. Rev. D 89, 063517 (2014), arXiv:1310.3278 [astro-ph.CO] .
- Fan et al. [2013a] J. J. Fan, A. Katz, L. Randall, and M. Reece, Dark-Disk Universe, Phys. Rev. Lett. 110, 211302 (2013a), arXiv:1303.3271 [hep-ph] .
- Fan et al. [2013b] J. Fan, A. Katz, L. Randall, and M. Reece, Double-Disk Dark Matter, Phys. Dark Univ. 2, 139 (2013b), arXiv:1303.1521 [astro-ph.CO] .
- McCullough and Randall [2013] M. McCullough and L. Randall, Exothermic Double-Disk Dark Matter, JCAP 2013 (10), 058, arXiv:1307.4095 [hep-ph] .
- Randall and Scholtz [2015] L. Randall and J. Scholtz, Dissipative Dark Matter and the Andromeda Plane of Satellites, JCAP 2015 (09), 057, arXiv:1412.1839 [astro-ph.GA] .
- Khlopov [2014] M. Y. Khlopov, Dark Atoms and Puzzles of Dark Matter Searches, Int. J. Mod. Phys. A 29, 1443002 (2014), arXiv:1402.0181 [hep-ph] .
- Pearce et al. [2015] L. Pearce, K. Petraki, and A. Kusenko, Signals from dark atom formation in halos, Phys. Rev. D 91, 083532 (2015), arXiv:1502.01755 [hep-ph] .
- Choquette and Cline [2015] J. Choquette and J. M. Cline, Minimal non-Abelian model of atomic dark matter, Phys. Rev. D 92, 115011 (2015), arXiv:1509.05764 [hep-ph] .
- Petraki et al. [2014] K. Petraki, L. Pearce, and A. Kusenko, Self-interacting asymmetric dark matter coupled to a light massive dark photon, JCAP 2014 (07), 039, arXiv:1403.1077 [hep-ph] .
- Cirelli et al. [2017] M. Cirelli, P. Panci, K. Petraki, F. Sala, and M. Taoso, Dark Matter’s secret liaisons: phenomenology of a dark U(1) sector with bound states, JCAP 2017 (05), 036, arXiv:1612.07295 [hep-ph] .
- Petraki et al. [2017] K. Petraki, M. Postma, and J. de Vries, Radiative bound-state-formation cross-sections for dark matter interacting via a Yukawa potential, JHEP 2017 (04), 077, arXiv:1611.01394 [hep-ph] .
- Curtin and Setford [2021] D. Curtin and J. Setford, Direct Detection of Atomic Dark Matter in White Dwarfs, JHEP 2021 (03), 166, arXiv:2010.00601 [hep-ph] .
- Peebles [1968] P. Peebles, Recombination of the Primeval Plasma, Astrophys. J. 153, 1 (1968).
- Schutz et al. [2018] K. Schutz, T. Lin, B. R. Safdi, and C.-L. Wu, Constraining a Thin Dark Matter Disk with Gaia, Phys. Rev. Lett. 121, 081101 (2018), arXiv:1711.03103 [astro-ph.GA] .
- Ghalsasi and McQuinn [2018] A. Ghalsasi and M. McQuinn, Exploring the astrophysics of dark atoms, Phys. Rev. D 97, 123018 (2018), arXiv:1712.04779 [astro-ph.GA] .
- Widmark et al. [2021] A. Widmark, C. F. P. Laporte, P. F. de Salas, and G. Monari, Weighing the Galactic disk using phase-space spirals - II. Most stringent constraints on a thin dark disk using Gaia EDR3, Astron. Astrophys. 653, A86 (2021), arXiv:2105.14030 [astro-ph.GA] .
- Roy et al. [2023] S. Roy, X. Shen, M. Lisanti, D. Curtin, N. Murray, and P. F. Hopkins, Simulating Atomic Dark Matter in Milky Way Analogues, Astrophys. J. Lett. 954, L40 (2023), arXiv:2304.09878 [astro-ph.GA] .
- Curtin and Setford [2020a] D. Curtin and J. Setford, How To Discover Mirror Stars, Phys. Lett. B 804, 135391 (2020a), arXiv:1909.04071 [hep-ph] .
- Curtin and Setford [2020b] D. Curtin and J. Setford, Signatures of Mirror Stars, JHEP 2020 (03), 041, arXiv:1909.04072 [hep-ph] .
- Shandera et al. [2018] S. Shandera, D. Jeong, and H. S. G. Gebhardt, Gravitational Waves from Binary Mergers of Subsolar Mass Dark Black Holes, Phys. Rev. Lett. 120, 241102 (2018), arXiv:1802.08206 [astro-ph.CO] .
- Singh et al. [2021] D. Singh, M. Ryan, R. Magee, T. Akhter, S. Shandera, D. Jeong, and C. Hanna, Gravitational-wave limit on the Chandrasekhar mass of dark matter, Phys. Rev. D 104, 044015 (2021), arXiv:2009.05209 [astro-ph.CO] .
- Ryan et al. [2022] M. Ryan, J. Gurian, S. Shandera, and D. Jeong, Molecular Chemistry for Dark Matter, Astrophys. J. 934, 120 (2022), arXiv:2106.13245 [astro-ph.CO] .
- Ryan and Radice [2022] M. Ryan and D. Radice, Exotic compact objects: The dark white dwarf, Phys. Rev. D 105, 115034 (2022), arXiv:2201.05626 [astro-ph.HE] .
- Gurian et al. [2022a] J. Gurian, D. Jeong, M. Ryan, and S. Shandera, Molecular Chemistry for Dark Matter II: Recombination, Molecule Formation, and Halo Mass Function in Atomic Dark Matter, Astrophys. J. 934, 121 (2022a), arXiv:2110.11964 [astro-ph.CO] .
- Gurian et al. [2022b] J. Gurian, M. Ryan, S. Schon, D. Jeong, and S. Shandera, A Lower Bound on the Mass of Compact Objects from Dissipative Dark Matter, Astrophys. J. Lett. 939, L12 (2022b), [Erratum: Astrophys. J. Lett.949, L44 (2023)], arXiv:2209.00064 [astro-ph.CO] .
- Fernandez et al. [2022] N. Fernandez, A. Ghalsasi, S. Profumo, N. Smyth, and L. Santos-Olmsted, Dark Black Holes in the Mass Gap (2022), arXiv:2208.08557 [hep-ph] .
- Di Valentino et al. [2021a] E. Di Valentino, O. Mena, S. Pan, L. Visinelli, W. Yang, A. Melchiorri, D. F. Mota, A. G. Riess, and J. Silk, In the Realm of the Hubble tension a Review of Solutions, Classical and Quantum Gravity 38, 153001 (2021a), arXiv:2103.01183 [astro-ph.CO] .
- Di Valentino et al. [2021b] E. Di Valentino et al., Cosmology intertwined III: and , Astroparticle Physics 131, 102604 (2021b), arXiv:2008.11285 [astro-ph.CO] .
- Aghanim et al. [2020a] N. Aghanim et al. (Planck Collaboration), Planck 2018 results. V. CMB power spectra and likelihoods, A&A 641, A5 (2020a), arXiv:1907.12875 [astro-ph.CO] .
- Heymans et al. [2021] C. Heymans, T. Tröster, M. Asgari, C. Blake, H. Hildebrandt, B. Joachimi, K. Kuijken, C.-A. Lin, A. G. Sánchez, J. L. van den Busch, et al., KiDS-1000 Cosmology: Multi-probe weak gravitational lensing and spectroscopic galaxy clustering constraints, A&A 646, A140 (2021), arXiv:2007.15632 [astro-ph.CO] .
- Hikage et al. [2019] C. Hikage et al. (HSC), Cosmology from cosmic shear power spectra with Subaru Hyper Suprime-Cam first-year data, Publ. Astron. Soc. Jap. 71, 43 (2019), arXiv:1809.09148 [astro-ph.CO] .
- Hang et al. [2021] Q. Hang, S. Alam, J. A. Peacock, and Y.-C. Cai, Galaxy clustering in the DESI Legacy Survey and its imprint on the CMB, MNRAS 501, 1481 (2021), arXiv:2010.00466 [astro-ph.CO] .
- García-García et al. [2021] C. García-García, J. R. Zapatero, D. Alonso, E. Bellini, P. G. Ferreira, E.-M. Mueller, A. Nicola, and P. Ruiz-Lapuente, The growth of density perturbations in the last 10 billion years from tomographic large-scale structure data, JCAP 2021 (10), 030, arXiv:2105.12108 [astro-ph.CO] .
- Abbott et al. [2022] T. M. C. Abbott et al. (DES Collaboration), Dark Energy Survey Year 3 results: Cosmological constraints from galaxy clustering and weak lensing, Phys. Rev. D 105, 023520 (2022), arXiv:2105.13549 [astro-ph.CO] .
- White et al. [2022] M. White, R. Zhou, J. DeRose, S. Ferraro, S.-F. Chen, N. Kokron, et al., Cosmological constraints from the tomographic cross-correlation of DESI Luminous Red Galaxies and Planck CMB lensing, JCAP 2022 (02), 007, arXiv:2111.09898 [astro-ph.CO] .
- Chang et al. [2023] C. Chang et al. (DES & SPT Collaborations), Joint analysis of Dark Energy Survey Year 3 data and CMB lensing from SPT and Planck. II. Cross-correlation measurements and cosmological constraints, Phys. Rev. D 107, 023530 (2023), arXiv:2203.12440 [astro-ph.CO] .
- Bansal et al. [2022] S. Bansal, J. H. Kim, C. Kolda, M. Low, and Y. Tsai, Mirror twin Higgs cosmology: constraints and a possible resolution to the and tensions, JHEP 2022 (05), 050, arXiv:2110.04317 [hep-ph] .
- Bansal et al. [2023] S. Bansal, J. Barron, D. Curtin, and Y. Tsai, Precision Cosmological Constraints on Atomic Dark Matter, JHEP 2023 (10), 95, arXiv:2212.02487 [hep-ph] .
- Silk [1968] J. Silk, Cosmic black body radiation and galaxy formation, Astrophys. J. 151, 459 (1968).
- Buen-Abad et al. [2015] M. A. Buen-Abad, G. Marques-Tavares, and M. Schmaltz, Non-Abelian dark matter and dark radiation, Phys. Rev. D 92, 023531 (2015), arXiv:1505.03542 [hep-ph] .
- Chacko et al. [2016] Z. Chacko, Y. Cui, S. Hong, T. Okui, and Y. Tsai, Partially Acoustic Dark Matter, Interacting Dark Radiation, and Large Scale Structure, JHEP 2016 (12), 108, arXiv:1609.03569 [astro-ph.CO] .
- Buen-Abad et al. [2018] M. A. Buen-Abad, M. Schmaltz, J. Lesgourgues, and T. Brinckmann, Interacting Dark Sector and Precision Cosmology, JCAP 2018 (01), 008, arXiv:1708.09406 [astro-ph.CO] .
- Joseph et al. [2023] M. Joseph, D. Aloni, M. Schmaltz, E. N. Sivarajan, and N. Weiner, A Step in Understanding the Tension, Phys. Rev. D 108, 023520 (2023), arXiv:2207.03500 [astro-ph.CO] .
- Buen-Abad et al. [2023a] M. A. Buen-Abad, Z. Chacko, C. Kilic, G. Marques-Tavares, and T. Youn, Stepped Partially Acoustic Dark Matter, Large Scale Structure, and the Hubble Tension, JHEP 2023 (06), 012, arXiv:2208.05984 [hep-ph] .
- Rubira et al. [2023] H. Rubira, A. Mazoun, and M. Garny, Full-shape BOSS constraints on dark matter interacting with dark radiation and lifting the tension, JCAP 2023 (01), 034, arXiv:2209.03974 [astro-ph.CO] .
- Buen-Abad et al. [2023b] M. A. Buen-Abad, Z. Chacko, C. Kilic, G. Marques-Tavares, and T. Youn, Stepped Partially Acoustic Dark Matter: Likelihood Analysis and Cosmological Tensions (2023b), arXiv:2306.01844 [astro-ph.CO] .
- Aloni et al. [2022] D. Aloni, A. Berlin, M. Joseph, M. Schmaltz, and N. Weiner, A Step in understanding the Hubble tension, Phys. Rev. D 105, 123516 (2022), arXiv:2111.00014 [astro-ph.CO] .
- Gariazzo and Mena [2023] S. Gariazzo and O. Mena, On the dark radiation role in the Hubble constant tension (2023), arXiv:2306.15067 [astro-ph.CO] .
- Schöneberg et al. [2023] N. Schöneberg, G. F. Abellán, T. Simon, A. Bartlett, Y. Patel, and T. L. Smith, The weak, the strong and the ugly–a comparative analysis of interacting stepped dark radiation (2023), arXiv:2306.12469 [astro-ph.CO] .
- Ge et al. [2023] F. Ge, F.-Y. Cyr-Racine, and L. Knox, Scaling transformations and the origins of light relics constraints from cosmic microwave background observations, Phys. Rev. D 107, 023517 (2023), arXiv:2210.16335 [astro-ph.CO] .
- Cyr-Racine et al. [2022] F.-Y. Cyr-Racine, F. Ge, and L. Knox, Symmetry of Cosmological Observables, a Mirror World Dark Sector, and the Hubble Constant, Phys. Rev. Lett. 128, 201301 (2022), arXiv:2107.13000 [astro-ph.CO] .
- Aghanim et al. [2020b] N. Aghanim et al. (Planck Collaboration), Planck 2018 results. VI. Cosmological parameters, A&A 641, A6 (2020b), arXiv:1807.06209 [astro-ph.CO] .
- Kolb and Turner [1990] E. W. Kolb and M. S. Turner, The Early Universe, Vol. 69 (CRC Press, 1990).
- Fixsen [2009] D. J. Fixsen, The Temperature of the Cosmic Microwave Background, Astrophys. J. 707, 916 (2009), arXiv:0911.1955 [astro-ph.CO] .
- Lewis and Challinor [2006] A. Lewis and A. Challinor, Weak gravitational lensing of the CMB, Phys. Rept. 429, 1 (2006), arXiv:astro-ph/0601594 .
- Beutler et al. [2011] F. Beutler, C. Blake, M. Colless, D. H. Jones, L. Staveley-Smith, L. Campbell, Q. Parker, W. Saunders, and F. Watson, The 6dF Galaxy Survey: baryon acoustic oscillations and the local Hubble constant, MNRAS 416, 3017 (2011), arXiv:1106.3366 [astro-ph.CO] .
- Ross et al. [2015] A. J. Ross, L. Samushia, C. Howlett, W. J. Percival, A. Burden, and M. Manera, The clustering of the SDSS DR7 main Galaxy sample – I. A 4 per cent distance measure at = 0.15, MNRAS 449, 835 (2015), arXiv:1409.3242 [astro-ph.CO] .
- Alam et al. [2017] S. Alam et al., The clustering of galaxies in the completed SDSS-III Baryon Oscillation Spectroscopic Survey: cosmological analysis of the DR12 galaxy sample, MNRAS 470, 2617 (2017), arXiv:1607.03155 [astro-ph.CO] .
- Riess et al. [2022] A. G. Riess, W. Yuan, L. M. Macri, D. Scolnic, D. Brout, S. Casertano, D. O. Jones, Y. Murakami, et al., A Comprehensive Measurement of the Local Value of the Hubble Constant with 1 km s-1 Mpc-1 Uncertainty from the Hubble Space Telescope and the SH0ES Team, Astrophys. J. Lett. 934, L7 (2022), arXiv:2112.04510 [astro-ph.CO] .
- Bennett et al. [2021] J. J. Bennett, G. Buldgen, P. F. De Salas, M. Drewes, S. Gariazzo, S. Pastor, and Y. Y. Y. Wong, Towards a precision calculation of in the Standard Model II: Neutrino decoupling in the presence of flavour oscillations and finite-temperature QED, JCAP 2021 (04), 073, arXiv:2012.02726 [hep-ph] .
- Lewis et al. [2000] A. Lewis, A. Challinor, and A. Lasenby, Efficient Computation of Cosmic Microwave Background Anisotropies in Closed Friedmann‐Robertson‐Walker Models, Astrophys. J. 538, 473 (2000), arXiv:astro-ph/9911177 .
- Lewis and Bridle [2002] A. Lewis and S. Bridle, Cosmological parameters from CMB and other data: A Monte Carlo approach, Phys. Rev. D 66, 103511 (2002), arXiv:astro-ph/0205436 .
- Aver et al. [2021] E. Aver, D. A. Berg, K. A. Olive, R. W. Pogge, J. J. Salzer, and E. D. Skillman, Improving helium abundance determinations with Leo P as a case study, JCAP 2021 (03), 027, arXiv:2010.04180 [astro-ph.CO] .
- Izotov et al. [2014] Y. I. Izotov, T. X. Thuan, and N. G. Guseva, A new determination of the primordial He abundance using the He I 10830 Å emission line: cosmological implications, MNRAS 445, 778 (2014), arXiv:1408.6953 [astro-ph.CO] .
- Aver et al. [2015] E. Aver, K. A. Olive, and E. D. Skillman, The effects of He I 10830 on helium abundance determinations, JCAP 2015 (07), 011, arXiv:1503.08146 [astro-ph.CO] .
- Fernández et al. [2018] V. Fernández, E. Terlevich, A. I. Díaz, R. Terlevich, and F. F. Rosales-Ortega, Primordial helium abundance determination using sulphur as metallicity tracer, MNRAS 478, 5301 (2018), arXiv:1804.10701 [astro-ph.GA] .
- Hsyu et al. [2020] T. Hsyu, R. J. Cooke, J. X. Prochaska, and M. Bolte, The PHLEK Survey: A New Determination of the Primordial Helium Abundance, Astrophys. J. 896, 77 (2020), arXiv:2005.12290 [astro-ph.GA] .
- Greene and Cyr-Racine [2023] K. Greene and F.-Y. Cyr-Racine, Thomson scattering: One rate to rule them all, JCAP 2023 (10), 065, arXiv:2306.06165 [astro-ph.CO] .
- Meiers et al. [2023] M. Meiers, L. Knox, and N. Schöneberg, Exploration of the Pre-recombination Universe with a High-Dimensional Model of an Additional Dark Fluid (2023), arXiv:2307.09522 [astro-ph.CO] .
- Ade et al. [2014a] P. A. R. Ade et al. (Planck Collaboration), Planck 2013 results. XX. Cosmology from Sunyaev–Zeldovich cluster counts, A&A 571, A20 (2014a), arXiv:1303.5080 [astro-ph.CO] .
- Ade et al. [2016] P. A. R. Ade et al. (Planck Collaboration), Planck 2015 results: XXIV. Cosmology from Sunyaev-Zeldovich cluster counts, A&A 594, A24 (2016), arXiv:1502.01597 [astro-ph.CO] .
- Murakami et al. [2023] Y. S. Murakami, A. G. Riess, B. E. Stahl, W. D. Kenworthy, D.-M. A. Pluck, A. Macoretta, D. Brout, D. O. Jones, D. M. Scolnic, and A. V. Filippenko, Leveraging SN Ia spectroscopic similarity to improve the measurement of (2023), arXiv:2306.00070 [astro-ph.CO] .
- Akrami et al. [2020] Y. Akrami et al. (Planck Collaboration), Planck intermediate results: LVII. Joint Planck LFI and HFI data processing, A&A 643, A42 (2020), arXiv:2007.04997 [astro-ph.CO] .
- Bianchini et al. [2020] F. Bianchini, W. L. K. Wu, et al., Constraints on Cosmological Parameters from the 500 deg2 SPTPOL Lensing Power Spectrum, Astrophys. J. 888, 119 (2020), arXiv:1910.07157 [astro-ph.CO] .
- Qu et al. [2023] F. J. Qu, B. D. Sherwin, M. S. Madhavacheril, D. Han, K. T. Crowley, et al., The Atacama Cosmology Telescope: A Measurement of the DR6 CMB Lensing Power Spectrum and its Implications for Structure Growth (2023), arXiv:2304.05202 [astro-ph.CO] .
- Madhavacheril et al. [2023] M. S. Madhavacheril, F. J. Qu, B. D. Sherwin, N. MacCrann, Y. Li, et al., The Atacama Cosmology Telescope: DR6 Gravitational Lensing Map and Cosmological Parameters (2023), arXiv:2304.05203 [astro-ph.CO] .
- Amon and Efstathiou [2022] A. Amon and G. Efstathiou, A non-linear solution to the tension?, MNRAS 516, 5355 (2022), arXiv:2206.11794 [astro-ph.CO] .
- Preston et al. [2023] C. Preston, A. Amon, and G. Efstathiou, A non-linear solution to the tension II: Analysis of DES Year 3 cosmic shear, MNRAS 525, 5554 (2023), arXiv:2305.09827 [astro-ph.CO] .
- Abazajian et al. [2016] K. N. Abazajian, P. Adshead, Z. Ahmed, et al., CMB-S4 Science Book, First Edition (2016), arXiv:1610.02743 [astro-ph.CO] .
- Decadal Survey on Astronomy and Astrophysics 2020 et al.(2021)Decadal Survey on Astronomy and Astrophysics 2020 (Astro2020), Space Studies Board, Board on Physics and Astronomy, Division on Engineering and Physical Sciences, and National Academies of Sciences, Engineering, and Medicine [Astro2020] Decadal Survey on Astronomy and Astrophysics 2020 (Astro2020), Space Studies Board, Board on Physics and Astronomy, Division on Engineering and Physical Sciences, and National Academies of Sciences, Engineering, and Medicine, Pathways to Discovery in Astronomy and Astrophysics for the 2020s (National Academies Press, Washington, D.C., 2021).
- Sobrin et al. [2022] J. A. Sobrin et al., The Design and Integrated Performance of SPT-3G, Astrophys. J. Supplement Series 258, 42 (2022), arXiv:2106.11202 [astro-ph.IM] .
- Ade et al. [2019] P. Ade et al. (The Simons Observatory Collaboration), The Simons Observatory: science goals and forecasts, JCAP 2019 (02), 056, arXiv:1808.07445 [astro-ph.CO] .
- Abazajian et al. [2022] K. Abazajian et al. (The CMB-S4 Collaboration), Snowmass 2021 CMB-S4 White Paper (2022), arXiv:2203.08024 [astro-ph.CO] .
- Raghunathan [2022] S. Raghunathan, Assessing the Importance of Noise from Thermal Sunyaev-Zel’dovich Signals for CMB Cluster Surveys and Cluster Cosmology, Astrophys. J. 928, 16 (2022), arXiv:2112.07656 [astro-ph.CO] .
- Reichardt et al. [2021] C. L. Reichardt, S. Patil, et al., An Improved Measurement of the Secondary Cosmic Microwave Background Anisotropies from the SPT-SZ + SPTpol Surveys, Astrophys. J. 908, 199 (2021), arXiv:2002.06197 [astro-ph.CO] .
- Raghunathan and Omori [2023] S. Raghunathan and Y. Omori, A Cross-internal Linear Combination Approach to Probe the Secondary CMB Anisotropies: Kinematic Sunyaev-Zel’dovich Effect and CMB Lensing, Astrophys. J. 954, 83 (2023), arXiv:2304.09166 [astro-ph.CO] .
- Datta et al. [2018] R. Datta, S. Aiola, S. K. Choi, M. Devlin, J. Dunkley, R. Dünner, P. A. Gallardo, M. Gralla, M. Halpern, M. Hasselfield, et al., The Atacama Cosmology Telescope: Two-season ACTPol Extragalactic Point Sources and their Polarization properties, MNRAS 486, 5239 (2018), arXiv:1811.01854 [astro-ph.CO] .
- Gupta et al. [2019] N. Gupta, C. L. Reichardt, et al., Fractional Polarisation of Extragalactic Sources in the 500 deg2 SPTpol Survey, MNRAS 490, 5712 (2019), arXiv:1907.02156 [astro-ph.CO] .
- Thorne et al. [2017] B. Thorne, J. Dunkley, D. Alonso, and S. Næss, The Python Sky Model: software for simulating the Galactic microwave sky, MNRAS 469, 2821 (2017), arXiv:1608.02841 [astro-ph.CO] .
- Cardoso et al. [2008] J.-F. Cardoso, M. Le Jeune, J. Delabrouille, M. Betoule, and G. Patanchon, Component Separation With Flexible Models—Application to Multichannel Astrophysical Observations, IEEE Journal of Selected Topics in Signal Processing 2, 735 (2008), arXiv:0803.1814 [astro-ph] .
- Ade et al. [2014b] P. Ade et al. (Planck Collaboration), Planck 2013 results. XII. Diffuse component separation, A&A 571, A12 (2014b), arXiv:1303.5072 [astro-ph.CO] .
- Hu and Okamoto [2002] W. Hu and T. Okamoto, Mass Reconstruction with Cosmic Microwave Background Polarization, Astrophys. J. 574, 566 (2002), arXiv:astro-ph/0111606 .
- Okamoto and Hu [2003] T. Okamoto and W. Hu, Cosmic microwave background lensing reconstruction on the full sky, Phys. Rev. D 67, 083002 (2003), arXiv:astro-ph/0301031 .
- Hotinli et al. [2022] S. C. Hotinli, J. Meyers, C. Trendafilova, D. Green, and A. van Engelen, The benefits of CMB delensing, JCAP 2022 (04), 020, arXiv:2111.15036 [astro-ph.CO] .
- Abazajian et al. [2019] K. Abazajian et al. (CMB-S4 Collaboration), CMB-S4 Science Case, Reference Design, and Project Plan (2019), arXiv:1907.04473 [astro-ph.IM] .
- Delabrouille et al. [2013] J. Delabrouille, M. Betoule, J. B. Melin, M. A. Miville-Deschênes, J. Gonzalez-Nuevo, M. Le Jeune, G. Castex, G. de Zotti, S. Basak, et al., The pre-launch Planck Sky Model: a model of sky emission at submillimetre to centimetre wavelengths, A&A 553, A96 (2013), arXiv:1207.3675 [astro-ph.CO] .
- Adshead et al. [2016] P. Adshead, Y. Cui, and J. Shelton, Chilly Dark Sectors and Asymmetric Reheating, JHEP 2016 (06), 016, arXiv:1604.02458 [hep-ph] .
- Aloni et al. [2023] D. Aloni, M. Joseph, M. Schmaltz, and N. Weiner, Dark Radiation from Neutrino Mixing after Big Bang Nucleosynthesis (2023), arXiv:2301.10792 [astro-ph.CO] .