‘
Investigating the cause of crossover from charge/spin stripe insulator to correlated metallic phase in layered T’ nickelates - R4Ni3O8
Abstract
The T’ infinite layered nickelates have recently garnered significant attention owing to the discovery of superconductivity in hole-doped RNiO2 (R La, Pr, or Nd), which is the member of the series Rn+1NinO2n+2. Here, we investigate the member, namely R4Ni3O8 R = La, Pr, or Nd) of this family. The compound La4Ni3O8 exhibits simultaneous charge/spin-stripe ordering at = 105 K, which is also concomitant with the onset of metal-to-insulator (MIT) transition upon lowering the temperature below . We investigate the conspicuous absence of this transition in the Pr and Nd analogues of La4Ni3O8. To achieve this purpose, we synthesized solid-solutions of the form (La, Pr)4Ni3O8 and (La, Nd)4Ni3O8 and examined the behavior of as a function of the average R-site ionic radius (). We show that after an initial quasilinear decrease with decreasing , suddenly vanishes in the narrow range . In the same range, we observed the emergence of a new transition below , whose onset temperature increases as further decreases. We, therefore, argue that the sudden vanishing of charge/spin-stripe/MIT ordering upon decreasing is due to the appearance of a new competing phase. The point , where vanishes and appears—a quantum critical point—should be investigated further. In this regard, Pr4Ni3O8 and Pr-rich samples should be useful due to the weak magnetization response associated with the Pr-sublattice, as shown here.
I Introduction
With the discovery of high-temperature superconductivity in cuprates by Bednorz and Müller [1] in 1986, enormous efforts are underway to find superconductivity in other transition metal based oxide systems. In this regard, the most obvious place to look for is the nickel-based transition metal oxides or nickelates, isostructural and isoelectronic to the high Tc cuprates. Almost three decades ago, Anisimov et al. [2] theoretically predicted that if Ni1+ (S 1/2) is forced into square-planar coordination, an antiferromagnetic and insulating ground state should result, which can be further hole-doped to realize superconductivity in analogy with the high Tc cuprates. The recent discovery of superconductivity in the thin films of hole doped NdNiO2 [3], LaNiO2 [4, 5] and PrNiO2 [6, 7] reinvigorated the study of nickelates. The compounds RNiO2 are the n members of a much broader infinite-layer nickelate family with the general formula of Rn+1NinO2n+2, where R is either an alkaline earth or a rare-earth ion and can take values 1, 2, 3,….,). These infinite-layer nickelates can be variously located on the cuprate phase diagram depending on the Ni d electron count, which makes them useful in realizing the different types of phases or ground states previously reported for the cuprates [8, 9]. The validity of this phenomenology is only further reinforced with the discovery of superconductivity in thin films of “quintuple - layer” compound Nd6Ni5O12 (n 5) [10], which falls in the optimally doped region of the cuprate phase diagram [11].
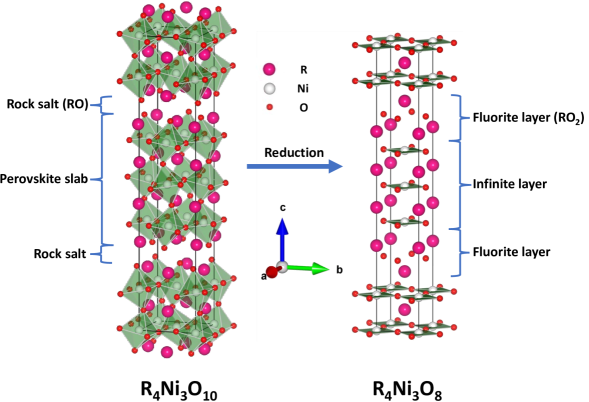
In this work, we focus our attention on the n 3 member of the infinite layer nickelate family i.e., R4Ni3O8 (where R La, Pr and Nd). They crystallize in the tetragonal space group (No. 139) with three infinite NiO2 planar layers separated by an intervening fluorite layer (RO2) as shown in Fig. 1 (right panel). The R4Ni3O8 compounds are mixed-valent, containing Ni1+/Ni2+ in the ratio of 2:1 which resemble the 3d9/3d8 electronic configuration of Cu2+/Cu3+ present in high Tc cuprates. The average Ni valence in R4Ni3O8 is +1.33 i.e., a d filling value of 8.67, which essentially lies in the overdoped, Fermi liquid regime of the cuprate phase diagram [12]. This, and their similarities with cuprates, including a large orbital polarization of the unoccupied eg states [9], strong Ni 3 and O 2 hybridization [13], and the square-planar arrangement of Ni are reasons enough to investigate their physical properties at low temperatures.
La4Ni3O8, Pr4Ni3O8 and Nd4Ni3O8 exhibit contrasting ground state properties despite belonging to the same crystallographic space group. While La4Ni3O8 is a charge/spin (CS) stripe-ordered insulator which features a sharp semiconductor-to-insulator transition (henceforth, we shall loosely refer to it as a metal-to-insulator or MIT transition) concomitant with onset of charge/spin-stripe ordering below at temperature 105 K, which we shall designate as in the rest of the manuscript [14, 15, 16, 17, 18], Pr4Ni3O8 and Nd4Ni3O8 are reported to show a metallic behavior over the whole temperature range with no indications of charge-stripe or spin ordering [12, 19, 20, 10]Understanding these stark differences in the ground state properties as a function of R-site ionic radius, and a careful analysis of the magnetic properties of the R-sublattice in Pr and Nd analogues, which has not been not well explored in the past, are important. However, these compounds require a part of Ni to be in an unfavourable oxidation state of , which makes their formation in pure phase somewhat challenging, hence limiting a detailed investigation of their physical properties.
In this study, we investigate the ground state of La4Ni3O8, Pr4Ni3O8 and Nd4Ni3O8 . At the same time, to understand the role of R-site ionic radius on the concomitant CS stripe ordering in La4Ni3O8, we investigate solid-solutions of the form (La1-xRx)4Ni3O8 (R Pr, Nd) in well-characterized samples. A phase diagram showing the evolution of with average R-site ionic radius, , has been constructed by combining data from the (La1-xPrx)4Ni3O8 and (La1-xNdx)4Ni3O8 series for various . We show that decreases nearly linearly upon decreasing at first, and this trend continues down to about after which drops sharply to zero. We show that at the critical average R-site ionic radius () where goes to zero, a new transition emerges, denoted as T∗, which shows an almost linearly increasing trend with decreasing in the region . We, therefore, associate the sudden disappearance of charge/spin-stripe order upon dilution at the La-site with Pr or Nd, with the emergence of a new competing phase as decreases below a certain critical . The rest of the paper is organized as follows: The details of the experimental methods are given in Sec. II, followed by results and discussion in Sec.III. The details of sample synthesis, crystal structure and low-temperature synchrotron x-ray diffraction appear in Sec. III.1. The electrical transport, magnetic susceptibility and specific heat data are discussed in Sec. III.3. The summary and conclusions drawn are presented under Sec. IV.
II Experimental Methods
High purity polycrystalline samples of the n 3 member of the parent Ruddlesden Popper (RP) phases i.e., (La1-xRx)4Ni3O10 (R Pr, Nd; x 0, 0.1, 0.5, 0.75, 0.9 and 1.0) were prepared using the citrate method as described in [21]. The phase purity of these samples was confirmed using a Bruker D8 Advance powder X-ray diffractometer (PXRD). After this, the corresponding trilayer T’ nickelates were obtained by either the topotactic reduction using CaH2 or reduction under a stream of H2 gas (for La4Ni3O8) or Ar/H2 mixture (for Pr, Nd mixed samples). The chemical composition of the samples was analyzed using the energy-dispersive X-ray analysis (EDX) technique in a Zeiss Ultra Plus scanning electron microscope. To confirm the oxygen stoichiometry of our samples, we carried out the complete decomposition of the formed samples under Ar-H2 atmosphere, employing a heating rate of 10 K min-1 in a high-resolution TGA setup (Netzsch STA F1).
High-resolution synchrotron powder X-ray diffraction experiments were carried out at the MSPD-BLO4 beamline of the ALBA synchrotron center, Barcelona, Spain. The samples were prepared in the form of finely ground powders that were placed in a borosilicate capillary tube of mm inner diameter. For cooling the sample down to 90 K, an Oxford Cryostream series nitrogen blower was used while for attaining temperatures lower than 90 K, He exchange gas was used. The diffractograms were collected in the range with a step size of . The incident beam energy was set at keV ( Å) and a high-resolution detector (MAD) was used to resolve any subtle structural modifications. On the other hand, the low temperature lab-based PXRD measurements were performed on Malvern Panalytical Empyrean Series 3 X-ray diffractometer with Oxford Cryosystems PheniX closed-cycle helium cryostat, which can attain a lowest possible temperature of 12 K. The structural refinement was done by the Rietveld method using the FULLPROF suite [22].
Heat capacity, magnetization and resistivity measurements were carried out using the Physical Property Measurement System (PPMS), Quantum Design USA. The heat capacity of the sample holder and APIEZON N grease (addenda) was determined prior to the measurements. The magnetization measurements were carried out in the zero-field cooled (ZFC) mode at an applied field of kOe. Isothermal magnetization was carried out at a temperature of 5 K up to an applied field of 90 kOe. Resistivity measurements were carried out on rectangular bar samples of known dimensions using the standard four-probe technique.
High-resolution transmission electron microscopy (HRTEM) was carried out using a JEOL JEM 2200FS 200keV TEM instrument. The powder samples were finely ground in high-purity ethanol using an agate mortar and pestle to reduce the formation of agglomerates. Thereafter, less than a few mg of the ground powder was dispersed in an ethanol solution and was subjected to sonication for a period of 30 min. A few droplets of the resultant suspension were drop-casted onto a TEM Cu-grid using a micropipette. The Cu grid was then dried for 12 h in an evacuated desiccator, preheated at 60∘C in an oven for 15 min, and eventually loaded into the TEM sample chamber. Both HRTEM and SAED (Selected Area Electron Diffraction) patterns were collected for all the samples and the analysis of the images was carried out using DigitalMicrograph (GMS -3) software package.
III Results and Discussion
III.1 Sample synthesis
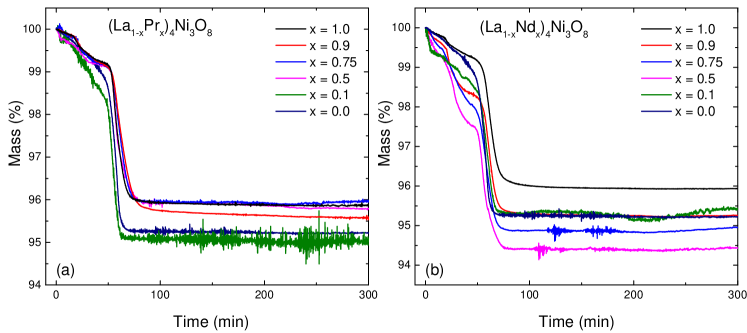
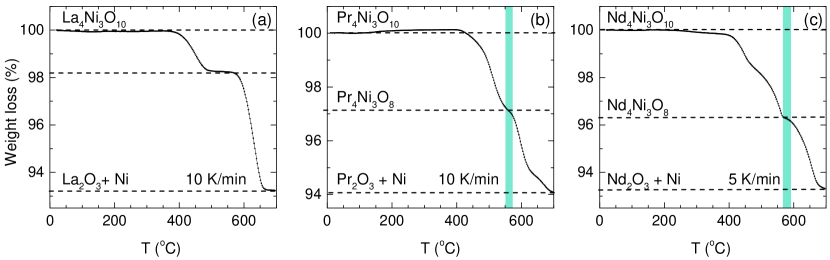
As is mentioned in the experimental section, the R4Ni3O8 samples were prepared by reducing the parent RP phases. To obtain optimal conditions for the reduction, the parent RP phases were first decomposed completely in a TGA setup under Ar-H2 (10%) atmosphere as shown in Fig. 2. From these TGA plots, we conclude that (Pr/Nd)4Ni3O8 samples and the (La1-xRx)4Ni3O8 samples for , can be obtained by heating at the sample at 360∘C for a duration ranging from 19 h to 22 h. Moreover, this reaction time could be further reduced by increasing the isotherm temperature to 500∘C for 1.3 h for Pr4Ni3O8 and 470∘C for 5 h for Nd4Ni3O8, respectively. However, for the reductions at these higher temperatures, the gas flow had to be changed from Ar - H2 (10%) to pure Ar, immediately at the end of the isotherm via a T-connector.
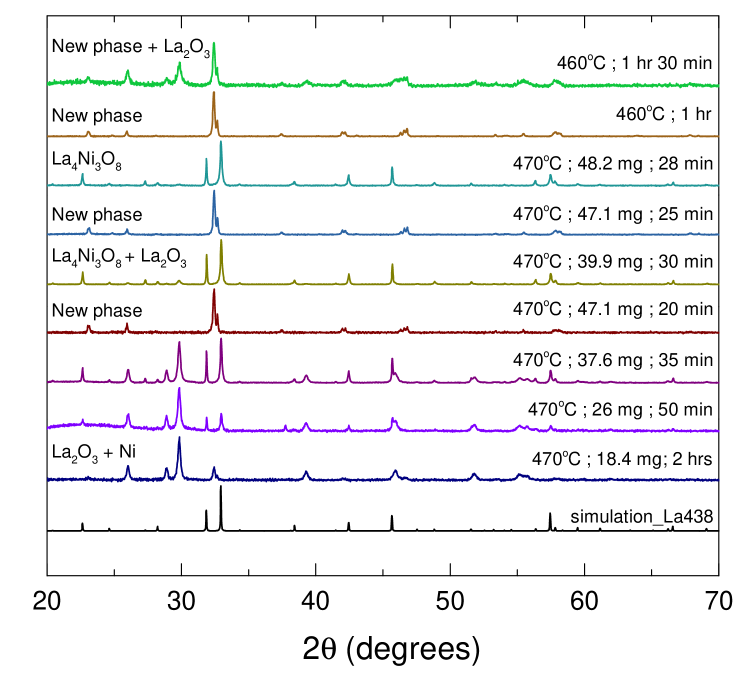
On the other hand, as is evident from the TGA data in Fig. 2(a), La4Ni3O8 could not be obtained under Ar-H2 (10%) atmosphere as the step expected near 3% weight loss is missing from the plot. On the contrary, the step is present near 2% weight loss, which signals the appearance of a new phase. This is also in accordance with the TGA data by Laccore et al. [23]. The synthesis of La4Ni3O8 was therefore optimized under ultra-high purity grade (UHP) H2 gas. An isotherm temperature of 470∘C for 28 min and sample mass ranging from 40-50 mg are found to be ideal conditions for obtaining pure La4Ni3O8 phase. A slight increment in the isotherm duration resulted in the decomposition of the sample to La2O3 and Ni metal. Interestingly, we also captured a new phase for the same sample mass and isotherm temperature but with the isotherm duration in the range of 20-25 min (see Fig. S2 in the Supplementary Materials). This new phase either corresponds to the La4Ni3O9 phase previously alluded to by Laccore et al. [23], or it could be related to the T† phase of La4Ni3O8 reported by Cheng et al. [16]. Further detailed structural characterization experiments are needed to ascertain the exact crystal symmetry of this new phase. Alternatively, we also synthesized the La4Ni3O8 compound, and 10% (Pr/Nd) doped La4Ni3O8 samples, using the method of topotactic reduction employing CaH2 as a reducing agent. In this case, a sintered rectangular bar of the parent RP phase was covered in an optimized amount of CaH2 powder in a quartz ampoule in an argon-filled glove box. The quartz ampoule was then flame-sealed under vacuum (10-5 Torr) and subjected to an isotherm temperature of 360∘C for a period of 36 h.
III.2 Structural Characterization
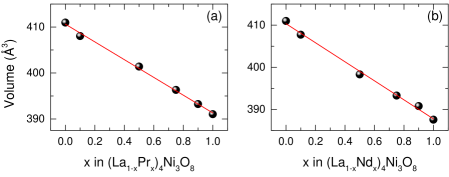
The room temperature crystal structure of R4Ni3O8 (R La, Pr and Nd) is shown in Fig. 1 (right panel). The variation of unit cell volume with Pr or Nd doping for the (La1-xPrx)4Ni3O8 and (La1-xNdx)4Ni3O8 samples is shown in Fig. 3(a) and Fig. 3(b), respectively. In both cases, a monotonic decrement of the unit cell volume with increasing is observed, confirming the successful doping at the La-site. During the reduction from R4Ni3O10 to R4Ni3O8, the apical oxygen atoms are removed from the NiO6 octahedra present in the perovskite slab in R4Ni3O8. Thus, the octahedral arrangement around the Ni atoms in the parent RP phase changes to a square-planar arrangement in the T’ phase, transforming the perovskite trilayer block into an infinite-trilayer block comprising a stack of three infinite or planar NiO2 layers. Henceforth, we shall refer to this block as a planar-trilayer or infinite-trilayer or quite simply as a trilayer-block when there is no ambiguity. Similarly, the original rock salt layer in the RP structure transforms into a fluorite-type RO2 layer upon reduction. This fluorite RO2 layer acts as a buffer between any two successive trilayer blocks. The T’ structure has two distinct rare-earth sites denoted by R1 and R2, where R1 lies in the trilayer block and R2 faces the fluorite layer on one side and the trilayer block on the other. Likewise, there are two distinct crystallographic sites for the Ni atoms denoted by Ni1 and Ni2, where Ni1 lies within the trilayer block, and Ni2 is sandwiched between the fluorite and trilayer blocks.
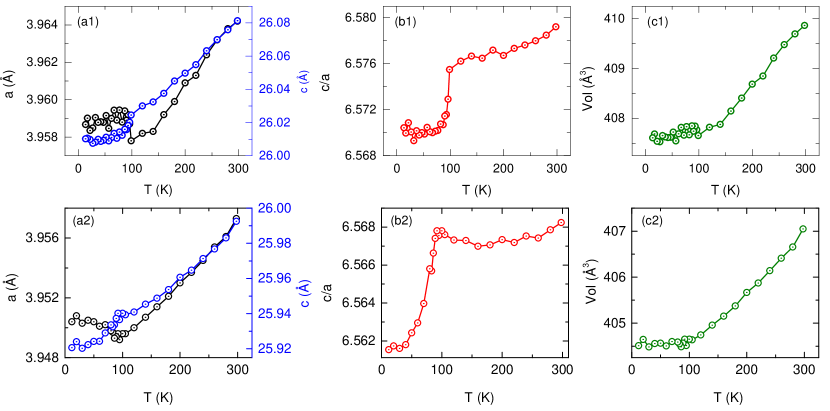
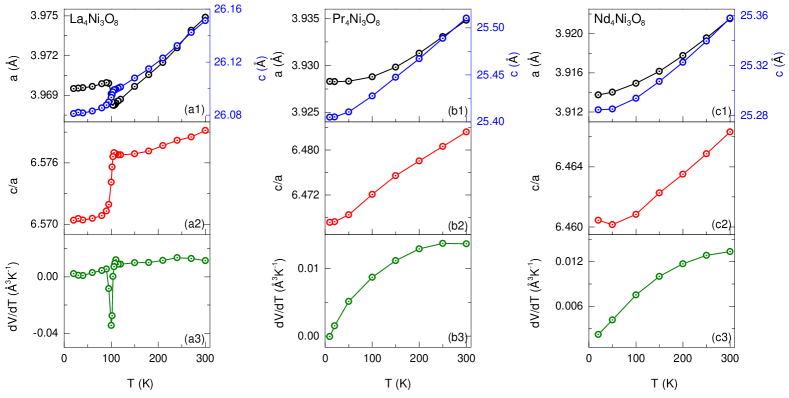
Fig. 4 shows the temperature variation of lattice parameters of the parent R4Ni3O8 (R La, Pr and Nd) samples down to 10 K. The temperature variation of the lattice parameters and of La4Ni3O8 is shown in Fig. 4(a1). The corresponding plots showing the temperature variations of and , where is the unit cell volume, are shown Fig. 4(a2) and Fig. 4(a3), respectively. The lattice parameters exhibit a clear anomaly at T 105 K, which coincides with the temperature where the MIT or CS-stripe order is expected to set in on the basis of previous studies. Below , the parameter shows an anomalous increase with decreasing temperature; the parameter on the other hand shows a step-like decrease; and accordingly, the ratio presents a sharp, step-like decrease at . These variations are in agreement with previous reports [16, 9]. Contrary to La4Ni3O8, the lattice parameters in Pr4Ni3O8, Figs. 4(b), and Nd4Ni3O8, Fig. 4(c), show a smooth and monotonic decrease upon cooling down to the lowest measured temperature of 10 K.
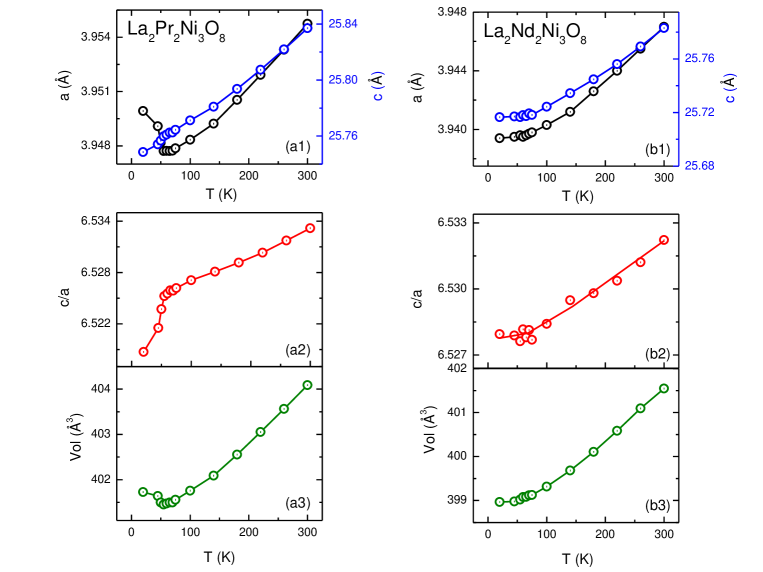
Coming now the temperature variation of lattice parameters of the doped samples. The lattice parameters of La2Pr2Ni3O8 and La2Nd2Ni3O8 are shown in Fig. 5. In La2Pr2Ni3O8, the 105 K anomaly suppresses down to a temperature of 55 K. The qualitative behaviour of and across this transition remains similar to that described above for La4Ni3O8, but the anomaly at has weakened considerably, as shown in Fig. 5(a). However, in La2Nd2Ni3O8, suppresses completely, with the lattice parameters showing a monotonically decreasing behaviour down to the lowest temperature in our measurement, as shown in the right panels of Fig. 5 where the temperature variation of , , and V are shown. This difference (i.e., La2Pr2Ni3O8 showing a transition but La2Nd2Ni3O8 not) can be attributed to the ionic radii difference (). The smaller size of Nd induces a larger negative chemical pressure compared to the same amount of Pr, and because the decreasing average R-site radius () reduces , it is expected that below a certain critical the transition will disappear. In other words, as from above (), . The value of has been recently shown to lie in the range [24]. The average ionic radius of R = La0.5Nd0.5 ( = 1.1345 Å) is clearly on the lower side of this range; whereas for R = La0.5Pr0.5 ( = 1.143 Å), the average ionic radius is clearly on the higher side of this range and hence is non-zero for this sample. The temperature-dependent XRD data for the 10% Pr and Nd samples, collected using a lab-based diffractometer are shown in Fig. S3 of the Supplementary Material. For both doping types, suppresses to 99 K and 92 K for Pr-and Nd-doped samples, respectively.
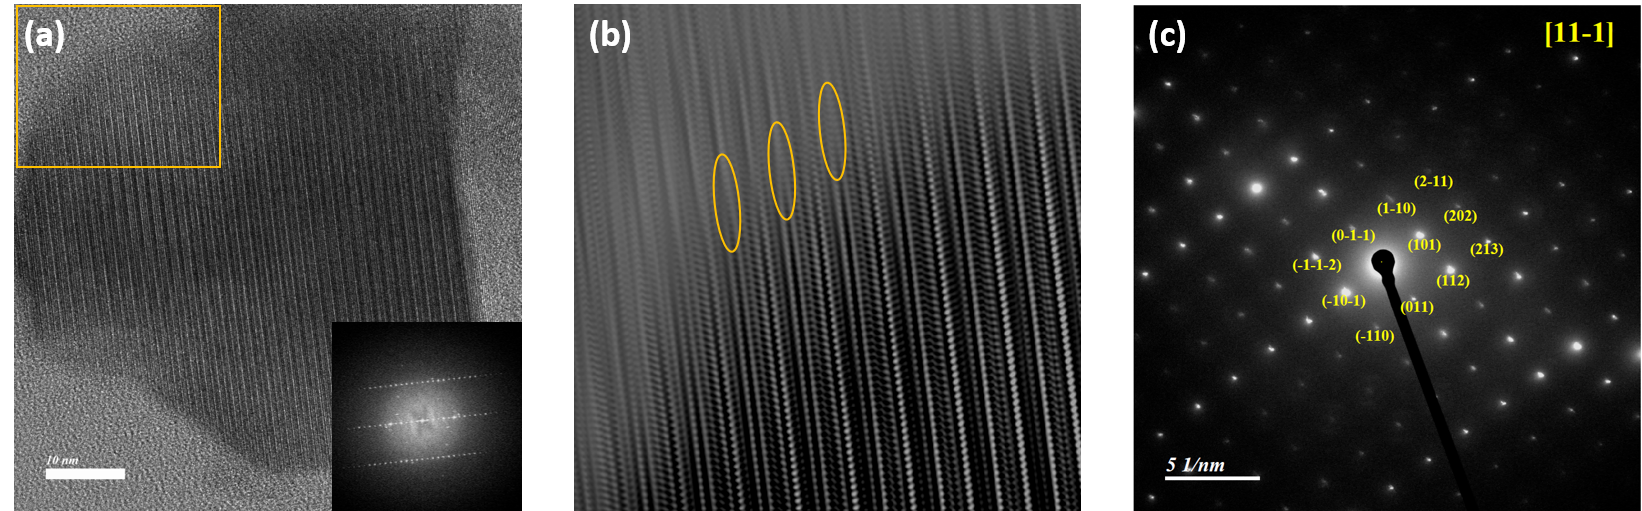
Fig. 6(a) shows the HRTEM micrograph of Pr4Ni3O8 sample. The sample shows nicely lined up crystal planes with few defects in the form of stacking faults as shown in yellow ellipses in Fig. 6(b) where the Fast Fourier transform (FFT) image of the region enlosed within the yellow-colored border in Fig. 6(a) is shown. No sign of intergrowth due to lower and higher members, which typically plagues the sample quality, could be seen in our samples. The SAED pattern, shown in Fig 6(c), consists of sharp spots indicative of a high crystallinity of the sample. The SAED pattern satisfies the reflection conditions expected for the space group in agreement with the previous HRTEM studies on Nd4Ni3O8 [25].
III.3 Physical characterization
III.3.1 Magnetization
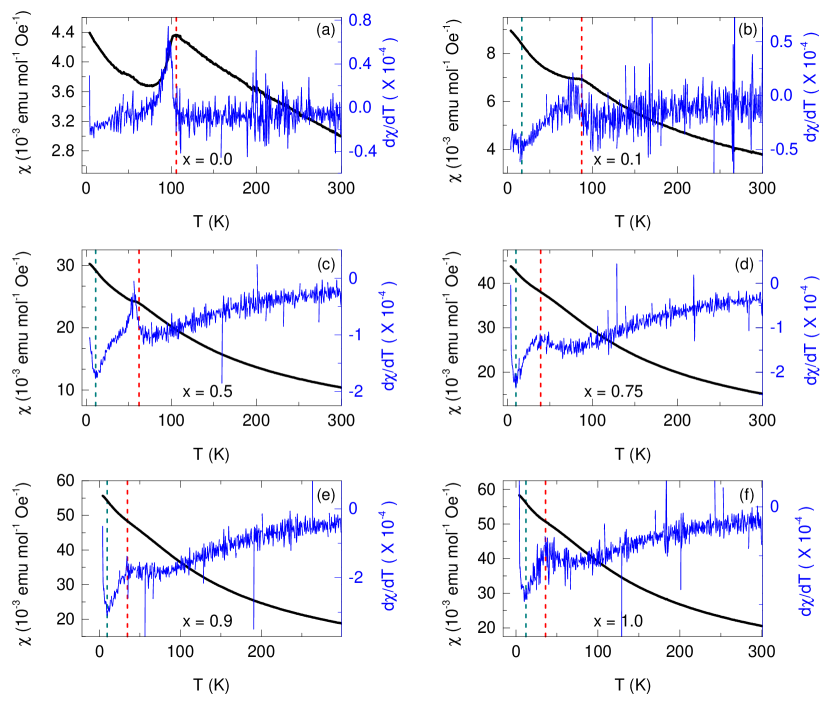
Fig. 7(a) and Fig. 7(b) show the normalized magnetization, M/H, as a function of temperature for the (La1-xPrx)4Ni3O8 and (La1-xNdx)4Ni3O8 samples, respectively, where H is the applied field in kOe units. In La4Ni3O8 (x = 0), the concomitant charge/spin-stripe ordering is seen as a kink in the M/H plot near 105 K. A zoomed-in view of this feature is shown in the inset in Fig. 7(a), where it can be seen more clearly. The temperature at which this anomaly appears in M/H is in good agreement with the previous reports [14, 15, 16]. Upon doping with Pr or Nd the transition is suppressed. However, an important difference between the two series of samples is that the magnetization of the Nd series at low temperatures is significantly high compared to the corresponding Pr series for any given . For example, for Pr4Ni3O8 , M/H at T 5 K is about whereas in Nd4Ni3O8, M/H at the same temperature is ; therefore, the magnetization of Pr4Ni3O8 is almost 4 to 5 times reduced compared to that of Nd4Ni3O8 . This difference is also reflected in the isothermal magnetization plots shown in Fig. 7(c) and Fig. 7(d). Since the calculated effective magnetic moment of a free Pr3+ ion is not very different from that of Nd3+ (3.58 and 3.62 , respectively), the reduced values of M/H of the Pr sample at low temperatures is likely a manifestation of the crystal field splitting of the lowest -multiplet () of the Pr3+ ions. Previously, we observed a similarly reduced M/H at low temperatures for Pr4Ni3O10 as compared to Nd4Ni3O10 due to the non-magnetic-singlet ground state associated with one of the two crystallographically inequivalent Pr ions in Pr4Ni3O10 [21]. We believe that a similar scenario prevails in the T’ analogue Pr4Ni3O8. As a result, in (La1-xPrx)4Ni3O8 series, the low-temperature magnetization signal originating from the Ni sublattice is not as heavily masked by the paramagnetic background due to the rare-earth moments as in the Nd case. Hence, in the Pr-doped series, the anomaly due to CS-stripe ordering remains clearly discernible up to x = 0.5. The transition temperature from the M/H plots (indicated by the position of arrows) is in fairly good accord with the temperature-dependent PXRD data discussed in the previous section, and with the transition temperature reported for the (La1-xPrx)4Ni3O8 series in Ref. [24]. Beyond x = 0.5 (i.e., x = 0.75, 0.9, and 1), we continue to see the presence of a weak hump around 35 K. In Fig. S5 in the Supplementary Material, the derivative plots clearly capture the presence of this feature. It should be noted that this feature appears even in the Pr4Ni3O8 sample (in fact, it is relatively less dominant in x = 0.75 and 0.9), which suggests that this feature is not related to the CS-stripe ordering. Since the size of this feature scales with Pr concentration, it is fair to conclude that it originates from the Pr-sublattice and is likely a manifestation of the crystal field splitting of the lowest -multiplet of the Pr3+ ions. The M/H of our samples agrees fairly well with the M/H data for H ab plane in Ref. [24]. When measured with the applied field aligned parallel to the c-axis, M/H exhibits an additional hump around 100 K.
We now investigate the magnetic behaviour of Nd4Ni3O8. Being a Kramers’ ion with configuration (odd number of electrons), the crystal field split ground state of Nd3+ () cannot be a singlet (i.e., the ground states of both Nd1 and Nd2 will be either a doublet or a quartet as the Kramers’ theorem forbids a singlet ground state). Hence, at low temperatures, both Nd sites contribute to the magnetization, and the overwhelming paramagnetic background that masks the CS-stripe anomaly associated with the Ni sublattice. This is true even in the sample with as small as 10% Nd doping (x 0.1). For higher doping values, the Curie-like behaviour dominates over the whole temperature range.
For the Pr4Ni3O8 and Nd4Ni3O8 samples, vs. T plots look fairly linear with small curvatures above about 150 K.We, therefore, fitted the high-temperature data using the modified Curie-Weiss (CW) law: , where C is the Curie-constant from which the value of the effective magnetic moment () can be obtained using , and is the Weiss temperature, and is the temperature independent contribution arising from the core-diamagnetism and the paramagnetism of Van Vleck or Pauli type. Treating , and as the fitting parameters, the best fit over the temperature range 150 K to 300 K using the modified Curie-Weiss equation led to the following values of the fitting parameters: For Pr4Ni3O8, , , and . The corresponding values for Nd4Ni3O8 are: , and . If we ignore the contribution of the Ni sublattice for the time being then we should get in Pr4Ni3O8, which exceeds the Hund’s rule derived free-ion value of substantially. This suggests that the magnetization associated with the Ni sublattice is non-negligible. Now, we know that the ratio Ni1+/Ni2+ in T’ structure is 2:1, and Ni1+ has a spin 1/2 while Ni2+ can take two possible spin states: spin 0 (low-spin or LS) or spin 1 (high-spin or HS). Accordingly, the value that quantity can be (HS) or (LS) (assuming factor to be 2 in each case). We calculated value of using the relation: , where in the free-ion moment on Pr3+ and . This gives a value of for , which is closer to the value expected in the low-spin case, indicating that the Ni2+ in Pr4Ni3O8 is in a low-spin state. In the case of Nd4Ni3O8, using and , we get , which is smaller than the value expected in the LS case, suggesting that the -electrons of Ni are partly itinerant. This is consistent with the experimental observation that Nd4Ni3O8 sample is more electrically conducting compared to Pr4Ni3O8 (vide infra). This, rather crude, analysis of M/H above 160 K appears to indicate that Ni -electrons in R4Ni3O8 become more itinerant as the ionic radius of R3+ decreases. The high value of and in both cases are likely a consequence of large crystal field splitting. It should be recalled that for an accurate estimate of , , and , the fittings should ideally be performed over a broad temperature range satisfying , where is the overall crystal field splitting of the lowest J-multiplet.
We thence tried fitting the low-temperature data for Pr4Ni3O8 and Nd4Ni3O8 to extract the magnetic moment in the crystal field split ground state level. In Nd4Ni3O8, a satisfactory fit could be obtained between 10 K and 25 K, yielding fitting parameters as follows: , and . We see that the Curie constant has reduced drastically from its high-temperature value suggesting that the magnetic moment per Nd ion in the crystal field split ground state is considerably smaller than the free-ion value. The values of and are now less affected by the crystal field splitting than before; however, unless the ground state is well-insulated from the excited states (which indeed in the case as we shall see), the true values, interpretable as the strength of exchange coupling () and core-diamagnetism/Pauli paramagnetism (), cannot be correctly ascertained in most cases. Interestingly, in the case of Pr4Ni3O8, a satisfactory Curie-Weiss fit could not be obtained despite adjusting the upper and lower temperature limits of the fitting range, indicating the complex nature of the magnetic ground state in Pr4Ni3O8. This we shall revisit as we advance further.
The isothermal magnetization at T = 5 K in both sets of doped samples scales with the mole fraction of the rare-earth element present (Fig. 7(c) and Fig. 7(d)). The temperature variation of M(H) is quasi-linear for Pr4Ni3O8 and Pr-doped samples, but a substantial non-linearity can be seen for the Nd4Ni3O8 and Nd-doped samples. In fact, in the Nd-doped samples, the magnetization near the highest field is on the verge of plateauing. At T = 5 K, and under an applied magnetic field of 90 kOe, the magnetization of Pr4Ni3O8 and Nd4Ni3O8 is and . These values are significantly smaller than the free-ion saturation magnetization of gJJ = 12.8 (Pr4Ni3O8) and 13.1 (Nd4Ni3O8), where gJ is the Landé g-factor. These reduced values can be attributed to the crystal field effect, as at low temperatures only the low-lying crystal field split levels contribute to the magnetization. Between Pr4Ni3O8 and Nd4Ni3O8, the magnetization value of for Pr4Ni3O8 as against for Nd4Ni3O8 is likely due to the singlet ground state of one of the two crystallographically inequivalent Pr3+ ions, as pointed out earlier. This interpretation gains more weight if one notes that in the RP series (where the non-magnetic singlet nature of one of the two Pr3+ ions in the structure has been vividly shown), the magnitude of M(H) between Nd and Pr samples have a similar relation [21].
In the inset of Fig. 7(c), the M(H) for La4Ni3O8 is shown, which is overshadowed in the main panel due to the R3+ sublattice. At 5 K, M(H) of La4Ni3O8 exhibits a ferromagnet-like steep initial increase, but at high fields M(H) continues to increase linearly, showing no signs of saturation. This behavior is qualitatively similar to that previously reported [9]. However, the saturation moment of the ferromagnetic component (obtained by extrapolating the linear part backwards to H = 0) is 0.2 emu g-1 in our sample, but it is close to 0.75 emu g-1 in Ref. [9]. At the same time, dM/dH from the linear part is in both the studies. Zhang et al. [9] argued that these two components actually represent contributions from two different phases. While the saturation is due to the Ni-metal phase, which forms in trace amounts during the reduction process, the linear increase at high fields is intrinsic to the T’ phase, which is well supported by the observation that dM/dH has the same value for the two samples. The smaller saturation value for our sample indicates a smaller Ni-metal component in our sample.
Similarly, the M(H) of Pr4Ni3O8 samples in some previous studies is reported to exhibit a large ferromagnetic component [14, 26]. In the Supporting Information provided with Ref. [14], the authors delved deeper into the intrinsic versus extrinsic origin of the ferromagnetic component and concluded that their data are difficult to reconcile with the intrinsic argument put forward in Ref. [26]. They observed that the ferromagnetic component is isotropic, unlike the quantity dM/dH, which exhibits a significant anisotropy between the in-plane and out-of-plane data, which led them to conclude with reasonable certainty that the ferromagnetic component has an extrinsic origin related to the presence of Ni metal, as discussed above. Zhang et al. also showed that the saturation magnetization of the ferromagnetic component is almost temperature independent [9], which supports the presence of a ferromagnetic impurity in the form of Ni metal. This scenario is highly plausible since reduction beyond the optimized duration results in very rapid decomposition of the compound into La2O3 and Ni metal.
III.3.2 Specific heat
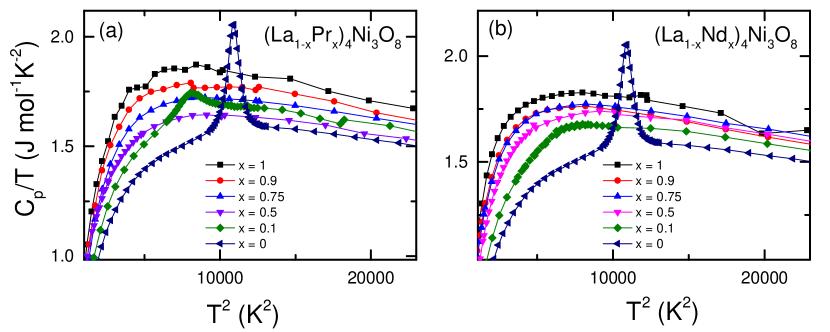
The molar specific heat (Cp) of the parent R4Ni3O8 (R = La, Pr, and Nd) compounds are shown in Fig. 8 (a-c). In La4Ni3O8, the concomitant charge/spin (CS) stripe ordering is manifested as a peak near 105 K, as shown in Fig. 8(a). The temperature of the anomaly is in excellent agreement with the previous reports [14, 15, 16, 17], and with the position of the anomaly in the lattice parameters in Fig. 4(a1), Fig. 4(a2), and Fig. 4(a3); or with the position of the anomaly in the temperature variation of M/H for = 0, as shown in Fig. 7(a). Let us now turn to the specific heat of Pr4Ni3O8 and Nd4Ni3O8 samples, shown in Fig. 8(b) and Fig. 8(c), respectively. The first thing to note is that for both these samples, the temperature variation of Cp is smooth over the entire temperature range. In particular, the 105 K anomaly present for the La4Ni3O8 sample is absent for these samples, in line with the temperature-dependent PXRD and magnetization data, discussed earlier. Near room temperature, their specific heats are nearly equal, but about 20-25 J mol-1 higher than that of La4Ni3O8. The excess specific heat is associated with the CF levels of the magnetic rare-earth ions. While the high-temperature specific heat is featureless and varies smoothly, the low-temperature specific heat of these two samples (Pr and Nd) exhibits interesting features that are worth discussing here. We first note that the specific heat of Pr4Ni3O8 near 20 K is approximately one-half that of Nd4Ni3O8 at the same temperature. Furthermore, upon cooling below about 6 K or so the specific heat of Pr4Ni3O8 shows an anomalous behavior, which is more clearly depicted in the lower inset of Fig. 8(b), where is plotted against . We note that below a temperature marked as , the shows a sharp downturn. Interestingly, this feature shows no magnetic field dependence.
On the other hand, the low temperatures specific heat of Nd4Ni3O8 displays an upturn upon cooling 5 K as shown in the upper inset of Fig. 8(c). Under an applied magnetic field, the onset temperature for this upturn shifts to higher values resulting in a broad peak at lower temperatures; this peak shifts to higher temperatures as the field strength increases – a feature typical of the Schottky-type anomaly, which, in this case, could be associated with the Zeeman split lowest crystal field level of Nd3+ ions in Nd4Ni3O8. In Nd4Ni3O10, a similar behaviour due to the Zeeman splitting of the Kramer’s doublet ground state was previously reported [21]. Interestingly, when plotted as versus T2 (see lower inset in Fig. 8(c)), the specific heat of Nd4Ni3O8 also exhibits a sharp downturn, similar to that seen for Pr4Ni3O8, below a temperature of 13 K (this feature is in addition to the upturn due to the Schottky effect). In Pr4Ni3O8, the absence of Schottky contribution is consistent with the interpretation that Pr3+ has a singlet ground state. The presence of an anomalous downturn below in the Pr and 13 K in the Nd sample is magnetic field independent and does not seem to arise from the rare-earth sublattice. In order to verify this hypothesis, let us examine the specific heat of the samples from the (La, Pr) and (La, Nd) series.
The low-temperature specific heat of (La1-xRx)4Ni3O8 (R Pr, Nd) samples is shown in Fig. 8(d) and Fig. 8(e), respectively. In the Pr-doped series, with decreasing Pr-doping the magnitude of decreases progressively, and the temperature also decreases to 5 K for x = 0.9 and 4 K for x = 0.75; however, for x = 0.5, varies linearly without any perceptible downturn. Thus, for this sample, if non-zero, lies below 2 K (the lowest temperature in our measurements). In the Nd-series, the downturn in , which was seen below 13 K in the pristine sample, shifts down to 11 K for x = 0.9. However, no such feature could be seen for x = 0.75. If we plot versus the average R-site lattice parameter, which is shown later in the manuscript (see Fig.10), one sees a linear behavior as a function of across the two series. This suggests that the anomaly has a common origin in both Pr4Ni3O8 and Nd4Ni3O8, and it is controlled by the average R-site ionic radius. Going by this, in should fall between 5 K and 6 K, which coincides with the temperature below which the Schottky contribution dominates, masking the weak downturn for this sample.
We fitted the low temperature Cp for both the (La1-xPrx)4Ni3O8 and (La1-xNdx)4Ni3O8 series using the expression: , where the coefficients and represent the electronic and lattice contributions, respectively. For this purpose, we used the data above 6 K in Pr4Ni3O8 series and 13 K in the Nd4Ni3O8 series. Above these temperatures, the versus plots look fairly linear over the temperature range shown as shown in Fig. 8 (d) and Fig. 8(e). The estimated value turns out to be for Pr4Ni3O8 and for Nd4Ni3O8. These values are unusually high, and one may be inclined to conclude that these samples possibly exhibit a heavy fermion behavior. However, before arriving at such a conclusion, one has to first carefully discard the crystal field contribution arising from the low-lying crystal field split levels of R3+ ions. This is a complex task, requiring the knowledge of the crystal field splitting scheme. In the case of La4Ni3O8, the fitting was performed in the temperature range below 7 K, which resulted in which is comparable to that for La4Ni3O10 [21] that exhibits a metallic ground state. Since the ground state of La4Ni3O8 is insulating, the fairly high value for this sample can arise from the spin-wave contribution associated with the long-range ordering of the Ni moments.
III.3.3 Electrical Transport
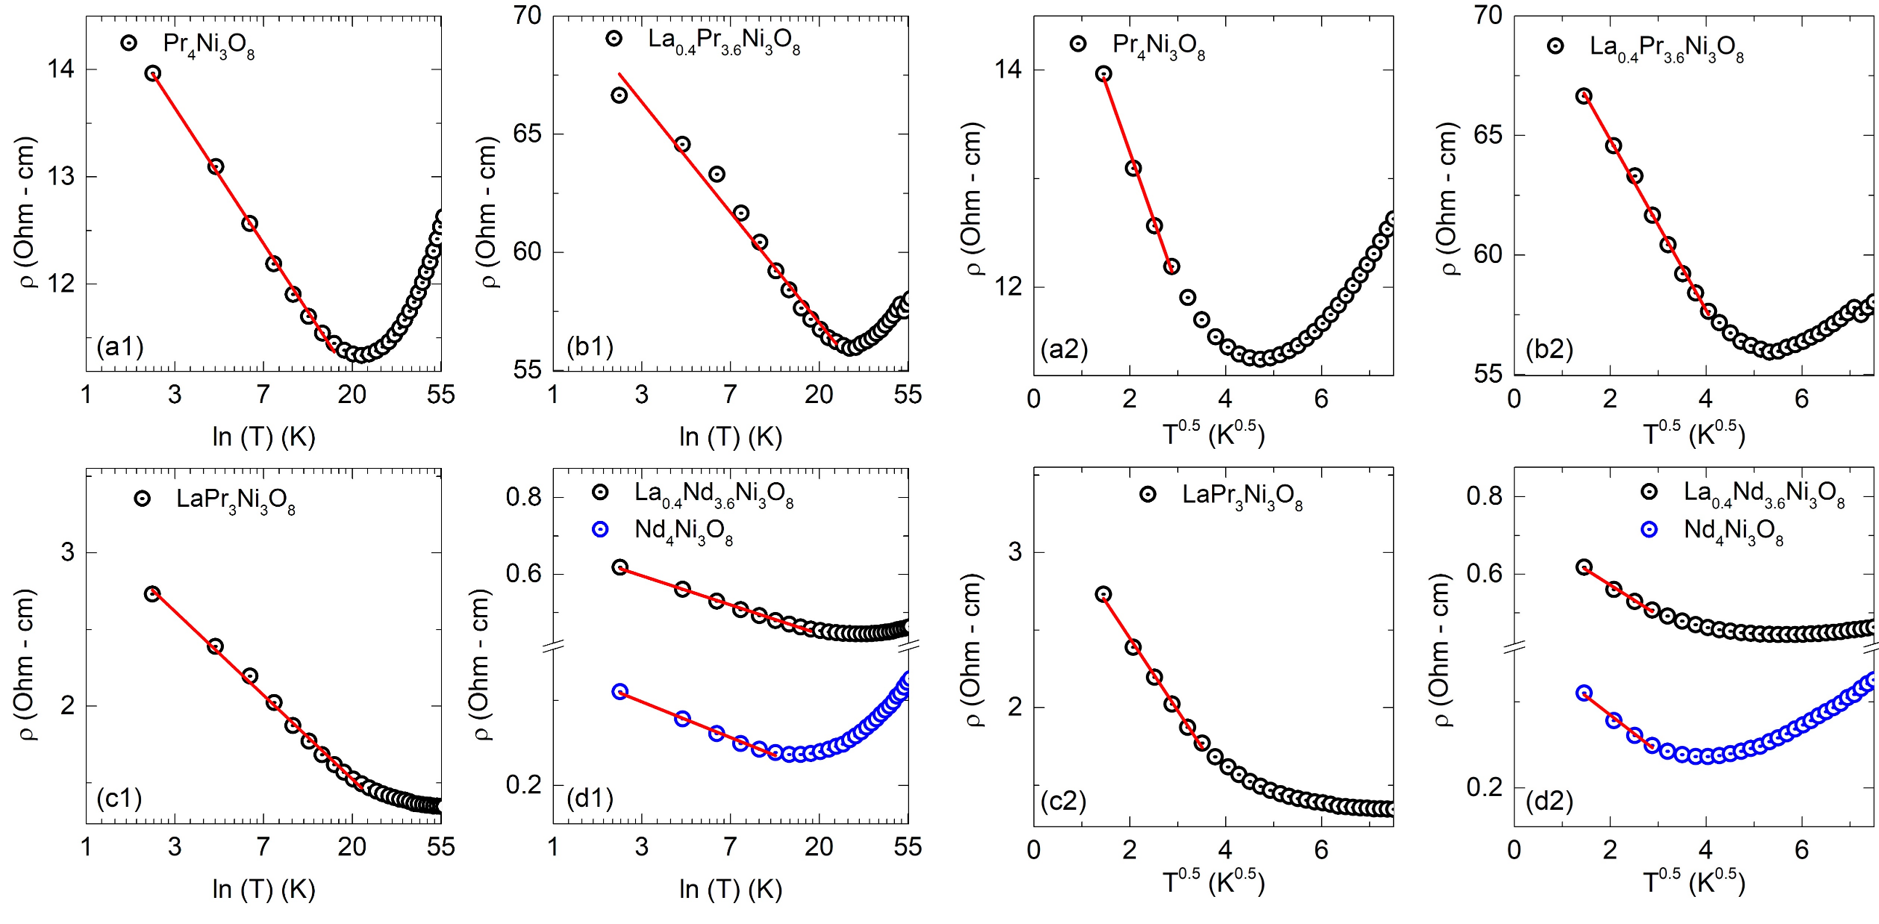
The temperature-dependent normalized electrical resistivity, where is the resistivity at 300 K, of (La1-xPrx)4Ni3O8 and the (La1-xNdx)4Ni3O8 samples is shown in Fig. 9(a) and Fig. 9(b), respectively. The MIT associated with the CS-stripe ordering is clearly captured in La4Ni3O8 near = 105 K, in good agreement with previous reports [14, 15, 16, 9]. Below this temperature, the resistivity shows a sharp increase upon cooling. In the (La1-xPrx)4Ni3O8 samples, the MIT is suppressed with the increase in the Pr-doping. The in the Pr-doped samples agrees fairly well with anomalies in the lattice parameter and magnetization data presented in the previous sections. In the Pr-rich samples, and , the sharp increase in resistivity, characteristic of the MIT is not seen, indicating that the critical doping required for the complete suppression lies in the range 0.5 , in agreement with Ref. [24]. Note that in Ref. [24], the chemical formula is written as (Pr1-zLaz)4Ni3O8, and is shown to disappear between , which is contained within the interval found here. Although no MIT is seen for x = 0.9 and 0.75, the exhibits a shallow minimum, with the slope becoming steeper at very low temperatures. It should be pointed out that the resistivity of the pristine sample also behaves similarly, ruling out any extrinsic origin or an origin related to sample inhomogeneity. This observation is consistent with several previous reports [19, 9, 27, 20, 10]. The metallic behavior of Pr4Ni3O8 is in agreement with the theoretical calculations [28, 29, 30], where the presence of a large hole pocket contribution from the Ni band at the Fermi level contributes to the charge transport. The residual resistivity ratio (RRR) for our metallic Pr-doped samples (i.e., 0.75 x 1) varies from 1 to 2. Such low values of RRR for these samples could be due to the presence of microcracks and stacking faults (see Fig. 6(b)) which may have appeared during the reduction process. Similar behavior is also seen for the La-Nd series albeit with a difference that in this case a clear MIT is seen only for and . The upturn in the low-temperature resistivity of the Pr or Nd-doped metallic samples can arise due to a variety of reasons, including weak localization [31], electron-electron interaction or Kondo-like spin-dependent scattering mechanism [32]. To understand, we tried fitting the low-temperature data to a logarithmic temperature dependence (lnT) as well as to a T0.5 dependence (see Fig. S6 in Supplementary Material). Both scenarios result in fits that do not look completely satisfactory, hence making it difficult to assign either of the two scenarios for explaining the resistivity upturn.
Magnetoresistance: The magnetoresistance (MR) refers to the change in resistance of a material under the influence of an applied magnetic field and is defined as, MR (%) = , where H is the externally applied magnetic field; and are the resistivities (or resistance) of the sample in the presence and absence of magnetic field, respectively. The MR data for the Pr4Ni3O8 and Nd4Ni3O8 samples is shown in Fig. 9(c) and Fig. 9(d), respectively. At 10 K and 20 K, the MR of Pr4Ni3O8 is positive over the whole temperature range. The field dependence is parabolic, except close to the origin, where the variation is linear. The quadratic dependence arises due to the extra scattering that the carriers encounter as they move under the influence of the Lorentz force acting on them. At lower temperatures of 5 K and 2 K, the MR first decreases linearly up to 20-30 kOe and thereafter increases quadratically, becoming positive at higher fields. The low-field linear region is a typical signature of the phenomenon known as weak antilocalization (WAL) [33, 34, 35, 36]. The effect is overcome at high fields, restoring the quadratic behavior.
For the Nd4Ni3O8 sample a negative MR of nearly 4% has been observed at 2 K. The MR initially increases with the field before saturating at higher fields to a value close to 4% under a maximum applied field of 90 kOe. The magnitude of negative MR decreases as the temperature is increased from 2 K to 5 K. Thereafter, the MR shows a crossover from negative to small positive MR at 10 K and 20 K. We believe that the negative MR in Nd4Ni3O8 sample at low temperatures is related to spin-disorder scattering [37]. Recall the presence of Schottky anomaly in the low-temperature specific heat of Nd4Ni3O8. This Schottky anomaly is due to the Zeeman splitting of the lowest crystal field split level. At low temperatures, as the magnetic field strength increases, more and more Nd-ions occupy the lower Zeeman energy level; or, in other words, with increasing field strength more and more Nd moments will line up along the field direction. This reduces the spin-disorder scattering, leading to a negative MR, as seen here. The MR saturates at high fields when the Nd-moments are all more or less aligned along the field direction. The MH curve at 2 K in Fig. 7(d), shows that the magnetization nearly saturates at 2 K under 90 kOe. An alternative possibility is that the negative MR in Nd4Ni3O8 also arises due to the weak anti-localization (WAL) effect as discussed above in the context of Pr4Ni3O8. However, the saturation of MR at high magnetic fields rules out this scenario.
III.4 Phase diagram
Having analyzed the temperature dependence of powder X-ray diffraction data and various other physical quantities, we have enough information to draw a phase diagram depicting the variation of (the concomitant charge-spin stripe ordering and metal-to-insulator transition) and T∗ (the low-temperature specific heat anomaly) and the phases bounded by them. Table. 1 summarizes the values of and T∗ for various values of calculated as , where is the ionic radius of R3+ for R = La, Pr, and Nd, in the eight-fold coordination and . The phase diagram is shown in Fig. 10. With decreasing , the transition temperature decreases almost linearly down to , i.e., the composition La0.5Pr0.5. However, in the composition , which corresponds to , no MIT could be detected either in x-ray diffraction or other physical properties. This suggests that vanishes in the range , this agrees well with Ref. [24], where this range is even better defined as . Thus, line drops quite suddenly to 0 once the Pr-doping in La4Ni3O8 exceeds a critical value in this range. The temperature T∗ has been identified in this study and has no reference in the previous literature to the best of our knowledge. Since, T∗ (the temperature below which shows a sharp downturn) is present for both Pr4Ni3O8 and Nd4Ni3O8, and their intermediate compositions, and as this transition also scales almost linearly with , we have good reasons to argue that this characteristic temperature is associated with the Ni electrons. The variation of T∗ with is shown in the phase diagram in Fig. 10. In the limit T, the value of , which we have labeled as , comes out to be 1.138 Å, which lies well within the range where vanishes. Hence, these two temperature scales seem to be mutually exclusive; or, in other words, coming from the Nd or Pr side of the phase diagram, one can argue that the electronic instability associated with the phenomenon underlying prevents the MIT from setting in.
| T | |||
|---|---|---|---|
| La | 1.16 | 104 | - |
| La0.9Pr0.1 | 1.156 | 99 | - |
| La0.9Nd0.1 | 1.155 | 92 | - |
| La0.5Pr0.5 | 1.143 | 55 | - |
| La0.5Nd0.5 | 1.134 | 0 | - |
| La0.25Pr0.75 | 1.134 | - | 4 |
| La0.1Pr0.9 | 1.129 | - | 5 |
| Pr | 1.126 | - | 6 |
| La0.25Nd0.75 | 1.122 | - | - |
| La0.1Nd0.9 | 1.114 | - | 11.2 |
| Nd | 1.109 | - | 12.6 |
IV Summary & Conclusions
La4Ni3O8 is an interesting system, showing concomitant charge-spin stripes ordering and metal-to-insulator transition near =105 K. Intriguingly, this transition does not occur in its Pr4Ni3O8 and Nd4Ni3O8 analogues, both of whom show a metallic behavior. Here, we examined the effect of progressively decreasing the R-site ionic radius by doping at the La site with Pr and Nd separately, leading to two sets of samples: (La1-xPrx)4Ni3O8 and (La1-xNdx)4Ni3O8, . By combining the samples from the two doping series, we show that the transition temperature initially decreases linearly as the average R-site ionic radius () decreases, and then vanishes suddenly in the narrow range , in agreement with Ref. [24] where this range is even better defined as . A careful examination of the low-temperature specific heat revealed the presence of a new energy scale characterized by the temperature below which exhibits a sharp drop. The variation of with for various intermediate compositions, including Pr4Ni3O8 ( 6 K) and Nd4Ni3O8 (), we found that: (a) versus plot follows a linearly decreasing trend with increasing , vanishing at , which lies exactly in the range where disappears with decreasing . In other words, we demonstrate that the sudden disappearance of upon decreasing is associated with the emergence of a new phase below , where increases with decreasing in the region . Up to now, more advanced tools such as ARPES and Neutron have been used primarily to understand the nature of phase transition at . We propose that for a deeper understanding of the nature of and its peculiar dependence on the R-site ionic radius (its sharp disappearance below a certain critical ), low-temperature experiments unraveling the nature of the new phase below , as vanishes will be very useful. As is controlled by , seen for both Pr4Ni3O8 and Nd4Ni3O8 (i.e., independent of the choice of R), one can argue that this transition does not originate from the rare-earth sublattice. Given the fact that Pr magnetism is weakened by the crystal field splitting due to non-magnetic singlet state, the prospects of studying the nature of the new phase below are highly favorable in Pr4Ni3O8 and Pr-rich samples.
Acknowledgments
SS acknowledges financial support from SERB (WMR/2016/003792). DR acknowledges financial support from IEEE Magnetics Society Educational Seed Funding. We are thankful to beamline scientists Francois Fauth, Catalin Popescu, and Aleksandr Missiul at the MSPD-BL04 beamline at ALBA Synchrotron facility. SS and DR would like to acknowledge the Department of Science and Technology, India (Grant No. SR/NM/Z-07/2015) for providing financial support for carrying out the Synchrotron experiments at ALBA, and to the Jawaharlal Nehru Centre for Advanced Scientific Research (JNCASR) for facilitating it. SS and DR would like to thank UGC DAE Indore for providing PPMS facility to carry out magnetotransport and magnetization experiments.
References
- Bednorz and Müller [1986] J. G. Bednorz and K. A. Müller, Possible hightc superconductivity in the ba-la-cu-o system, Zeitschrift für Physik B Condensed Matter 64, 189 (1986).
- Anisimov et al. [1999] V. I. Anisimov, D. Bukhvalov, and T. M. Rice, Electronic structure of possible nickelate analogs to the cuprates, Phys. Rev. B 59, 7901 (1999).
- Li et al. [2019] D. Li, K. Lee, B. Y. Wang, M. Osada, S. Crossley, H. R. Lee, Y. Cui, Y. Hikita, and H. Y. Hwang, Superconductivity in an infinite-layer nickelate, Nature 572, 624 (2019).
- Zeng et al. [2022] S. Zeng, C. Li, L. E. Chow, Y. Cao, Z. Zhang, C. S. Tang, X. Yin, Z. S. Lim, J. Hu, P. Yang, and A. Ariando, Superconductivity in infinite-layer nickelate thin films, Science Advances 8, eabl9927 (2022), https://www.science.org/doi/pdf/10.1126/sciadv.abl9927 .
- Osada et al. [2021] M. Osada, B. Y. Wang, B. H. Goodge, S. P. Harvey, K. Lee, D. Li, L. F. Kourkoutis, and H. Y. Hwang, Nickelate superconductivity without rare-earth magnetism: (la,sr)nio2, Advanced Materials 33, 2104083 (2021), https://onlinelibrary.wiley.com/doi/pdf/10.1002/adma.202104083 .
- Osada et al. [2020a] M. Osada, B. Y. Wang, B. H. Goodge, K. Lee, H. Yoon, K. Sakuma, D. Li, M. Miura, L. F. Kourkoutis, and H. Y. Hwang, A superconducting praseodymium nickelate with infinite layer structure, Nano Letters 20, 5735 (2020a).
- Osada et al. [2020b] M. Osada, B. Y. Wang, K. Lee, D. Li, and H. Y. Hwang, Phase diagram of infinite layer praseodymium nickelate thin films, Phys. Rev. Materials 4, 121801 (2020b).
- Botana et al. [2017] A. S. Botana, V. Pardo, and M. R. Norman, Electron doped layered nickelates: Spanning the phase diagram of the cuprates, Phys. Rev. Materials 1, 021801 (2017).
- Zhang et al. [2017a] J. Zhang, A. S. Botana, J. W. Freeland, D. Phelan, H. Zheng, V. Pardo, M. R. Norman, and J. F. Mitchell, Large orbital polarization in a metallic square-planar nickelate, Nature Physics 13, 864 (2017a).
- Pan et al. [2022] G. A. Pan, D. Ferenc Segedin, H. LaBollita, Q. Song, E. M. Nica, B. H. Goodge, A. T. Pierce, S. Doyle, S. Novakov, D. Córdova Carrizales, A. T. N’Diaye, P. Shafer, H. Paik, J. T. Heron, J. A. Mason, A. Yacoby, L. F. Kourkoutis, O. Erten, C. M. Brooks, A. S. Botana, and J. A. Mundy, Superconductivity in a quintuple-layer square-planar nickelate, Nature Materials 21, 160 (2022).
- Keimer et al. [2015] B. Keimer, S. A. Kivelson, M. R. Norman, S. Uchida, and J. Zaanen, From quantum matter to high-temperature superconductivity in copper oxides, Nature 518, 179 (2015).
- Zhang et al. [2017b] J. Zhang, A. S. Botana, J. W. Freeland, D. , H. Zheng, V. Pardo, M. R. Norman, and J. F. Mitchell, Large orbital polarization in a metallic square-planar nickelate, Nature Physics 13, 864 (2017b).
- Lin et al. [2021] J. Q. Lin, P. Villar Arribi, G. Fabbris, A. S. Botana, D. Meyers, H. Miao, Y. Shen, D. G. Mazzone, J. Feng, S. G. Chiuzbăian, A. Nag, A. C. Walters, M. García-Fernández, K.-J. Zhou, J. Pelliciari, I. Jarrige, J. W. Freeland, J. Zhang, J. F. Mitchell, V. Bisogni, X. Liu, M. R. Norman, and M. P. M. Dean, Strong superexchange in a nickelate revealed by resonant inelastic x-ray scattering, Phys. Rev. Lett. 126, 087001 (2021).
- Zhang et al. [2016] J. Zhang, Y.-S. Chen, D. Phelan, H. Zheng, M. R. Norman, and J. F. Mitchell, Stacked charge stripes in the quasi-2d trilayer nickelate , Proceedings of the National Academy of Sciences 113, 8945 (2016), https://www.pnas.org/doi/pdf/10.1073/pnas.1606637113 .
- Poltavets et al. [2010] V. V. Poltavets, K. A. Lokshin, A. H. Nevidomskyy, M. Croft, T. A. Tyson, J. Hadermann, G. Van Tendeloo, T. Egami, G. Kotliar, N. ApRoberts-Warren, A. P. Dioguardi, N. J. Curro, and M. Greenblatt, Bulk magnetic order in a two-dimensional () nickelate, isoelectronic with superconducting cuprates, Phys. Rev. Lett. 104, 206403 (2010).
- Cheng et al. [2012] J.-G. Cheng, J.-S. Zhou, J. B. Goodenough, H. D. Zhou, K. Matsubayashi, Y. Uwatoko, P. P. Kong, C. Q. Jin, W. G. Yang, and G. Y. Shen, Pressure effect on the structural transition and suppression of the high-spin state in the triple-layer , Phys. Rev. Lett. 108, 236403 (2012).
- Zhang et al. [2019] J. Zhang, D. M. Pajerowski, A. S. Botana, H. Zheng, L. Harriger, J. Rodriguez-Rivera, J. P. C. Ruff, N. J. Schreiber, B. Wang, Y.-S. Chen, W. C. Chen, M. R. Norman, S. Rosenkranz, J. F. Mitchell, and D. Phelan, Spin stripe order in a square planar trilayer nickelate, Phys. Rev. Lett. 122, 247201 (2019).
- ApRoberts-Warren et al. [2011] N. ApRoberts-Warren, A. P. Dioguardi, V. V. Poltavets, M. Greenblatt, P. Klavins, and N. J. Curro, Critical spin dynamics in the antiferromagnet from nuclear magnetic resonance, Phys. Rev. B 83, 014402 (2011).
- Miyatake et al. [2022] T. Miyatake, Y. Wako, S. Tsukamoto, I. Umehara, and M. Uehara, Chemical doping to ni-sites in layered nickelate pr4ni3o8 for high-tc superconductor candidate, Social Science Research Network http://dx.doi.org/10.2139/ssrn.4080321 (2022).
- Nakata et al. [2016] A. Nakata, S. Yano, H. Yamamoto, S. Sakura, Y. Kimishima, and M. Uehara, The first observation of metallic behaviour in , Advances in Condensed Matter Physics 2016, 5808029 (2016).
- Rout et al. [2020] D. Rout, S. R. Mudi, M. Hoffmann, S. Spachmann, R. Klingeler, and S. Singh, Structural and physical properties of trilayer nickelates (, pr, and nd), Phys. Rev. B 102, 195144 (2020).
- Rodríguez-Carvajal [1993] J. Rodríguez-Carvajal, Recent advances in magnetic structure determination by neutron powder diffraction, physica B 192, 55 (1993).
- Lacorre [1992] P. Lacorre, Passage from t-type to t’-type arrangement by reducing r4ni3o10 to r4ni3o8 (r = la, pr, nd), Journal of Solid State Chemistry 97, 495 (1992).
- Chen et al. [2022] X. Chen, H. Zheng, D. P. Phelan, H. Zheng, S. H. Lapidus, M. J. Krogstad, R. Osborn, S. Rosenkranz, and J. F. Mitchell, Competing charge/spin-stripe and correlated metal phases in trilayer nickelates (pr1–xlax)4ni3o8, Chemistry of Materials 34, 4560 (2022), https://doi.org/10.1021/acs.chemmater.2c00371 .
- Retoux et al. [1998] R. Retoux, J. Rodriguez-Carvajal, and P. Lacorre, Neutron diffraction and tem studies of the crystal structure and defects of nd4ni3o8, Journal of Solid State Chemistry 140, 307 (1998).
- Huangfu et al. [2020] S. Huangfu, Z. Guguchia, D. Cheptiakov, X. Zhang, H. Luetkens, D. J. Gawryluk, T. Shang, F. O. von Rohr, and A. Schilling, Short-range magnetic interactions and spin-glass behavior in the quasi-two-dimensional nickelate , Phys. Rev. B 102, 054423 (2020).
- Kobayashi et al. [2017] K. Kobayashi, H. Yamamoto, A. Nakata, I. Umehara, M. Uehara, H. Yamamoto, A. Nakata, I. Umehara, and M. Uehara, Electrical resistivity measurements under high pressure for nd3.5sm0.5ni3o8, JJAP Conference Proceedings 011106, 6 (2017).
- Nica et al. [2020] E. M. Nica, J. Krishna, R. Yu, Q. Si, A. S. Botana, and O. Erten, Theoretical investigation of superconductivity in trilayer square-planar nickelates, Phys. Rev. B 102, 020504 (2020).
- Karp et al. [2020] J. Karp, A. Hampel, M. Zingl, A. S. Botana, H. Park, M. R. Norman, and A. J. Millis, Comparative many-body study of and , Phys. Rev. B 102, 245130 (2020).
- Botana et al. [2022] A. S. Botana, K.-W. Lee, M. R. Norman, V. Pardo, and W. E. Pickett, Low valence nickelates: Launching the nickel age of superconductivity, Frontiers in Physics 9, 10.3389/fphy.2021.813532 (2022).
- Abrahams et al. [1979] E. Abrahams, P. W. Anderson, D. C. Licciardello, and T. V. Ramakrishnan, Scaling theory of localization: Absence of quantum diffusion in two dimensions, Phys. Rev. Lett. 42, 673 (1979).
- Kondo [1964] J. Kondo, Resistance Minimum in Dilute Magnetic Alloys, Progress of Theoretical Physics 32, 37 (1964), https://academic.oup.com/ptp/article-pdf/32/1/37/5193092/32-1-37.pdf .
- Hikami et al. [1980] S. Hikami, A. I. Larkin, and Y. Nagaoka, Spin-Orbit Interaction and Magnetoresistance in the Two Dimensional Random System, Progress of Theoretical Physics 63, 707 (1980), https://academic.oup.com/ptp/article-pdf/63/2/707/5336056/63-2-707.pdf .
- Xing et al. [2013] Y. Xing, Y. Sun, M. Singh, Y.-F. Zhao, M. H. W. Chan, and J. Wang, Electronic transport properties of topological insulator films and low dimensional superconductors, Frontiers of Physics 8, 491 (2013).
- Laitinen et al. [2018] A. Laitinen, M. Kumar, and P. J. Hakonen, Weak antilocalization of composite fermions in graphene, Phys. Rev. B 97, 075113 (2018).
- Jenderka et al. [2013] M. Jenderka, J. Barzola-Quiquia, Z. Zhang, H. Frenzel, M. Grundmann, and M. Lorenz, Mott variable-range hopping and weak antilocalization effect in heteroepitaxial na2iro3 thin films, Phys. Rev. B 88, 045111 (2013).
- Haas [1968] C. Haas, Spin-disorder scattering and magnetoresistance of magnetic semiconductors, Phys. Rev. 168, 531 (1968).
Supplementary Information: Investigating the cause of crossover from charge/spin stripe insulator to correlated metallic phase in layered T’ nickelates -R4Ni3O8
Thermogravimetric analysis
A complete decomposition of the samples was carried out by conducting isotherm runs at 600∘C using 10% Ar - H2 atmosphere at a heating rate of 10 K/min in a high resolution TGA setup (Netzsch STA 449 F1) as shown in Fig.S1(a) and (b). From these experiments, we determined the oxygen stoichiometry of all the samples as shown in Table 2.
| x in (La1-xRx)4Ni3O8±δ, R (Pr and Nd) | Method of synthesis | (LP series) | (LN series) |
|---|---|---|---|
| 0 | using CaH2 | + 0.29 | + 0.29 |
| 0.1 | using CaH2 | + 0.40 | + 0.27 |
| 0.5 | Ar-H2 (10%) | + 0.04 | + 0.72 |
| 0.75 | Ar-H2 (10%) | - 0.05 | + 0.51 |
| 0.9 | Ar-H2 (10%) | + 0.14 | + 0.32 |
| 1.0 | Ar-H2 (10%) | - 0.004 | - 0.13 |