capbtabboxtable[][\FBwidth]
Latched Detection of Zeptojoule Spin Echoes with a Kinetic Inductance Parametric Oscillator
Abstract
When strongly pumped at twice their resonant frequency, non-linear resonators develop a high-amplitude intracavity field, a phenomenon known as parametric self-oscillations. The boundary over which this instability occurs can be extremely sharp and thereby presents an opportunity for realizing a detector. Here we operate such a device based on a superconducting microwave resonator whose non-linearity is engineered from kinetic inductance. The device indicates the absorption of low-power microwave wavepackets by transitioning to a self-oscillating state. Using calibrated wavepackets we measure the detection efficiency with zeptojoule energy wavepackets. We then apply it to measurements of electron spin resonance, using an ensemble of 209Bi donors in silicon that are inductively coupled to the resonator. We achieve a latched-readout of the spin signal with an amplitude that is five hundred times greater than the underlying spin echoes.
I Introduction
Over the past decade, quantum-limited parametric amplifiers operating at microwave frequencies have progressed from proof-of-principle to ubiquity within circuit quantum electrodynamics (cQED) experiments. Typically, these devices are operated in a linear regime, but several types of parametric amplifiers are explicitly non-linear, such as the Josephson bifurcation amplifier (JBA) [1] and the Josephson parametric oscillator (JPO) [2, 3]. These devices essentially act as a microwave “click”-detector, in that threshold detection is employed to discriminate the presence or absence of a signal. Central to the design of JBAs and JPOs is the use of Josephson junctions, which provide the non-linearity required for signal mixing. An alternative source of non-linearity is the kinetic inductance intrinsic to thin films of disordered superconductors [4]. In contrast to Josephson junction-based devices, superconducting microwave resonators engineered from high kinetic inductance materials retain high quality-factors when operated in tesla-strength magnetic fields [5, 6] and at elevated temperatures. This has recently inspired the development of magnetic field-compatible resonant parametric amplifiers that operate close to the quantum noise limit [7, 8, 9, 10], which have a range of applications including axion detection [11] and quantum computation with spin qubits [12].
Another application of these devices is the measurement of electron spin resonance (ESR). JPAs have already been used to push noise in ESR experiments to the quantum limit, where vacuum fluctuations of the electromagnetic field dictate the spin detection sensitivity [13, 14]. Several other recent works have applied non-linear microwave amplifiers [15] and qubit-based sensors [16, 17, 18, 19] employing Josephson junctions to measurements of ESR in order to push detection sensitivities to record levels. Kinetic inductance parametric amplifiers (KIPAs) have also recently been used for ESR, where they have been demonstrated to have several advantages over JPAs [10]. Due to their compatibility with moderate magnetic fields, KIPAs can serve as both the resonator for inductive detection of spin echo signals as well as the first-stage amplifier. This not only simplifies the measurement setup by obviating a separate quantum-limited amplifier, it also eliminates any insertion loss between the resonator and the first cryogenic amplifier.
Here, we extend previous works with KIPAs by operating one as a “click”-detector, rather than as a linear amplifier. By biasing the device near the threshold where its behaviour transitions from a linear amplifier to a parametric oscillator, the onset of parametric self-oscillations (PSO) serves as an indicator for the absorption of microwave wavepackets. To distinguish this operating regime, which has not been previously demonstrated, we refer to the device here as a kinetic inductance parametric oscillator (KIPO), in analogy to the JPO which operates under a similar principle. In the following we describe the concept of the detector, calibrate its sensitivity, and demonstrate its application in ESR measurements of an ensemble of bismuth (209Bi) donors in silicon (Si) that are directly coupled to the device.
II Results
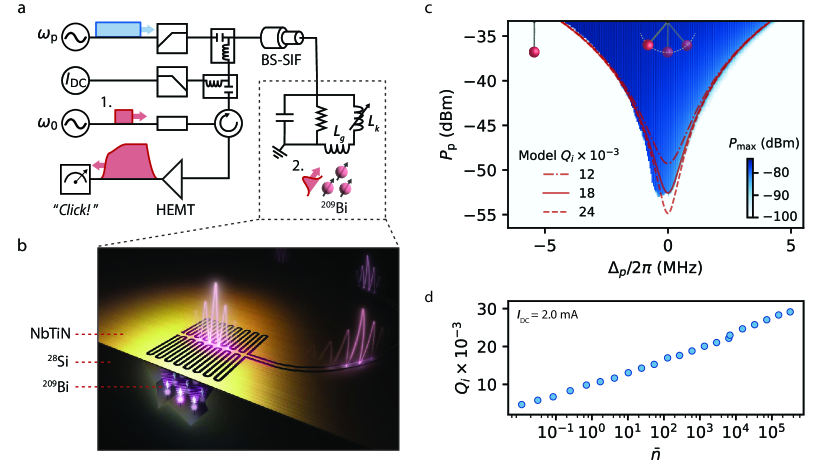
Device Design Our device is similar to the KIPAs described in previous works [7, 10]. It is patterned in a single lithographic step from a 50 nm thick film of niobium titanium nitride (NbTiN) with a kinetic inductance of . The NbTiN is deposited on a Si substrate enriched in the isotope 28Si (750 ppm residual 29Si) that was implanted with 209Bi donors at a concentration of over a depth of m. The device has a single port and consists of a quarter-wavelength () coplanar waveguide resonator that is shorted to ground at one end and galvanically connected to a band-stop stepped impedance filter (BS-SIF) [20] at the other end (Figs. 1a,b). The resonator features a dense interdigitated capacitor with m wide fingers and a m gap to ground (see Supplementary Material), which compensates for the strong kinetic inductance and reduces the impedance of the mode to . The BS-SIF serves to confine the resonant mode of the device while simultaneously allowing the application of a DC bias current (). An can be used to tune the resonance frequency from GHz to GHz via the quadratic dependence of on the total current [21]. An also enables three-wave mixing so that a pump with frequency can be used to amplify signals with frequencies about [7, 22]. The device is connected to the cold finger of a dilution refrigerator with a base temperature of 10 mK or a pumped 3He cryostat with a base temperature of 400 mK, depending on the experiment. The DC current and microwave tones are combined at base temperature using a bias tee and diplexer (Fig. 1a). The device is measured in reflection with the signal being routed through a cryogenic high electron mobility transistor (HEMT) amplifier at 4 K. Further details of the device design and measurement setup are provided in the Supplementary Material.
Detector Concept The defining characteristic of PSO is the formation of a large intracavity field at whenever the three-wave mixing strength exceeds the average rate at which resonant photons can escape the cavity. Experimentally, this manifests as the sudden generation of a large power at that is emitted from the device whenever the pump power is raised beyond a sharp threshold . In Fig. 1c we report the maximum power recorded by a spectrum analyzer () centered at as a function of and a detuning of the pump frequency . The dark blue region corresponds to the parameter space where the device undergoes PSO, and the boundary of this region provides a direct measurement of .
Using cavity input-output theory and the Hamiltonian for the KIPA [7], we model our device as a parametrically-driven Duffing oscillator (see Supplementary Material), as has been done previously for JPOs [23, 24, 2]. Using parameters extracted from measurements of the device we directly compare the model and our experimental measurement of the threshold power (red lines in Fig. 1c). Crucially, the model predicts that when , , where and are the internal and coupling quality factors of the resonant mode, respectively. In Fig. 1c we compare three models of the device which are equivalent except for . For this particular measurement we find there is reasonable agreement between the data and model for . We also highlight that shifts to smaller values as is increased.
The quality factors and can be extracted from measurements of the device in reflection () using a vector network analyzer (VNA). As is common for superconducting microwave resonators, we observe that is non-linear with the applied signal power, or equivalently the average number of intracavity photons (Fig. 1d). This indicates that two level systems (TLSs) interact with the resonant mode [25] and limit at low signal power. We observe to vary between and for , which in all cases is much smaller than (see Supplementary Material). An important consequence of this is that the resonant mode’s linewidth , and hence , are sensitive to the signal power inside the resonator.
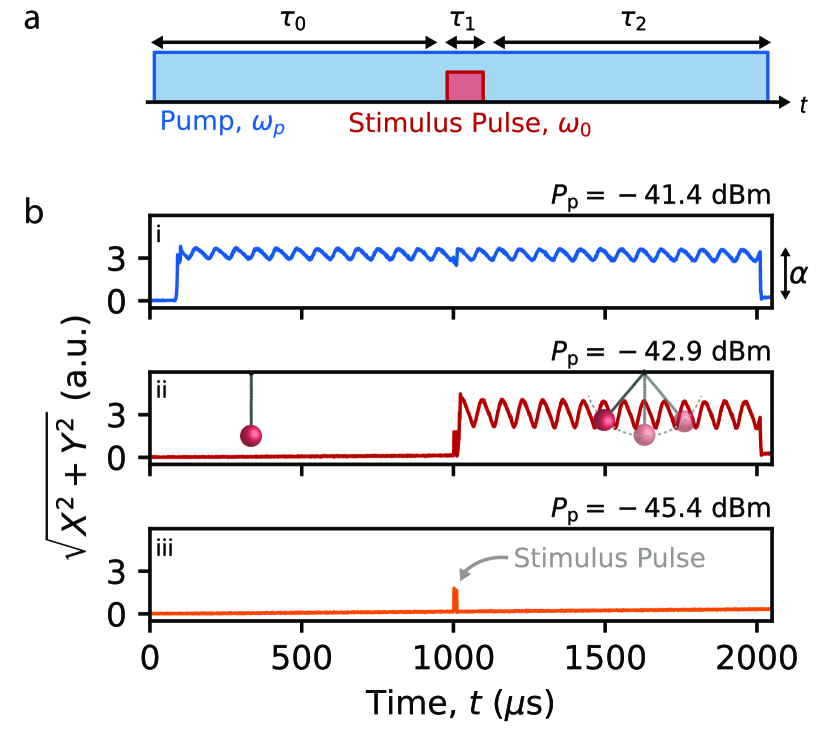
The experiments shown in Fig. 2 demonstrate how the dependence of on can be used to create a device that detects the absorption of low-power microwave wavepackets. First, the device is biased with a DC current mA and a pump tone with frequency . Following a delay ms, a stimulus pulse with duration s, frequency , and power dBm is delivered to the input of the device (Fig. 2a). Throughout the experiment we monitor the device by performing a homodyne measurement (i.e. demodulating the signal using a local oscillator with frequency ) and recording the amplitude of the signal quadrature components and . For the lowest pump power (Fig. 2b, iii), we observe no PSO. For the largest (Fig. 2b, i), we observe PSO, but at a time that is uncorrelated with the stimulus pulse. But for an appropriately chosen (Fig. 2b, ii) we observe the PSO onset at a time that is correlated with the stimulus pulse (the quiet and self-oscillating states are represented schematically with the pendulum). We hypothesize that absorption of the stimulus pulse triggers the onset of PSO due to the partial saturation of the TLSs; the increased associated with this results in being dynamically reduced below the setpoint, thereby triggering PSO.
From Fig. 2b it is clear that the self-oscillating state has a large amplitude (), relative to the stimulus pulse. Indeed, Fig. 1c shows that the peak power of PSO can exceed -75 dBm. This can be understood by noting that for a Duffing oscillator, where is the self-Kerr strength (see Supplementary Material). The Kerr effect for these devices is known to be negligible relative to Josephson junction-based devices, due to the weak and distributed nature of the kinetic inductance non-linearity [7]. By comparing the power of PSO measured with a spectrum analyzer to the average number of intracavity photons calculated from VNA measurements of with a known power, we estimate that during PSO. For this device, is large enough to enable subsequent four wave mixing processes, which results in the generation of a frequency comb about whenever the device self-oscillates (see Supplementary Material). This results in oscillations in the amplitude of the demodulated signal when the device is self-oscillating (Fig. 2b).
Detection Efficiency and Sensitivity To calibrate the sensitivity of the detector, we measure its response using two pulse sequences. The first is depicted in Fig. 3a and is identical to that used in the previous section (Fig. 2a) but with different timings , and . The second sequence is similar, differing only in that the stimulus pulse is omitted (Fig. 3b). Using threshold detection, this allows us to measure the efficiency of the sensor, , where indicates that the device self-oscillates and () indicates that the device receives (does not receive) a stimulus pulse. is therefore the conditional probability describing the successful detection of the stimulus and is the probability of observing a dark count.
In Fig. 3c, we measure the detection efficiency as a function of the pump power with a DC current mA, stimulus pulse duration s, and stimulus pulse powers in the range dBm. For these experiments we also phase modulate the pump microwave source at a rate of kHz because the gain of a linear parametric amplifier () operated in degenerate mode () is dependent upon the relative phase between the pump and signal () [7]. While the modulation rate is slower than kHz, for each data point we measure shots of the pulse sequence to ensure the unbiased sampling of all , thereby mitigating its effect. is found to grow monotonically with and is non-zero over a dB range in . For the largest measured (dBm), reaches a maximum of 0.98, which indicates that the device functions as a near perfect detector. As is reduced, the at which is maximized grows slightly (from dBm for dBm to dBm for dBm). This reflects that as is reduced, the device needs to be biased increasingly closer to for successful detection, which results in a corresponding increase to the number of dark counts. In Fig. 3d we show that the probability of dark counts grows from to over a dB range in . This corresponds to a dark count rate that is Hz for dBm and kHz for dBm (see Supplementary Material). We note that while we chose to focus on the setpoint mA in the main text, the device achieves high over a tunable range of MHz (see Supplementary Material).
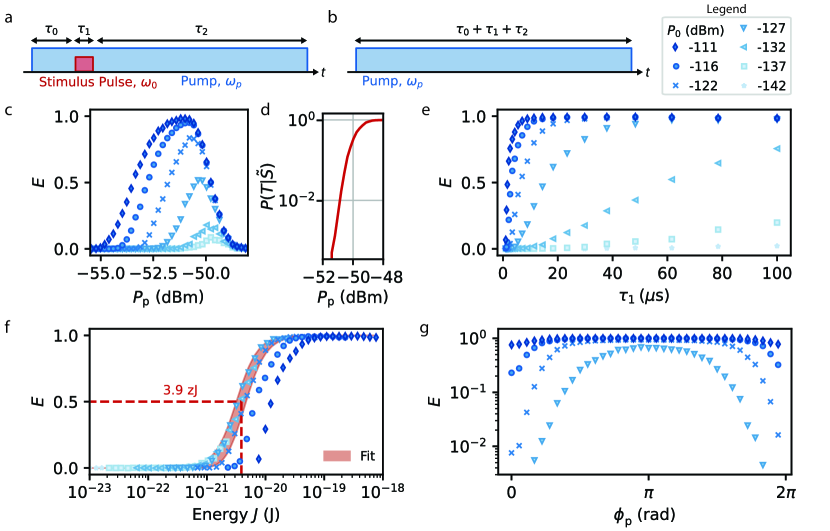
Next we measure the detection efficiency as a function of the stimulus pulse duration (Fig. 3e). We fix the pump power to the value where was maximized in the previous experiment ( dBm) and continue to phase modulate the pump. In this experiment the dark count probability is at maximum , which ensures that mainly reflects the probability of true detection . reaches a maximum of and is found to grow monotonically with both and . This suggests that is strongly correlated with the energy of the wavepacket . We confirm this by plotting (Fig. 3f), where we see that for all , resembles an activation curve. Fitting the entire dataset with a sigmoid we infer that for zJ, where the upper and lower bounds correspond to the uncertainty in the calibration of . We note that the achieved for a given does show some dependence on , with the two largest measured having the lowest . For these two measurements the cavity ring-down time is as long as s, which reduces the detection sensitivity to pulses with short at such high powers. This may explain why their activation curves (Fig. 3f) do not align with those taken at lower , where (and therefore the ring-down time) is reduced. Excluding the data with dBm from the fit (red shaded area in Fig. 3f) we find the lower bound for the sensitivity to be zJ for . This corresponds to wavepackets containing microwave photons, measured at the input of the device. A complementary method for determining the sensitivity of a detector is plotting the receiver operating characteristic curve (see Supplementary Material), where we find that the detector performs better than a random binary classifier for pulse energies above zJ ( photons).
Finally, we examine the influence of the pump phase on the detection efficiency by turning off phase modulation on the pump microwave source and instead controlling for and stepping throughout the experiment (Fig. 3g). For each pump power , we found that could be both enhanced and suppressed by controlling , relative to a control experiment where the pump microwave source was phase modulated. We also found that averaged across all agreed closely with the efficiency obtained with phase modulation. This confirms for the experiments in Figs. 3c-f that even though is faster than the phase modulation rate, the large number of shots taken ensures that is independent of when phase modulation is enabled. For dBm (the weakest power measured in this experiment), could be suppressed to zero or made as large as 0.68, while with phase modulation . The phase-dependence of highlights an essential aspect underlying the operation of this detector: the microwaves absorbed into the resonator are first parametrically amplified. The amplified signal saturates the TLSs, thereby triggerring PSO.
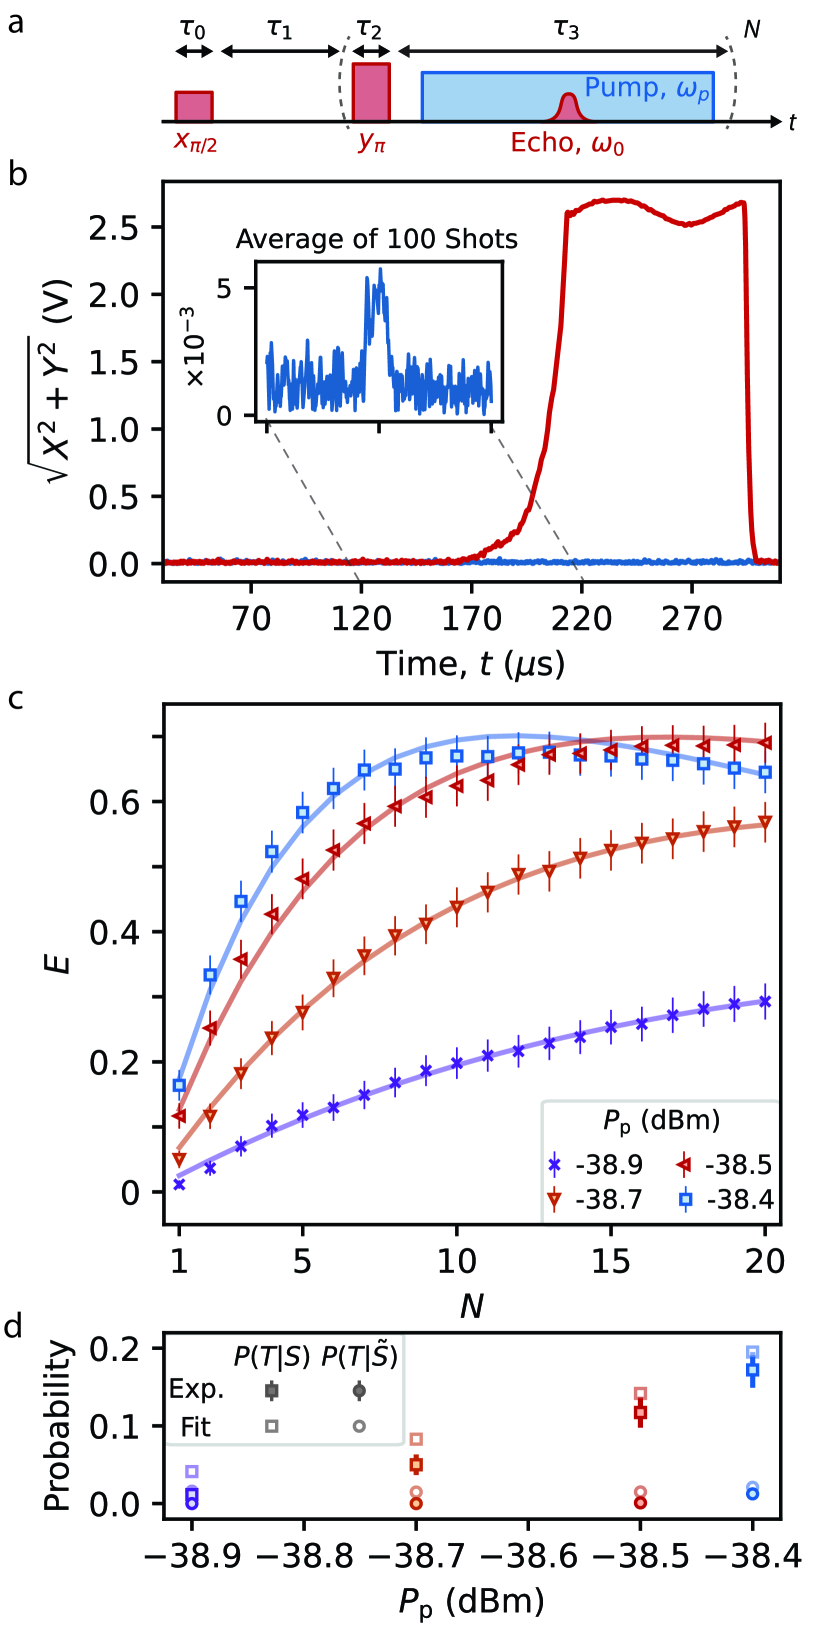
Latched Readout of a Spin Ensemble To measure ESR we apply an in-plane magnetic field of strength mT to bring an ESR transition of the 209Bi donors, which were implanted into the Si substrate prior to fabrication, into resonance with the device (see Methods for a description of the spin transition measured). Resonant pulses delivered to the device are then used to control the sub-ensemble of spins with Larmor frequencies within the bandwidth of the resonator. The spins are measured using a Hahn echo pulse sequence, which is depicted in Fig. 4a. The first pulse in the sequence () is a pulse which causes the spins to precess about and dephase due to interactions with their environment. After a time delay , a phase-shifted pulse () partially reverses the dephasing and causes the spins to refocus and emit an echo, temporarily populating the resonator with photons [26]. For the Hahn echo pulse sequence this refocusing procedure is performed only once, which we designate (see Fig. 4a).
To detect the spins via PSO, we modify the standard Hahn echo pulse sequence by adding in a strong parametric pump following the refocusing pulse. As in the previous experiments, we set the pump power close to but below the threshold power . PSO may then be triggered when the echo populates the resonator. Individual shots of the pulse sequence are depicted in Fig. 4b. When no pump tone is supplied (blue trace) the device functions simply as a resonator. The first amplifier in the measurement chain is a HEMT at 4 K. As a result, the signal-to-noise ratio (SNR) is poor and to reliably resolve the echo, the sequence must be repeated so that the signal can be averaged (inset of Fig. 4b). When the pump is on, the echo may trigger PSO, resulting in a detection signal with an amplitude that is a factor greater than that of the echo (red trace). Moreover, while the echo itself is s long, corresponding to the duration of the resonant pulses used for spin control, the PSO persists until the pump is turned off. This latched ESR readout of a spin ensemble constitutes a novel technique for detecting spin resonance.
A common technique used to enhance the SNR of pulsed ESR measurements, and thereby reduce the measurement time, is to average multiple spin echoes collected with a Carr-Purcell-Meiboom-Gill (CPMG) sequence. The CPMG pulse sequence is an extension of the Hahn-echo pulse sequence that refocuses the spins with pulses a total of times (Fig. 4a). In Fig. 4c we show that this technique can similarly be applied to boost the detection effieciency of our detector. For each we perform 1040 shots of the pulse sequence with refocusing pulses. We calculate by determining whether PSO were triggered for any of the repetitions within each shot of the pulse sequence. We find that by repeatedly refocusing the spin echo, can be increased by up to a factor of 25 for dBm, which in absolute terms corresponds to an improvement in by 0.28. For the three larger values of measured, the absolute improvement to is even greater, with all being enhanced by more than for a modest number of repetitions .
The experimental data in Fig. 4c is well-fit by the simple equation
| (1) |
which is a good approximation provided the amplitude of the spin echo does not decay appreciably within the time required to complete the refocusing pulses. In Fig. 4d we compare the values of the true detection probability and the dark count probability fit to the data with those measured using a Hahn echo sequence (), which shows good agreement between the two sets of values. This suggests that for the present experiment, detection of the spin echoes can be modelled as a series of statistically independent events with constant probabilities for spin echo detection and dark counts. This has important implications for optimizing the detection of spin echoes with the KIPO, namely that for finite , the number of refocusing pulses required to maximize scales as (see Supplementary Material). Indeed, we see in Fig. 4c that for dBm where , could be maximized with only refocusing pulses. This rapid convergence on the optimal efficiency means that the CPMG detection scheme should also be effective on spin systems with shorter coherence times, as are commonly found in conventional ESR spectroscopy experiments [27], where the number of refocusing pulses that can be applied is limited. Measuring spins with lower coherence would likely require an increase in both the excitation and detection bandwidth relative to the present device.
III Discussion
The sensitivity of the detector could be improved beyond what is demonstrated here by designing a device that is critically coupled (), in which case the wavepacket would be more efficiently absorbed by the device. For the current detector, for , in which case the fraction of power that is absorbed is only . Reducing to achieve critical coupling, e.g. by modifying the BS-SIF, could therefore increase its sensitivity by nearly an order of magnitude, while simultaneously increasing the bandwidth. We also note that the peak sensitivity was measured in an experiment utilizing phase modulation of the pump microwave source, while in Fig. 3g we have already demonstrated that can be increased by more than a factor of three, provided the pump and signal are phase-matched.
The sensitivity of future devices could be further enhanced by increasing the strength with which the device couples to TLSs. While this approach is counter to most cQED experiments, in the present case, it will further increase the sensitivity of to the average number of intracavity photons , which is central to signal detection. This could be achieved by reducing the widths of the coplanar waveguide gap () and conductor () below the dimensions of the present device (m, m). Because TLSs reside at the dielectric interface, this will have the effect of concentrating the resonant mode volume in the material hosting the TLSs [28, 25]. In addition, dielectrics with higher concentrations of TLSs [29, 30, 31] could be intentionally deposited to improve both the detection sensitivity and bandwidth.
The experiments presented in Fig. 4 are a proof-of-concept that demonstrate how the detector might be used in ESR experiments. While the experiments in Fig. 4 are taken at a single magnetic field , we also compare the conventional ESR and KIPO methods over a range of fields, simulating how the KIPO might be used as a spectroscopic probe (Supplementary Material). This experiment further highlights that while detection of the spin echoes with the KIPO occurs with probability , the KIPO signal is greater than conventional ESR methods even when averaging over all shots and accounting for dark counts. This is directly related to the large power of the PSO signal, which we show in Fig. 1c can exceed dBm at its peak, referred to the output of the device. This is dB greater than the equivalent room-temperature Johnson-Nyquist noise measured over a bandwidth of MHz, which means that it would be possible to measure “clicks” produced by the KIPO even without a cryogenic HEMT amplifier.
The experiments shown in Figs. 4c,d show that ESR detection using the KIPO benefits from the extension of conventional ESR techniques. Further, it was recently demonstrated how “click”-detectors can be used to perform a full-suite of ESR techniques [17], which may be similarly adapted to the KIPO. Continuous-wave ESR detection might also be explored, as demonstrated using classical oscillator circuits that operate deep in the oscillator regime [32]. In comparing the KIPO to works using Josephson junction-based devices, we emphasize the simplicity of our experiment. The KIPO does not require the operation of any qubits for detecting the microwave signals and can be operated at elevated temperatures and directly in a magnetic field (here 400 mK and 13.71 mT, which would preclude the use of aluminum Josephson junctions). Ultimately, this enables the KIPO to be coupled directly to the spin ensemble, which obviates a following quantum-limited amplifier or a cryogenic HEMT amplifier, as noted above. Aside from simplifying near quantum-noise-limited ESR setups, these experiments also suggest that the probability of detecting spins with the KIPO may scale exponentially with the number of measurements . This might be exploited in some measurements to increase the speed of spin detection relative to conventional techniques that utilize linear quantum-noise-limited amplifiers, where the SNR grows as . Future work will focus on comparing both detection techniques and further exploring the advantages of latched echo readout in ESR spectroscopy.
IV Materials and Methods
Device Fabrication. The silicon substrate is enriched in the isotope 28Si with a residual 29Si concentration of 750 ppm. 209Bi ions with multiple energies were implanted to a concentration of cm-3 between 0.75 m and 1.75 m depth and electrically activated with a 20 min anneal at 800 ∘C in a N2 environment. A 50 nm film of NbTiN was then sputtered (STAR Cryoelectronics). The film was determined to have a kinetic inductance of 3.45 pH/ by matching the resonant frequencies of capacitively coupled resonators to microwave simulations (Sonnet). The device was patterned in a single step with electron beam lithography and subsequently dry-etched with a CF4/Ar plasma. The device was then mounted and wire bonded to a printed circuit board and enclosed in a 3D copper cavity.
Measurement Setups. The measurements are performed in two different cryogenic systems: a dry dilution refrigerator with a base temperature of 10 mK, and a pumped 3He cryostat with a base temperature of 400 mK. In both setups DC and microwave signals are combined at the coldest stage with a bias-tee and diplexer and two cryogenic circulators are used to route the reflected microwave signals to cryogenic HEMT amplifiers. In some experiments additional amplification and filtering of the microwave and baseband signals is performed at room temperature. Time resolved measurements are performed via homodyne detection with utilizing a homemade microwave bridge. The Supplementary Material includes detailed schematics of both setups.
VNA Measurements. VNA measurements were fit to cavity input-output theory [33] in order to extract , and . For the data in Fig. 1d, a baseline was measured and subtracted from each measurement, by setting mA, which shifted outside the measurement window.
Measurement of . The measurements of presented in Fig. 3 were collected by repeating each pulse sequence 500 shots at a time, with a 33 Hz repetition rate (pump duty cycle ). In each experiment, the parameters being swept (, , , , and the corresponding control experiments) were selected in pseudo-random order. For each datapoint a minimum of shots of both the experimental and control sequences were run. A threshold applied to the amplitude of the demodulated signal was used to determine if the device self-oscillated. For the experiments in Figs. 3a-d the pump was phase-modulated at a rate of 15 kHz to ensure would not be dependent on . In Fig. 3e phase modulation was disabled. Despite a 3 GHz clock used to sync the two microwave sources, a small phase drift was still evident in (the control experiments used for calculating showed no trend, as expected). To correct for the phase drift, for each experimental repetition (500 shots for each ) was fit with a phenomenological function and aligned with the minimum on . For all measurements of , the uncertainties were found by adding in quadrature the 95% confidence intervals for the binomnial distributions of and .
Measurements of 209Bi. All measurements of 209Bi were performed at 400 mK. The device is mounted so that is aligned parallel to the long axis of the resonator. This orientation is chosen so that the magnetic field of the resonant mode is perpendicular to for spins located underneath the resonator. Numerically solving the 209Bi spin Hamiltonian allows one to target specific 209Bi ESR transitions by adjusting until the spins are resonant with the cavity. In this work we measure the transition. The small discrepancy between the at which we measure ESR (mT) and the numerically-predicted field (mT) might be attributed to strain caused by the different coefficients of thermal expansion of the Si substrate and NbTiN thin film [34] or a slight miscalibration of the superconducting solenoid used to generate . For the Hahn echo and CMPG sequences used for the experiments in Fig. 4, we use s, s, and [35]. The leading edge and trailing edges of the pump pulses are padded by s and s with respect to the pulses, to avoid their amplification. The sequences were measured with a repetition time of 7 s. For the experiment in Fig. 4c a total of 1040 shots of the full sequence with were measured for both the control and experimental sequences at each , while alternating between the control and experimental sequences. We performed two independent control sequences: one where the pulse was excluded and a second where the twenty pulses were excluded. The two values of were found to agree closely with one another, despite the different timing of the pulses relative to the onset of the pump. This indicates that the dark count rate was not influenced by residual fields of the and pulses in this experiment. Histograms of the detector counts for the experimental and control sequences as a function of time and repetition are provided in the Supplementary Material.
Calibration of Powers. All powers mentioned throughout the text are referred to the input of the device enclosure. To calibrate these powers we performed three separate cool-downs of the cryostats with two additional high-frequency lines ( and ). In the first two cool-downs, or were connected in place of the device, and measurements of each pair of lines were taken. In the third cool-down, an measurement was taken where and were connected to one another at the base temperature plate. The combination of measurements taken over the three cool-downs allowed for a full reconstruction of the gain (loss) of each line, which agreed closely with the designed amplification (attenuation). We estimate the powers to be accurate to within dB.
IV.1 Acknowledgments
J.J.P. was supported by an Australian Research Council Discovery Early Career Research Award (DE190101397) when part of this work was performed. J.J.P. and A.M. acknowledge support from the Australian Research Council Discovery Program (DP210103769). A.M. is supported by the Australian Department of Industry, Innovation and Science (Grant No. AUS-MURI000002). W.V. acknowledges financial support from Sydney Quantum Academy, Sydney, NSW, Australia. A.K. acknowledges support from the Carlsberg Foundation. T.S. was supported by the Office of Fusion Energy Sciences, U.S. Department of Energy, under contract no. DE-AC02-05CH11231. D.P. was supported by an Australian Government Research Training Program (RTP) Scholarship. The authors acknowledge support from the NSW Node of the Australian National Fabrication Facility. We acknowledge access and support to NCRIS facilities (ANFF and the Heavy Ion Accelerator Capability) at the Australian National University. We thank Robin Cantor and STAR Cryoelectronics for sputtering the NbTiN film. The authors thank Mark Johnson, Patrice Bertet, Klaus Mølmer and Tim Duty for helpful discussions.
IV.2 Author contributions
W.V. and A.K. performed the experiments. W.V. analyzed the data. M.S. and J.J.P. designed the device and W.V. and J.J.P. fabricated it. T.S. provided the isotopically enriched silicon substrate and B.C.J. and J.C.M. performed the 209Bi implantation. D.P. helped with the measurement electronics. A.M. and J.J.P. supervised the project. W.V. and J.J.P. wrote the manuscript with input from all authors.
IV.3 Additional information
J.J.P. and M.S. are inventors on a patent related to this work (AU2020347099) filed by the University of New South Wales with a priority date of 09 September 2019. The authors declare that they have no other competing interests. Correspondence and requests for materials should be addressed to J.J.P.
References
- Siddiqi et al. [2004] I. Siddiqi, R. Vijay, F. Pierre, C. M. Wilson, M. Metcalfe, C. Rigetti, L. Frunzio, and M. H. Devoret. RF-driven Josephson bifurcation amplifier for quantum measurement. Physical Review Letters, 93(20):207002, 2004. ISSN 00319007. doi: 10.1103/PhysRevLett.93.207002.
- Lin et al. [2014] Z. R. Lin, K. Inomata, K. Koshino, W. D. Oliver, Y. Nakamura, J. S. Tsai, and T. Yamamoto. Josephson parametric phase-locked oscillator and its application to dispersive readout of superconducting qubits. Nature Communications, 5:4480, 2014. ISSN 20411723. doi: 10.1038/ncomms5480.
- Krantz et al. [2016] Philip Krantz, Andreas Bengtsson, Michaël Simoen, Simon Gustavsson, Vitaly Shumeiko, W. D. Oliver, C. M. Wilson, Per Delsing, and Jonas Bylander. Single-shot read-out of a superconducting qubit using a Josephson parametric oscillator. Nature Communications, 7:11417, 2016. ISSN 20411723. doi: 10.1038/ncomms11417.
- Ho Eom et al. [2012] Byeong Ho Eom, Peter K. Day, Henry G. Leduc, and Jonas Zmuidzinas. A wideband, low-noise superconducting amplifier with high dynamic range. Nature Physics, 8(8):623–627, 2012. ISSN 17452481. doi: 10.1038/nphys2356.
- Samkharadze et al. [2016] N Samkharadze, A Bruno, P Scarlino, G Zheng, D P Divincenzo, L Dicarlo, and L M K Vandersypen. High-Kinetic-Inductance Superconducting Nanowire Resonators for Circuit QED in a Magnetic Field. Physical Review Applied, 5(4):1–7, 2016. ISSN 09601295. doi: 10.1017/S0960129511000703. URL https://journals.aps.org/prapplied/abstract/10.1103/PhysRevApplied.5.044004.
- Kroll et al. [2019] J.G. Kroll, F. Borsoi, K.L. van der Enden, W. Uilhoorn, D. de Jong, M. Quintero-Pérez, D.J. van Woerkom, A. Bruno, S.R. Plissard, D. Car, E.P.A.M. Bakkers, M.C. Cassidy, and L.P. Kouwenhoven. Magnetic-Field-Resilient Superconducting Coplanar-Waveguide Resonators for Hybrid Circuit Quantum Electrodynamics Experiments. Physical Review Applied, 11(6):064053, 2019. ISSN 2331-7019. doi: 10.1103/PhysRevApplied.11.064053. URL https://link.aps.org/doi/10.1103/PhysRevApplied.11.064053.
- Parker et al. [2022] Daniel J Parker, Mykhailo Savytskyi, Wyatt Vine, Arne Laucht, Timothy Duty, Andrea Morello, Arne L Grimsmo, and Jarryd J Pla. Degenerate Parametric Amplification via Three-Wave Mixing Using Kinetic Inductance. Physical Review Applied, 17:034064, 2022.
- Xu et al. [2023] Mingrui Xu, Risheng Cheng, Yufeng Wu, Gangqiang Liu, and Hong X. Tang. Magnetic field-resilient quantum-limited parametric amplifier. PRX Quantum, 4:010322, 2023. URL http://arxiv.org/abs/2209.13652.
- Khalifa and Salfi [2023] M Khalifa and J Salfi. Nonlinearity and Parametric Amplification of Superconducting Nanowire Resonators in Magnetic Field. Physical Review Applied, 19:034024, 2023.
- Vine et al. [2023] Wyatt Vine, Mykhailo Savytskyi, Daniel Parker, James Slack-Smith, Thomas Schenkel, Jeffrey C. McCallum, Brett C. Johnson, Andrea Morello, and Jarryd J. Pla. In-situ amplification of spin echoes within a kinetic inductance parametric amplifier. Science Advances, 9(10):adg1593, nov 2023. doi: 10.1126/sciadv.adg1593. URL http://arxiv.org/abs/2211.11333.
- Backes et al. [2021] Kelly M. Backes, D. A. Palken, S. Al Kenany, B. M. Brubaker, S. B. Cahn, A. Droster, Gene C. Hilton, Sumita Ghosh, H. Jackson, S. K. Lamoreaux, A. F. Leder, K. W. Lehnert, S. M. Lewis, M. Malnou, R. H. Maruyama, N. M. Rapidis, M. Simanovskaia, Sukhman Singh, D. H. Speller, I. Urdinaran, Leila R. Vale, E. C. van Assendelft, K. van Bibber, and H. Wang. A quantum-enhanced search for dark matter axions. Nature, 590:238–242, 2021. ISSN 23318422. doi: 10.1038/s41586-021-03226-7. URL http://dx.doi.org/10.1038/s41586-021-03226-7.
- Oakes et al. [2023] G. A. Oakes, V. N. Ciriano-Tejel, D. F. Wise, M. A. Fogarty, T. Lundberg, C. Lainé, S. Schaal, F. Martins, D. J. Ibberson, L. Hutin, B. Bertrand, N. Stelmashenko, J. W.A. Robinson, L. Ibberson, A. Hashim, I. Siddiqi, A. Lee, M. Vinet, C. G. Smith, J. J.L. Morton, and M. F. Gonzalez-Zalba. Fast High-Fidelity Single-Shot Readout of Spins in Silicon Using a Single-Electron Box. Physical Review X, 13(1):1–26, 2023. ISSN 21603308. doi: 10.1103/PhysRevX.13.011023.
- Bienfait et al. [2015] A. Bienfait, J. J. Pla, Y. Kubo, M. Stern, X. Zhou, C. C. Lo, C. D. Weis, T. Schenkel, M. L.W. Thewalt, D. Vion, D. Esteve, B. Julsgaard, K. Mølmer, J. J.L. Morton, and P. Bertet. Reaching the quantum limit of sensitivity in electron spin resonance. Nature Nanotechnology, 11(3):253–257, 2015. ISSN 17483395. doi: 10.1038/nnano.2015.282.
- Eichler et al. [2017] C. Eichler, A. J. Sigillito, S. A. Lyon, and J. R. Petta. Electron Spin Resonance at the Level of 104 Spins Using Low Impedance Superconducting Resonators. Physical Review Letters, 118(3):037701, 2017. ISSN 10797114. doi: 10.1103/PhysRevLett.118.037701.
- Budoyo et al. [2018] Rangga P. Budoyo, Kosuke Kakuyanagi, Hiraku Toida, Yuichiro Matsuzaki, William J. Munro, Hiroshi Yamaguchi, and Shiro Saito. Electron paramagnetic resonance spectroscopy of Er3+: Y2SiO5 using a Josephson bifurcation amplifier: Observation of hyperfine and quadrupole structures. Physical Review Materials, 2:011403, 2018. ISSN 24759953. doi: 10.1103/PhysRevMaterials.2.011403.
- Budoyo et al. [2020] Rangga P. Budoyo, Kosuke Kakuyanagi, Hiraku Toida, Yuichiro Matsuzaki, and Shiro Saito. Electron spin resonance with up to 20 spin sensitivity measured using a superconducting flux qubit. Applied Physics Letters, 116:194001, 2020. ISSN 23318422. doi: 10.1063/1.5144722.
- Albertinale et al. [2021] Emanuele Albertinale, Léo Balembois, Eric Billaud, Vishal Ranjan, Daniel Flanigan, Thomas Schenkel, Daniel Estève, Denis Vion, Patrice Bertet, and Emmanuel Flurin. Detecting spins with a microwave photon counter. Nature, 600:434–438, 2021. URL http://arxiv.org/abs/2102.01415.
- Billaud et al. [2022] Eric Billaud, Leo Balembois, Marianne Le Dantec, Milos Rančić, Emanuele Albertinale, Sylvain Bertaina, Thierry Chanelière, Philippe Goldner, Daniel Estève, Denis Vion, Patrice Bertet, and Emmanuel Flurin. Microwave fluorescence detection of spin echoes. arXiv, page 2208.13586, 2022. URL http://arxiv.org/abs/2208.13586.
- Wang et al. [2023] Z. Wang, L. Balembois, M. Rančić, E. Billaud, M Le Dantec, A. Ferrier, P. Goldner, S. Bertaina, T. Chanelière, D. Esteve, D. Vion, P. Bertet, and E. Flurin. Single-electron spin resonance detection by microwave photon counting. Nature, 619:276–281, 2023.
- Bronn et al. [2015] Nicholas T. Bronn, Yanbing Liu, Jared B. Hertzberg, Antonio D. Córcoles, Andrew A. Houck, Jay M. Gambetta, and Jerry M. Chow. Broadband filters for abatement of spontaneous emission in circuit quantum electrodynamics. Applied Physics Letters, 107:172601, 2015. ISSN 00036951. doi: 10.1063/1.4934867.
- Asfaw et al. [2017] A. T. Asfaw, A. J. Sigillito, A. M. Tyryshkin, T. Schenkel, and S. A. Lyon. Multi-frequency spin manipulation using rapidly tunable superconducting coplanar waveguide microresonators. Applied Physics Letters, 111(3), 2017. ISSN 00036951. doi: 10.1063/1.4993930.
- Vissers et al. [2016] M. R. Vissers, R. P. Erickson, H. S. Ku, Leila Vale, Xian Wu, G. C. Hilton, and D. P. Pappas. Low-noise kinetic inductance traveling-wave amplifier using three-wave mixing. Applied Physics Letters, 108(1), 2016. ISSN 00036951. doi: 10.1063/1.4937922.
- Wilson et al. [2010] C. M. Wilson, T. Duty, M. Sandberg, F. Persson, V. Shumeiko, and P. Delsing. Photon generation in an electromagnetic cavity with a time-dependent boundary. Physical Review Letters, 105(23):1–4, 2010. ISSN 00319007. doi: 10.1103/PhysRevLett.105.233907.
- Wustmann and Shumeiko [2013] Waltraut Wustmann and Vitaly Shumeiko. Parametric resonance in tunable superconducting cavities. Physical Review B - Condensed Matter and Materials Physics, 87(18):1–23, 2013. ISSN 10980121. doi: 10.1103/PhysRevB.87.184501.
- Wang et al. [2020] H. Wang, C. R.H. McRae, J. Gao, M. R. Vissers, T. Brecht, A. Dunsworth, D. P. Pappas, and J. Mutus. Materials loss measurements using superconducting microwave resonators. Review of Scientific Instruments, 91(9), 2020. ISSN 10897623. doi: 10.1063/5.0017378.
- Morton and Bertet [2018] John J.L. Morton and Patrice Bertet. Storing quantum information in spins and high-sensitivity ESR. Journal of Magnetic Resonance, 287:128–139, 2018. ISSN 10960856. doi: 10.1016/j.jmr.2017.11.015. URL https://doi.org/10.1016/j.jmr.2017.11.015.
- Berliner et al. [2006] Lawrence J Berliner, Sandra S Eaton, and Gareth R Eaton. Distance measurements in biological systems by EPR, volume 19. Springer Science & Business Media, 2006.
- Niepce et al. [2020] David Niepce, Jonathan J Burnett, Martí Gutierrez Latorre, and Jonas Bylander. Geometric scaling of two-level-system loss in superconducting resonators. Superconductor Science and Technology, 33(2):025013, 2020.
- Martinis et al. [2005] John M. Martinis, K. B. Cooper, R. McDermott, Matthias Steffen, Markus Ansmann, K. D. Osborn, K. Cicak, Seongshik Oh, D. P. Pappas, R. W. Simmonds, and Clare C. Yu. Decoherence in Josephson qubits from dielectric Loss. Physical Review Letters, 95(21):1–4, 2005. ISSN 00319007. doi: 10.1103/PhysRevLett.95.210503.
- Gao et al. [2008] Jiansong Gao, Miguel Daal, Anastasios Vayonakis, Shwetank Kumar, Jonas Zmuidzinas, Bernard Sadoulet, Benjamin A Mazin, Peter K Day, and Henry G Leduc. Experimental evidence for a surface distribution of two-level systems in superconducting lithographed microwave resonators. Applied Physics Letters, 92(15), 2008.
- Ungerer et al. [2023] Jann H Ungerer, Deepankar Sarmah, Artem Kononov, Joost Ridderbos, Roy Haller, Luk Yi Cheung, and Christian Schönenberger. Performance of high impedance resonators in dirty dielectric environments. arXiv preprint arXiv:2302.06303, 2023.
- Anders et al. [2012] Jens Anders, Alexander Angerhofer, and Giovanni Boero. K-band single-chip electron spin resonance detector. Journal of Magnetic Resonance, 217:19–26, 2012.
- Probst et al. [2015] S Probst, F B Song, P A Bushev, A V Ustinov, and M Weides. Efficient and robust analysis of complex scattering data under noise in microwave resonators. Review of Scientific Instruments, 86:024706, 2015. doi: 10.1063/1.4907935. URL http://dx.doi.org/10.1063/1.4907935.
- Pla et al. [2018] J. J. Pla, A. Bienfait, G. Pica, J. Mansir, F. A. Mohiyaddin, Z. Zeng, Y. M. Niquet, A. Morello, T. Schenkel, J. J.L. Morton, and P. Bertet. Strain-Induced Spin-Resonance Shifts in Silicon Devices. Physical Review Applied, 9(4):44014, 2018. ISSN 23317019. doi: 10.1103/PhysRevApplied.9.044014. URL https://doi.org/10.1103/PhysRevApplied.9.044014.
- Slichter [1996] C P Slichter. Princples of Magnetic Resonance. Springer, Berlin, 3rd ed. edition, 1996.