Impact of the states in the electronic structure of the intermediate-valence superconductor CeIr3
Abstract
The electronic structure of the -based superconductor was studied by photoelectron spectroscopy. The energy distribution of the states were revealed by the resonant photoelectron spectroscopy. The states were mostly distributed in the vicinity of the Fermi energy, suggesting the itinerant character of the states. The contribution of the states to the density of states (DOS) at the Fermi energy was estimated to be nearly half of that of the states, implying that the states have a considerable contribution to the DOS at the Fermi energy. The core-level and X-ray absorption spectra were analyzed based on a single-impurity Anderson model. The number of the states in the ground state was estimated to be , which is much larger than the values obtained in the previous studies (i.e., ).
1 Introduction
is a -based superconductor with a relatively high transition temperature (), and its superconducting properties have attracted much attention in recent years [1, 2, 3, 4]. Its thermodynamical properties and SR measurements suggest is a weak-coupling superconductor with an anisotropic -wave gap [1, 4]. One of the key issues of this compound is the role of the states in superconductivity. Isostructural analogue compounds ( [5, 6]) and ( [7]) also exhibit the superconductivity with similar or higher transition temperatures; hence, the role of the states in the superconductivity of is considered to be negligible [8]. Experimentally, the states in are suggested as an intermediate-valence state, but the occupancy of the states is a matter of controversies. Based on the relationship between the transition temperature and the valence states in alloys, is estimated as [9]. Górnicka et alrecently suggested that based on the weak-temperature-dependent magnetic susceptibility of . They argued that the contributions from the states at the Fermi energy are negligible in this compound [2]. On the contrary, the experimental specific heat coefficient () is much larger than that obtained by the GGA calculation () [2], suggesting that there should be a considerable contribution from the correlated states at the Fermi energy. Gutowska et alrecently calculated the electronic structure of based on the dynamical mean field theory (DMFT) and reproduced the experimental specific heat coefficient and the electron–phonon coupling [10]. Their calculation showed that the states had a finite contribution at the Fermi energy, and its occupation number was . Thus, the nature of the states of this compound is controversial.
In this study, we have investigated the states of by the resonant photoelectron spectroscopy (RPES), X-ray absorption spectroscopy (XAS), and core-level photoelectron spectroscopy. Accordingly, the RPES study shows that the states form a sharp peak at the Fermi energy, suggesting that the states in have a considerable contribution to the Fermi energy despite the stronger contribution from the states. The results of the analysis of the XAS and core-level spectra based on the single-impurity Anderson model reveal that , contrast to the predictions of the previous studies [2, 9]. These results argue that the states are in an intermediate-valence state, and the contribution from the states to superconductivity is not negligible in .
2 Experimental Procedure
Single crystals of were prepared using the Czochralski method in a tetra arc furnace under Ar atmosphere. The details of the sample growth and their characterizations were presented in Refs. [1, 3, 11]. Photoemission experiments were performed at the soft X-ray beamline BL23SU of SPring-8 [12]. The total energy resolution at the on-resonant condition () was approximately , while that in the core-level measurements was approximately . Clean sample surfaces were obtained by cleaving high-quality single crystals in situ under an ultra-high vacuum condition. The sample temperature was kept at during the measurements.
3 Results and Discussion
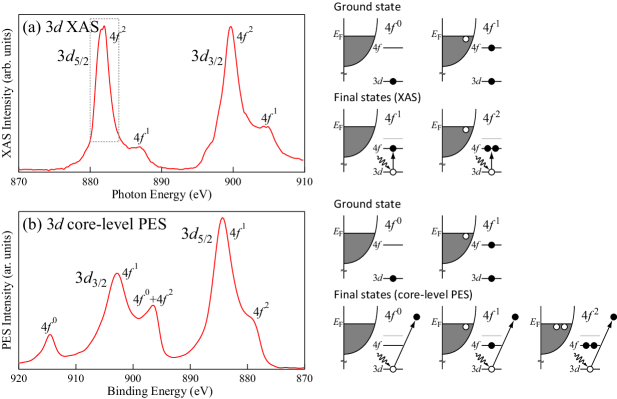
Figure 1 shows the XAS and core-level spectra of together with the schematic figures of their ground and final states in the XAS and core-level spectra. Figure 1 (a) depicts the XAS spectrum of consisting of and components. Each had and final-state peaks. The and peaks originated from the transitions from the and configurations in the ground state, respectively. The existence of these two peaks indicated that the states in are in an intermediate-valence state. Figure 1(b) shows the core-level spectrum of . The photon energy was . The spectrum was essentially consistent with that in a previous XPS study [2]; however, each peak was well resolved by the better energy resolution in the present experiment. The peak originates from the configuration in the ground state. The enhanced intensity of the peak again suggested that the states were in a strong mixed valence state. The calculation based on the single-impurity Anderson model suggested that , where is the final-state peak intensity [13]. Thus, of should be close to, but less than unity in the present case. The final-state peak intensity was enhanced in the spectrum and was much stronger than in the case of heavy fermion compounds as an example [14]. The final-state peak intensity is more enhanced in a more hybridized compound [15]; hence, the enhanced intensity in indicates the existence of a strong hybridization in . The later part of this section will present a detailed analysis of these spectra.
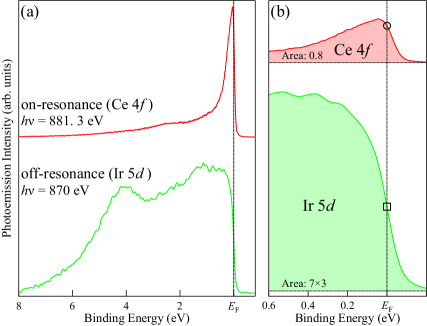
Figure 2 summarizes the RPES measurement of . Figure 2 (a) shows the on- and off-resonance photoemission spectra of measured at and , which reflects contributions mainly from the and states, respectively [16]. The states form a very sharp peak at the Fermi energy, indicating its considerable contribution to this energy. Meanwhile, a weak hump structure was found to exist around . This was assigned to the contribution from the configuration in the final state. In contrast to the states, the states form a broad band structure distributed in a wide energy range, with an overall spectral shape consistent with the GGA [2] and DFT + DMFT calculations [10]. We attempted herein to estimate the practical contributions from each orbital at the Fermi energy. Figure 2 (b) depicts the on- and off-resonance spectra in the very vicinity of the Fermi energy. The areas of the spectra were normalized to the nominal numbers of the electrons of the and states in (). The and the spectra intensities can be directly compared. In practice, the occupation number of the states in is estimated to be approximately 0.8 as we shall discuss later. Both the and states have considerable contributions to the Fermi energy. The contribution from the states at the Fermi energy was approximately 44 % of that from the states; thus, the contribution from the states at the Fermi energy was estimated to be approximately 31 % of the total DOS. Note that the states could form a very narrow peak at the Fermi energy, but might be smeared out by the present energy resolution (). In this case, the substantial contribution from the states may be higher than this estimation.
A further interesting point was that we found no trace of the spin-orbit-coupled multiplet, located at . The multiplet originates from the final state effect, and its intensity becomes weaker than that of the peak at in the Ce compound with higher Kondo temperature () [17]. Thus, the existence of the sharp peak at and the absence of the multiplet peak in the spectrum indicate that is very high in this compound. The spectral shape of the spectrum is very similar not with the GGA calculation [2], but with the DMFT calculation [10]. This is consistent with the itinerant but correlated nature of the states in .
We tried qualitatively understand the core-level and XAS spectra by analyzing them based on the single-impurity Anderson model (SIAM) [18, 19, 20]. The Hamiltonian of the system is given as
| (1) |
where
| (2) | |||||
and
| (3) | |||||
describes the SIAM with the valence band level , level and level . , , and are the electron creation operators in these states. denotes the energy level index () in the valence band. and denote the combined indices to specify both the spin and orbital degeneracies of the () and () states with the numbers of the degeneracy of and , respectively. represents the multiplet coupling effect described by Slater integrals , , and between electrons (), the Slater integrals , , , , and between the electrons and the core hole (), and the spin-orbit interactions of the states () and the states (). The Slater integrals were reduced down to 80% of its atomic Hartree–Fock values, which are calculated by using the Cowan program [21]. The valence band energies were taken as
| (4) |
where and are the center and width of the valence band, respectively. The and values were and , respectively. The core-level () and XAS () spectral functions are given as follows:
| (5) |
| (6) |
where , , and are the binding energy of the photoelectrons, photon energy, and optical dipole transition from the to states, respectively. Note that in Eqs. (5) and (6) represent and electron states, respectively
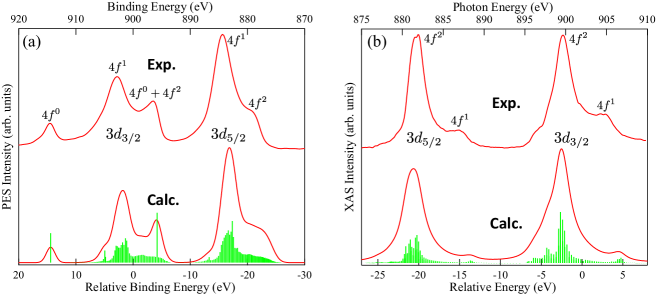
Figure 3 shows the analysis result of the (a) core-level and (b) XAS spectra. We used the following parameters here: ; ; ; and . The ratios of the , , and configurations in the ground state were 0.111, 0.812, and 0.077, respectively. The occupation number of the states in the ground state was . Figure 3 (a) compares the experimental core-level spectrum of and the analysis result. The histogram represents the matrix elements in the calculation. The curves depict the spectra with the life–time broadening represented in Eqs. (5) and (6). The experimental spectrum was reproduced well by the SIAM using these parameters. Figure 3(b) displays the result of the XAS spectrum calculated by the same parameter set. The overall spectral shape was mostly reproduced by the calculation [18], but some discrepancies were found between the experiment and the calculation. In particular, the peak intensity of peak was weaker, and its peak position was located at the deeper–photon energy side in the calculation when compared to the experiment. To reproduce the XAS spectrum, we took a different parameter set, especially for [22]. This problem is presumably caused by the presence of two different sites in this compound and not considered in the present analysis. Even in the case of the XAS spectrum parameters, the occupation number of the states was estimated to be 0.766; and thus, should be in both cases.
Previous studies have suggested that the DOS at are dominated by the states, and has been considered a superconductor dominated by the bands. However, the present study revealed that the states contribute significantly to the DOS at and thus to the superconductivity. Therefore, is a -wave superconductor with a considerable contribution as in the case of [23].
Accordingly, all these results suggest that the states have an itinerant character, and a considerable contribution to the Fermi energy. The occupation number of the states in the ground state is estimated to be , which was larger than that in the previous studies.
4 Conclusion
We studied the electronic structure of by the resonant photoelectron, XAS, and core-level spectroscopies. All experimental data suggested the well-hybridized nature of the states with the occupation number of , which was consistent with the DMFT calculation result [10]. The comparison of the intensities at the Fermi energy of the on- and off-resonance spectra suggested that more than 30 % of the DOS at the Fermi energy was contributed by the states. These results claimed a finite contribution of the states on the superconductivity of . Thus, is an -wave-type superconductor with a finite contribution from the states.
Appendix A Influence of Auger processes in RPES spectra
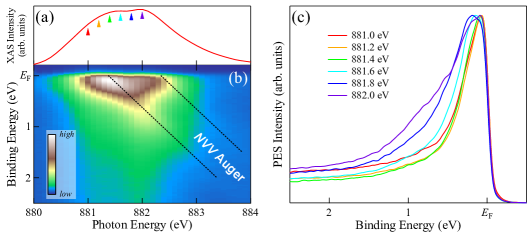
The contribution from the Auger signals in the resonant photoemission spectrum of the -based compounds was recognized [24, 25, 26], and an appropriate selection of excitation energies is required for the measurement of the on-resonant photoemission spectrum. In this appendix, we describe the influence of Auger signals in the resonant photoemission spectra. Figures 4 (a) and (b) show the XAS and the density plot of the valence band spectra measured at , respectively. The gigantic resonant enhancement of the signals at the absorption edge was recognized at approximately . Meanwhile, two diagonal lines were recognized in Fig. 4(b), as indicated by the dotted lines, which depict the contributions from the Auger signals. The resonant photoemission spectra measured at normalized by the peak height of each spectrum is displayed in Fig. 4(c) to examine the impact of the Auger signals on the spectral profiles. The spectral shapes of the resonance spectra measured at were almost identical, but the higher-binding-energy side of the spectrum was broadened as the photon energy was further increased. This broadening was the contribution of the Auger signals; thus, the on-resonant spectrum should be measured at . We have used the incident photon energy of for the on-resonance spectrum to avoid the contribution from the Auger signals in the valence-band spectrum.
References
References
- [1] Sato Y J, Nakamura A, Shimizu Y, Maurya A, Homma Y, Li D, Honda F and Aoki D 2018 J. Phys. Soc. Jpn. 87 053704
- [2] Górnicka K, Carnicom E M, Gołab S, Łapiński M, Wiendlocha B, Xie W, Kaczorowski D, Cava R J and Klimczuk T 2019 Supercond. Sci. Technol. 32 025008
- [3] Sato Y J, Honda F, Shimizu Y, Nakamura A, Homma Y, Maurya A, Li D, Koizumi T and Aoki D 2020 Phys. Rev. B 102 174503
- [4] Adroja D T, Bhattacharyya A, Sato Y J, Lees M R, Biswas P K, Panda K, Anand V K, Stenning G B G, Hillier A D and Aoki D 2021 Phys. Rev. B 103 104514
- [5] Haldolaarachchige N, Schoop L, Khan M A, Huang W, Ji H, Hettiarachchilage K and Young D P 2017 J. Phys. Condens. Matter 29 475602
- [6] Bhattacharyya A, Adroja D T, Biswas P K, Sato Y J, Lees M R, Aoki D and Hillier A D 2019 J. Phys. Condens. Matter 32 065602
- [7] Górnicka K, Das D, Gutowska S, Wiendlocha B, Winiarski M J, Klimczuk T and Kaczorowski D 2019 Phys. Rev. B 100 214514
- [8] Huber J 1990 Physica B 163 219
- [9] Hakimi M and Huber J 1985 Physica B+C 135 434
- [10] Gutowska S and Wiendlocha B 2022 J. Magn. Magn. Mater. 547 168917
- [11] Sato Y J, Shimizu Y, Honda F, Nakamura A, Homma Y, Maurya A, Li D and Aoki D 2020 JPS Conf. Proc. 29 011007
- [12] Saitoh Y, Fukuda Y, Takeda Y, Yamagami H, Takahashi S, Asano Y, Hara T, Shirasawa K, Takeuchi M, Tanaka T and Kitamura H 2012 J. Synchrotron Rad. 19 388
- [13] Gunnarsson O and Schönhammer K 1983 Phys. Rev. B 28 4315
- [14] Treske U, Khoshkhoo M S, Roth F, Knupfer M, Bauer E D, Sarrao J L, Büchner B and Koitzsch A 2014 J. Phys. Condens. Matter 26 205601
- [15] Fuggle J C, Hillebrecht F U, Zołnierek Z, Lässer R, Freiburg C, Gunnarsson O and Schönhammer K 1983 Phys. Rev. B 27 7330
- [16] Yeh J and Lindau I 1985 Atomic Data and Nuclear Data Tables 32 1
- [17] Kasai S, Imada S, Yamasaki A, Sekiyama A, Iga F, Kasaya M and Suga S 2007 J. Electron Spectrosc. Relat. Phenom. 156-158 441
- [18] Nakazawa M, Tanaka S, Uozumi T and Kotani A 1996 J. Phys. Soc. Jpn. 65 2303
- [19] Kotani A and Shin S 2001 Rev. Mod. Phys. 73 203
- [20] De Groot F and Kotani A 2008 Core level spectroscopy of solids (CRC press)
- [21] Cowan R D 1981 The theory of atomic structure and spectra (Univ of California Press)
- [22] See supplementary materials for detailed information.
- [23] Kiss T, Kanetaka F, Yokoya T, Shimojima T, Kanai K, Shin S, Ōnuki Y, Togashi T, Zhang C, Chen C T and Watanabe S 2005 Phys. Rev. Lett. 94(5) 057001
- [24] Cho E J, Jung R J, Choi B H, Oh S J, Iwasaki T, Sekiyama A, Imada S, Suga S, Muro T, Park J G and Kwon Y S 2003 Phys. Rev. B 67 155107
- [25] Jung R J, Choi B H, Oh S J, Kim H D, Cho E J, Iwasaki T, Sekiyama A, Imada S, Suga S and Park J G 2003 Phys. Rev. Lett. 91 157601
- [26] Fujimori S i 2016 J. Phys. Condens. Matter 28 153002