InterVLS: Interactive Model Understanding and Improvement with Vision-Language Surrogates
Abstract.
Deep learning models are widely used in critical applications, highlighting the need for pre-deployment model understanding and improvement. Visual concept-based methods, while increasingly used for this purpose, face challenges: (1) most concepts lack interpretability, (2) existing methods require model knowledge, often unavailable at run time. Additionally, (3) there lacks a no-code method for post-understanding model improvement. Addressing these, we present InterVLS. The system facilitates model understanding by discovering text-aligned concepts, measuring their influence with model-agnostic linear surrogates. Employing visual analytics, InterVLS offers concept-based explanations and performance insights. It enables users to adjust concept influences to update a model, facilitating no-code model improvement. We evaluate InterVLS in a user study, illustrating its functionality with two scenarios. Results indicates that InterVLS is effective to help users identify influential concepts to a model, gain insights and adjust concept influence to improve the model. We conclude with a discussion based on our study results.
1. Introduction
Deep Learning (DL) models are increasingly applied in industrial applications, such as autonomous driving, medical imaging, and cyber attack detection (He et al., 2021; Gou et al., 2020; Dong et al., 2021; Borg et al., 2018). The critical nature of these applications give rise to the need of pre-deployment model validation – model understanding and improvement. However, the growing intricacy of DL models makes validation challenging (Borg et al., 2018). In response, practitioners and researchers have turned to eXplainable AI (XAI) methods that shed light on the “black-box” DL models’ behavior (Panigutti et al., 2020). These methods can facilitate model understanding and help identify discrepancies between machine logic and human rationale, aiding in model validation. The insights derived from the explanation may further enable practitioners to improve models efficiently.
Visual concept-based XAI methods have gain traction for their clarity and scalability to various data granularities (global, class, and instance level) (Huang et al., 2022; Park et al., 2021), overcoming limitations of traditional methods that can only account for instances (Selvaraju et al., 2017; Zhou et al., 2016; Saha et al., 2020; Simonyan et al., 2013; Fong and Vedaldi, 2017). Visual concepts consist of image segments that share the same semantic meaning, like various television stand image patches together representing the concept of a television stand. Using these explanations, users can assess how much a specific concept, such as the television stand, influences a DL model’s detection of the tv monitor class and track the concept’s occurrence instances. This insight clarifies the alignment and misalignment between model logic and human rationale, enabling efficient model understanding (Ehsan et al., 2023).
Despite the strengths of visual concepts in facilitating model understanding, their adoption in model validation faces three challenges: (1) Current automatic concept discovery methods cannot provide clear explanations (e.g., text descriptions) for the discovered concepts, making them less “interpretable” than expected (Ghorbani et al., 2019). This can lead to subjective interpretation and reduces the reliability of insights. (2) Existing methods to measure concept influence demands knowledge about model architectures, often unavailable during validation. (3) After understanding the model through visual concepts, users lack an efficient way to apply their derived insights for model improvement “on the fly”. This gap means users have to manually code solutions based on their findings, limiting the impacts of explanations.
To address these challenges, we present InterVLS, a novel visual analytics approach to streamline the model validation workflow through model-agnostic surrogates with self-explanatory vision-language concepts, enabling effective understanding and real-time improvement.
We first employ the state-of-the-art CLIP-S4 model (He et al., 2023) to derive text-aligned visual concepts. On top of these, we develop model-agnostic explanations using linear surrogates. These linear surrogates are trained to utilize visual concepts to imitate the target model’s behavior across classes. Each surrogate’s weight represent the collective influence of concepts on a class, allowing effective understanding of DL model’s internal mechanics and efficient insight acquisition.
For real-time model improvement after understanding, we develop a fine-tuning process where users can dictate which concepts to uptune (increase influence) or downtune (decrease influence). These user choices then act as training constraints for the surrogate model’s automated adjustments. This strategy is integrated within a no-code interactive framework: For example, if user notices the model’s underperformance in the tv monitor class due to its oversight of the television stand concept, they can emphasize the television stand concept by augmenting its influence. Consequently, the updated model will attend more to the television stand concept when detecting tv monitor.
In summary, our paper makes the following contributions:
-
•
InterVLS, a novel visual analytics system for model validation that uses surrogate models built on top of vision-language concepts to support efficient model understanding and real-time model improvement.
-
•
A model-agnostic method to access concept influence using linear surrogates. This method quantifies discovered concept occurrences in instances and trains linear surrogates to emulate the target model’s predictions using concept presences as input. After training, the surrogate weights inherently represent each concept’s influence, providing model-agnostic explanations for the target model’s behavior.
-
•
A no-code workflow – concept tuning – that lets users improve a model’s performance based on derived concept insights. Users can specify which concepts to emphasize or de-emphasize, and the model updates in response.
-
•
A user study that evaluates system’s usability and efficiency, supplemented by two usage scenarios demonstrating its practical applications.
We believe that InterVLS is the first visual analytics approach that leverages interpretable visual concepts for no-code model validation. This work aligns with the current industry’s shifts towards automation in model validation process. It also explores new research opportunities for using visual analytics approaches to enable the efficient execution of actionable insights through model agnostic surrogate-based fine-tuning.
2. Related Work
In this section, we review related work in model validation, model-agnostic explanations, visual concepts and their application in visual analytics.
2.1. Model-agnostic Explanations
In XAI, tools fall into two categories: model-specific and model-agnostic. Model-specific tools, such as many concept-based methods (Park et al., 2021; Huang et al., 2022; Kim et al., 2018), provide detailed insights but can be restrictive, especially when model information is not available. On the other hand, model-agnostic tools use simpler surrogate models to explain a target model. LIME(Ribeiro et al., 2016), for example, leverages a surrogate linear model and proximity sampling to offer feature-importance insights. Another commonly used tool, SHAP(Lundberg and Lee, 2017), uses Shapley values from coalition game theory to interpret feature contributions. However, both tools have potential for misinterpretation (Saleem et al., 2022) and often focus on local subset explanations (Hadash et al., 2022), constraining their application to broader data granularities, like class-level interpretations.
Our research aims to create model-agnostic explanations adaptable to different data granularities utilizing the scalability of the concept-based approach, reducing its model-specific limitations. Inspired by the Concept Bottleneck Model (Koh et al., 2020), we train linear surrogates to mimic the original model by evaluating image concepts. Post-training, the surrogate weights inherently indicate concept influences.
2.2. Visual Analytics for Model Validation
Several visual analytics methods have been emerged for model validation (De Oliveira and Levkowitz, 2003; Keim, 2002; Yi et al., 2007). However, many primarily help users understand tabular data and the corresponding ML model responses. For example, CoFact (Kaul et al., 2021) enables users to explore counterfactual subsets to understand model behavior on large datasets. FairVis (Cabrera et al., 2019) and (Zhang et al., 2018) support interactive subgroup analysis but don’t offer automated detection of problematic subgroups. These tools often focus more on data slicing rather than facilitating model understanding. SliceTeller (Zhang et al., 2022) attempts to address both data understanding and model improvement for challenging data slices but is tailored for tabular data and traditional ML rather than DL. Its reliance on manually curated metadata also limits scalability and broad application.
Our system, different from previous methods, uses model-agnostic concept explanations for DL model validation. It uses concepts with enhance interpretability to help users identify problematic subsets and concepts. Additionally, we introduce a concept tuning method, allowing users to adjust the model based on concept insights, completing the validation process.
2.3. Visual Concept-based Explanations
Visual concepts are intuitive proxies for explaining DL models in vision tasks (Hoque et al., 2022). While conventional perturbation-based methods (Fong and Vedaldi, 2017; Selvaraju et al., 2017; Simonyan et al., 2013; Zhou et al., 2016) lack scalability and reliability (Kindermans et al., 2019), concept-based explanation (Kim et al., 2018; Huang et al., 2022; Park et al., 2021; Bau et al., 2017) approaches are able to provide straightforward explanations that scale to various data granularities. Most research in visual concept explanations fits into these two lines of research – concept influence measurement and automatic concept discovery.
Existing methods for measuring concept influences (Kim et al., 2018; Park et al., 2021; Yeh et al., 2020) assess influences at an intermediate layers of bottleneck-shaped neural networks. Such methods often rely on knowledge of a model’s architecture, which may not be accessible to model validators. In contrast, our system addresses this gap by training model-agnostic linear surrogate to mimic the target model, with the trained weights intrinsically capturing concept influence.
Existing research on automatic concept discovery primarily extracts concepts from images by using superpixels (Ghorbani et al., 2019), prototypes (Chen et al., 2019), object part dictionaries (Huang and Li, 2020), and pixel-concept priors (He et al., 2022). However, the derived concepts often lack inherent explanability due to the absence of textual descriptions, compromising their effectiveness. In contrast, our system utilizes the state-of-the-art CLIP-S4 method (He et al., 2023), developed based on vision-language pretraining, to extract text-aligned concepts, ensuring their self-explanability and facilitating subsequent concept-driven model improvement.
2.4. Visual Analytics with Interpretable Concepts
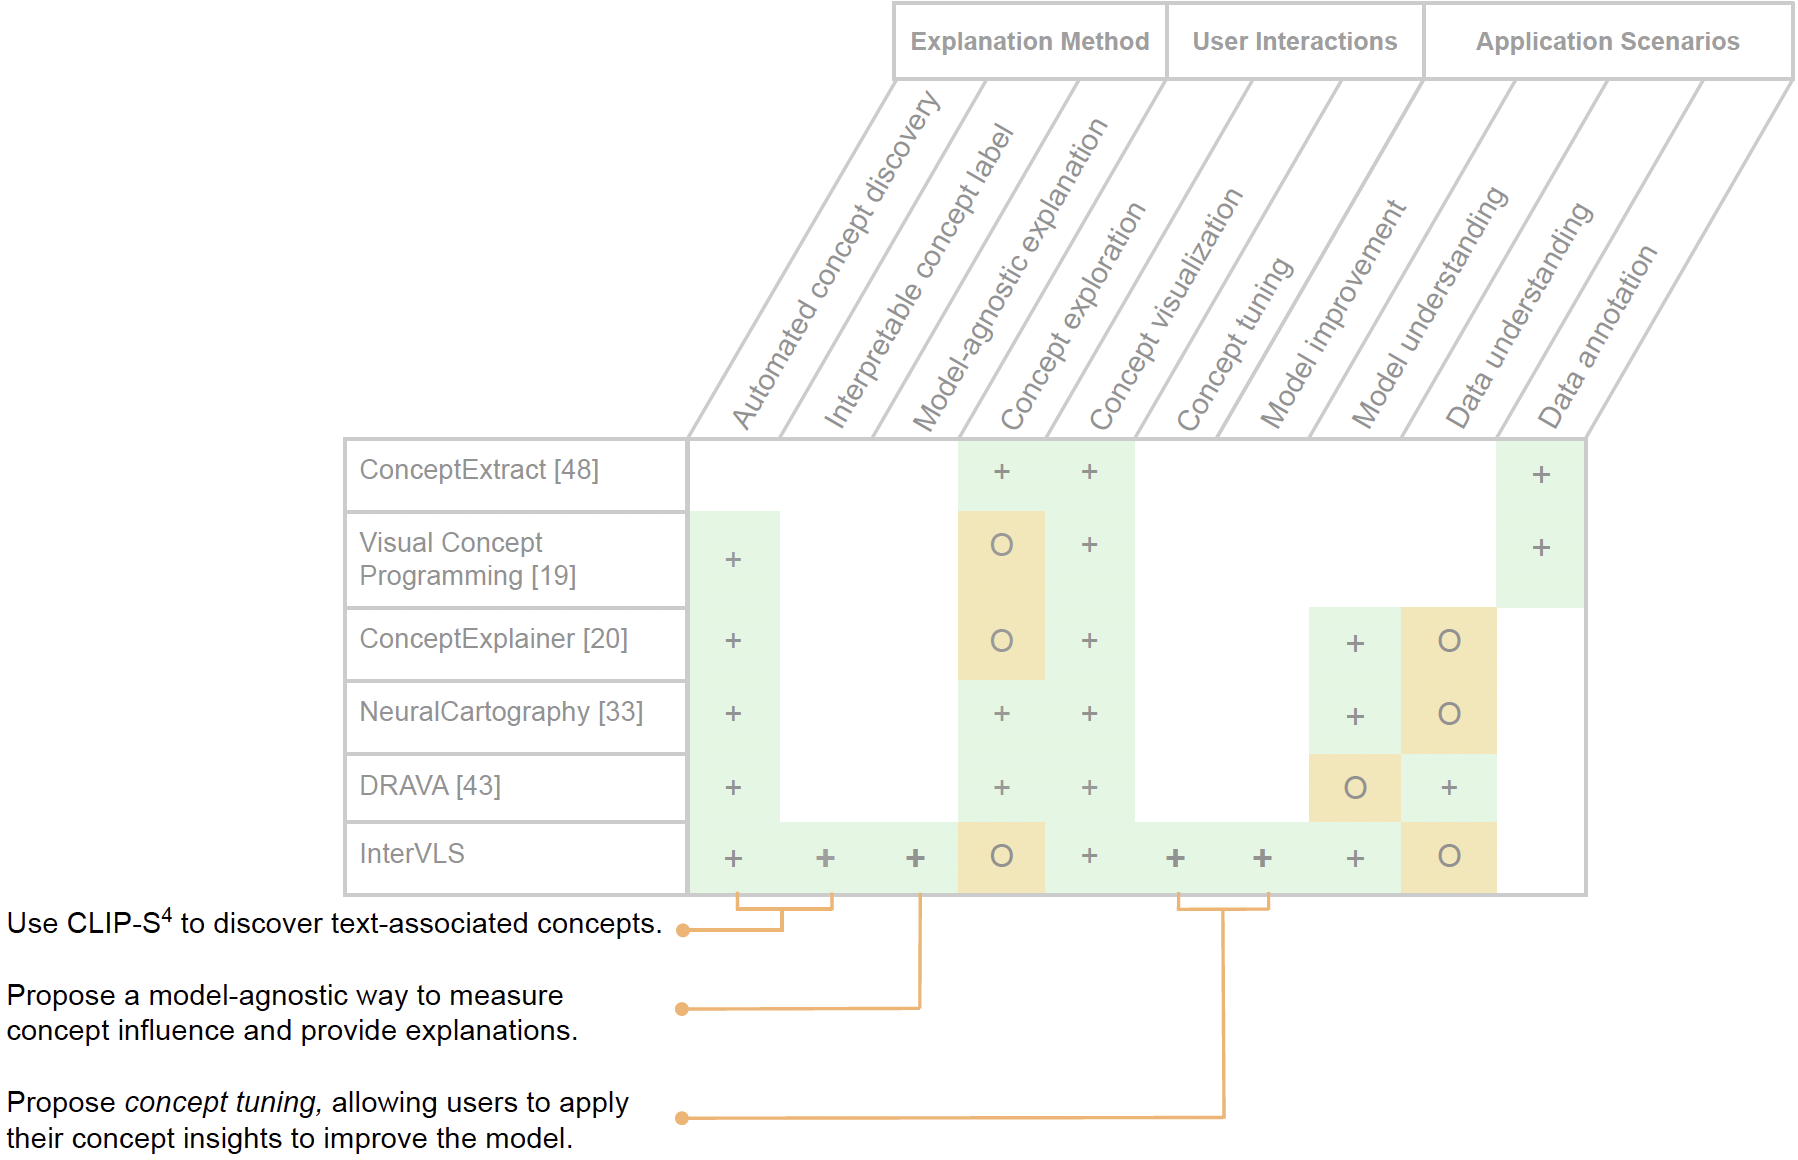
Visual analytics applications have increasingly adopted interpretable visual concepts for various tasks in the DL production life cycle, such as data annotation (Hoque et al., 2022; Zhao et al., 2021), exploration (Wang et al., 2022), and model explanation (Huang et al., 2022; Park et al., 2021).
ConceptExtract (Zhao et al., 2021) provides an interactive method to support human supervision in concept discovery, aiming to enhance concept quality. Visual Concept Programming (Hoque et al., 2022) introduces a method to support scalable image data annotation with minimum human efforts. It lets user define concept-based labeling rules and automatically labels data points that match specific concept profiles. However, these systems primarily address data annotation, not the more complex process of model validation which focuses on understanding and improvement.
To support data exploration, Drava (Wang et al., 2022) employs disentangled representation learning to produce interpretable concepts and enable concept-driven data exploration through small multiples. For model understanding, NeuroCartography (Park et al., 2021) utilizes neuron clustering and embeddings derived from pairwise neuron relationships to efficiently visualize concepts understood by neural networks, while ConceptExplainer (Huang et al., 2022) uses a structured system to probe a DL model’s concept space, offering insights into model behavior across different data granularities via visual interface.
These methods depend heavily on model-specific concept discovery, which limits their application in real-world model validation scenarios, where model knowledge is often unavailable. Moreover, the concepts they employ lack immediate interpretability, due to the lack of text descriptions. While these methods do offer insights,they do not provide ways to convert insights into actionable steps like model improvement, leaving the model validation process incomplete. In contrast, our work introduces a comprehensive workflow that not only supports model-agnostic, concept-driven model understanding but also facilitates no-code, real-time model improvements (See Fig. 2).
3. Design Requirements
We identify a salient set of design challenges (C1–C4) which are important for interactive model understanding and improvement using visual-language surrogates. We distill these into a set of four design goals (G1–G1), which we use to guide InterVLS’s development.
3.1. Design Challenges
Our objective is to develop an interactive system that utilizes interpretable visual concepts to support model understanding and immediate model improvement with minimal human efforts, and hence completes the model validation loop. To this end, we have identified four key design challenges based on previous visualization research on model validation (Zhang et al., 2022; Kaul et al., 2021; Cabrera et al., 2019; Hohman et al., 2018, 2019; Samek et al., 2021).
(C1) Ambiguious concept explanations. Concept-based explanations are intuitive and scalable, but many existing methods cannot provide textual descriptions for the concepts. This absence makes the concepts harder to understand, ironically rendering supposedly “explainable” concepts ambiguous. Addressing this limitation is crucial to enhance the utility of concept-based explanations.
(C2) Dependence on model knowledge. Identifying influential concepts (C1) and quantitatively measure their influence are foundational to concept explanation methods. However, most existing methods require prior knowledge of the model, such as information of its architecture or latent layers (Kim et al., 2018; Yeh et al., 2020; Park et al., 2021). This information might not always be available to those performing model validation, limiting the application of concept methods in model validation. Model-specific method also inherently lack scalability as they are tailored to one model. Therefore, a model-agnostic approach is necessary.
(C3) Concept-Performance Correlation. Effective model validation should highlight how certain concepts affect performance. The challenge is to design an interface that clearly presents concept-based performance insights. For example, if performance inconsistencies arise from varying concept occurrences, the system should identify and report these concepts, also suggesting actionable steps based on the findings.
(C4) Lack of means to model improvement. Closing the loop for model improvement remains a challenge. While explanations can provide valuable insights, there is a notable lack of mechanisms to seamlessly convert these insights into tangible model improvement. As a result, users often have to manual code their insights to realize improvements, which is not only inefficient but also diminishes the value of the initial insights.
3.2. Design Goals
In addressing the aforementioned challenges, we have defined five design goals for the InterVLS system to support interactive model validation:
(G1) Leverage vision-language models. We aim to leverage vision-language pre-training to align concept image patches with text, removing subjective interpretations that may compromise the quality of concept explanations (C1). To this end, we employ the state-of-the-art CLIP-S4 method to automatically discover text-aligned concepts.
(G2) Train self-explainable surrogates. To achieve model-agnostic concept influence measurement and avoid dependence on model knowledge (C2), we train explainable surrogates and use their weights to quantify concept influences. We design our surrogate models to be simplistic so as to keep the explanations straightforward.
(G3) Efficient performance analysis through concepts. Our goal is to connect model explanations directly to actionable insights and eventually to improvement steps. The system provides a performance overview, highlighting areas of concern. Through visualizing main concepts and their impacts, users can quickly spot potential model flaws (C3). For instance, the buffet concept is often linked with the dining table class. But a model that places too much weight on the buffet might wrongly identify images with only a buffet as having a dining table. By noting such patterns, users can determine where the model needs adjustments.
(G4) Prevent fallacious insights Besides board concept-based insights (G3), we also aim to provide tools to prevent fallacious insights by letting users investigate concept details to confirm or nullify their findings (C3). To this end, our system provides additional performance metrics for each concept and the context scenes where the concepts are extracted. This functionality is accessible only on user demand, ensuring a streamlined workflow.
(G5) Interactive model improvement on-the-fly. We aim to close the loop for model validation by enabling various insights from text-aligned concepts (C1-C3) and follow up with a no-code workflow that turns these insights into action – model improvement “on the fly” (C4). We propose concept tuning, a method that takes in user-specified concept tuning instructions, and automatically fine-tunes the model. Updated performance results is present to the user in real time. More details on this process can be found in section 4.5
4. Method
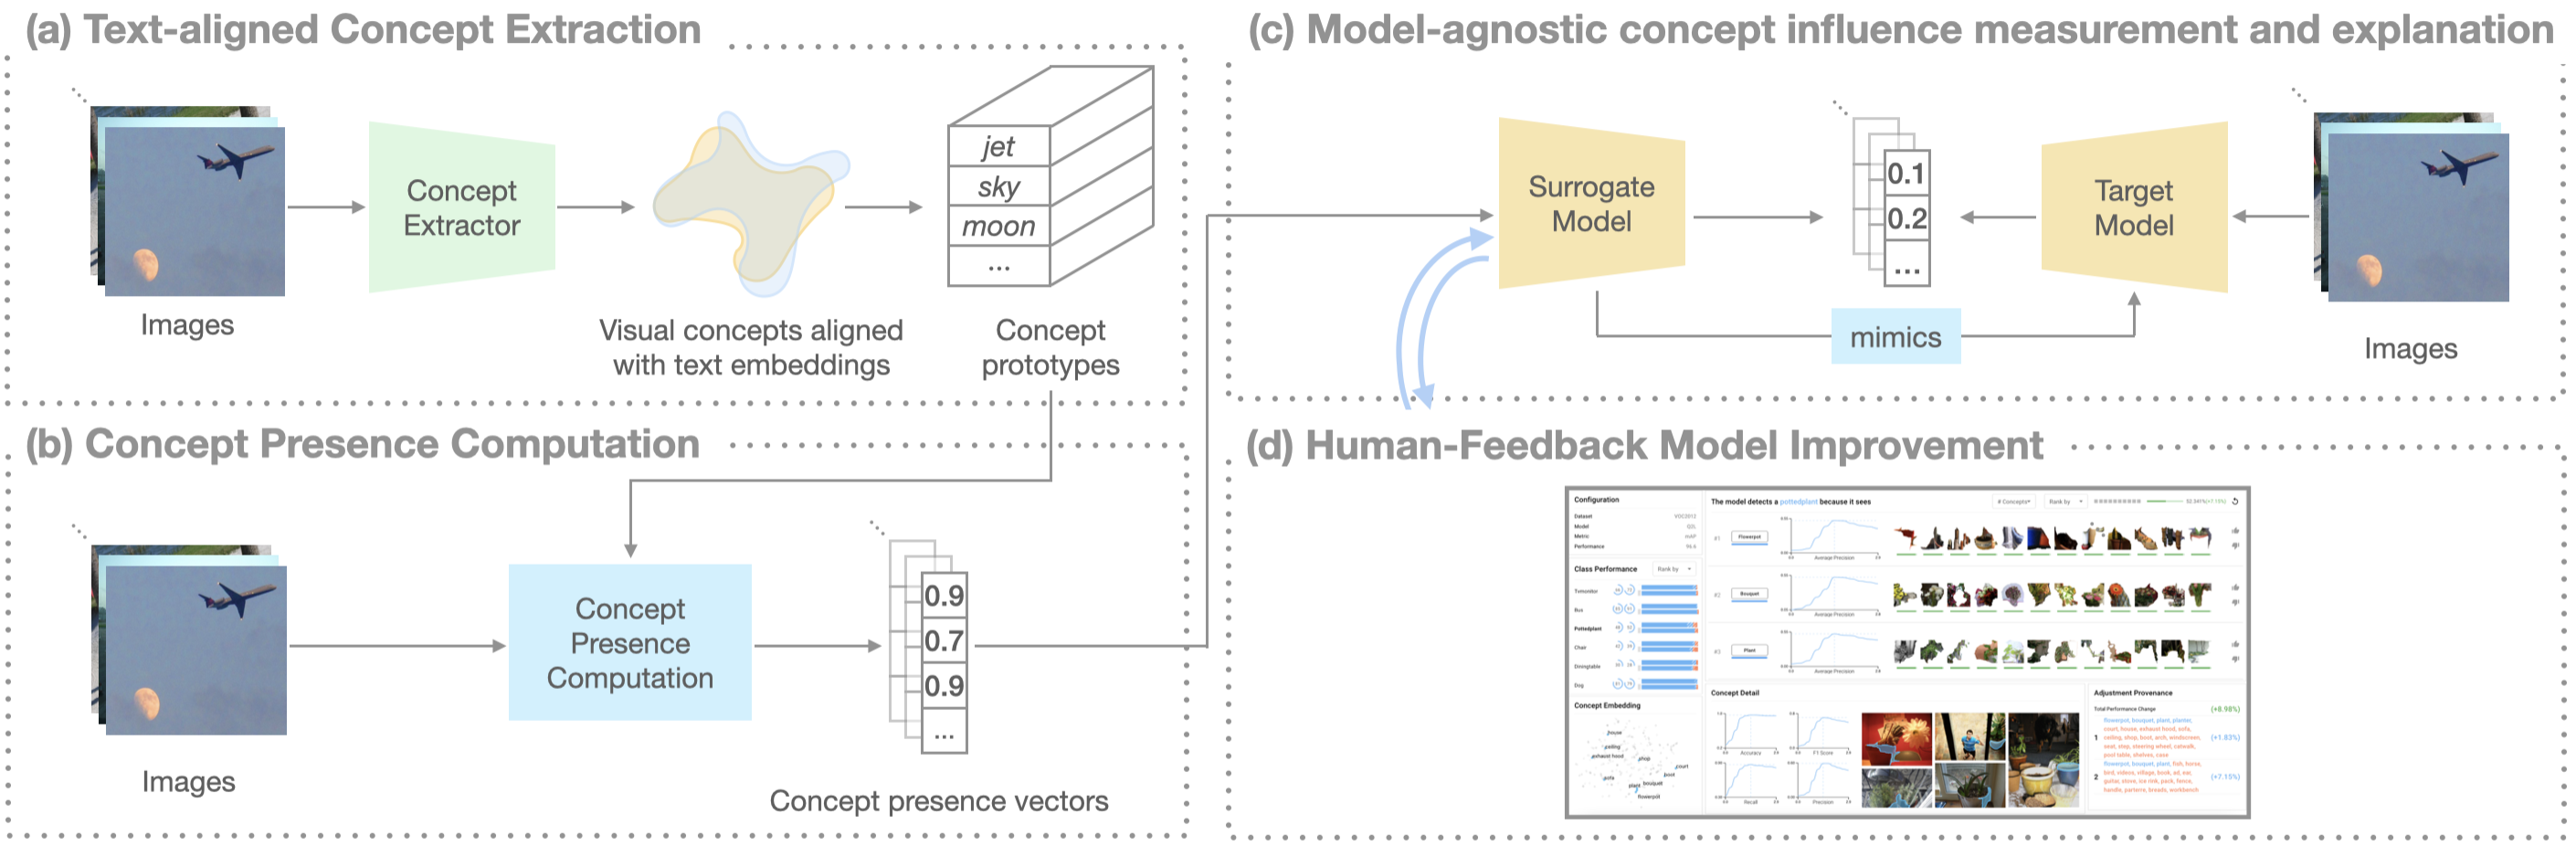
Following our design goals (Section 3), we develop a visual analytics framework InterVLS, which consists of four components as shown in Fig. 3. InterVLS first discovers text-aligned visual concepts using CLIP-S4 (He et al., 2023) (G1). It then quantifies each concept’s presence in every image in concept presence vectors (G3). Using these vectors, it trains model-agnostic linear surrogate models (G2) that mimic the target model to measure concept influences (G3). The concept-based explanations are then integrated into a visual interface (Section 5) to help users understand and interactively improve the target model. This is facilitated by the concept tuning process, which translates user feedback into training constraints and fine-tunes the surrogate models (G4).
4.1. Background
We use multi-label classification to demonstrate our proposed approach, given its complexity and broad high-stake, real-world implications, such as in airport security inspection (Vluymans et al., 2018). Multi-label classification is intricate due to images often having multiple labels (e.g., an image can have more than 10 different objects within), which can lead to class imbalance as some labels may be more prevalent than others. This complexity, combined with the prevalence of certain labels over others, makes achieving consistent accuracy across all labels a challenge.
To illustrate how our system facilitates model understanding and improvement, we apply it on the Q2L model (Liu et al., 2021). This state-of-the-art model has consistently shown top-tier performance in several multi-label classification benchmarks, ranking first in NUS-WIDE, PASCALVOC 2007, and PASCALVOC 2012, and fifth in MS-COCO. In subsequent sections, we refer to the Q2L model as our target model. Its architecture, which consists of a spatial feature extraction backbone and multiple concatenated transformer decoders for query and pooling, is inherently difficult to explain.
4.2. Text-Aligned Concept Discovery
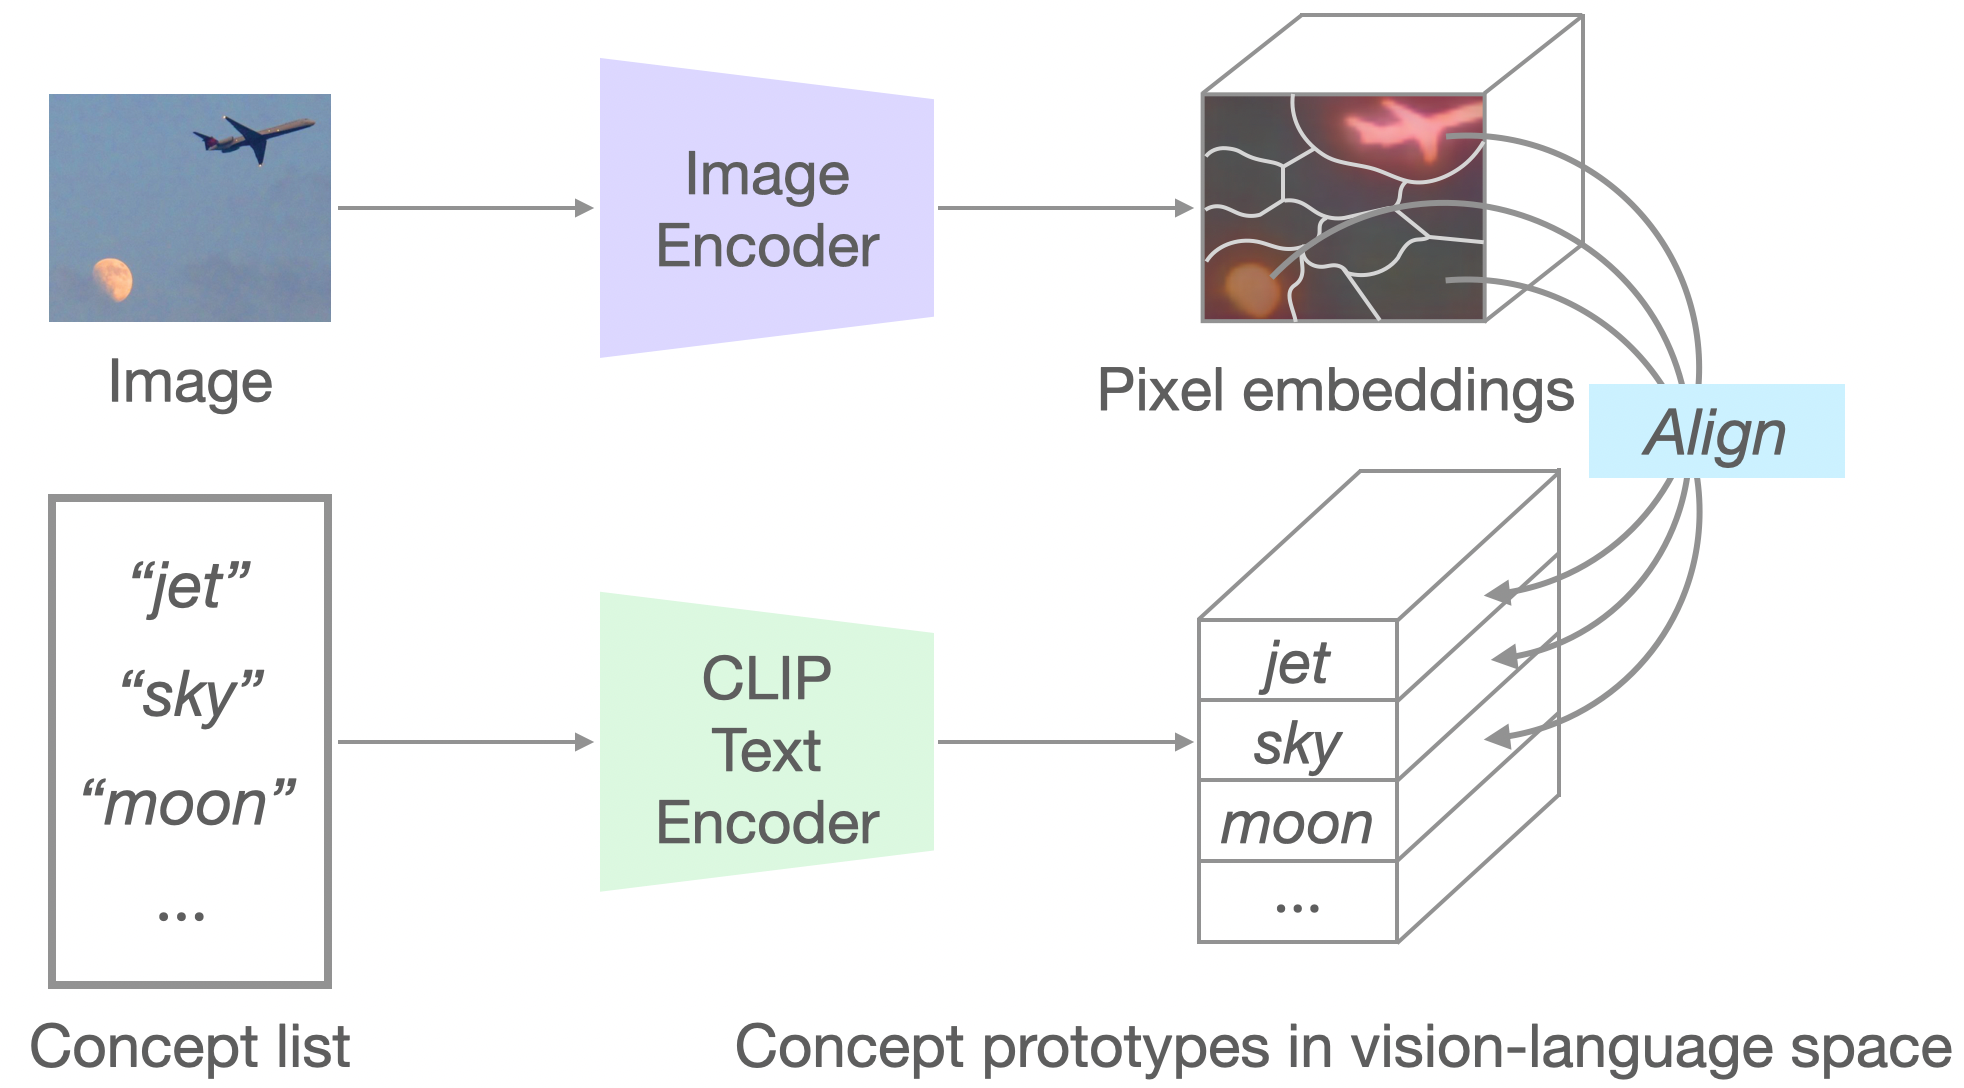
We extract text-aligned visual concepts (G1) as illustrated in Fig. 4 using the CLIP-S4 method(He et al., 2023). Initially, we use a pretrained image encoder to transform an image into pixel-wise embeddings. These embeddings then assist in segmenting the image into semantically coherent regions. For each segment, we use the encoder to derive its embedding by averaging the pixel embeddings contained within.
Next, we proceed to align the segment embeddings with concepts defined through texts. We derive these concept embeddings by processing texts with a pre-trained language model, notably CLIP’s text encoder (Radford et al., 2021). To establish alignment, we co-train the concept extractor and image encoder, aiming to minimize the distance between the segment embeddings and corresponding concept vectors. After this training process, we can produce pixel/segment embeddings in a combined image-text space, thereby associating image segments with their respective text concepts. For an in-depth explanation, refer to (He et al., 2023).
4.3. Concept Presence Computation
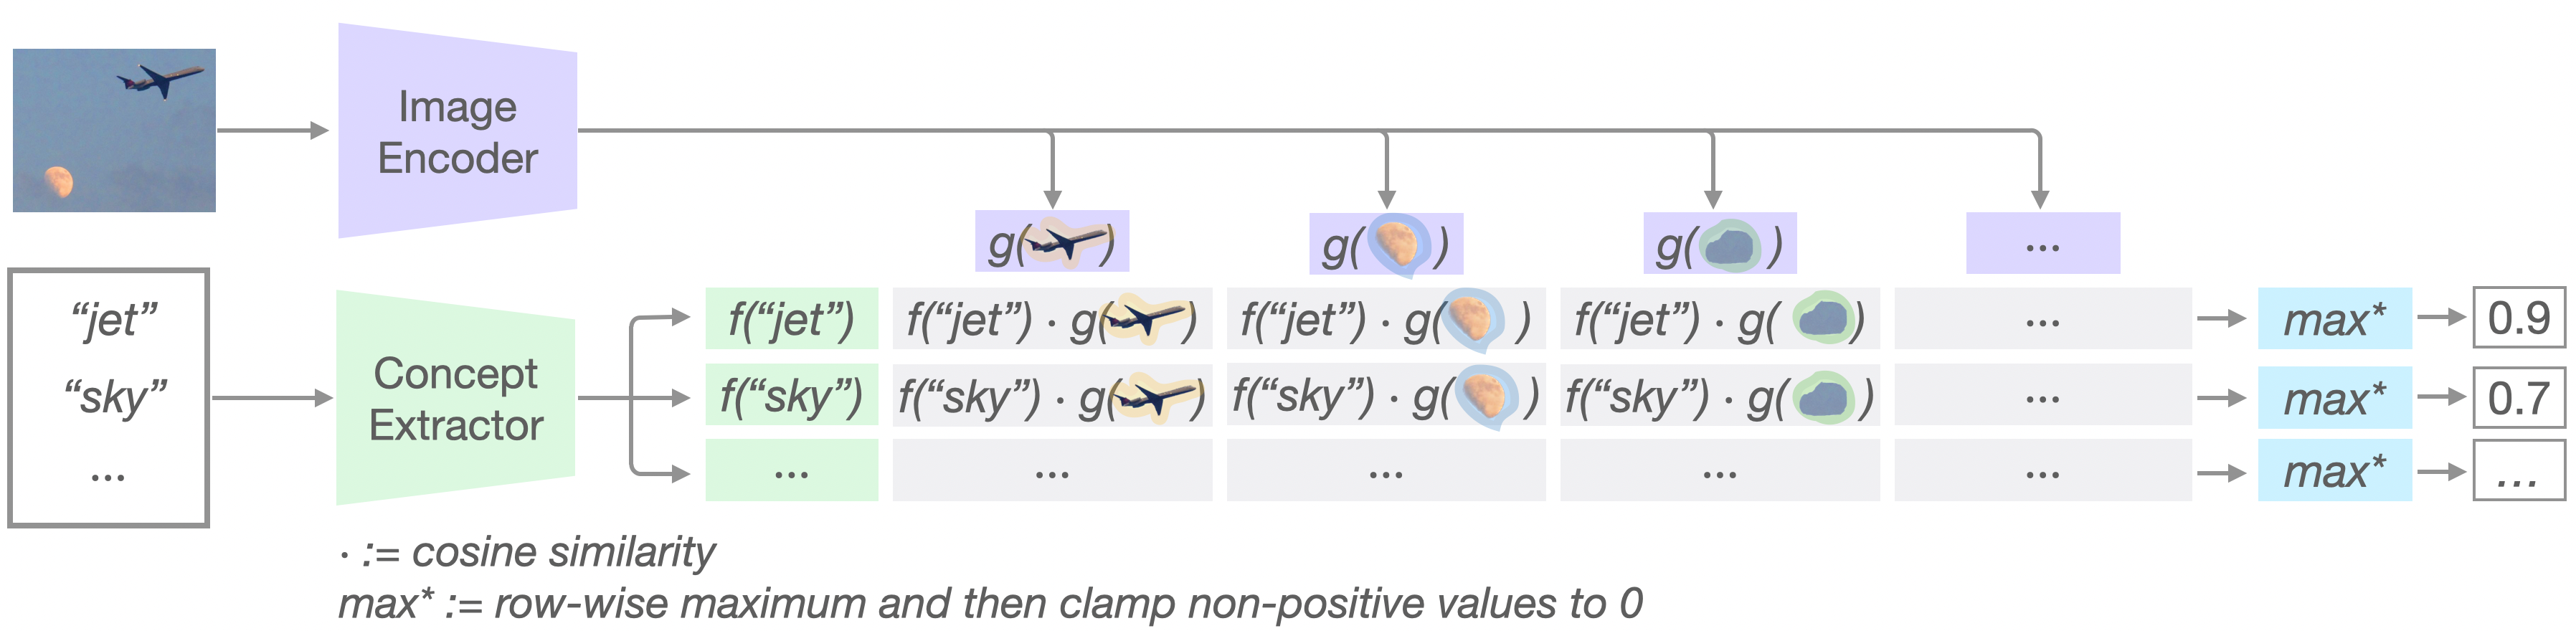
To measure concept influences in a model-agnostic manner, we begin by quantifying concept presences throughout the dataset (G2). We assess a concept’s presence in an image by identifying the segment most closely aligned with the concept. We then use the cosine similarity, which ranges from 0 to 1, between the concept embedding and the segment’s pixel embedding as an indication of its degree of presence.
As depicted in Fig.5, we segment a given image by getting its pixel embeddings using the pre-trained encoder described in Sect.4.2 and subsequently groupping pixels into segments based on their embeddings. We use the average of pixel embeddings within each segment as a segment’s embedding. We then compute the cosine similarity between every segment embedding and concept embeddings, which are produced by the text encoder described in Sect. 4.2. For every concept, the highest cosine similarity value among all segments signifies the concept’s presence level in the image. It’s crucial to note that if all the values are non-positive, the concept is deemed absent in the image, assigning its presence value to zero. Computing concept presences allows us to reveal potential spurious correlations (G3) and measure concept influence without model-specific knowledge (G2).
4.4. Model-agnostic Concept Influence Measurement and Explanation
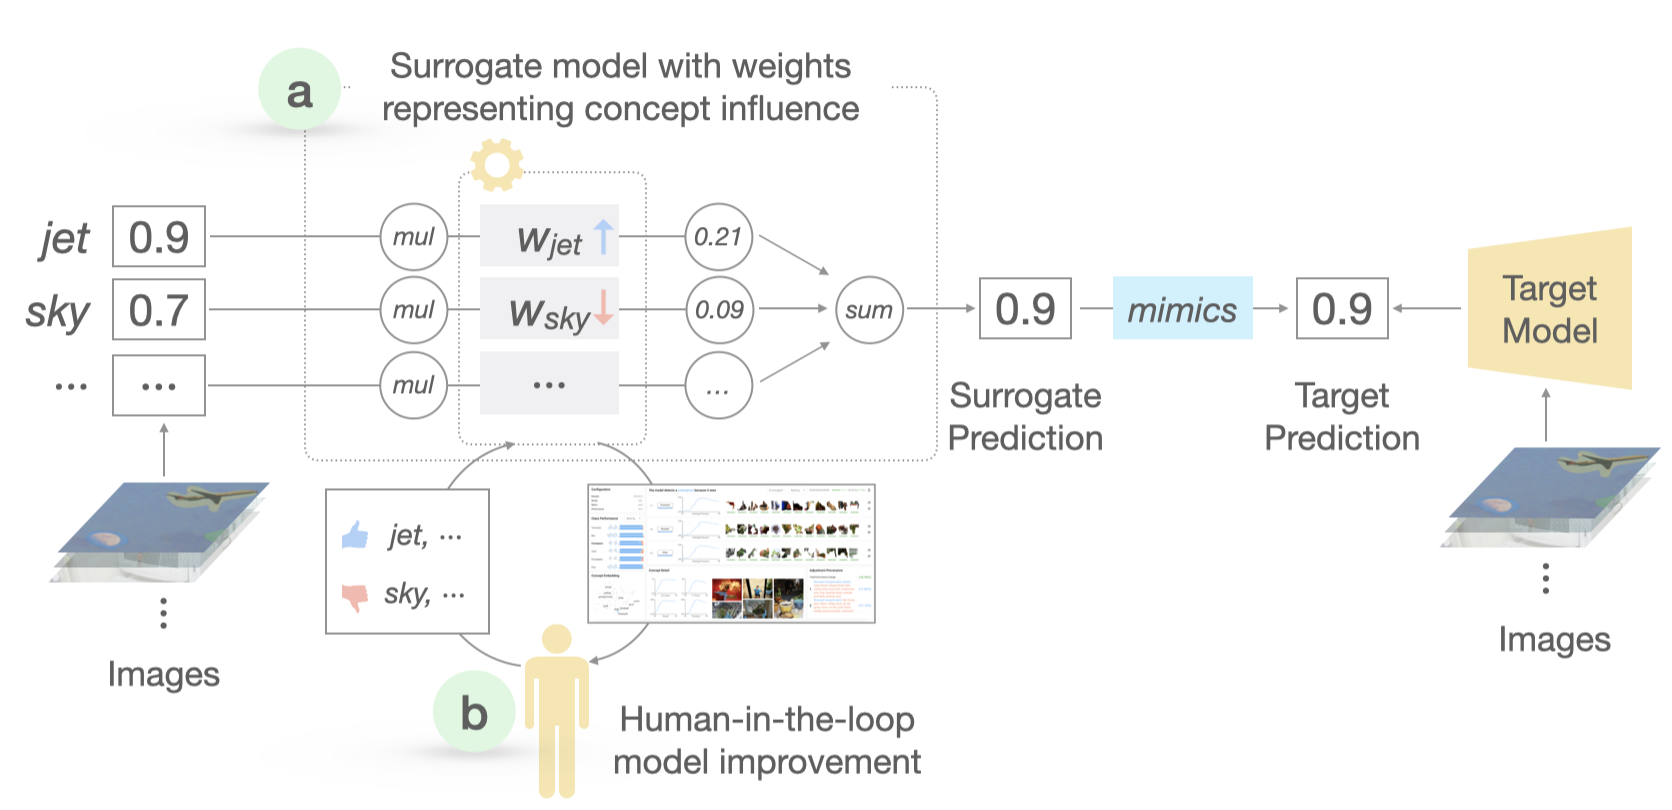
For model-agnostic measurement of concept influences (G2), we adopt strategies from concept bottleneck models (Koh et al., 2020). We implement a linear, class-specific surrogate model to compute a weighted summation of the concept presences in a given image. This summation acts as logits for multi-label classification, imitating the responses of the target model for the corresponding image. The learnable weights of these surrogate models, after training, naturally depict the influence of a concept on a specific class. When taken together, the surrogate models across all classes offer a comprehensive insight into the global behavior (G3) of the target model, as shown in Fig. 6(a).
Each surrogate model is designed with a single fully connected layer without activation functions. This ensures that the weight of every neural connection, from an input node to an output node, directly corresponds to a concept’s global influence on a class, as illustrated in Fig. 6.
To ensure sparse connections in the surrogate model, such that it focuses primarily on a few highly relevant concepts while minimizing attention to irrelevant ones, and to avoid overfitting — which can overemphasize irrelevant concepts — we employ a loss function that combines binary cross-entropy loss with L1 regularization during training. This approach is elaborated further in Eq(1).
| (1) |
Where:
-
•
denotes the binary cross-entropy.
-
•
and are the predictions from the surrogate and target models, respectively.
-
•
represents the L1 regularization on the weights of the surrogate model.
-
•
is a hyperparameter regulating the strength of the sparsity penalty. In our implementation, we set .
By employing this loss function, we ensure two key outcomes: First, the surrogate model predictions closely mirror those of the target model. Second, distribution of concept influences remains sparse, allowing only a few crucial concepts to exhibit a notably higher impact compared to non-essential ones for a particular class.
After training the surrogate models to closely mimic the target model’s behavior, we obtain an accurate measurement of concept influence. This insight allows us to identify the most crucial concepts for a class and their respective influence, forming the basis for concept-based explanations. For example, the surrogate indicates that the top 3 influential concepts for the person class are trouser, hair, helmet with concept influence of 1.2, 1.1, 0.95 respectively.
4.5. ConceptTuning: Human-Feedback Model Improvement
Inspired by InstructGPT (Ouyang et al., 2022), we enable user feedback on concept-based insights to improve the surrogate models (G5) in the frontend, as displayed in Fig. 6. We show users the concept influences (i.e., surrogate weights) and allow them to adjust essential concepts upward (e.g., flowerpot for the pottedplant class) and irrelevant ones downward (e.g., autobus for the dining table class). Based on this feedback, we fine-tune the surrogates.
For emphasized concepts, we set a minimum weight threshold, ensuring it’s not undercut during training. For diminished concepts, we set a maximum threshold. These thresholds are set by multiplying the original weights by a factor: 1.1 for emphasized and 0.9 for diminished concepts.
Users can provide feedback multiple times, and we keep a record. This ensures weights of previously adjusted concepts remain within bounds during further fine-tuning. The fine-tuning process uses similar settings as initial training but with fewer epochs. After fine-tuning, we update the frontend to let users review changes and make further adjustments if necessary. For more details, refer to Sect. 6.3.
5. Interface
We develop a visual interface with six coordinated views to support efficient model understanding and improvement.
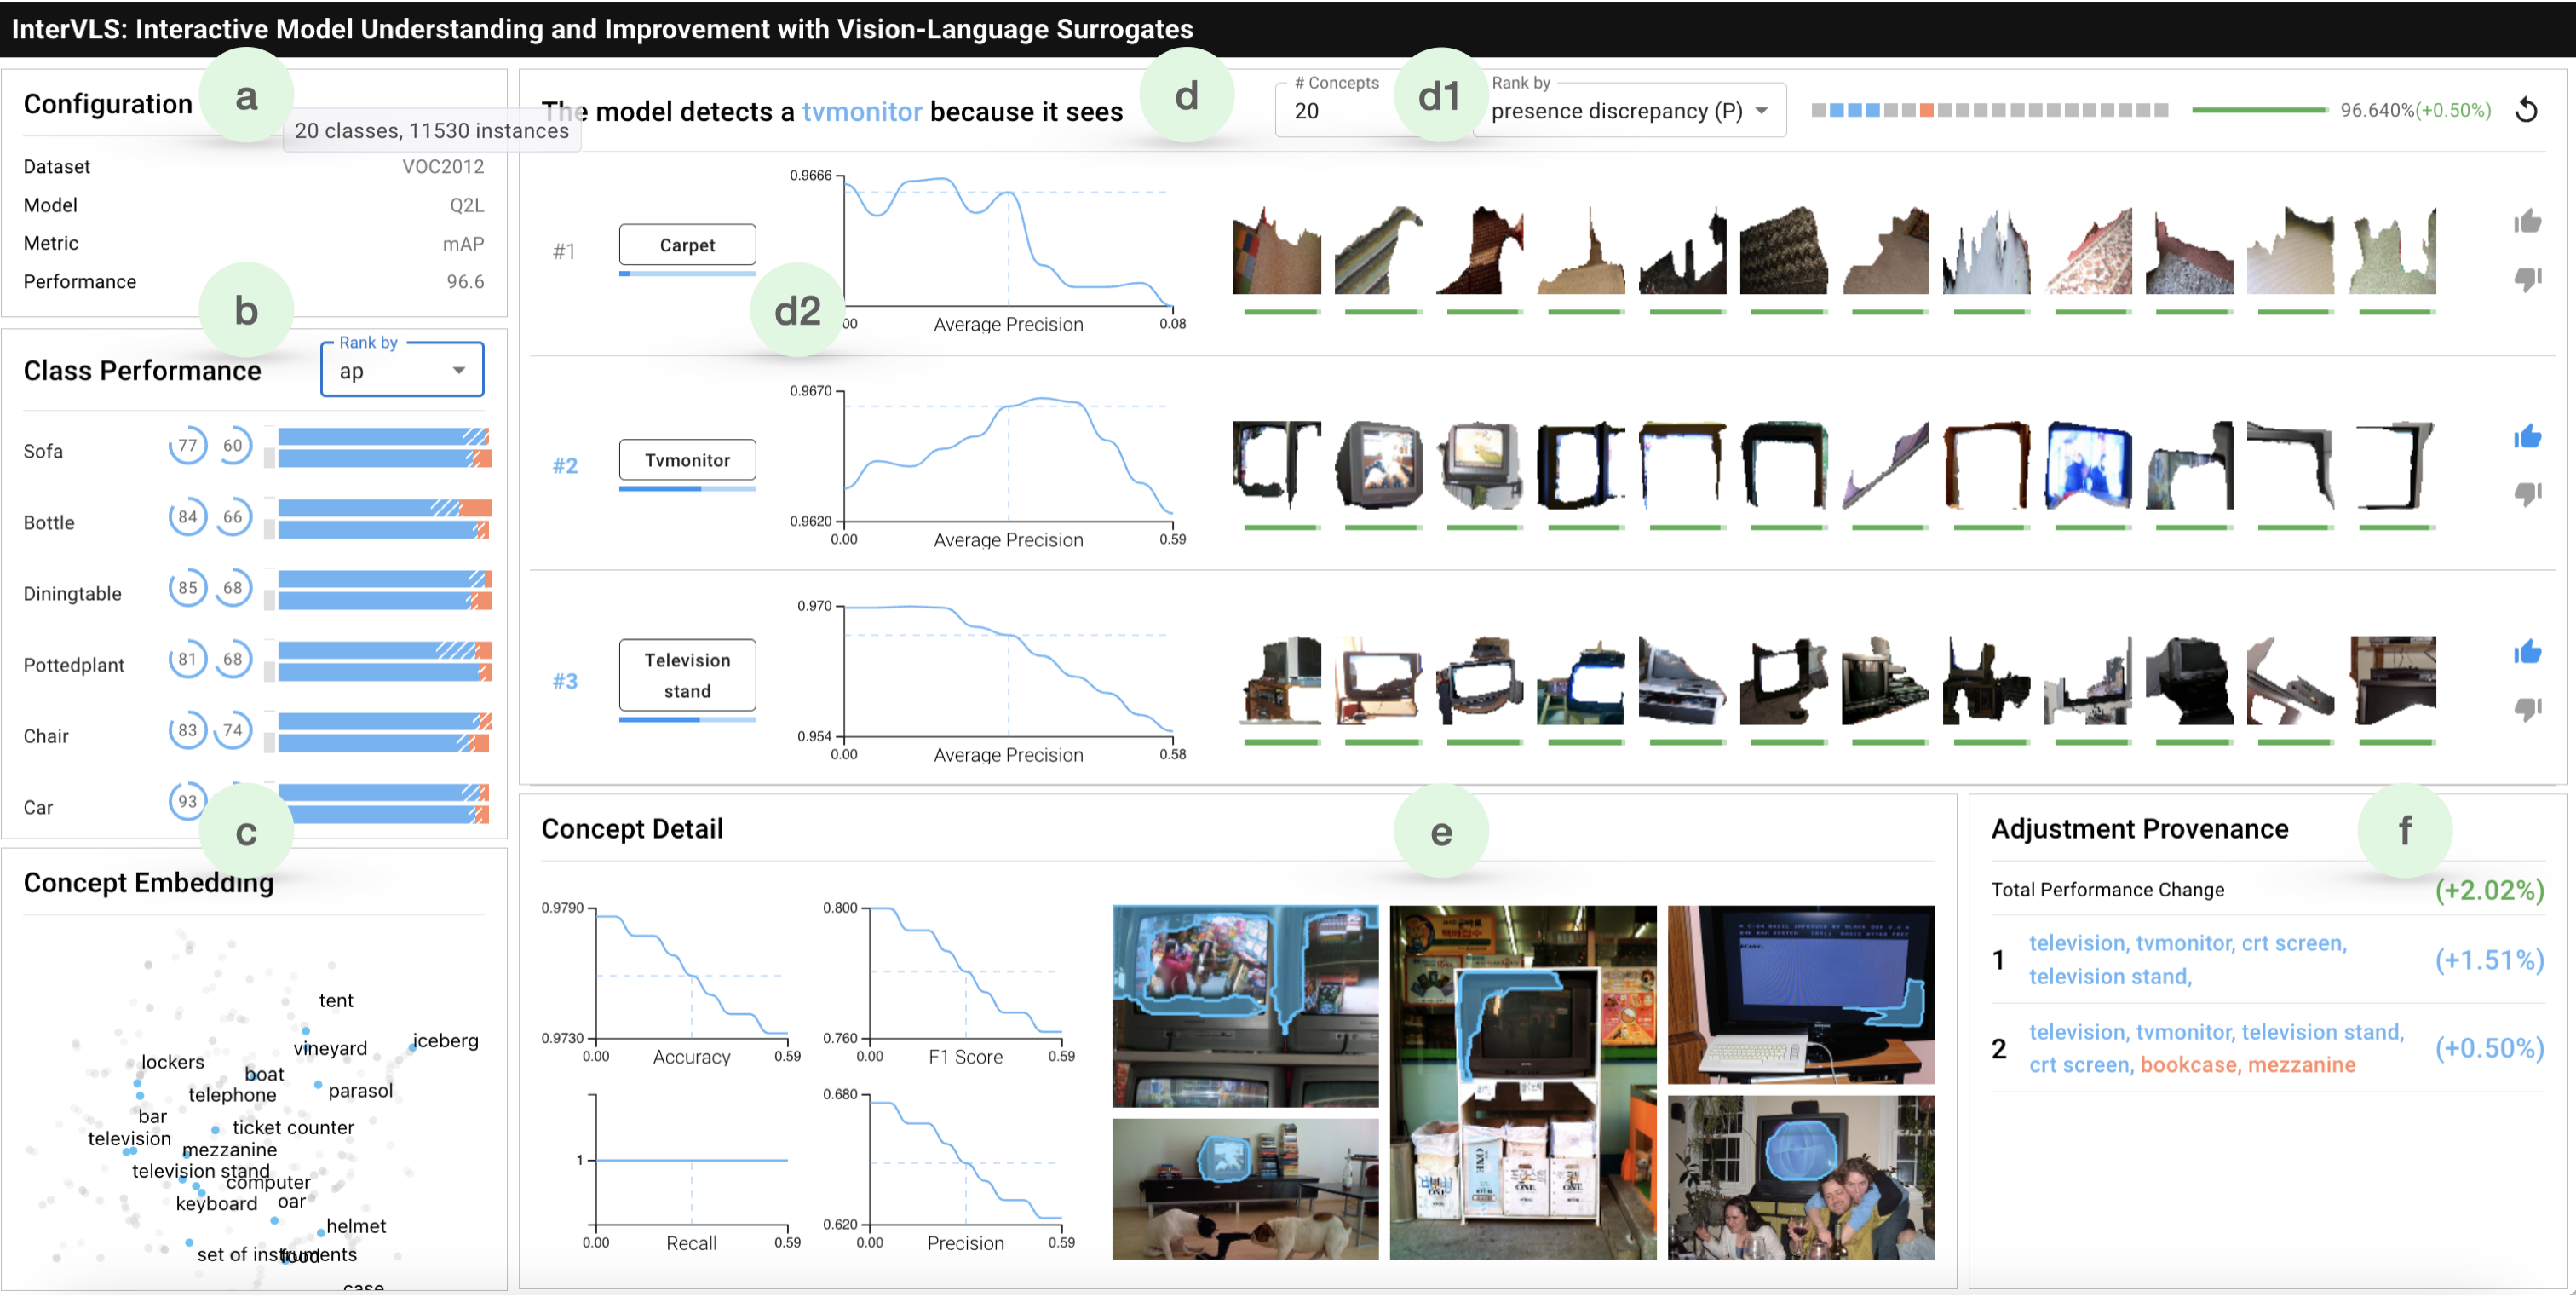
5.1. Configuration View
The configuration view (Fig. 1a) displays information about the dataset, the model, and the performance. Hovering over the dataset name displays additional details such as the number of instances and classes.
5.2. Class Performance view
The class performance view (Fig. 1b) presents an overview of each class’s performance, highlighting disparities between the surrogate and target models (G3). By default, classes are sorted based on the difference in average precision (AP) between two models, allowing users to promptly identify problematic classes. Users can also adjust the class rankings through a dropdown menu, choosing metrics such as recall, precision, or F1-score.
Accompanying each class title are two adjacent circular progress bars, representing the performance of the target model (left) and the surrogate model (right). Using the pottedplant class as an example, the surrogate model registers an AP of 52%, surpassing the target model’s 48%.
The upper bar represents positive instances (e.g., images with a pottedplant), while the lower bar represents negative instances (e.g.: images without a pottedplant). Solid blue area indicate correct predictions by both models, while shaded blue areas represent errors by the surrogate. Solid orange areas highlight shared incorrect predictions by both models, while the shaded orange represent instances where only the surrogate predicts correctly and the target model errs.
The gray vertical bar adjacent to each horizontal bar indicates the relative size of the subset. A thin top bar indicates a significant dataset imbalance, with positive instances comprising only a tenth of the negative instances.
Highlighting discrepancies between the surrogate and target model’s predictions serves two purposes, both anchored in our design goals: (1) the extent of misalignment reveals how well surrogates are mimicking the target, and (2) this information can inform surrogate improvement. For instance, a prominent shaded blue section suggests the surrogate frequently errs where the target gets it right, implying a high false negative rate for the surrogate. In line with Interactive model improvement “on the fly” (G5), users can then adjust influential concepts in the concept leaderboard to rectify this discrepancy, optimizing the surrogate’s accuracy.
5.3. Concept Embedding View
The concept embedding view (Fig. 1c) applies the tSNE technique to present concept vectors in a 2D space, showcasing their semantic connections to the class (G4). Upon selecting a class, users can quickly grasp the key influential concepts and their relevant to that class.
5.4. Concept Leaderboard
The concept leaderboard (Fig. 1d) opens upon class selection, providing concept explanations for the class (G2). It facilitates concept-based performance insights (G3) and interactive model improvement (G5).
Initially, the leaderboard presents the top 10 influential concepts. Users can expand this list to 20 and employ sorting options for better insights on concept influence (Fig. 1(d1)). Sorting based on presence discrepancy aids in identifying concepts leading to mispredictions.
Each row in the concept leaderboard corresponds to a specific concept (G2), with the leftmost number showing the rank based on the current sorting method (weight, discrepancy (P), and discrepancy (N)). A clickable concept name button next to it can open a concept detail view (see Section 5.5), allowing a detailed examination of the selected concept. The blue horizontal bar below the concept name button shows the concept’s relative influence compared to the most influential ones, revealing the skewed distribution of concept influences.
The performance chart next to the concept name button (Fig. 1(d2)) displays how modifying a concept’s influence may impact the model’s performance in a particular class when other concept influences stay constant (G3). This allows users to evaluate the effects of adjusting a concept’s influence (increasing, decreasing, keeping as is). The image patches next to the line chart show visual representations of the concept, providing a visual overview of what it entails. To provide an accurate representation, we display 11 with the highest similarity to the concept vector in the embedding space, and the green bars below the patches indicate their similarity.
Besides the image patches, there are two buttons for users to like and dislike a concept. When a user clicks on the like button, the corresponding block in the top bar of the concept leaderboard turns blue, reflecting the user’s selection (G5). Similarly, if the user clicks on the dislike button, it turns orange, and the corresponding block in the top bar turns orange as well. After specifying which concepts to tune and how to tune them by clicking the like/dislike buttons, users go back to the top bar, where they can see their options represented by colored blocks so far, along with the current performance of the surrogate, and the overall performance change displayed next to it. There is a fine-tune button next to the performance stats where users can submit their instructions. The backend then receives these instructions and runs the ConceptTuning policy, fine-tuning the surrogate according to the user’s specified instructions (see Section 4.5).
Once the ConceptTuning process finishes, the concept leaderboard reloads with an updated set of top influential concepts and surrogate performance. The recent tuning instruction and its impact will be recorded in the adjustment provenance view (F).
5.5. Concept Detail View
The Concept Detail View (Fig. 1e) opens when the user selects a concept to examine. It provides four additional charts to provide a more comprehensive understanding of the selected concept (G4). The image gallery alongside these charts provides contextual information about where the concept is extracted. Altogether, this view enables users to confirm or nullify their hypotheses and avoid hasty fallacious conclusions before submitting their concept tuning instructions.
5.6. Adjustment Provenance View
The Adjustment Provenance View (Fig. 1f) displays a record of previous concept tuning instructions and their impact on the surrogate model’s performance. Each row in the view represents an entry, showing concepts that have been liked (in blue) or disliked (in orange), along with the corresponding change in performance compared to the previous entry. The cumulative change is also provided at the top-left corner of the view, giving the user an overview of their progress and remaining work (G5).
6. Usage Scenarios
We demonstrate the effectiveness of InterVLS through scenarios in which Sam, an ML engineer, employs the system to validate models trained for multi-label classification.
6.1. Experiment Setup
We study the Q2L, a state-of-the-art multi-label classification model, trained on the PASCAL VOC 2012 dataset. The dataset has 20 classes and contains 10,582 training and 1,449 validation images. We extract 584 text-aligned visual concepts using the concept list provided by (Bau et al., 2017).
We train simple surrogates to mimic the Q2L model’s predictions (with Q2L model outputs serving as ground truth). Each surrogate consists of a single fully-connected layer (no activation) of 584 input nodes and a single output node. We use L1 regularization with weight to balance surrogate accuracy and its weight sparsity. We use a batch size of 2,084 and an Adam optimizer with a learning rate of 0.2. We also use batch normalization during training to stabilize the gradients.
6.2. Performance Overview
Sam begins by reviewing the performance overview and identifying key classes with opportunities for improvement. Upon analysis, he discovers several classes in which the surrogate model outperforms the target model, including sheep, bird, and horse. Specifically, for the sheep class, the surrogate model has an AP of 96.25%, while the target model only achieves 95.31%. Similarly, for the horse class, the surrogate model has an AP of 98.18%, while the target model only scores 98.03%. As of the bird class, the surrogate model has an AP of 99.84%, compared to the target model’s 99.74%.
Intrigued by these findings, Sam tries to fine-tune the sheep class to see further improvement is possible. His efforts bear fruit, enhancing its performance by an additional 0.85%, culminating in an impressive 97.10%. Encouraged by this impressive outcome, Sam sets his sights on other classes to uncover more areas of potential improvement.
6.3. Improving Underperforming Classes to Outperform the Target Model
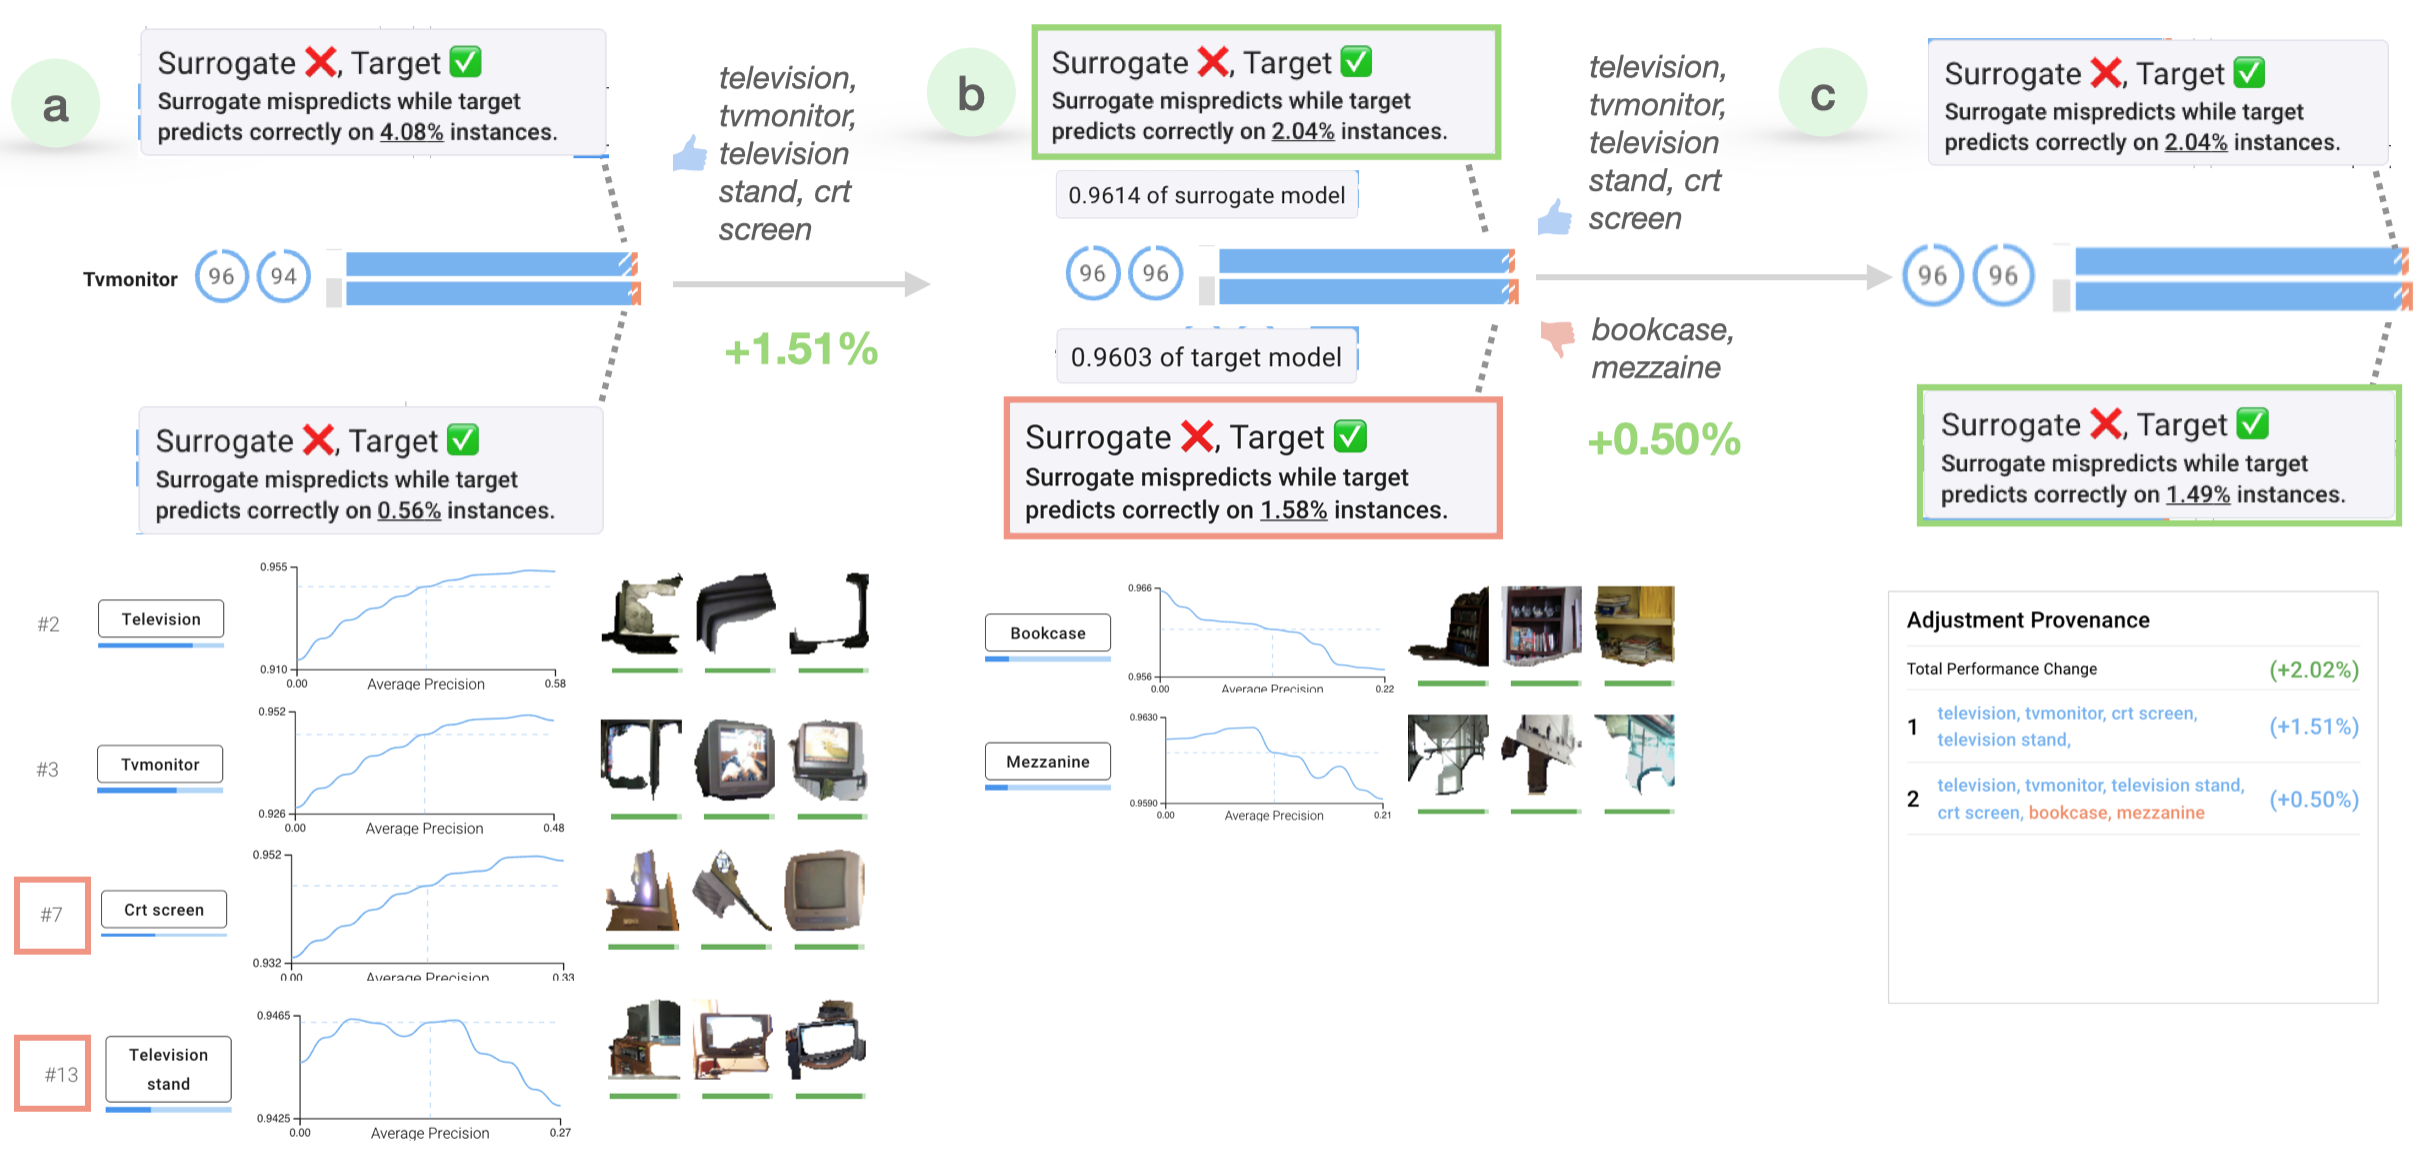
TV monitor: To evaluate InterVLS, Sam begins with classes where the surrogate trails the target. The class performance view indicates a 2% lag by the surrogate at the tv monitor class. He sees a significant discrepancy in the tv monitor class’s shaded blue area (Fig. 7(A)): the surrogate misclassifies 4.08% more positive samples than the target model.
To address this, Sam aims to increase true positive rate without introducing additional false positives. This can be accomplished by increasing the influence of concepts highly relevant to tv monitors.
Clicking the tv monitor button to update the concept leaderboard and the embedding view, Sam identifies tv monitor, television stand, crt screen, and television as key indicators. Although tv monitor and television are ranked 2nd and 3rd in influence, the performance charts (Fig. 7(b)) indicate that their influence could be increased for better results. Sam decides to uptune these concepts and observes an improvement in performance.
Upon further review, he notices the low influence of crt screen at 0.165, below both bookcase and shop. He uptunes crt screen to address this. Additionally, despite its presence in the embedding view, Sam finds television stand only at the 13th position with an influence of 0.115 and chooses to uptune it as well.
Confident with his adjustments, Sam submits his changes. This results in a performance increase of 1.51%.
Reviewing the performance view again, Sam observed a 2.04% reduction in the false negative rate as shown in Fig.7(b). Initially, the surrogate had 4.08% more mispredicted positive samples than the target; this discrepancy reduced to just 2.04%. On the downside, the false positive rate rose by 1.02%. This increase indicates that, during the fine-tuning process, some concepts became excessively influential, leading to incorrect positive predictions for some negative samples.
To improve the surrogate model’s performance, Sam decided to downtune irrelevant yet influential concepts. Upon sorting the concepts based on their influence, he noticed that both bookcase and mezzanine were highly influential. Their performance charts hinted that decreasing their influence could be beneficial. Acting on this insight, Sam reduced their influence and further boosted the influences of the four concepts he initially uptuned. After submitting these revised tuning directives, he secured an added performance enhancement of 0.50%. A subsequent review of the performance metrics revealed that the false positive rate had decreased by 1.49%, aligning with his anticipated outcome.
Following his adjustments, Sam noted a 2.02% improvement in a previously underperforming class, resulting in a 0.59% lead over the target model. The combined use of a surrogate with human feedback proved effective, even outperforming a state-of-the-art method with a 96% baseline AP.
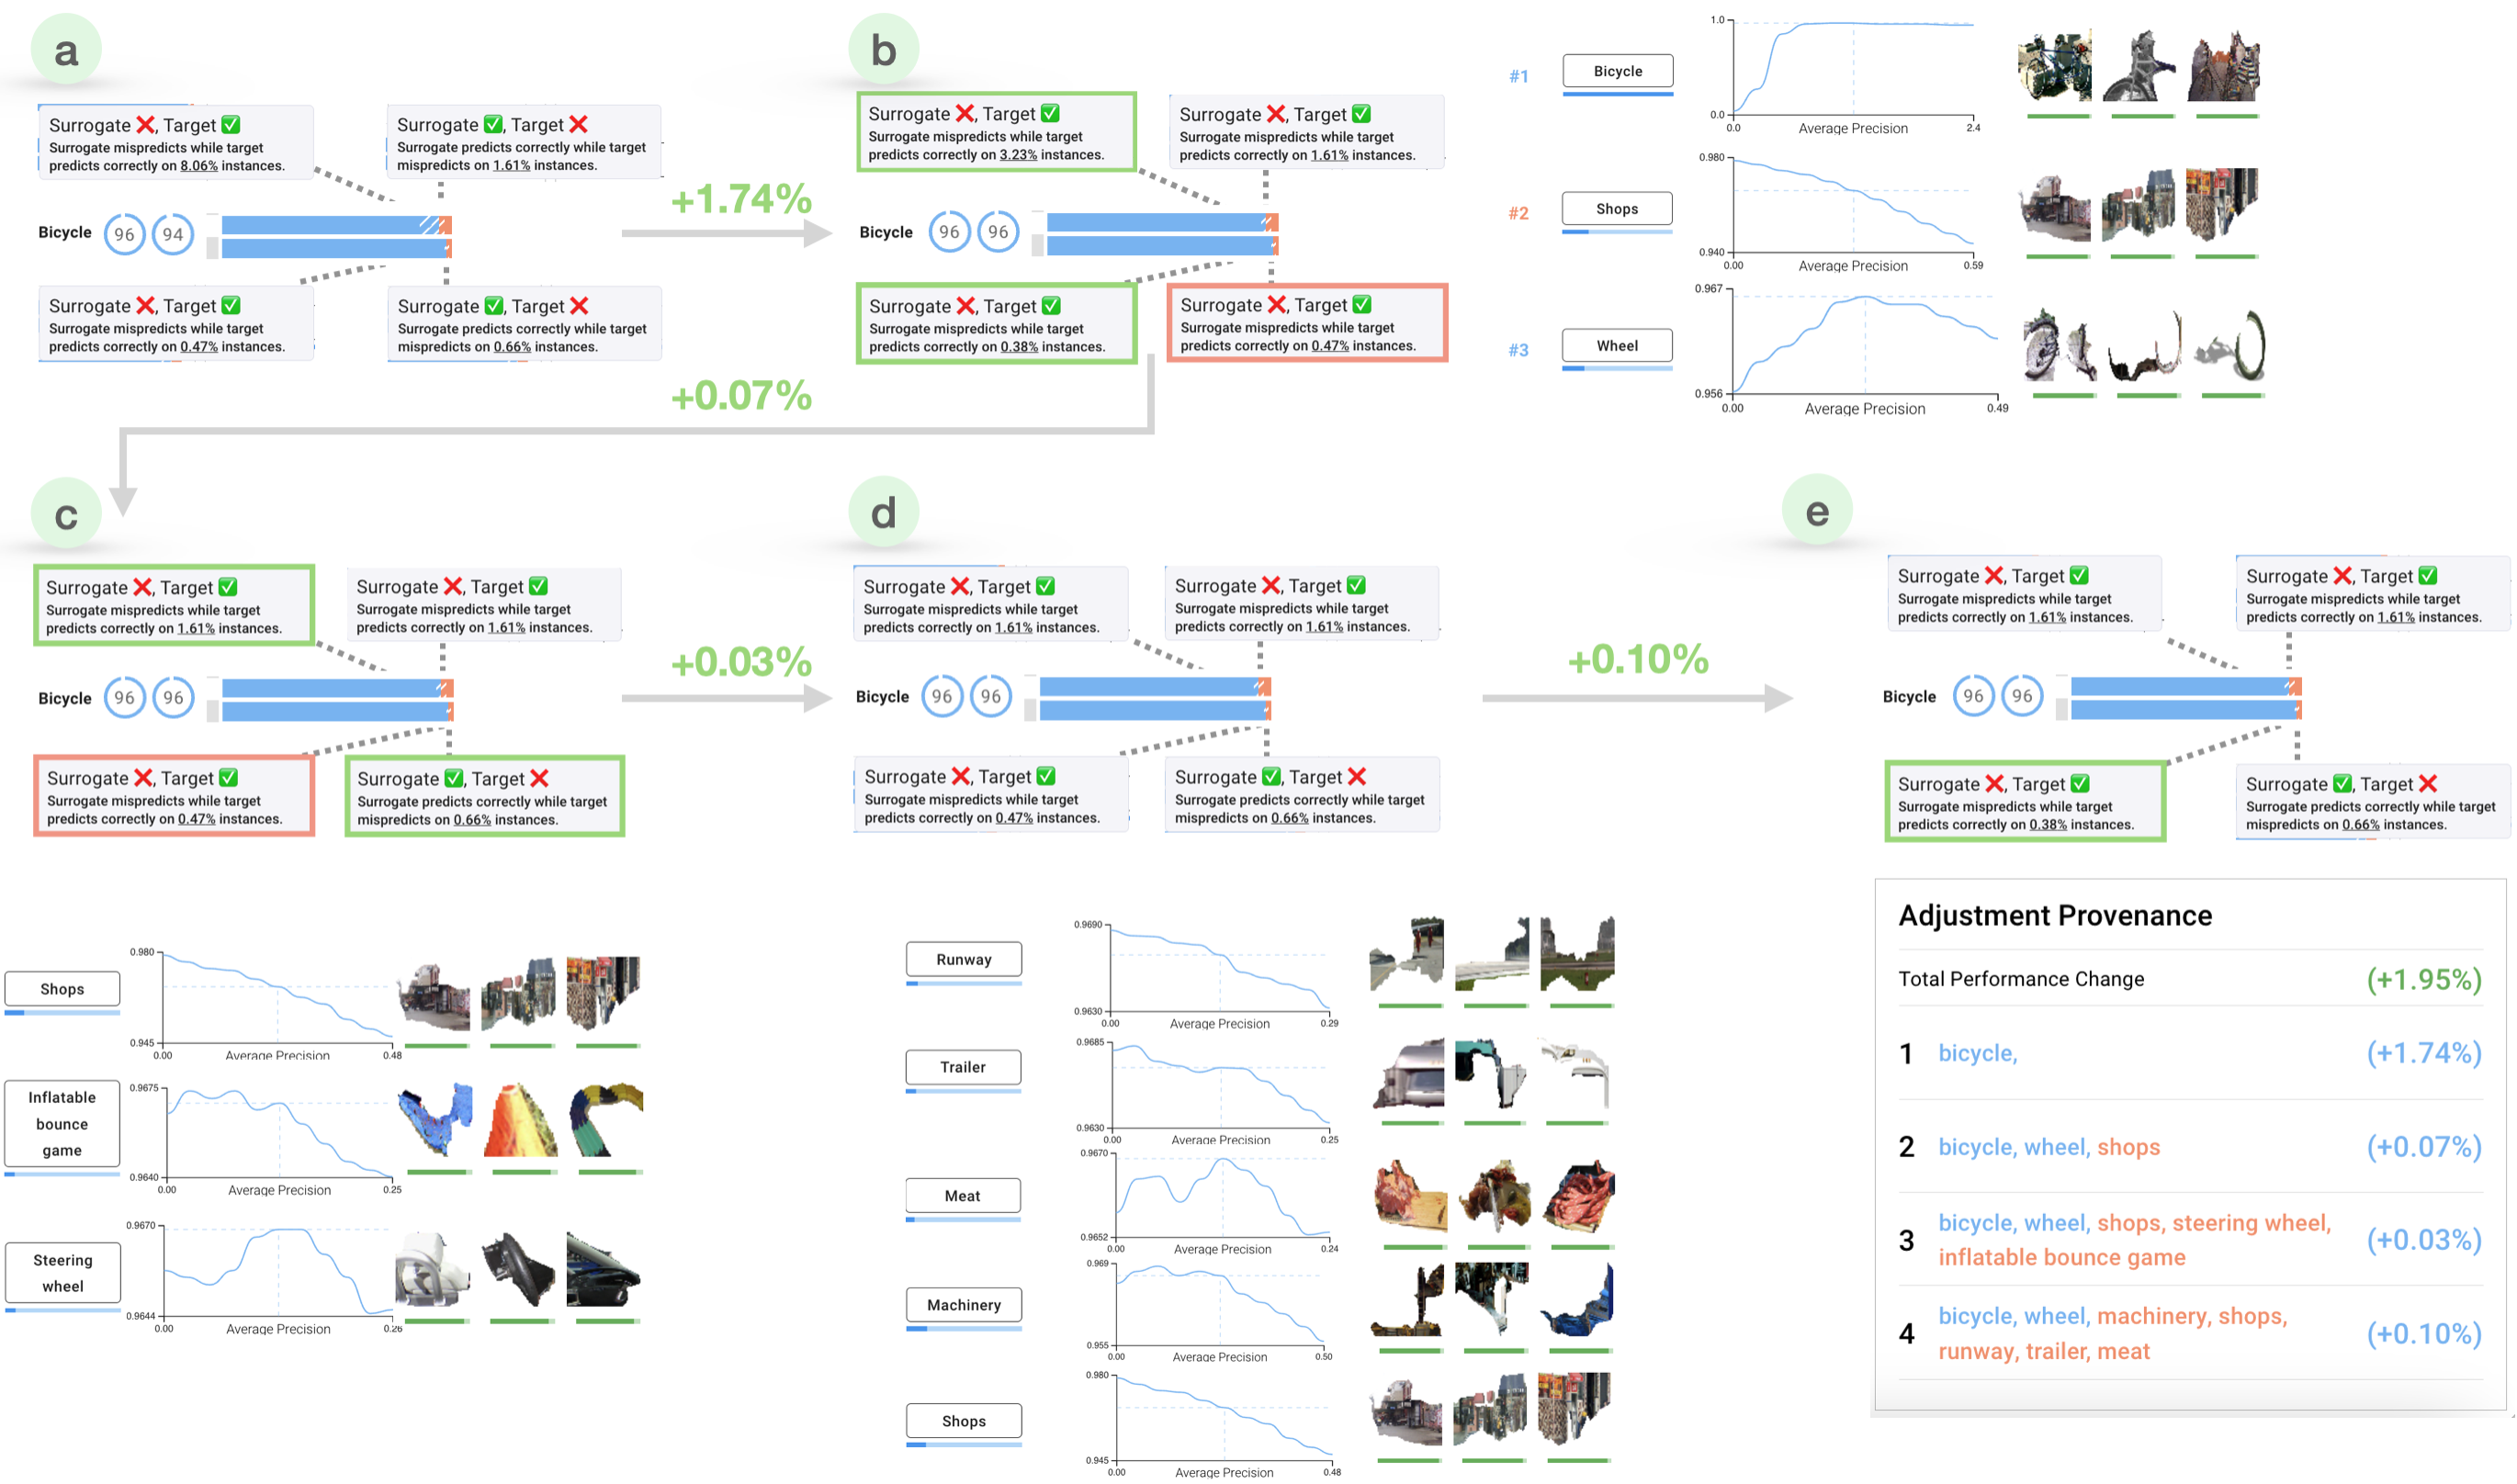
Bicycle: Sam spots a 3% AP gap between the surrogate and target models for the bicycle class (Fig.8(a)). The surrogate falsely predicts 8.06% more positives than the target, suggesting necessary concept adjustments.
Sam examines the embedding view and identifies relevant concepts, such as bicycle and wheel. Subsequently, in the concept leaderboard, he uptunes the influence of bicycle, but decreases wheel’s level due to its wider relevance, as it’s also associated with motorbike and car. This approach yields a 1.83% performance boost.
Revisiting performance view, false negatives in the surrogate decrease to 3.23% from 8.06% (Fig.8(a)). Though the correct prediction rate for positives slightly decreases, the model still performs better than before with negative samples.
Spotting the shop’s undue influence, even higher than that of wheel, Sam adjusts wheel and bicycle, reducing shop. This change brings a 0.07% gain. However, the false positive rate rises by 0.09%, prompting further tweaks. After sequentially downtuning unrelated concepts – shop, steering wheel, inflatable bounce game, machinery, shops, runway, trailer, and meat – performance improves, reaching 96.82% AP, surpassing the target by 0.06%.
6.4. Mitigate Severe Underperformance
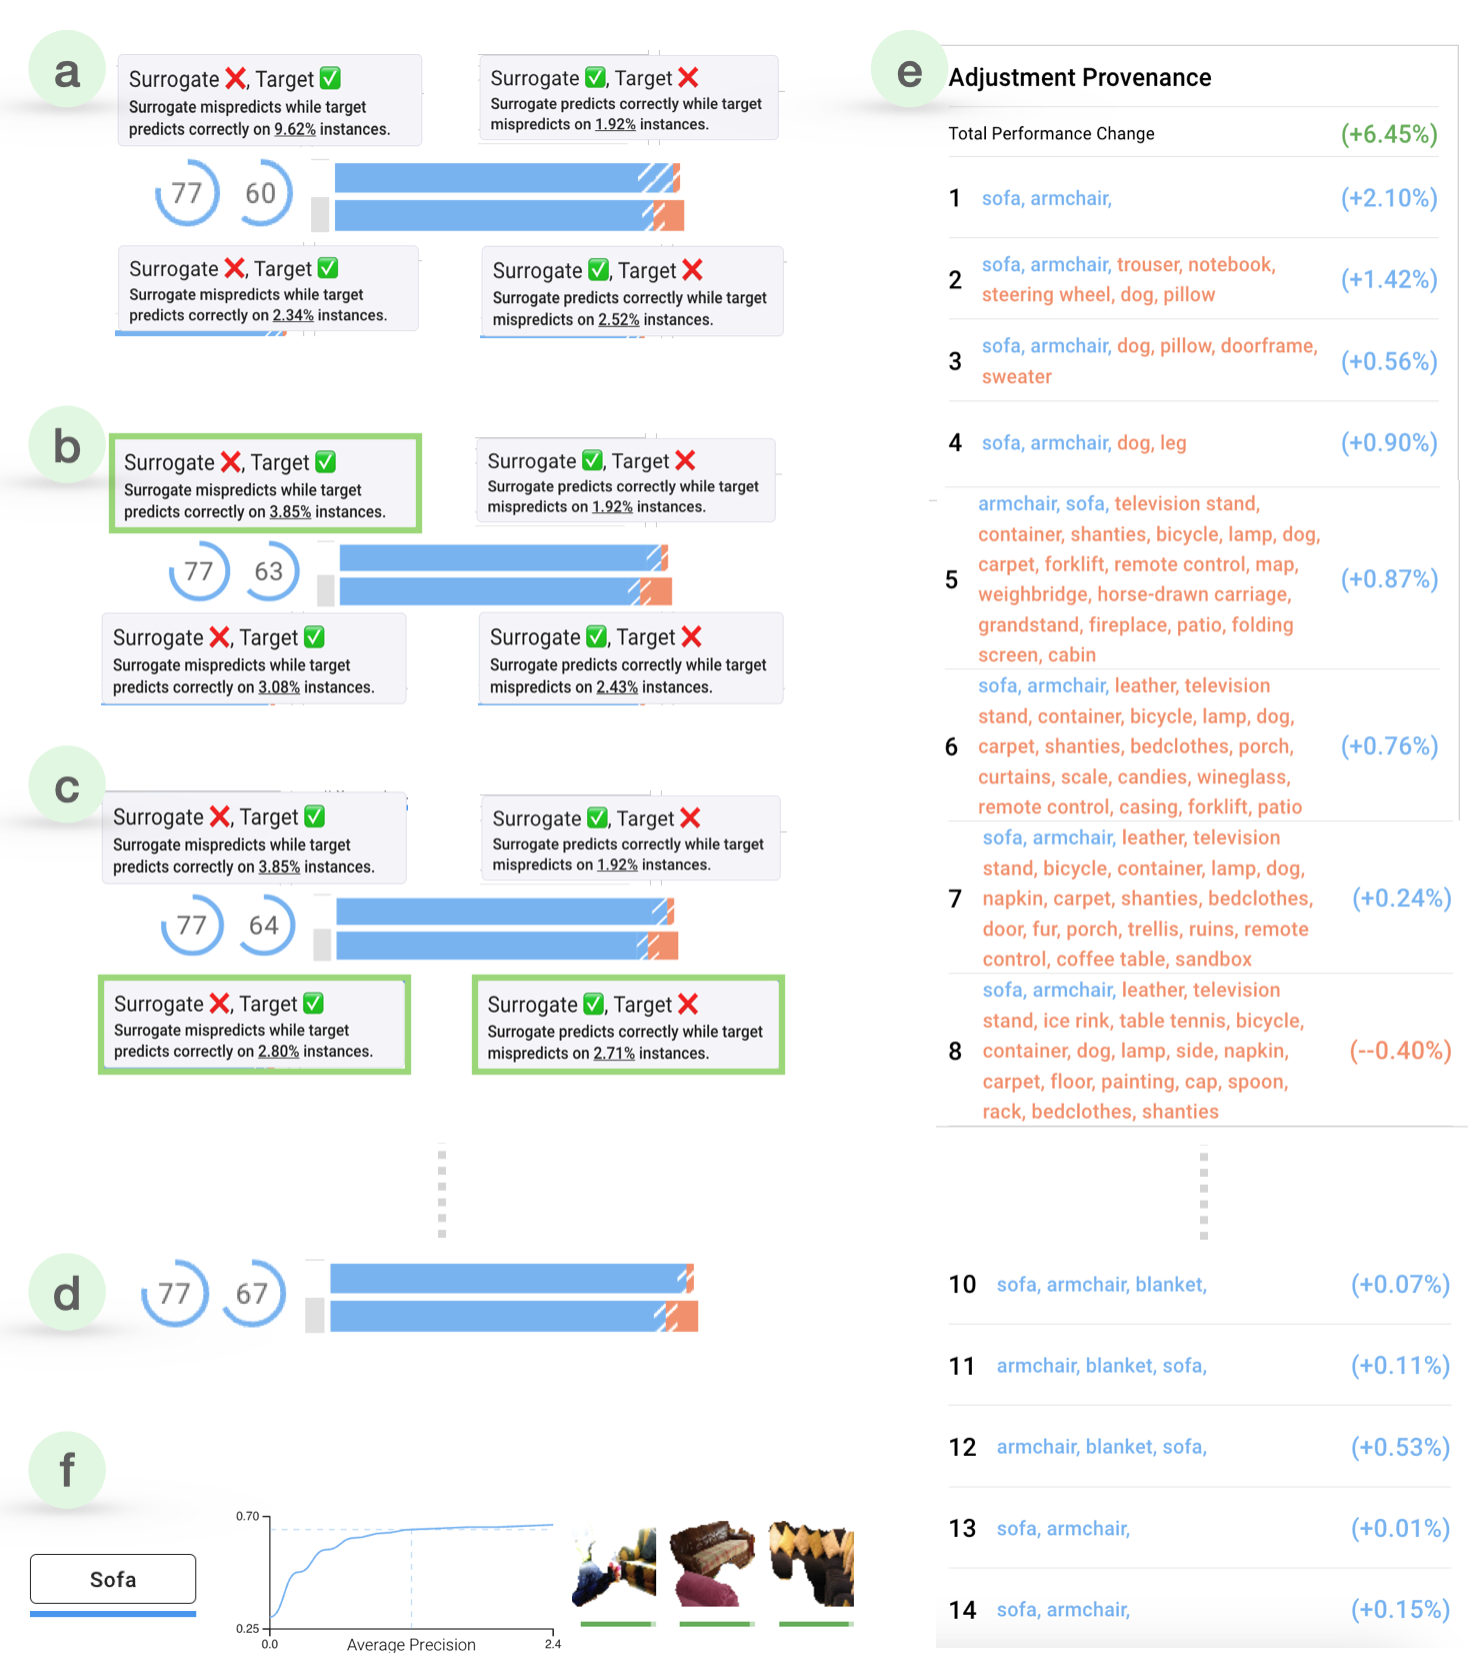
sofa: after his success with two classes, Sam turns his attention to the sofa class, which trails the target model by a significant 17.0%. Analyzing the performance view, he notes that the surrogate model mispredicts positive samples by 9.62% more than the target (Fig.9(a)). This highlights the urgency of increasing the influence of relevant concepts.
With a brief overview of leaderboard, Sam increases the sofa and armchair concepts, both relevant to sofas, resulting in a 2.10% improvement of the surrogate model (Fig. 9 (b)).
In the performance view, Sam observes a 5.77% drop in false negatives, with a rise in false positives by 0.74%. In response, Sam decreases the influence of unrelated concepts while reinforcing sofa and armchair. He downtunes trouser, notebook, steering wheel, dog, and pillow, achieving another performance improvement of 1.42% (Fig.9(c)).
Persistently fine-tuning the surrogate model through 14 iterations (Fig.9(e)), Sam elevates its AP to 67.0%, a remarkable leap from its starting point of 60% (Fig.9(d)). The reduced shaded blue region in the performance view signifies the significant reduction in false negatives. The performance trajectory suggests that with continued emphasis on the sofa concept, the sofa class can potentially achieve an AP of 70% (Fig.9(f)).
Dog: Sam next targets the dog class where the surrogate model has 90.72% AP, lagging behind the target model’s 99.94%, likely due to a high false negative rate – the surrogate mispredicts 9.09% more positive samples than the target.
To address this, Sam uptunes the dog concept, increasing the performance by 2.02% while decreasing the false negative rate by 1.17%. However, with a remaining gap of 7.92% in positive sample predictions, Sam further improves the dog and fur concepts and decreases the influence of grass, terraces, and apron to prevent false positives.
These adjustments yields a 0.48% rise in AP and reduces the false negative rate to 5.94%. Following similar adjustments over eight rounds, the surrogate model achieves 94% AP, reducing the misprediction gap to 3.74%.
7. User Study
To evaluate InterVLS, we conducted a user study with ten participants. Our primary focus was on design goals (G1-G5): ”Does InterVLS effectively support model understanding and improvement?” The study included a system overview and two tasks. We quantitatively and qualitatively evaluate InterVLS against the design goals and its overall usability.
7.1. Participant and Study Setup
We recruited ten computer science graduate students from an anonymous university. All self-reported as users or developers of DL models. The study averaged 30 minutes with a 5-minute standard deviation. Participants used InterVLS on a 30” monitor with a resolution of via Google Chrome in full-screen mode. The study sessions were conducted in a quiet, distraction-free office environment.
7.2. Process
Participants began the study by filling out a short demographic survey. They were then introduced to the multi-label classification problem and visual concepts. While a training task was available to help them get accustomed to the system, seven participants chose to skip it after the overview. Throughout the training, they could ask questions and interact with the interface until they felt ready. The study concluded with a questionnaire, allowing participants to give feedback and any additional comments. Participants could also conduct additional freeform feedback if desired.
In the first task, participants worked on optimizing the bicycle class using the system. They were asked to verbalize their thought process while adjusting the model. Completion was defined as improving the surrogate model’s performance beyond that of the target model. The task took an average of 7 minutes to complete, with a standard deviation of 2 minutes. The second task focused on the tv monitor class, also requiring participants to think aloud while making adjustments. This task was completed in an average of 4 minutes, with a standard deviation of 1 minute. All participants succeeded in improving the surrogate model to surpass the target model. Additional findings from the study are reported below.
7.3. Study Results
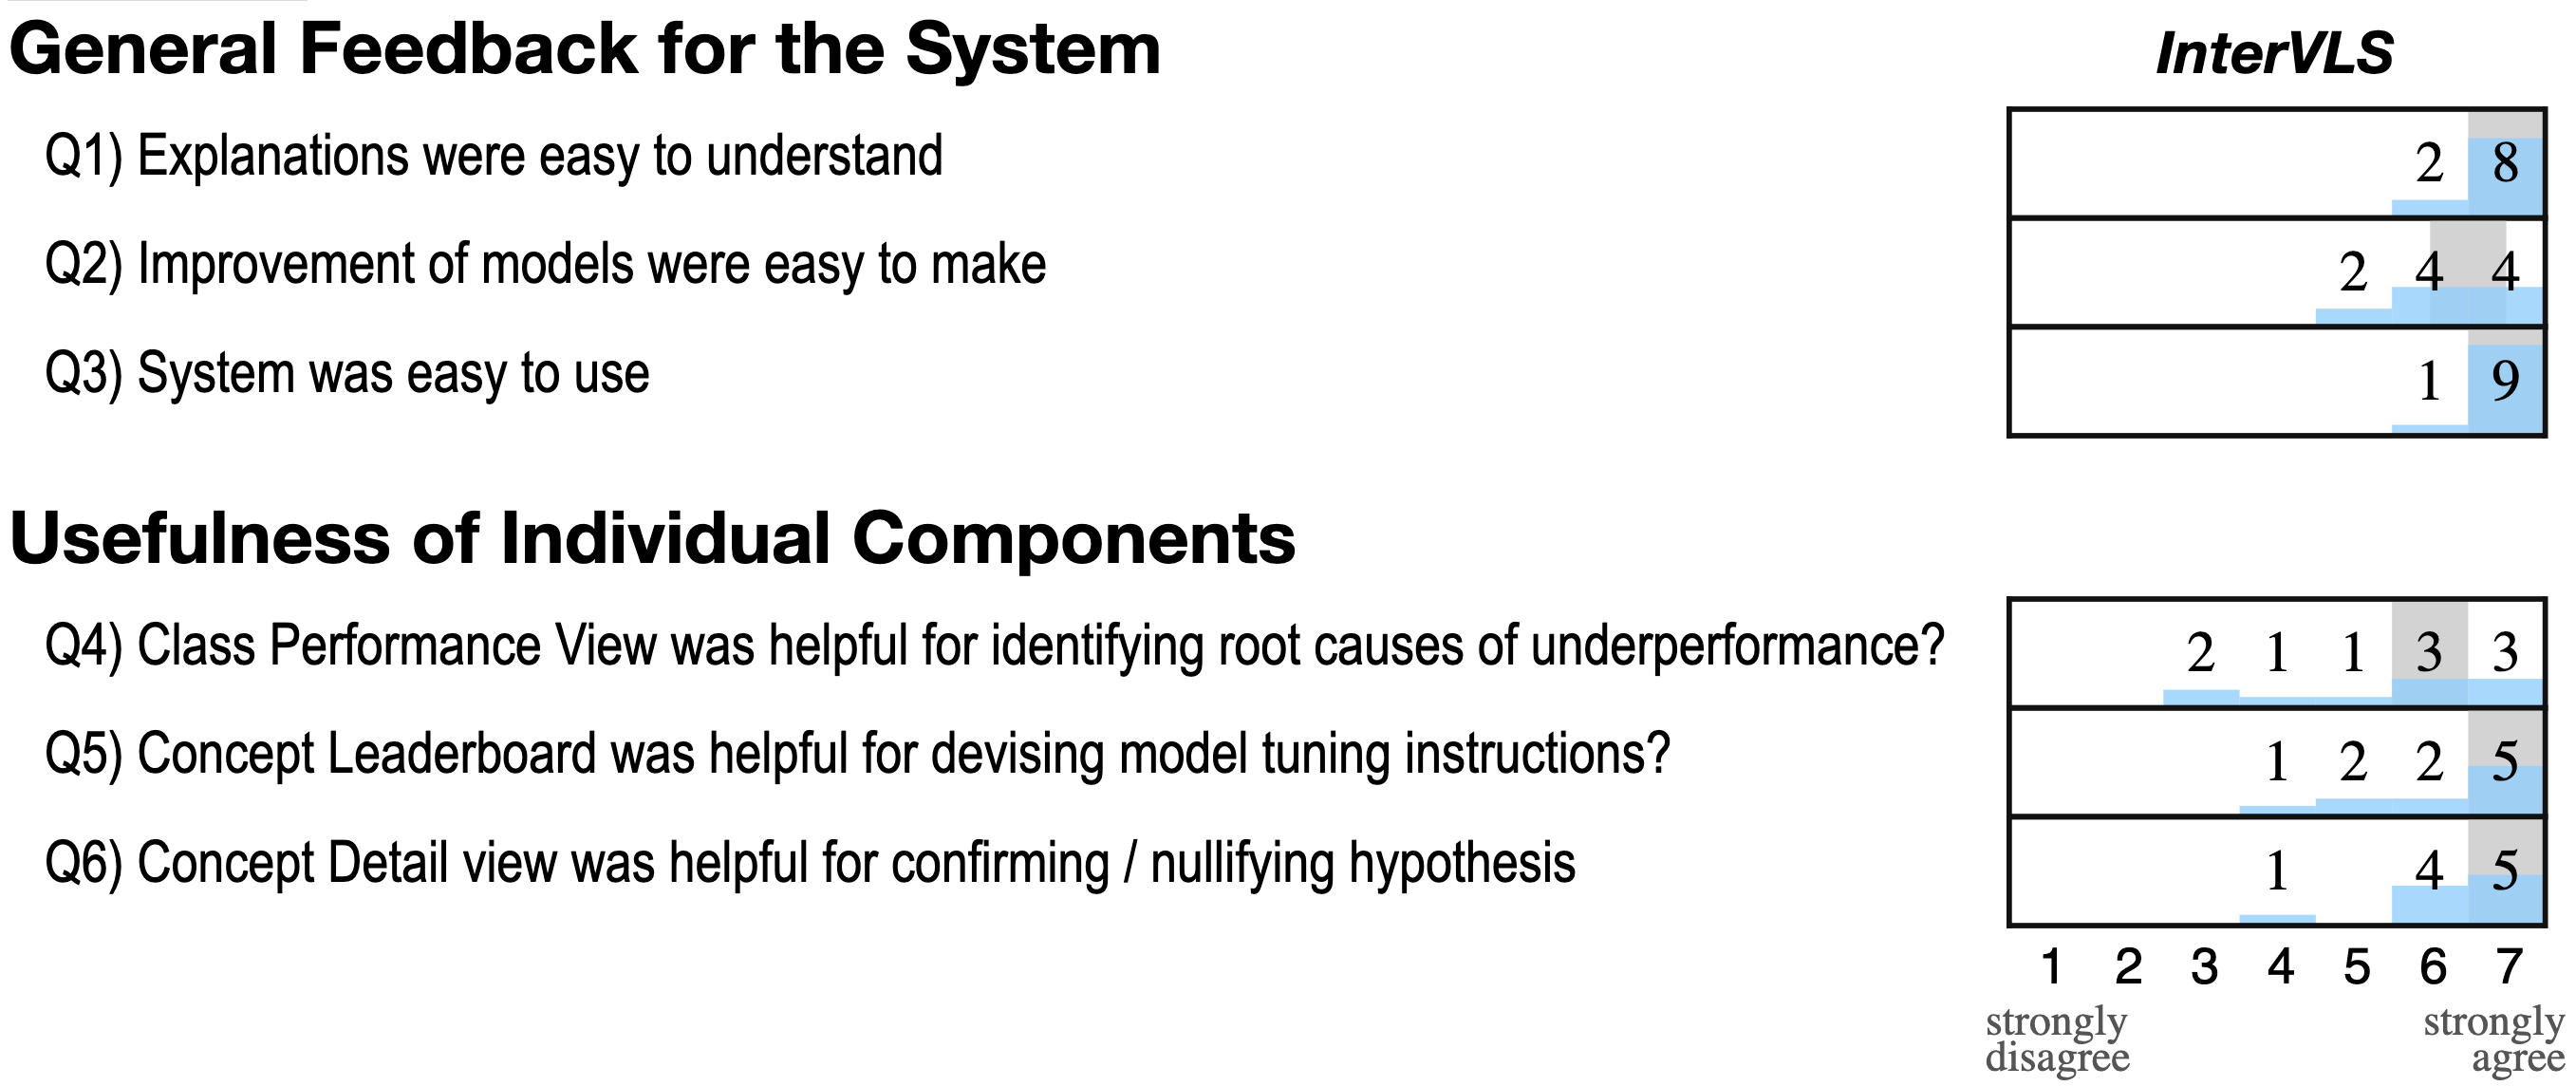
Fig. 10 summarizes the responses of the post-study questionnaire. The first three questions ask about the overall system usability, while the second three questions are about functionalities of individual components of the interface. The median ratings for each question are indicated in gray. Overvall, InterVLS received high rating from the participants.
We analyzed the participants’ think-aloud responses and post-study feedback through an open coding process, aiming to identify the strengths and weaknesses of the InterVLS user experience. Key insights are summarized below:
Text-aligned visual concepts are easy to understand and work on. All participants grasped the visual concepts quickly and used them effectively for concept-tuning tasks. This suggests that our concept extraction method successfully eliminated ambiguity and enhanced understandability.
Text-aligned visual concepts are easy to understand and work on. Nearly all participants (with the exception of P7) relied on the concept detail view to validate their understanding of individual concepts. For example, one participant stated, “remote control can with a tv monitor but it can also be on its own. So I’m checking the details of remote control to see if they are mostly on a tv monitor or not.” (P3). Another participant mentioned, “I’m not sure what set of instruments means here, so I need to look at the details.” (P5)
Class Performance View is helpful for identifying where to start the analysis. Most participants (8 out of 10) initiated their analysis by focusing on the largest shaded areas in the class performance view, using it to prioritize their subsequent actions in the concept leaderboard. For example, one participant remarked, “The shading feature is helpful for me to figure out where to start” (P4), while another stated, “I will fix the ones with the biggest shade first” (P9).
Concept Leaderboard enables effective analysis and interaction. Participants effectively interacted with the concept leaderboard to analyze and adjust concepts. Five participants used the ranker to sort concepts based on the presence discrepancy, allowing for efficient identification of main concepts to tweak. Other participants preferred to sort concepts by their weight. All but one participant (P7) increased the number of visible concepts to 20, to perform a thorough investigation. P7 preferred minimal change for each adjustment to accurately identify the cause of any changes made: “I want to focus on a few concepts at a time so I can identify the root cause for each change” (P7). All participants reported that the leaderboard was helpful and efficient. ”It’s cool that I can just vote for the concepts and the model will update” (P3), ”I like the voting thing. It’s intuitive” (P5). “It provides a really good indication of effects of tweaking each feature at a certain step” (P8) “tells improvement at each step” (P6)
The workflow is intuitive and the interface is easy to use. During the study, participants were able to analyze the concepts and tune them “on the fly”. The participants’ post-study feedback indicates that they could intuitively use the interface. ”Simple to interact. Easy to refine the model on a single click.” (P8) ”The front-end design was good. Easy to understand.” (P2) “Easy to train (fine-tune) and select features (concepts).” (P10)
8. Discussion and Future Work
Integration to model monitoring and governance. Integrating InterVLS into other stages of the DL production lifecycle such as model monitoring and governance is crucial for ensuring the continued success of a model in real-world scenarios. However, InterVLS is limited to a fixed set of concepts, which prevents it to handle concept shifts while monitoring model performance. In the future, we would like to extend our approach with dynamic concepts. We believe that by integrating InterVLS into other DL production stages, users can proactively ensure the model’s performance and adaptability in dynamic environments (Papagiannidis et al., 2023).
Insights for fairness Currently, InterVLS provides insights into DL model performance to help users identify conceptual root causes of underperformance and improve the model “on the fly”. However, in real-world applications, fairness is also an important consideration, especially when it comes to potential biases in the model (Zhou et al., 2022; Madaio et al., 2020). Therefore, we would like to explore the usage of InterVLS for AI fairness in the future. For example, we would like to reduce unfair factors in a model through concepts.
Applications beyond classification. While we demonstrate InterVLS with an multi-label classification problem, we believe it can be extended to other computer vision tasks in the future such as object detection and semantic/instance segmentation. To this end, we would like to extend the surrogate not just to quantify the influence of concepts toward a class prediction, but also to the localization of an object.
Distilling knowledge from large models. Large models (Vaswani et al., 2017; Devlin et al., 2018; Dosovitskiy et al., 2020) can deliver impressive results across many tasks, but they are expensive to train and difficult to deploy on low-computing resources such as mobile phones. Our experiments with InterVLS have demonstrated that vision-language-based surrogate models can achieve competitive results in comparison to the state-of-the-art models while being more lightweight and easy to explain. This highlights an exciting avenue for future work where we can leverage the surrogate mechanism to train smaller models that are equally competitive with larger models for specific tasks while also being lightweight and easy to deploy on mobile devices.
Evaluation of impacts in practice. We are planning to integrate InterVLS into a real-world DL development and validation workflow and conduct further studies to evaluate its effectiveness in industrial applications. Our goal is to investigate how InterVLS informs the model design and identifies data issues, as well as to discover insights on the developed models. By conducting a longitudinal evaluation of the impacts in practice, we aim to gain a better understanding of how InterVLS can be used to support industrial applications and improve the performance of DL models in real-world scenarios. Through this evaluation, we hope to contribute to the growing body of research on the practical applications of explainable AI in industry.
9. Conclusion
In this work, we presented InterVLS, a novel DL model validation system that uses surrogate models built on top of vision-language concepts to facilitate efficient model understanding and “on-the-fly” concept-based model improvement. We demonstrated the effectiveness of InterVLS on the state-of-art multi-label classification model, where InterVLS enables users to analyze influential concepts of the model and tune them in a no-code manner to improve model performance on the fly. We believe that our vision-language surrogate-based model validation approach is a significant step towards developing efficient model validation systems to facilitate DL production lifecycle in the real world. We hope that our work inspires the application of LLM and vision-language pretraining to further develop human-centered artificial intelligence applications.
References
- (1)
- Bau et al. (2017) David Bau, Bolei Zhou, Aditya Khosla, Aude Oliva, and Antonio Torralba. 2017. Network dissection: Quantifying interpretability of deep visual representations. In Proceedings of the IEEE conference on computer vision and pattern recognition. 6541–6549.
- Borg et al. (2018) Markus Borg, Cristofer Englund, Krzysztof Wnuk, Boris Duran, Christoffer Levandowski, Shenjian Gao, Yanwen Tan, Henrik Kaijser, Henrik Lönn, and Jonas Törnqvist. 2018. Safely entering the deep: A review of verification and validation for machine learning and a challenge elicitation in the automotive industry. arXiv preprint arXiv:1812.05389 (2018).
- Cabrera et al. (2019) Ángel Alexander Cabrera, Will Epperson, Fred Hohman, Minsuk Kahng, Jamie Morgenstern, and Duen Horng Chau. 2019. FairVis: Visual analytics for discovering intersectional bias in machine learning. In 2019 IEEE Conference on Visual Analytics Science and Technology (VAST). IEEE, 46–56.
- Chen et al. (2019) Chaofan Chen, Oscar Li, Daniel Tao, Alina Barnett, Cynthia Rudin, and Jonathan K Su. 2019. This looks like that: deep learning for interpretable image recognition. Advances in neural information processing systems 32 (2019).
- De Oliveira and Levkowitz (2003) MC Ferreira De Oliveira and Haim Levkowitz. 2003. From visual data exploration to visual data mining: A survey. IEEE transactions on visualization and computer graphics 9, 3 (2003), 378–394.
- Devlin et al. (2018) Jacob Devlin, Ming-Wei Chang, Kenton Lee, and Kristina Toutanova. 2018. Bert: Pre-training of deep bidirectional transformers for language understanding. arXiv preprint arXiv:1810.04805 (2018).
- Dong et al. (2021) Shi Dong, Ping Wang, and Khushnood Abbas. 2021. A survey on deep learning and its applications. Computer Science Review 40 (2021), 100379.
- Dosovitskiy et al. (2020) Alexey Dosovitskiy, Lucas Beyer, Alexander Kolesnikov, Dirk Weissenborn, Xiaohua Zhai, Thomas Unterthiner, Mostafa Dehghani, Matthias Minderer, Georg Heigold, Sylvain Gelly, et al. 2020. An image is worth 16x16 words: Transformers for image recognition at scale. arXiv preprint arXiv:2010.11929 (2020).
- Ehsan et al. (2023) Upol Ehsan, Koustuv Saha, Munmun De Choudhury, and Mark O Riedl. 2023. Charting the Sociotechnical Gap in Explainable AI: A Framework to Address the Gap in XAI. arXiv preprint arXiv:2302.00799 (2023).
- Fong and Vedaldi (2017) Ruth C Fong and Andrea Vedaldi. 2017. Interpretable explanations of black boxes by meaningful perturbation. In Proceedings of the IEEE international conference on computer vision. 3429–3437.
- Ghorbani et al. (2019) Amirata Ghorbani, James Wexler, James Y Zou, and Been Kim. 2019. Towards automatic concept-based explanations. Advances in Neural Information Processing Systems 32 (2019).
- Gou et al. (2020) Liang Gou, Lincan Zou, Nanxiang Li, Michael Hofmann, Arvind Kumar Shekar, Axel Wendt, and Liu Ren. 2020. VATLD: A visual analytics system to assess, understand and improve traffic light detection. IEEE transactions on visualization and computer graphics 27, 2 (2020), 261–271.
- Hadash et al. (2022) Sophia Hadash, Martijn C Willemsen, Chris Snijders, and Wijnand A IJsselsteijn. 2022. Improving understandability of feature contributions in model-agnostic explainable AI tools. In Proceedings of the 2022 CHI Conference on Human Factors in Computing Systems. 1–9.
- He et al. (2023) Wenbin He, Suphanut Jamonnak, Liang Gou, and Liu Ren. 2023. CLIP-S4: Language-Guided Self-Supervised Semantic Segmentation. In Proceedings of the IEEE/CVF Conference on Computer Vision and Pattern Recognition. 11207–11216.
- He et al. (2022) Wenbin He, William Surmeier, Arvind Kumar Shekar, Liang Gou, and Liu Ren. 2022. Self-supervised semantic segmentation grounded in visual concepts. arXiv preprint arXiv:2203.13868 (2022).
- He et al. (2021) Wenbin He, Lincan Zou, Arvind Kumar Shekar, Liang Gou, and Liu Ren. 2021. Where can we help? a visual analytics approach to diagnosing and improving semantic segmentation of movable objects. IEEE Transactions on Visualization and Computer Graphics 28, 1 (2021), 1040–1050.
- Hohman et al. (2018) Fred Hohman, Minsuk Kahng, Robert Pienta, and Duen Horng Chau. 2018. Visual analytics in deep learning: An interrogative survey for the next frontiers. IEEE transactions on visualization and computer graphics 25, 8 (2018), 2674–2693.
- Hohman et al. (2019) Fred Hohman, Haekyu Park, Caleb Robinson, and Duen Horng Polo Chau. 2019. Summit: Scaling deep learning interpretability by visualizing activation and attribution summarizations. IEEE transactions on visualization and computer graphics 26, 1 (2019), 1096–1106.
- Hoque et al. (2022) Md Naimul Hoque, Wenbin He, Arvind Kumar Shekar, Liang Gou, and Liu Ren. 2022. Visual Concept Programming: A Visual Analytics Approach to Injecting Human Intelligence at Scale. IEEE Transactions on Visualization and Computer Graphics 29, 1 (2022), 74–83.
- Huang et al. (2022) Jinbin Huang, Aditi Mishra, Bum Chul Kwon, and Chris Bryan. 2022. ConceptExplainer: Interactive Explanation for Deep Neural Networks from a Concept Perspective. IEEE Transactions on Visualization and Computer Graphics 29, 1 (2022), 831–841.
- Huang and Li (2020) Zixuan Huang and Yin Li. 2020. Interpretable and accurate fine-grained recognition via region grouping. In Proceedings of the IEEE/CVF Conference on Computer Vision and Pattern Recognition. 8662–8672.
- Kaul et al. (2021) Smiti Kaul, David Borland, Nan Cao, and David Gotz. 2021. Improving visualization interpretation using counterfactuals. IEEE Transactions on Visualization and Computer Graphics 28, 1 (2021), 998–1008.
- Keim (2002) Daniel A Keim. 2002. Information visualization and visual data mining. IEEE transactions on Visualization and Computer Graphics 8, 1 (2002), 1–8.
- Kim et al. (2018) Been Kim, Martin Wattenberg, Justin Gilmer, Carrie Cai, James Wexler, Fernanda Viegas, et al. 2018. Interpretability beyond feature attribution: Quantitative testing with concept activation vectors (tcav). In International conference on machine learning. PMLR, 2668–2677.
- Kindermans et al. (2019) Pieter-Jan Kindermans, Sara Hooker, Julius Adebayo, Maximilian Alber, Kristof T Schütt, Sven Dähne, Dumitru Erhan, and Been Kim. 2019. The (un) reliability of saliency methods. Explainable AI: Interpreting, explaining and visualizing deep learning (2019), 267–280.
- Koh et al. (2020) Pang Wei Koh, Thao Nguyen, Yew Siang Tang, Stephen Mussmann, Emma Pierson, Been Kim, and Percy Liang. 2020. Concept bottleneck models. In International Conference on Machine Learning. PMLR, 5338–5348.
- Liu et al. (2021) Shilong Liu, Lei Zhang, Xiao Yang, Hang Su, and Jun Zhu. 2021. Query2label: A simple transformer way to multi-label classification. arXiv preprint arXiv:2107.10834 (2021).
- Lundberg and Lee (2017) Scott M Lundberg and Su-In Lee. 2017. A unified approach to interpreting model predictions. Advances in neural information processing systems 30 (2017).
- Madaio et al. (2020) Michael A Madaio, Luke Stark, Jennifer Wortman Vaughan, and Hanna Wallach. 2020. Co-designing checklists to understand organizational challenges and opportunities around fairness in AI. In Proceedings of the 2020 CHI Conference on Human Factors in Computing Systems. 1–14.
- Ouyang et al. (2022) Long Ouyang, Jeffrey Wu, Xu Jiang, Diogo Almeida, Carroll Wainwright, Pamela Mishkin, Chong Zhang, Sandhini Agarwal, Katarina Slama, Alex Ray, et al. 2022. Training language models to follow instructions with human feedback. Advances in Neural Information Processing Systems 35 (2022), 27730–27744.
- Panigutti et al. (2020) Cecilia Panigutti, Alan Perotti, and Dino Pedreschi. 2020. Doctor XAI: an ontology-based approach to black-box sequential data classification explanations. In Proceedings of the 2020 conference on fairness, accountability, and transparency. 629–639.
- Papagiannidis et al. (2023) Emmanouil Papagiannidis, Ida Merete Enholm, Chirstian Dremel, Patrick Mikalef, and John Krogstie. 2023. Toward AI governance: Identifying best practices and potential barriers and outcomes. Information Systems Frontiers 25, 1 (2023), 123–141.
- Park et al. (2021) Haekyu Park, Nilaksh Das, Rahul Duggal, Austin P Wright, Omar Shaikh, Fred Hohman, and Duen Horng Polo Chau. 2021. Neurocartography: Scalable automatic visual summarization of concepts in deep neural networks. IEEE Transactions on Visualization and Computer Graphics 28, 1 (2021), 813–823.
- Radford et al. (2021) Alec Radford, Jong Wook Kim, Chris Hallacy, Aditya Ramesh, Gabriel Goh, Sandhini Agarwal, Girish Sastry, Amanda Askell, Pamela Mishkin, Jack Clark, et al. 2021. Learning transferable visual models from natural language supervision. In International conference on machine learning. PMLR, 8748–8763.
- Ribeiro et al. (2016) Marco Tulio Ribeiro, Sameer Singh, and Carlos Guestrin. 2016. ” Why should i trust you?” Explaining the predictions of any classifier. In Proceedings of the 22nd ACM SIGKDD international conference on knowledge discovery and data mining. 1135–1144.
- Saha et al. (2020) Aniruddha Saha, Akshayvarun Subramanya, Koninika Patil, and Hamed Pirsiavash. 2020. Role of spatial context in adversarial robustness for object detection. In Proceedings of the IEEE/CVF Conference on Computer Vision and Pattern Recognition Workshops. 784–785.
- Saleem et al. (2022) Rabia Saleem, Bo Yuan, Fatih Kurugollu, Ashiq Anjum, and Lu Liu. 2022. Explaining deep neural networks: A survey on the global interpretation methods. Neurocomputing (2022).
- Samek et al. (2021) Wojciech Samek, Grégoire Montavon, Sebastian Lapuschkin, Christopher J Anders, and Klaus-Robert Müller. 2021. Explaining deep neural networks and beyond: A review of methods and applications. Proc. IEEE 109, 3 (2021), 247–278.
- Selvaraju et al. (2017) Ramprasaath R Selvaraju, Michael Cogswell, Abhishek Das, Ramakrishna Vedantam, Devi Parikh, and Dhruv Batra. 2017. Grad-cam: Visual explanations from deep networks via gradient-based localization. In Proceedings of the IEEE international conference on computer vision. 618–626.
- Simonyan et al. (2013) Karen Simonyan, Andrea Vedaldi, and Andrew Zisserman. 2013. Deep inside convolutional networks: Visualising image classification models and saliency maps. arXiv preprint arXiv:1312.6034 (2013).
- Vaswani et al. (2017) Ashish Vaswani, Noam Shazeer, Niki Parmar, Jakob Uszkoreit, Llion Jones, Aidan N Gomez, Łukasz Kaiser, and Illia Polosukhin. 2017. Attention is all you need. Advances in neural information processing systems 30 (2017).
- Vluymans et al. (2018) Sarah Vluymans, Chris Cornelis, Francisco Herrera, and Yvan Saeys. 2018. Multi-label classification using a fuzzy rough neighborhood consensus. Information Sciences 433 (2018), 96–114.
- Wang et al. (2022) Qianwen Wang, Sehi L’Yi, and Nils Gehlenborg. 2022. Drava: Concept-Driven Exploration of Small Multiples using Interpretable Latent Vectors. (2022).
- Yeh et al. (2020) Chih-Kuan Yeh, Been Kim, Sercan Arik, Chun-Liang Li, Tomas Pfister, and Pradeep Ravikumar. 2020. On completeness-aware concept-based explanations in deep neural networks. Advances in Neural Information Processing Systems 33 (2020), 20554–20565.
- Yi et al. (2007) Ji Soo Yi, Youn ah Kang, John Stasko, and Julie A Jacko. 2007. Toward a deeper understanding of the role of interaction in information visualization. IEEE transactions on visualization and computer graphics 13, 6 (2007), 1224–1231.
- Zhang et al. (2018) Jiawei Zhang, Yang Wang, Piero Molino, Lezhi Li, and David S Ebert. 2018. Manifold: A model-agnostic framework for interpretation and diagnosis of machine learning models. IEEE transactions on visualization and computer graphics 25, 1 (2018), 364–373.
- Zhang et al. (2022) Xiaoyu Zhang, Jorge Piazentin Ono, Huan Song, Liang Gou, Kwan-Liu Ma, and Liu Ren. 2022. SliceTeller: A Data Slice-Driven Approach for Machine Learning Model Validation. IEEE Transactions on Visualization and Computer Graphics 29, 1 (2022), 842–852.
- Zhao et al. (2021) Zhenge Zhao, Panpan Xu, Carlos Scheidegger, and Liu Ren. 2021. Human-in-the-loop extraction of interpretable concepts in deep learning models. IEEE Transactions on Visualization and Computer Graphics 28, 1 (2021), 780–790.
- Zhou et al. (2016) Bolei Zhou, Aditya Khosla, Agata Lapedriza, Aude Oliva, and Antonio Torralba. 2016. Learning deep features for discriminative localization. In Proceedings of the IEEE conference on computer vision and pattern recognition. 2921–2929.
- Zhou et al. (2022) Jianlong Zhou, Fang Chen, and Andreas Holzinger. 2022. Towards explainability for AI fairness. In xxAI-Beyond Explainable AI: International Workshop, Held in Conjunction with ICML 2020, July 18, 2020, Vienna, Austria, Revised and Extended Papers. Springer, 375–386.