1
PROMPT: A Fast and Extensible Memory Profiling Framework
Abstract.
Memory profiling captures programs’ dynamic memory behavior, assisting programmers in debugging, tuning, and enabling advanced compiler optimizations like speculation-based automatic parallelization. As each use case demands its unique program trace summary, various memory profiler types have been developed. Yet, designing practical memory profilers often requires extensive compiler expertise, adeptness in program optimization, and significant implementation efforts. This often results in a void where aspirations for fast and robust profilers remain unfulfilled. To bridge this gap, this paper presents PROMPT, a pioneering framework for streamlined development of fast memory profilers. With it, developers only need to specify profiling events and define the core profiling logic, bypassing the complexities of custom instrumentation and intricate memory profiling components and optimizations. Two state-of-the-art memory profilers were ported with PROMPT while all features preserved. By focusing on the core profiling logic, the code was reduced by more than 65% and the profiling speed was improved by 5.3 and 7.1 respectively. To further underscore PROMPT’s impact, a tailored memory profiling workflow was constructed for a sophisticated compiler optimization client. In just 570 lines of code, this redesigned workflow satisfies the client’s memory profiling needs while achieving more than 90% reduction in profiling time and improved robustness compared to the original profilers.
1. Introduction
Profiling techniques summarize runtime information of a specific run of the program. Examples of profile information include a summary of the hot regions of the program, edge weights on the control flow, and the frequency of manifested memory dependences. Programmers use profiles to guide debugging and tuning of programs. Compilers use profiles to guide sophisticated program optimizations (Chen et al., 2016; pogo, 2022; intelc++, 2023; g++, 2023; Panchenko et al., 2019). Memory profiling is a type of profiling concerned with memory-related program behavior and is particularly useful in overcoming the limitations of compiler memory analysis to unlock speculative transformations that can dramatically improve program performance (Connors, 1997; Liu et al., 2006; Steffan et al., 2000; Bridges et al., 2007; Thies et al., 2007; Peng Wu and Cascaval, 2008; Johnson et al., 2012a). These speculative transformations optimistically assume memory behaviors observed in profiling runs scale to production workloads. They can also preserve correctness at runtime by executing recovery code when a specific dynamic instance of an assumption is detected to be false. Since trends in profiled behavior tend to hold regardless of program input, the cost of recovery code is low compared to the gains obtained by the unlocked transformations. Performance is shown to improve by orders of magnitude for many programs (Liu et al., 2006; Steffan et al., 2000; Peng Wu and Cascaval, 2008; Bridges et al., 2007).
Many types of memory profiling have been proposed to address various needs, including memory dependence profiling (Larus, 1993; Chen et al., 2004; Zhang et al., 2009), value pattern profiling (Gabbay and Mendelson, 1997), object lifetime profiling (Wu et al., 2004), and points-to profiling (Johnson et al., 2012b). A memory profiler first tracks program events related to program’s memory behavior, like memory accesses, loop invocations, and function calls. Then, it uses the events to summarize the memory behavior in some way. Both tracking and summarizing are usually expensive. Thus, memory profilers must be heavily optimized to be practical. As a result, memory profiler developers must master a range of skills, from methods of instrumenting programs to program optimizations. To make memory profiling faster, researchers have proposed lossy techniques to reduce profiling overheads (Vanka and Tuck, 2012; Chen et al., 2004). However, such techniques are often of limited utility due to the imprecision introduced by them. As one paper puts it, “the difference in accuracy has a considerable impact on the effectiveness of the speculative optimizations performed” (Vanka and Tuck, 2012). Thus, this work focuses on precise memory profiling. Prior work also proposes optimizations without sacrificing precision, such as parallelizing the profiler to reduce the cost (Kim et al., 2010), but these optimizations are often specific to a particular memory profiler.
Without practical memory profilers, memory profiling and its clients like speculative optimizations are less likely to be adopted. For example, Perspective is a state-of-the-art speculative automatic parallelization system that requires memory profiling (Apostolakis et al., 2020a). To collect the memory profiles, it uses two off-the-shelf memory profilers, LAMP and the Privateer profiler (Mason et al., 2009; Johnson et al., 2012b). Both are state-of-the-art for the memory profiles they produce. LAMP is a loop-aware memory dependence profiler that tracks memory dependences and their loop distances. The Privateer profiler (referred to as “Privateer” for short in this paper) gathers multiple types of memory profiles, including points-to information, object lifetime, and value predictions. Both profilers are based on LLVM, making them easy to integrate into modern compiler optimizations. However, their implementation is quite complex, making them hard to adapt. They also have significant runtime overhead and fail on some complex benchmarks. These problems significantly limit the applicability of Perspective.
This paper introduces a novel factorization of memory profiling to simplify the process, enabling developers to focus solely on the core profiling logic. This approach first separates memory profiling into two main phases: the frontend and the backend. The frontend is responsible for generating memory profiling events. The backend processes these events to produce profiles. Generalization is then applied to both phases. The frontend standardizes the instrumentation of common events in memory profiling while the backend generalizes and provides commonly used memory profiling components, such as data structures, algorithms, and optimizations.
Building on this factorization, we present PROMPT, the first memory profiling framework for streamlined development of fast memory profilers. PROMPT systematizes memory profiling events and provides generalized implementations of both typical profiling components and optimizations. Using PROMPT, developers can design and implement memory profilers more efficiently without delving into compiler internals, parallel programming, or repeated implementation. Profilers developed with PROMPT are robust and performant. This can shift the perspective on memory profiling adoption. Rather than settling for off-the-shelf memory profilers with subpar performance or facing the daunting task of building a profiler, developers can now craft tailored memory profilers with low profiling overhead easily.
This paper offers the following main contributions:
-
•
proposes a novel factorization of memory profiling to simplify the development of memory profilers through separating the profiling frontend and backend and generalizing components and optimizations (§3);
- •
- •
-
•
highlights PROMPT’s impact on memory profiling with a redesigned memory profiling workflow for a sophisticated compiler optimization client, Perspective, which is succinct at 570 lines of code and reduces client profiling time by more than 90% (§6.4).
2. Background
To build an understanding of the functionality and the overhead of memory profilers from the ground up, we first analyze a typical memory dependence profiler and discuss the causes of the slowdown. Then we discuss the workflow of using memory profiling with existing systems and the difficulties in each option and show how PROMPT changes the situation of adopting memory profiling.
2.1. A Typical Memory Profiler
The memory dependence profiler is the most common type of memory profiler. This section introduces the design of a typical memory profiler and shows sources of slowdown.
Design.
Consider a vanilla memory dependence profiler that records the set of manifested memory flow dependences. A memory flow (i.e., read-after-write) dependence occurs when a memory load depends on the result of a memory store. The profiler first instruments the memory instruction and its accessed memory location for all the memory accesses. Subsequently, it identifies whether a new memory access creates a memory dependence. To do so, the profiler remembers for each memory address the store instruction that last touches it. When a load instruction is executed, a dependence is found from the latest store to the same memory location as the load instruction. Dependences, as pairs of load and store instructions, are then recorded in a data structure.
Slowdown.
The three steps, namely instrumentation, tracking the latest writes, and recording dependences in a data structure, all add additional instructions to each execution of a memory instruction in the original program. Depending on the instrumentation method, the added cycles may have various sources, such as function calls and dynamic translation. A hash map can be used to track the latest write to each memory address and a hash set for recording the profiling results; each comes with additional overhead. Depending on the implementation, an additional tens to thousands of CPU cycles can be added to each memory access, causing an overall slowdown of several to hundreds of times.
| Category | Systems |
| Compiler | LLVM (Lattner and Adve, 2004) |
| GCC (GCC Team, 2023) | |
| Instrumen- tation System | Pin (Wallace and Hazelwood, 2007) |
| DynamoRio (Bruening et al., 2012) | |
| Valgrind (Nethercote and Seward, 2007b) | |
| Memory Tracing | drcachesim (DynamoRio Team, 2023) |
| adept (Zhao et al., 2006) | |
| mTrace (mTrace Team, 2013) | |
| Memory Profilers | SD3 (Kim et al., 2010) |
| LAMP (Mason et al., 2009) | |
| Privateer (Johnson et al., 2012b) | |
| Memory Profiling Framework | PROMPT (this work) |
2.2. Different Ways to Use Memory Profiling
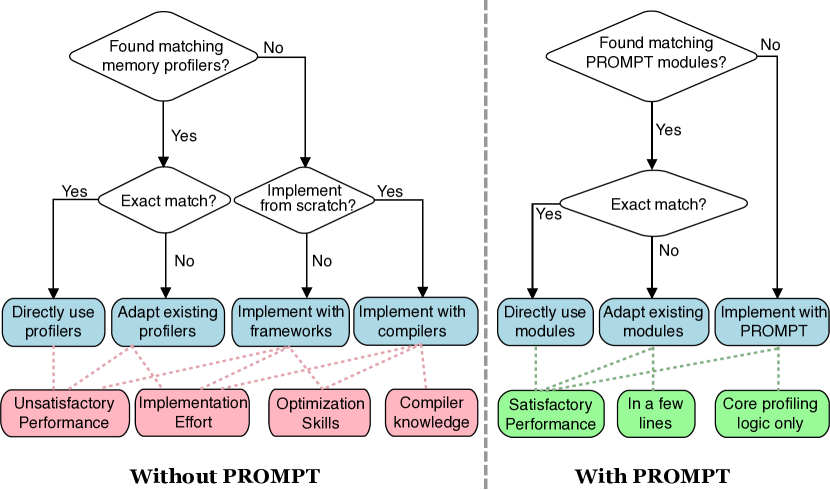
Figure 1 illustrates the workflow differences when using memory profiling with and without PROMPT, based on the systems listed in Table 1.
Before PROMPT, when users wish to use memory profiling, the first step is to check if there are existing profilers matching their requirements. SD3, LAMP, and Privateer are examples of such existing memory profilers(Kim et al., 2010; Mason et al., 2009; Johnson et al., 2012b). If the requirements diverge even slightly, adapting the tool for a new purpose becomes challenging due to its legacy codebase and monolithic design. Furthermore, existing memory profilers often have a high overhead, rendering them impractical. If no suitable profiler exists, users must create a memory profiler. Instrumentation or memory tracing systems can aid in the development of memory profilers. While specific compiler knowledge isn’t mandatory, significant implementation effort and optimization skills remain essential. Instrumentation systems typically operate at the binary level, such as Pin, DynamoRio, and Valgrind (Luk et al., 2005; Bruening et al., 2012; Nethercote and Seward, 2007b). Dynamic injection of instrumentation code by binary instrumentation systems leads to an overhead of around 1-10x, irrespective of the profiling logic’s complexity (Luk et al., 2005; Nethercote and Seward, 2007b). Tracing systems, on the other hand, create and store execution traces, processing them through online or offline analytical algorithms. For instance, drcachesim, adept, and mTrace are memory tracing systems built atop DynamoRio or Pin (DynamoRio Team, 2023; Zhao et al., 2006; mTrace Team, 2013). While these systems mitigate some implementation efforts, merely gathering the trace incurs a 10–100 overhead. This does not account for processing the acquired trace to derive profile information. An alternative approach to building a memory profiler from the ground up is to leverage a compiler directly, instrumenting at the intermediate representation (IR) level, as seen with LLVM and GCC (Lattner and Adve, 2004; GCC Team, 2023). Efficient memory profiling can be achieved this way, as other instrumentation-based systems have shown (Serebryany et al., 2012; Stepanov and Serebryany, 2015). However, users should be well-acquainted with the compiler and adept at optimizing intricate systems.
The memory profiling workflow is simplified with PROMPT. The initial step involves searching for appropriate modules within the PROMPT repository. If suitable modules are identified, they can be used directly. If adaptation is necessary, it typically requires minimal code adjustments, thanks to PROMPT’s modular design. If there is no match and a new implementation is needed, users can concentrate solely on the profiling logic and delegate the rest to PROMPT. PROMPT optimizes the workflow and diminishes the challenges associated with adopting memory profiling.
3. Overview: The PROMPT Approach
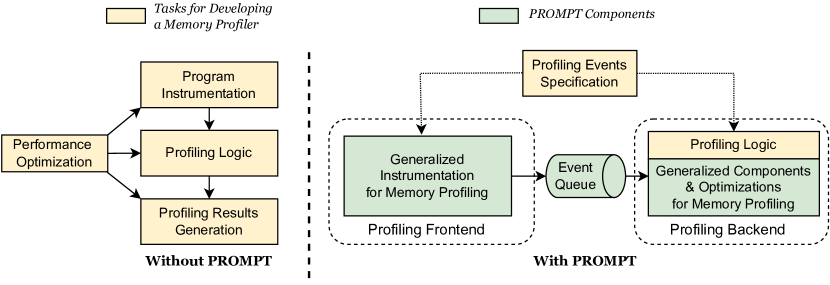
As discussed in §2.1, a memory profiling pipeline can be broken down into three steps — instrumenting profiling events, the profiler-specific logic that generates profiling results, and recording and storing profiling results. Thus, crafting a memory profiler necessitates an intricate understanding and considerable effort in areas such as instrumentation, the formulation of profiling logic, and storing the profiling results in certain data structures—all while ensuring expedient performance, as illustrated on the left side of Figure 2. However, it is really the core profiling logic a profiler developer is interested in. To allow developers to focus only on the core profiling logic, this paper presents a novel factorization of memory profiling pipeline, termed as the PROMPT approach.
Separation.
Inspired by the implementation of some existing profilers (Ketterlin and Clauss, 2012; Johnson et al., 2012b; Deiana et al., 2023), the PROMPT approach first decouples the profiling into two parts: the event generation (‘frontend’) and the profile formulation (‘backend’). The profiling frontend instruments the program and tracks profiling events and corresponding values. The profiling backend consumes the events, runs the profiling logic, and generates the profiles. The frontend and the backend are connected through an event queue. This clear separation has three main benefits. First, it allows the profiler writer to separate the concerns of instrumentation from the core profiling logic. Second, it reduces the interference of profiling logic with the program under profile. Moreover, it makes it easier to have multiple profiling backends to enjoy parallelism without rerunning the program. While the design of separated frontend and backend has been used in existing profilers, PROMPT is the first to generalize it as a unified framework that applies to all existing memory profilers. The enforcement of decoupled frontend and backend while easing the connection between them is the key to PROMPT’s extensibility and performance.
Generalization.
Separation alone doesn’t guarantee extensibility and performance. Another observation is that existing memory profilers have many overlapping components and optimizations. By generalizing these components and optimizations, a memory profiler can be built much more easily and efficiently. More precisely, the generalization process involves identifying common components with similar functionalities and developing them with a flexible interface. The interface should be easily specialized by the profiler developers for their specific needs. For the profiling frontend, the profiling events need to be generalized. The profiler developers should be able to choose from a set of categorized and standardized events, and only the events and values the profiler requires will be instrumented. Meanwhile, in the profiling backend, shared data structures, algorithms, and optimizations should be made generic, serving as foundational elements for developers when implementing their profiling logic.
With the PROMPT approach, the profiler developers only need to specify the profiling events and implement the core profiling logic, as shown on the right side of Figure 2.
4. Design
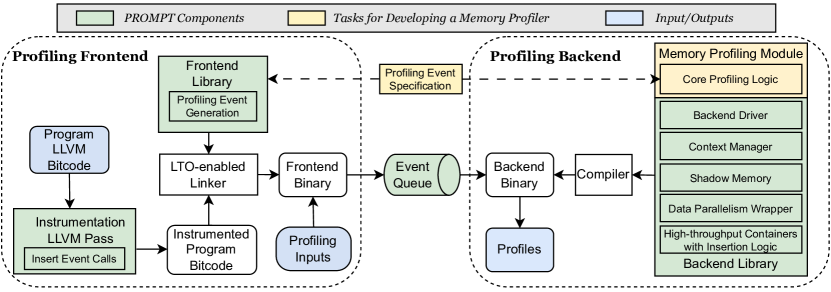
Figure 3 shows the design of PROMPT and the workflow of a memory profiler implemented on top of it. PROMPT instruments the program with profiling events in the profiling frontend and generates the frontend binary. To implement a memory profiler, one implements a profiling module in the profiling backend with the help of PROMPT’s backend library, and compiles it to a backend binary. A profiling process happens when we run the frontend and backend binary with profiling inputs. The profiling process and the backend process communicate through the event queue. The backend process will generate the profile.
4.1. Generalizing Memory Profiling Components
The profiler writer still needs to implement many functionalities to build a memory profiler, many of which are common across different memory profilers. For example, many profilers need to keep a map from the memory address to the metadata. PROMPT recognizes this and provides a set of common components to ease the implementation of the logic of a memory profiler.
Profiling Frontend
PROMPT introduces a generic frontend designed to instrument the program, thereby facilitating the generation of memory profiling events. A categorization and standardization of profiling events, prevalent in existing memory profilers, is performed. Moreover, each event encompasses a set of arguments. Section §5.1 discusses the event types and their respective arguments in detail. Additionally, PROMPT instruments the source code with callback functions, which sequentially push the profiling events to the queue.
Profiling Backend
PROMPT provides an array of generic backend components to streamline the development of memory profilers. Shadow memory profiling, previously employed in various dynamic program analysis tools (Zhao et al., 2010; Nethercote and Seward, 2007a), operates by storing metadata in a distinct shadow memory location. PROMPT includes a versatile shadow memory that can be tailored to accommodate specific metadata requirements. Often, memory profilers necessitate tracking context, such as the call stack and loop nest, with the context information of a particular event potentially being encoded in the shadow memory for future retrieval. PROMPT provides a generic context manager adept at encoding and decoding such contexts. Furthermore, memory profilers frequently utilize containers, such as sets and maps, coupled with a certain insertion logic to document profiling results — for instance, generating a new entry or incrementing a count in a map from dependence. PROMPT offers various containers equipped with predefined insertion logic to facilitate this process.
4.2. Generalizing Memory Profiling Optimizations
Optimizations are imperative for memory profilers to ensure viable performance and practical utility. While numerous optimizations are prevalent across existing memory profilers, their instantiation in disparate forms renders generalization a nontrivial task. PROMPT facilitates a generalized approach to two main optimizations, specialization and parallelism, thereby enabling most memory profilers to use them with minimal developmental effort.
Removing unnecessary instrumentation.
Memory profilers may only care about a subset of events. We use the specialization technique to remove unnecessary events and reduce overhead (Reps and Turnidge, 1996). A way to do specialization can be at the instrumentation time. We can configure the LLVM pass to only instrument the necessary calls and arguments. However, this requires a complicated way to communicate with the LLVM pass. Instead, PROMPT does the specialization at link-time. As shown in Figure 3, PROMPT gets the profile event specification from the module implemented by each profiler. PROMPT then automatically specializes the frontend library that generates profiling events to the queue based on the specification. For any irrelevant event, an empty function body will be generated. For any information not required for an event, the argument will not be pushed to the queue. At link time, we enable link-time optimization. The compiler will automatically optimize any dead instructions, empty functions, unused arguments, and all instrumented code to produce them (see profiling frontend in Figure 2). In this way, PROMPT removes the cost introduced by generic events without configuring the LLVM pass. We have verified the validity of this approach by examining the generated binaries to confirm that the generic event handling was removed. This link-time specialization makes the instrumentation LLVM pass easy to implement and easy to maintain.
Data Parallelism
Another common optimization among memory profilers is the parallelism. PROMPT makes it easier to leverage parallelism. One form is the address-based parallelism that state-of-the-art memory profilers implement for their specific task (Kim et al., 2010). Multiple profiling backends can run in parallel to process profiling events to decoupled chunks of address space, as shown in the profiling thread of Figure 2. PROMPT generalizes this to other types of data parallelism, such as parallelism of tasks on different originating instructions instead of different addresses. It also provides a wrapper to adopt data parallelism easily. A memory profiler built with PROMPT only needs to mark that an operation is decoupled based on the address of other values and provide a method for merging results. PROMPT will manage the parallelism at runtime.
4.3. Trading Latency for Throughput
PROMPT uses a pivotal insight to enhance performance markedly: trading latency for throughput. Here, throughput is defined as the number of events processed within a given time unit, while latency represents the time interval between a memory event’s generation at the frontend and its processing at the backend. Given that memory profilers only supply aggregated summaries—or profiles—upon completion and do not necessitate real-time feedback, latency does not emerge as a critical aspect for memory profilers. However, due to the typically immense data volumes generated in memory profiling, a system with high throughput becomes imperative to expediently process the memory events. Any bottleneck in the queue, profiling logic, or result-storing containers will hamper the entire process. Consequently, numerous components within PROMPT are intentionally crafted to prioritize throughput over latency.
This optimization is primarily realized by incorporating buffers into bottleneck-inducing components, thereby redistributing the load to other components which can harness parallelism or alternative optimizations to boost throughput. One example is the queue situated between the frontend and backend. We identified the main throughput bottleneck as the overhead of writing events to the frontend queue. PROMPT counteracts this by employing a blend of ping-pong buffer design and streaming writes, ensuring the frontend can inscribe to the queue with minimal latency (refer to §5.2 for further details). Another illustration involves the containers responsible for storing profiling results. It is customary for these containers to experience a deluge of stores within a brief window, interspersed with periods devoid of reads. Thus, PROMPT utilizes a buffer to aggregate the stores, performing the reduction (typically in parallel) only when the buffer reaches capacity or when a read is initiated (see §5.3 for additional details).
5. Implementation
PROMPT’s frontend, backend, and profiling modules are developed in C++, while its instrumentation is built upon the LLVM compiler infrastructure. PROMPT’s instrumentation pass is currently built on LLVM 9.0.1 in order to align with the latest versions of LAMP, Privateer, and Perspective (Liberty Research Group, 2022). The frontend has around 3400 lines of code, with 2600 for the instrumentation pass and 800 for the frontend library. The backend has around 3000 lines of code, with 900 for the backend driver, 400 for the context manager, 200 for the shadow memory, 100 for the data parallelism wrapper, 1000 for the high-throughput data structures, and some other utilities. The queue has around 500 lines of code. Note that PROMPT is still under active development, so the code size may change in the future. PROMPT is open-source (PROMPT Team, 2023).
5.1. Profiling Events
| Event Category | Events | Information |
| Memory Access | Load | Instruction ID, address, value, size |
| Store | Instruction ID, address, value, size | |
| Pointer Creation | Instruction ID, address, type | |
| Allocation | Heap Allocation | Instruction ID, address, size |
| Heap Deallocation | Instruction ID, address | |
| Stack Allocation | Instruction ID, address, size | |
| Stack Deallocation | Instruction ID, address | |
| Global Initialization | Object ID, address, size | |
| Context | Function Entry | Function ID |
| Function Exit | Function ID | |
| Loop Invocation | Loop ID | |
| Loop Iteration | Loop ID | |
| Loop Exit | Loop ID | |
| Program Starts | Process ID | |
| Program Terminates | Process ID |
PROMPT provides three categories of profiling events — memory access, allocation, and context events, as listed in Table 2. Most events are instrumented at the LLVM IR level by adding callback functions right after the corresponding event with all the information through function arguments. For example, a load event will be followed by an onLoad(instrId, address, value, size). Heap allocation and deallocation events are tracked using library interposition, so allocations in external functions can be tracked to provide a complete view of the memory space (GNU C Library Team, 2023).
5.1.1. Adding Profiling Events
PROMPT provides a comprehensive set of profiling events, adequately addressing the requirements of many existing memory profilers, yet the necessity for additional events in future developments is acknowledged. Although the addition of new events presents its own challenges, the decoupled design of PROMPT facilitates a clearer and more straightforward implementation process compared to current memory profilers. The procedure involves initially specifying the event and its potential values, followed by crafting the instrumentation in the LLVM pass, and finally integrating the corresponding callback function into the frontend library. It is noteworthy that designing the instrumentation is the most complex part of this process, requiring a solid understanding of the LLVM IR.
5.2. Event Queue
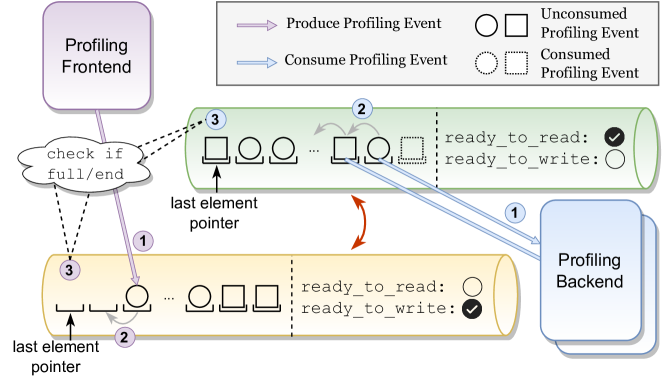
The queue helps PROMPT break up the frontend and backend. PROMPT needs an SPMC (single-producer-multiple-consumer) queue, where the producer is the profiling frontend, and the consumers are multiple workers in the profiling backend. We observe that memory profilers do not have latency requirements for the queue. The additional cycles introduced by the instructions instrumented rather than the memory throughput bounds the queue performance (Jablin et al., 2010). We implement a high-throughput SPMC queue specialized for the memory profiling task. The queue uses a ping-pong buffer design (Swaminathan et al., 2012) as shown in Figure 4. The advantage of a ping-pong buffer design lies in the fact that producers and consumers do not need to communicate until one buffer reaches its capacity. Thus, the producer can keep writing to one buffer, without communication, until that one is full. Then, it checks whether the other buffer is ready. The vice versa is true for the consumer. This greatly reduces the communication overhead between the producer and the consumer.
To reduce the wait time of the writes and reduce interfering with the program under profiling, the queue uses streaming writes(Krishnaiyer et al., 2013). Streaming write is a feature of the X86 architecture. It bypasses the cache hierarchy and improves the frontend code performance by avoiding “contaminating” the cache. The writes are very efficient by using a relatively large buffer (more than 1MB).
The SPMC queue is bounded, thus the producer and consumers must communicate at the end of one buffer by checking whether the other buffer is ready. We can reduce the frequency of checking by making the buffer bigger, leveraging the latency-insensitive insight. A bigger buffer also makes parallelism at the backend more efficient by amortizing the cost of parallel workers. With streaming writes, the buffer already bypasses the cache hierarchy, so a bigger buffer size has minimal performance drawbacks. The large buffer size also smooths out spikes in the producer.
5.3. Backend Components
Backend Driver.
The backend driver consumes the events from the queue and calls the corresponding call of the profiling modules. It manages profiling threads if data parallelism is used (§4.2).
A Generic Shadow Memory.
PROMPT provides a generic shadow memory that can be configured to fit metadata of different sizes. It takes care of allocation and deallocation automatically. PROMPT applies a direct mapping scheme that applies a shift and mask to all memory addresses to translate from program to shadow addresses. It is an efficient implementation of the map from the memory address to the metadata.
A Generic Context Manager.
The context manager in PROMPT provides a generic way to manage the context. It interacts with a profiler to transform, encode, and decode a context. It keeps track of the current context through transform APIs (e.g., pushContext(type, ID), popContext(type, ID)). It provides multiple ways to encode and decode a context. One way is through a map of manifested context to a counter. Caching optimizations are used to reduce the lookup cost of decoding the context. If the context is simple enough, the context manager will use the concatenation of the context as the encoding. Note that due to synchronization, sharing one context manager can be problematic, so PROMPT maintains a separate context manager for each backend thread.
Data Structures with Insertion Logic.
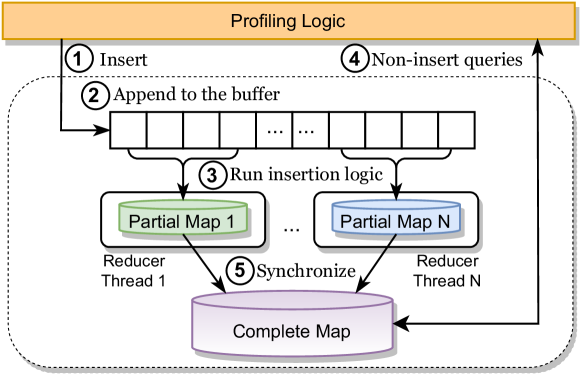
To help memory profilers simplify the logic, PROMPT provides data structures with built-in insertion logic, including checking for constant, counting, summing, or finding the minimum and maximum. htmap_constant is a map from a key to the value if it is constant. htmap_count is a map from a key to its count. htmap_sum/min/max is a map from a key to the sum, minimum, or maximum of all values corresponding to a key. htmap_set is a map from a value to a set with an optional size limit. One thing in common with all these data structures is that the insert operation is reducible. For example, for Map_Sum, which provides a map from keys to the sum of values, inserting to this map translates to summing up values to each key, which is a reducible operation. A reducible operation can be executed in any order in parallel. With this observation, we provide parallelism as a part of these maps. As shown in Figure 5, all the insertion to the map is buffered to a vector with a fixed reserved size, and once the buffer is full, many workers will do the reduction in parallel. Each takes a chunk of the buffer and reduces it to its local map. Only when any API other than insertion is called will the workers merge the local map into the global one. This design works well with a memory profiler, where insertion is almost always the only operation to the profiling data structure during profile time. To improve efficiency, PROMPT adopts a thread pool, where the reduction thread will stay in the background waiting for the tasks. In addition to the maps, PROMPT also provides drop-in replacements for set and unordered_set(hash set) that provide the same optimization. These replacements do not offer complete C++ STL support; however, they handle common APIs that adequately meet the requirements of a memory profiling module.
5.4. Implementing a Memory Profiler with PROMPT
To implement a new memory profiler with PROMPT, one only needs to declare the subset of relevant events listed in Table 2 and implement core profiling logic in the callback functions of events. The components defined in §4.1 and §4.2 are available to ease the implementation and provide good performance out of the box. Listing 6 shows how a value pattern profiler works. It tracks all loads and records those that have constant loaded values.
Here are several example memory profilers implemented with PROMPT and the core logic. A Memory Dependence Profiler tracks the source and destination of a memory dependence, optionally the related loops, contexts, and counts. A profiler can use shadow memory to track the last load/store instruction and additional information to each memory address, the record dependence if discovered. Figure 2 shows a memory-dependence profiler. A Value Pattern Profiler tracks whether the value of a memory access follow some patterns, such as always a constant. A profiler can use PROMPT’s components to automatically check for the constant pattern. The module in Listing 6 shows such a profiler. A Points-to Profiler maps each pointer to the set of memory objects that it points to. A profiler can first uniquely identify memory objects at allocation time using the instruction ID and the context tracked by the context manager, track the object information in the shadow memory, and record the object associated with the specific address at pointer creation time. An Object-Lifetime Profiler tracks the lifetime of each object and checks if it is dynamically local to a scope such as a loop. A profiler can track the uniquely identified memory objects similar to the points-to profiler, check the shared context of allocation and deallocation, and record the object and the shared context.
6. Evaluation
PROMPT is designed for extensive extensibility, seamlessly supporting a wide array of applications. As §6.2 illustrates, porting LAMP and Perspective, two state-of-the-art LLVM-based profilers, to PROMPT reduces more than half of the code size and makes the code easier to understand. Many variants of memory dependence profilers can also be adapted from a basic profiling module with a few lines of code.
In terms of speed, evaluations in §6.3 compare it against LAMP and the Privateer profiler on SPEC CPU 2017 benchmarks, showing that PROMPT is 5 faster than LAMP and 6 faster than Privateer profiler on average. Moreover, across a myriad of memory dependence profilers with diverse goals and technologies, PROMPT’s speed is consistently equivalent or superior (§6.3.2).
§6.4 underscores the impact of PROMPT by redesigning the memory profiling workflow for Perspective (Apostolakis et al., 2020a). In 570 lines of code, the new workflow satisfies Perspective’s memory profiling needs while reducing profiling overhead by 95%. The new workflow is also more applicable to more complex applications. The design elements of PROMPT are evaluated separately to understand how they drive PROMPT’s performance in §6.5, where PROMPT’s memory and binary size overheads are also discussed.
6.1. Experiment Setups
All performance experiments are run on a machine with two Intel Xeon E52697 v3 processors with 252 GB of memory. The operating system is 64-bit Ubuntu 20.04 LTS.
PROMPT is evaluated against SPEC CPU 2017 suite when comparing against LAMP and Privateer. Each benchmark is first compiled and linked into one LLVM bitcode file, which is the same preprocessing workflow as LAMP and Privateer, and required by Perspective. Due to the limitation of this pipeline, FORTRAN benchmarks (lack of flang for the LLVM version) and 502.gcc (muldefs not supported with llvm-link) from SPEC 2017 are excluded. The evaluation contains 15 C/C++ benchmarks from the SPEC CPU 2017 suite with 3.6 million lines of code combined (Bucek et al., 2018), In the case study (§6.4), benchmarks from the Perspective paper are also used to do the performance comparison (Apostolakis et al., 2020a). All evaluation use the training inputs since reference inputs would be more appropriate for evaluating the clients’ performance with the profiling information.
6.2. PROMPT’s Extensibility
§5.4 shows concretely how easily the memory profilers are implemented. Memory profilers can be implemented with PROMPT by expressing only the core logic. Adaptation of existing memory profilers is also much easier with PROMPT.
| Components | LOC | |
| Original LAMP | Ported with PROMPT | |
| Instrumentation | 713 | N/A (provided by PROMPT) |
| Event Generation | 803 | N/A (provided by PROMPT) |
| Event Specification | N/A | 13 |
| Core Profiling Logic | 668 | 898 |
| Memory Map (Shadow Memory) | 691 | N/A (provided by PROMPT) |
| Total LOC | 2875 | 911 |
| Components | LOC | |
| Privateer Profiler | Ported with PROMPT | |
| Instrumentation | 3161 | N/A (provided by PROMPT) |
| Event Generation | 464 | N/A (provided by PROMPT) |
| Event Specification | N/A | 19 |
| Queue | 227 | N/A (provied by PROMPT) |
| Core Profiling Logic | 1401 | 1486 |
| Total LOC | 5253 | 1505 |
PROMPT allows developers focus on core profiling logic only
Two existing memory profilers, LAMP and the Privateer profiler are ported to PROMPT. Table 3 and Table 4 show the LOC of the original and the ported version of them. cloc tool is used to count the lines of code (LOC) Blank lines and comments are excluded (Danial, 2021). For both profilers, porting to PROMPT reduces around 70% of the LOC by focusing on the core profiling logic. The instrumentation with LLVM alone requires thousands of lines. Other shared components like the event generation, shadow memory, and the queue are also provided by PROMPT to reduce the implementation effort.
PROMPT is easy to adapt
| Extensions (incremental) | LOC Delta |
| + Dependence count (Mason et al., 2009; Ketterlin and Clauss, 2012) | 1 |
| + All dependence types (Morew et al., 2020) | 10 |
| + Dependence distance (Yu and Li, 2012a; Kim et al., 2010) | 7 |
| + Context-aware (Kim et al., 2017; Chen et al., 2004; Sato et al., 2012) | 16 |
The memory dependence profiler is the most well-studied memory profiler. A memory dependence profiler can track the sources and sinks of memory dependences, the frequencies, loop-carried or loop-independent, distances, and contexts, for all types of memory dependences (flow, anti, and output) (Kim et al., 2010; Chen et al., 2004). In Table 5, we start from a basic memory flow-dependence profiler and incrementally adapt it to other variants of memory-dependence profilers by changing a few lines.
6.3. PROMPT’s Speed
6.3.1. Comparing Against LAMP and Privateer Profiler
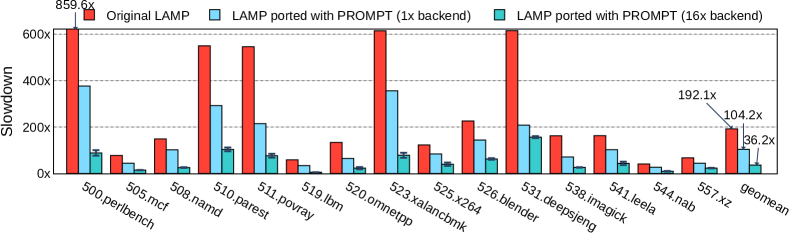
To ensure a direct and meaningful comparison, LAMP and Privateer, both of which target LLVM IR—precisely where PROMPT operates, are evaluated. PROMPT is set to generate equivalent profiling information as the original profilers and is evaluated on the same set of benchmarks. We ran each benchmark for original LAMP and Privateer profiler once due to the long profiling time (more than 10 hours for a few benchmarks). For all ported version, the data represents the average (mean) of five runs. The error bars indicate the 99% confidence interval. Given that the error bars for all other versions are visually negligible, we only display the error bars for the ported LAMP with 16 backend threads. As Figure 7 shown, for LAMP, the ported version running with 16 threads on the backend runs 5.3 on average. The performance improvement first comes from the pipeline parallelism from the decoupled design. As shown with the ported LAMP with one backend thread, the performance almost doubles. The second source of performance improvement is the parallelism wrapper added in a few lines of code (§4.2). In this experiment, we used up to 16 backend threads to consume the profiling events which brings an additional three times speedup.
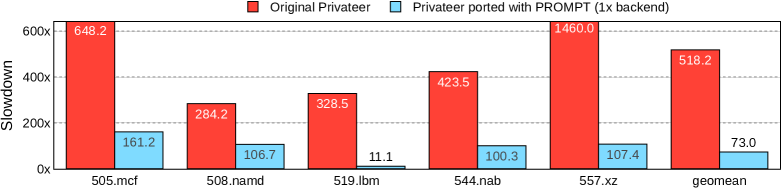
Due to the design limitations, the Privateer profiler fails to run or times out after 24 hours on ten out of the 15 SPEC 2017 benchmarks. Thus, we compare the performance on rest five benchmarks in Figure 7. The ported version is 7.1 faster on average. This improvement was above our expectation. Due to the complex design of the Privateer profiler, we did not apply data-level parallelism to it. Moreover, because the original profiler also has a frontend-backend design, the algorithms for the original and the ported Privateer profiler are essentially the same. Upon close inspection, we found that the performance improvement comes from the optimizations in PROMPT’s event queue. The original Privateer profiler’s bottleneck is in the frontend, during generating events to the queue. PROMPT significantly reduces the overhead of generating events to the queue using the high-throughput queue (§5.2).
Note that for both ported profilers, we did not alter the core logic or the profiling needs to achieve the performance improvement. The performance improvement comes from the generalized optimizations in PROMPT. In §6.4, we show how to further improve the performance by redesigning the memory profilers with PROMPT, where we tailor the memory profiling workflow to the client’s needs.
6.3.2. Comparing Against Other Memory-Dependence Profilers
| Extensions (incremental) | PROMPT’s Geomean Slowdown Running on SPEC 2017 Benchmarks | Prior Reported Slowdowns |
| Dependence count | 7.5 | 88–118 |
| All dependence types | 10.2 | 28–36 |
| Dependence distance | 10.8 | 5–29 |
| Context-aware | 13.1 | 39–132 |
Table 6 shows the slowdown of PROMPT running on SPEC 2017 benchmarks and the slowdown of prior work reported in the paper. All other work focusing on memory dependence profiling, listed in Table 5, is implemented with different technologies and evaluated on different benchmarks on different machines. Comparing the performance of PROMPT against all these memory profilers is challenging. Thus, the goal here is to show that the performance of PROMPT is consistent with existing memory-dependence profilers.
6.4. Redesigned Memory Profiling for Perspective
In the current implementation, Perspective uses LAMP and Privateer Profiler. In §6.3.1, PROMPT is evaluated against LAMP and the Privateer profiler while reproducing their profiling output. However, not all profiling functionalities and configurations are necessary to fulfill the profiling needs of Perspective. With PROMPT, we redesigned the memory profilers to exactly match Perspective’s needs with first principles and show the benefits of PROMPT in this case study.
| Profiling Needs | PROMPT Profiling Module | LOC |
| Memory Flow Dependence Speculation | Memory Dependence | 136 |
| Value Speculation | Value Pattern | 69 |
| Short-lived Object Speculation | Object Lifetime | 117 |
| Points-to Speculation | Points-to | 248 |
| Total LOC | 570 | |
Streamlined Development
We first identify the four memory profiling needs of Perspective as shown in Table 7. Because Perspective works on a loop basis, the memory profilers are only needed for the hottest loop identified by the compiler. We implement four memory profiling modules, memory-dependence profiler, value-pattern, object-lifetime, and points-to profiling to cover Perspective’s needs. The four memory profilers with PROMPT only require 570 lines of code, a dramatic reduction of the required implementation effort.
Faster Profiling.
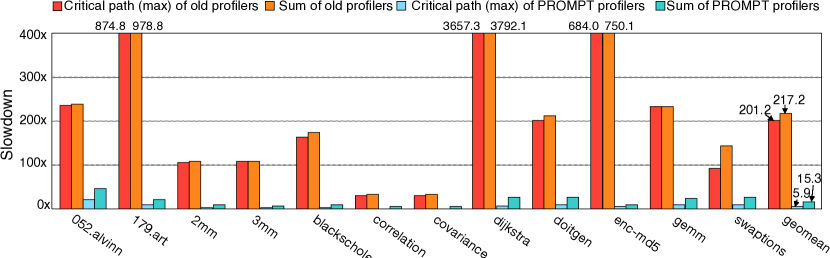
We compare the profiling time overhead with PROMPT and the existing profilers used in Perspective. The critical path of the profiling workflow is the longest-running profiler because independent profilers can be executed in parallel with the same input. We show the critical path of both workflows and also the sum of all profilers in each workflow in Figure 8. PROMPT reduces the critical path slowdown from 217.2 to only 5.9 and the sum of profiling time from 201.2 to 15.3. All results are the average (mean) of five runs. In our experiments, the maximum coefficient of variation (the ratio of the standard deviation to the mean) over all benchmarks and all runs is 0.13, thus the error bar is omitted from the visualization due to the little variance compared to the performance difference shown. Regardless of the metric, PROMPT reduces the profiling time by more than 90%. One source of the slowdowns in LAMP and Privateer is from building multiple functionalities in one monolithic profiler. This introduces unnecessary functionality and the corresponding overhead. PROMPT breaks down the profiling tasks into modules each focusing on a single task. Note that targeting the hottest loop, as PROMPT’s profilers use, is another way of reducing the unnecessary overhead. PROMPT further optimizes the performance using parallelism in both the address-based and the one built in the data structures like hash maps.
Improved Applicability to Complex Benchmarks.
As mentioned in §6.3, the Privateer profiler fails or times out on ten out of the 15 SPEC 2017 benchmarks. This is not a coincidence. In fact, the clients using these memory profilers are constrained by them, so they cannot evaluate on bigger benchmarks. SCAF, a system that shares the same memory profilers as Perspective, identifies that the memory profilers are “implemented in-house, lacking industrial-level robustness in implementation” (Apostolakis et al., 2020b). Thus, it was limited to only three SPEC 2017 benchmarks due to poor memory profiler robustness or performance. Even for LAMP, which works for all SPEC 2017 benchmarks, or the Privateer, when it works, the overhead is still significant as shown in §6.3. The robustness and the performance of the memory profilers are critical to the applicability of memory profiling to more complex benchmarks. The four memory profiling modules redesigned for Perspective exhibit greater robustness and performance than their original counterparts. Three modules (memory dependence, value pattern, and object lifetime) can run on all SPEC 2017 benchmarks. The points-to profiling module, which follows the same logic of the parts of the original Privateer profiler which have design limitations, fails on eight benchmarks. Two additional benchmarks work compared to Privateer due to the memory allocation event hook in PROMPT which allow external calls with memory allocation to be captured. With the much-isolated codebase, we can also identify the root causes of the failed benchmarks. The primary constraints include a lack of support for longjump/setjump and the handling of non-null pointers to memory that should not be dereferenced. We are working on addressing these issues in a future version of the module.
Performance-wise, the maximum slowdown for all modules is less than 35, and most benchmarks are either below or around 10, a huge improvement over the original profilers discussed in §6.3. These overheads, which translate to less than an hour of profiling time for benchmarks that typically run for a few minutes, are sufficiently practical for users to test clients using them. By enhancing the memory profiling workflow for more complex benchmarks, PROMPT simplifies the adoption of systems like Perspective that rely on memory profiling.
6.5. Performance Analysis
|
|
Improvement | ||||
| Baseline | 21.89 | N/A | ||||
| Specialization | 14.48 | 51% | ||||
| High-throughput Queue | 12.29 | 18% | ||||
| Data Parallelism | 7.84 | 57% | ||||
| High-throughput Data Structure | 7.26 | 8% |
The performance improvement of PROMPT comes from designs discussed in §4 and §5. In Table 8, we use the redesigned memory dependence profiler in Table 7 to show the effect of each technique. All results are evaluated on SPEC 2017 benchmarks. The baseline is the memory dependence profiler without any optimization and we incrementally apply each optimization to the baseline. Note that these improvement numbers are specific to this profiler. Different memory profilers may benefit differently from each technique.
Specialization
| Profiler |
|
|
|
|
||||||||
|
17.19 | 54.04 | 71.86 | 52.89 |
Table 9 shows the reduction of the number of events with specialization for different profilers. With specialization, the reduction of the profiling events is significant, ranging from 17% to 72%.
High-Throughput Queue
| Queue Type | Time (ms) | |
| boost::lockfree(Szuppe, 2016) | queue | 4603.7 |
| spsc_queue | 555.1 | |
| Liberty Queue (Jablin et al., 2010) | 48.6 | |
| PROMPT Queue | 1 Consumer | 26.8 |
| 8 Consumers | 32.2 | |
We compare the performance of our queue implementation against others (two from Boost (Szuppe, 2016) and the Liberty queue (Jablin et al., 2010)). We run it with a benchmark where two processes communicate ten million events from the trace of 544.nab through a shared-memory queue. The boost::lockfree::spsc_queue, Liberty queue, and PROMPT queue are configured with the same queue size (2MB). The boost::lockfree::queue is set to its max queue size of 65534. We repeat the runs 50 times and take the average. As shown in Table 10, the PROMPT’s queue outperforms other queues by at least 81%. The performance improvement comes from optimizations in §5.2 that reduce the overhead of event production. The throughput difference from one consumer to eight consumers is only 20%, a small cost to enable generic data parallelism.
Data Parallelism Wrapper
| Parallel Workers | 1 | 2 | 4 | 8 | 16 | 32 |
| Geomean Slowdown () | 12.3 | 10.4 | 8.3 | 7.8 | 7.6 | 9.0 |
Table 11 shows the slowdowns of the memory dependence profiler with different numbers of workers for data parallelism. The numbers are the geomean slowdowns of all SPEC CPU 2017 benchmarks and the high-throughput data structures are turned off for this evaluation. On the machine we tested on, data parallelism improves the performance till 16 workers then starts to drop.
High-throughput Data Structures
We evaluate the performance with a benchmark that inserts ten million dependences to htmap_count that keeps the count of the dependence §5.3. The dependences are collected from the trace of 544.nab. We run it ten times and take the average. We compare the performance against two maps from C++ standard library, and phmap::flat_hash_map, a more efficient open-source hash map implementation from parallel-hashmap library based on Abseil(greg7mdp, 2023; Abseil Team, 2023). The high-throughput map outperforms the standard library maps significantly; and it outperforms flat_hash_map starting from two threads; with 32 threads, the performance almost doubles. The time of the baseline shows if the insertion to the map is completely gone and is the upper limit of our map.
| Implementation | Time (ms) | |
| libstdc++ (6.0.28) | map | 319 |
| unordered_map | 264 | |
| Parallel Hashmap (1.3.8)(greg7mdp, 2023) | flat_hash_map | 102 |
| PROMPT Data Structure htmap_count | 1 | 126 |
| 2 | 91 | |
| 4 | 75 | |
| 8 | 70 | |
| 16 | 60 | |
| 32 | 53 | |
| Baseline | 33 | |
Memory and Binary Size Overhead
The memory overhead of the profiling frontend is the constant size oversize introduced by the buffer of the queue. The memory overhead of the backend comes from the constant size from the backend code and data sections, the data structures to store the profiling information, and auxiliary data structure during runtime. Due to the reduction nature of the profiling process, the memory overhead of the profiling information data structures is usually small. The auxiliary ones depend on the implementation of the profiler. A most significant and common cost comes from the shadow memory that enables mapping from the address to the metadata. The overhead of the shadow memory is bounded by , where P is the shadow memory ratio (number of bytes of metadata per byte of memory) and C is the constant cost including the queue and other auxiliary data structures. The data parallelism does not increase the memory overhead because the workers share the same memory space. We measured the peak memory overhead of the memory dependence profiler running on all SPEC 2017 benchmarks. When the fixed queue is excluded, the backend memory overhead ranges from 20% to 9.7. The instrumented binary size is 17% to 231% larger than the original.
7. Discussion
Potential Applications
The most important application of PROMPT is speculative optimization. While speculative optimizations, including automatic parallelization, have been shown to be effective and broadly applicable (Apostolakis et al., 2020a; Bridges et al., 2007; Johnson et al., 2012b; Thies et al., 2007), these systems have not been widely adopted largely because of problems with memory profiling. By reducing the runtime and engineering costs, PROMPT can greatly help speculative optimization clients. PROMPT also has the potential to attract a diverse range of users to build various profilers on top of it or use it for different clients. Multiple use cases beyond speculative optimization can be addressed using the existing profilers in PROMPT, such as memory prefetching, memory object layout optimization, and security analysis.
Types of memory profiling not supported by PROMPT
Memory profilers that alter the behavior of the program being profiled, such as simulating the behavior of a hypothetical load instruction not present in the original program (perhaps for prefetching), are not ideally suited for PROMPT. While it is feasible to add new events to the frontend, as elaborated in §5.1, it is crucial that these added events do not modify the behavior of the program being profiled. They should only report such events, in line with the design principles of PROMPT. We believe that most memory profiling use cases can be addressed by solely implementing the profiling logic on the backend, using existing profiling events.
Multi-threaded programs
At present, PROMPT solely supports single-threaded programs, as its primary motivation lies in speculative automatic parallelization clients that only necessitate this level of support. To expand its capabilities for multi-threaded workloads, events produced from multiple threads can either be combined into a single queue or assigned to individual SPMC queues for each thread. The most suitable approach depends on the requirements of the memory profiling modules.
Profiling without source code available
PROMPT provides full precision when the source code is available at compile time. Functions from libraries that do not have source code available at compile time are detected during compilation and reported to the client, who can then decide how to proceed with the profiling results. In many cases, the profiling results are still helpful but need to be conservative in cases involving external calls. A potential enhancement for PROMPT could involve incorporating binary profiling. The decoupled design of PROMPT simplifies the implementation process for such an addition.
Beyond memory profiling
A memory profiler tracks memory-related events as listed in Table 2. Other types of profilers can be implemented with this framework, as the list of possible events encompasses more than just memory events. However, PROMPT’s design is highly optimized for memory profiling. Other profilers may not have as high a throughput as memory profiling and thus may not benefit from PROMPT’s queue and other optimizations. The factorization process of memory profiling used in PROMPT, namely the separation and generalization, may inspire other software systems. The separation helps to reduce the complexity, while the generalization helps to reduce the cost of development. Both help with building a more efficient system.
8. Related Work
Memory Profilers
Many memory profilers have been proposed for various use cases (Apostolakis et al., 2020a; Kim et al., 2010; Yu and Li, 2012a; Vanka and Tuck, 2012; Mason et al., 2009; Johnson et al., 2012b; Zhao et al., 2006). They are different in terms of the profiling events they gather and the summarization method. They can collect memory dependence (Mason et al., 2009; Yu and Li, 2012a; Kim et al., 2010; Zhao et al., 2006), value pattern (Gabbay and Mendelson, 1997), object lifetime (Wu et al., 2004), and points-to relation (Johnson et al., 2012b). There are sub-variants for collecting memory dependence – loop-aware, context-aware, tracking distance, or tracking counts(Chen et al., 2004; Kim et al., 2017; Mason et al., 2009; Zhang et al., 2009). The growing number of different profilers also suggests new client profiling needs. PROMPT is an extensible memory profiling framework that can easily implement all these memory profilers.
Many directions have been explored to reduce the overhead of memory profiling. Prior work has shown that shadow memory is particularly effective at improving run-time analysis of programs (Zhao et al., 2010; Nethercote and Seward, 2007a). Parallelism is also used in many memory profilers to optimize for speed (Moseley et al., 2007; Wallace and Hazelwood, 2007; Kim et al., 2010; Yu and Li, 2012b). We leverage their findings and generalize their optimization in PROMPT. Lossy techniques can reduce overhead (Vanka and Tuck, 2012; Chen et al., 2004). Vanka et al. combine sampling with a signature-based approach to achieve overhead (Vanka and Tuck, 2012). However, such techniques suffer from imprecise results and some clients are very sensitive to precision. PROMPT achieves low overhead without resorting to sampling. Augmenting PROMPT with sampling for clients that tolerate imprecision is straightforward.
The LLVM address and memory sanitizer can be considered memory profilers with custom allocators (Serebryany et al., 2012; Stepanov and Serebryany, 2015). They achieve low overhead – the address sanitizer reports less than 2.75x slowdown in the worst case and the memory sanitizer less than 7x. However, their optimizations are very specialized for the given task and do not generalize to other memory profiling tasks considered in this paper. PROMPT provides a framework on which various memory profilers can be built with generalized components and optimizations.
Implementing Memory Profilers
Pin and DynamoRio can instrument programs at the binary level (Wallace and Hazelwood, 2007; Bruening et al., 2012). LLVM and GCC have more freedom to instrument programs at the intermediate representation level (Lattner and Adve, 2004; GCC Team, 2023). Tracing systems, sometimes built on top of instrumentation systems, collect program traces that can be used for online or offline analysis (Zhang and Gupta, 2004; Zhao et al., 2006; Tallam and Gupta, 2007; DynamoRio Team, 2023). These systems help with building memory profilers. However, even with these systems, building a memory profiler is hard. In addition, some tracing and binary instrumentation systems introduce baseline overheads for generating the trace or dynamic binary instrumentation. PROMPT does not strive to replace instrumentation or tracing systems. Instead, it focuses on memory profiling, providing components and optimizations to make building fast memory profilers much easier.
Optimization Techniques
Program specialization to reduce cost has been proposed for many use cases (Reps and Turnidge, 1996; Schultz et al., 2003; Wang et al., 2022). PROMPT uses a specialization technique where unnecessary events are not instrumented depending on the needs of the client. PROMPT does it automatically at link time to remove the need to communicate with the LLVM pass.
The Liberty queue is the most related to the queue design (Jablin et al., 2010; Rangan and August, 2006). It is a lock-free implementation designed for fast core-to-core communication and shifts communication overhead to the more idle end of the queue. The PROMPT high-throughput queue design is influenced by the Liberty queue but leverages the latency-insensitive aspect of memory profiling to get more performance. PROMPT uses a ping-pong buffer to reduce the cost of checking and communication and outperforms the Liberty queue by 81%.
Different techniques have been developed to make use of parallelism in memory profilers (Moseley et al., 2007; Wallace and Hazelwood, 2007; Kim et al., 2010; Yu and Li, 2012b). PROMPT generalizes them as different forms of data parallelism and provides a generic data parallelism wrapper. PROMPT automatically manages parallel workers and the interaction with shadow memory. This makes it much easier to integrate data parallelism with any memory profiler.
The optimization used for the high throughput containers in PROMPT is parallel reduction (Rauchwerger and Padua, 1995). However, PROMPT wraps the parallelism in containers with insertion logic, so users can use them with ease and get parallelism for free.
9. Conclusion
This paper presents a novel factorization of memory profiling, emphasizing the significance of core profiling logic. This emphasis is achieved by separating the front and backend and generalizing shared components and optimizations. Based on this factorization, the paper introduces PROMPT, an open-sourced, fast, and extensible memory profiling framework. Two existing LLVM-based memory profilers have been seamlessly ported to PROMPT, resulting in simpler implementations and improved performance. Furthermore, a tailored memory profiling workflow was redesigned for Perspective, a state-of-the-art speculative parallelization framework. This workflow is encapsulated in a concise 570 lines of code and reduces client profiling time by more than 90%. Such outcomes emphasize PROMPT’s role in enhancing the practicality and broader application of memory profiling techniques. In summary, this research positions PROMPT as a pivotal framework in advancing the application of memory profiling techniques.
References
- (1)
- Abseil Team (2023) Abseil Team. 2023. Abseil/Abseil-CPP: Abseil Common Libraries (C++). https://github.com/abseil/abseil-cpp.
- Apostolakis et al. (2020a) Sotiris Apostolakis, Ziyang Xu, Greg Chan, Simone Campanoni, and David I. August. 2020a. Perspective: A Sensible Approach to Speculative Automatic Parallelization. In Proceedings of the Twenty-Fifth International Conference on Architectural Support for Programming Languages and Operating Systems. Association for Computing Machinery, New York, NY, USA, 351–367.
- Apostolakis et al. (2020b) Sotiris Apostolakis, Ziyang Xu, Zujun Tan, Greg Chan, Simone Campanoni, and David I. August. 2020b. SCAF: A Speculation-Aware Collaborative Dependence Analysis Framework. In Proceedings of the 41st ACM SIGPLAN Conference on Programming Language Design and Implementation (PLDI 2020). Association for Computing Machinery, New York, NY, USA, 638–654. https://doi.org/10.1145/3385412.3386028
- Bridges et al. (2007) Matthew Bridges, Neil Vachharajani, Yun Zhang, Thomas Jablin, and David August. 2007. Revisiting the Sequential Programming Model for Multi-Core. In Proceedings of the 40th Annual IEEE/ACM International Symposium on Microarchitecture (MICRO). 69–84.
- Bruening et al. (2012) Derek Bruening, Qin Zhao, and Saman Amarasinghe. 2012. Transparent dynamic instrumentation. In Proceedings of the 8th ACM SIGPLAN/SIGOPS conference on Virtual Execution Environments. 133–144.
- Bucek et al. (2018) James Bucek, Klaus-Dieter Lange, and Jóakim v. Kistowski. 2018. SPEC CPU2017: Next-generation compute benchmark. In Companion of the 2018 ACM/SPEC International Conference on Performance Engineering. 41–42.
- Chen et al. (2016) Dehao Chen, David Xinliang Li, and Tipp Moseley. 2016. AutoFDO: Automatic Feedback-Directed Optimization for Warehouse-Scale Applications. In Proceedings of the 2016 International Symposium on Code Generation and Optimization (Barcelona, Spain) (CGO ’16). Association for Computing Machinery, New York, NY, USA, 12–23. https://doi.org/10.1145/2854038.2854044
- Chen et al. (2004) Tong Chen, Jin Lin, Xiaoru Dai, Wei-Chung Hsu, and Pen-Chung Yew. 2004. Data Dependence Profiling for Speculative Optimizations. In Compiler Construction, Evelyn Duesterwald (Ed.). Lecture Notes in Computer Science, Vol. 2985. Springer Berlin / Heidelberg, 2733–2733.
- Connors (1997) D. A. Connors. 1997. Memory Profiling for Directing Data Speculative Optimizations and Scheduling. Master’s thesis. Department of Electrical and Computer Engineering, University of Illinois, Urbana, IL.
- Danial (2021) Albert Danial. 2021. cloc: v1.92. https://doi.org/10.5281/zenodo.5760077
- Deiana et al. (2023) Enrico Armenio Deiana, Brian Suchy, Michael Wilkins, Brian Homerding, Tommy McMichen, Katarzyna Dunajewski, Peter Dinda, Nikos Hardavellas, and Simone Campanoni. 2023. Program State Element Characterization. In International Symposium on Code Generation and Optimization (CGO ’23).
- DynamoRio Team (2023) DynamoRio Team. 2023. drcachesim. https://dynamorio.org/page_drcachesim.html.
- g++ (2023) g++ 2023. Profile Guided Optimization in g++. g++ -profile-generate -profile-use.
- Gabbay and Mendelson (1997) F. Gabbay and A. Mendelson. 1997. Can program profiling support value prediction?. In Proceedings of 30th Annual International Symposium on Microarchitecture. 270–280. https://doi.org/10.1109/MICRO.1997.645817
- GCC Team (2023) GCC Team. 2023. GCC, the GNU compiler collection. https://gcc.gnu.org/.
- GNU C Library Team (2023) GNU C Library Team. 2023. Memory Allocation Hooks. https://www.gnu.org/software/libc/manual/html_node/Hooks-for-Malloc.html.
- greg7mdp (2023) greg7mdp. 2023. GREG7MDP/parallel-hashmap: A family of header-only, very fast and memory-friendly hashmap and BTREE containers. https://github.com/greg7mdp/parallel-hashmap.
- intelc++ (2023) intelc++ 2023. Profile Guided Optimization in the Intel C++ Compiler. http://software.intel.com/sites/products/documentation/hpc/compilerpro/en-us/cpp/lin/compiler_c.
- Jablin et al. (2010) Thomas B Jablin, Yun Zhang, James A Jablin, Jialu Huang, Hanjun Kim, and David I August. 2010. Liberty queues for epic architectures. In Proceedings of the Eigth Workshop on Explicitly Parallel Instruction Computer Architectures and Compiler Technology (EPIC).
- Johnson et al. (2012a) Nick P. Johnson, Hanjun Kim, Prakash Prabhu, Ayal Zaks, and David I. August. 2012a. Speculative Separation for Privatization and Reductions. Programming Language Design and Implementation (PLDI) (June 2012).
- Johnson et al. (2012b) Nick P. Johnson, Hanjun Kim, Prakash Prabhu, Ayal Zaks, and David I. August. 2012b. Speculative Separation for Privatization and Reductions. In Proceedings of the 33rd ACM SIGPLAN Conference on Programming Language Design and Implementation (PLDI ’12). Association for Computing Machinery, New York, NY, USA, 359–370. https://doi.org/10.1145/2254064.2254107
- Ketterlin and Clauss (2012) Alain Ketterlin and Philippe Clauss. 2012. Profiling data-dependence to assist parallelization: Framework, scope, and optimization. In 2012 45th Annual IEEE/ACM International Symposium on Microarchitecture. IEEE, 437–448.
- Kim et al. (2017) Changsu Kim, Juhyun Kim, Juwon Kang, Jae W Lee, and Hanjun Kim. 2017. Context-Aware Memory Profiling for Speculative Parallelism. In 2017 IEEE 24th International Conference on High Performance Computing (HiPC). IEEE, 328–337.
- Kim et al. (2010) Minjang Kim, Hyesoon Kim, and Chi-Keung Luk. 2010. SD3: A scalable approach to dynamic data-dependence profiling. In Proceedings of the 2010 43rd Annual IEEE/ACM International Symposium on Microarchitecture (MICRO ’10). IEEE Computer Society, Washington, DC, USA, 535–546.
- Krishnaiyer et al. (2013) Rakesh Krishnaiyer, Emre Kultursay, Pankaj Chawla, Serguei Preis, Anatoly Zvezdin, and Hideki Saito. 2013. Compiler-Based Data Prefetching and Streaming Non-temporal Store Generation for the Intel(R) Xeon Phi(TM) Coprocessor. In 2013 IEEE International Symposium on Parallel & Distributed Processing, Workshops and Phd Forum. 1575–1586. https://doi.org/10.1109/IPDPSW.2013.231
- Larus (1993) J. R. Larus. 1993. Loop-Level Parallelism in Numeric and Symbolic Programs. IEEE Trans. Parallel Distrib. Syst. 4, 7 (jul 1993), 812–826. https://doi.org/10.1109/71.238302
- Lattner and Adve (2004) Chris Lattner and Vikram Adve. 2004. LLVM: A Compilation Framework for Lifelong Program Analysis & Transformation. In Proceedings of the Annual International Symposium on Code Generation and Optimization (CGO). 75–86.
- Liberty Research Group (2022) Liberty Research Group. 2022. Collaborative Parallelization Framework Compiler. https://github.com/PrincetonUniversity/cpf.
- Liu et al. (2006) Wei Liu, James Tuck, Luis Ceze, Wonsun Ahn, Karin Strauss, Jose Renau, and Josep Torrellas. 2006. POSH: a TLS compiler that exploits program structure. In PPoPP ’06: Proceedings of the 11th ACM SIGPLAN Symposium on Principles and Practice of Parallel Programming. 158–167.
- Luk et al. (2005) Chi-Keung Luk, Robert Cohn, Robert Muth, Harish Patil, Artur Klauser, Geoff Lowney, Steven Wallace, Vijay Janapa Reddi, and Kim Hazelwood. 2005. Pin: Building Customized Program Analysis Tools with Dynamic Instrumentation. SIGPLAN Not. 40, 6 (jun 2005), 190–200. https://doi.org/10.1145/1064978.1065034
- Mason et al. (2009) Thomas Mason, A David, and I August. 2009. Lampview: A loop-aware toolset for facilitating parallelization. Master’s thesis, Dept. of Electrical Engineeringi, Princeton University (2009).
- Morew et al. (2020) Nicolas Morew, Mohammad Norouzi, Ali Jannesari, and Felix Wolf. 2020. Skipping non-essential instructions makes data-dependence profiling faster. In European Conference on Parallel Processing. Springer, 3–17.
- Moseley et al. (2007) Tipp Moseley, Alex Shye, Vijay Janapa Reddi, Dirk Grunwald, and Ramesh Peri. 2007. Shadow Profiling: Hiding instrumentation costs with parallelism. In Proceedings of the International Symposium on Code Generation and Optimization (CGO ’07). IEEE Computer Society, Washington, DC, USA, 198–208.
- mTrace Team (2013) mTrace Team. 2013?. MTRACE. http://lacasa.uah.edu/index.php/software-data/mtrace-tools-and-traces.
- Nethercote and Seward (2007a) Nicholas Nethercote and Julian Seward. 2007a. How to shadow every byte of memory used by a program. In VEE. 65–74.
- Nethercote and Seward (2007b) Nicholas Nethercote and Julian Seward. 2007b. Valgrind: a framework for heavyweight dynamic binary instrumentation. ACM Sigplan notices 42, 6 (2007), 89–100.
- Panchenko et al. (2019) Maksim Panchenko, Rafael Auler, Bill Nell, and Guilherme Ottoni. 2019. Bolt: a practical binary optimizer for data centers and beyond. In 2019 IEEE/ACM International Symposium on Code Generation and Optimization (CGO). IEEE, 2–14.
- Peng Wu and Cascaval (2008) Arun Kejariwal Peng Wu and Calin Cascaval. 2008. Compiler-Driven Dependence Profiling to Guide Program Parallelization. In LCPC. 232–248.
- pogo (2022) pogo 2022. Profile Guided Optimization in the Microsoft Visual C/C++ Compiler. https://docs.microsoft.com/en-us/cpp/build/profile-guided-optimizations.
- PROMPT Team (2023) PROMPT Team. 2023. PROMPT memory profiling system. https://github.com/PrincetonUniversity/PROMPT.
- Rangan and August (2006) Ram Rangan and David I August. 2006. Amortizing software queue overhead for pipelined interthread communication. In Proceedings of the Workshop on Programming Models for Ubiquitous Parallelism (PMUP). Citeseer, 1–5.
- Rauchwerger and Padua (1995) Lawrence Rauchwerger and David Padua. 1995. The LRPD test: speculative run-time parallelization of loops with privatization and reduction parallelization. ACM SIGPLAN Notices 30, 6 (1995), 218–232.
- Reps and Turnidge (1996) Thomas Reps and Todd Turnidge. 1996. Program specialization via program slicing. In Partial Evaluation. Springer, 409–429.
- Sato et al. (2012) Yukinori Sato, Yasushi Inoguchi, and Tadao Nakamura. 2012. Whole program data dependence profiling to unveil parallel regions in the dynamic execution. In 2012 IEEE International Symposium on Workload Characterization (IISWC). IEEE, 69–80.
- Schultz et al. (2003) Ulrik P Schultz, Julia L Lawall, and Charles Consel. 2003. Automatic program specialization for Java. ACM Transactions on Programming Languages and Systems (TOPLAS) 25, 4 (2003), 452–499.
- Serebryany et al. (2012) Konstantin Serebryany, Derek Bruening, Alexander Potapenko, and Dmitry Vyukov. 2012. AddressSanitizer: A Fast Address Sanity Checker. In USENIX ATC 2012. https://www.usenix.org/conference/usenixfederatedconferencesweek/addresssanitizer-fast-address-sanity-checker
- Steffan et al. (2000) J. G. Steffan, C. B. Colohan, A. Zhai, and T. C. Mowry. 2000. A Scalable Approach to Thread-Level Speculation. In Proceedings of the 27th International Symposium on Computer Architecture. 1–12.
- Stepanov and Serebryany (2015) Evgeniy Stepanov and Konstantin Serebryany. 2015. MemorySanitizer: Fast detector of uninitialized memory use in C++. In 2015 IEEE/ACM International Symposium on Code Generation and Optimization (CGO). 46–55. https://doi.org/10.1109/CGO.2015.7054186
- Swaminathan et al. (2012) K. Swaminathan, G. Lakshminarayanan, and Seok-Bum Ko. 2012. High Speed Generic Network Interface for Network on Chip Using Ping Pong Buffers. In 2012 International Symposium on Electronic System Design (ISED). 72–76. https://doi.org/10.1109/ISED.2012.11
- Szuppe (2016) Jakub Szuppe. 2016. Boost.Compute: A Parallel Computing Library for C++ Based on OpenCL. In Proceedings of the 4th International Workshop on OpenCL (IWOCL ’16). Association for Computing Machinery, Article 15, 39 pages. https://doi.org/10.1145/2909437.2909454
- Tallam and Gupta (2007) Sriraman Tallam and Rajiv Gupta. 2007. Unified Control Flow and Data Dependence Traces. ACM Transactions on Architecture and Code Optimization 4, 3 (Sept. 2007), 19. https://doi.org/10.1145/1275937.1275943
- Thies et al. (2007) William Thies, Vikram Chandrasekhar, and Saman Amarasinghe. 2007. A Practical Approach to Exploiting Coarse-Grained Pipeline Parallelism in C Programs. In Proceedings of the 40th Annual IEEE/ACM International Symposium on Microarchitecture (MICRO). 356–369.
- Vanka and Tuck (2012) Rajeshwar Vanka and James Tuck. 2012. Efficient and accurate data dependence profiling using software signatures. In Proceedings of the Tenth International Symposium on Code Generation and Optimization (CGO ’12). ACM, New York, NY, USA, 186–195.
- Wallace and Hazelwood (2007) Steven Wallace and Kim Hazelwood. 2007. SuperPin: Parallelizing Dynamic Instrumentation for Real-Time Performance. In Proceedings of the International Symposium on Code Generation and Optimization (CGO ’07). IEEE Computer Society, Washington, DC, USA, 209–220.
- Wang et al. (2022) Mingzhe Wang, Jie Liang, Chijin Zhou, Zhiyong Wu, Xinyi Xu, and Yu Jiang. 2022. Odin: on-demand instrumentation with on-the-fly recompilation. In Proceedings of the 43rd ACM SIGPLAN International Conference on Programming Language Design and Implementation. 1010–1024.
- Wu et al. (2004) Q. Wu, A. Pyatakov, A. Spiridonov, Easwaran Raman, D.W. Clark, and D.I. August. 2004. Exposing memory access regularities using object-relative memory profiling. In International Symposium on Code Generation and Optimization, 2004. CGO 2004. 315–323. https://doi.org/10.1109/CGO.2004.1281684
- Yu and Li (2012a) Hongtao Yu and Zhiyuan Li. 2012a. Fast loop-level data dependence profiling. In Proceedings of the 26th ACM international conference on Supercomputing (ICS ’12). ACM, New York, NY, USA, 37–46.
- Yu and Li (2012b) Hongtao Yu and Zhiyuan Li. 2012b. Multi-slicing: a compiler-supported parallel approach to data dependence profiling. In Proceedings of the 2012 International Symposium on Software Testing and Analysis (ISSTA 2012). ACM, New York, NY, USA, 23–33.
- Zhang and Gupta (2004) Xiangyu Zhang and Rajiv Gupta. 2004. Whole Execution Traces. In Proceedings of the 37th Annual IEEE/ACM International Symposium on Microarchitecture (Portland, Oregon) (MICRO 37). IEEE Computer Society, USA, 105–116. https://doi.org/10.1109/MICRO.2004.37
- Zhang et al. (2009) Xiangyu Zhang, Armand Navab, and Suresh Jagannathan. 2009. Alchemist: A transparent dependence distance profiling infrastructure. In In CGO ’09: Proceedings of the 2009 International Symposium on Code Generation and Optimization. IEEE Computer Society, 47–58.
- Zhao et al. (2010) Qin Zhao, Derek Bruening, and Saman Amarasinghe. 2010. Efficient memory shadowing for 64-bit architectures. In Proceedings of the 2010 international symposium on Memory management (ISMM ’10). ACM, New York, NY, USA, 93–102.
- Zhao et al. (2006) Qin Zhao, Joon Edward Sim, Weng-Fai Wong, and Larry Rudolph. 2006. DEP: detailed execution profile. In Proceedings of the 15th international conference on Parallel architectures and compilation techniques. 154–163.