Trajectory Extending Kinetic Monte Carlo Simulations to Evaluate Pure and Gas Mixture Diffusivities through a Dense Polymeric Membrane 111Preprint — The Journal of Physical Chemistry B — Accepted on October 25, 2023
Abstract
With renewed interest in \ceCO2 separations, carbon molecular sieving (CMS) membrane performance evaluation requires diffusion coefficients as inputs to have reliable estimate of the permeability. An optimal material is desired to have both high selectivity and permeability. Gases diffusing through dense, CMS and polymeric membranes experience extended sub-diffusive regimes which hinders reliable extraction of diffusion coefficients from mean squared displacement data. We improve the sampling of the diffusive landscape by implementing the trajectory extending kinetic Monte Carlo (TEKMC) technique to efficiently extend MD trajectories from ns to s timescales. The obtained self-diffusion coefficient of pure \ceCO2 in CMS membranes derived from 6FDA/BPDA-DAM precursor polymer melt is found to linearly increase from in the pressure range of which supports previous experimental findings. We also extend the TEKMC algorithm to evaluate the mixture diffusivities in binary mixtures to determine the permselectivity of \ceCO2 in \ceCH4 and \ceN2 mixtures. The mixture diffusion coefficient of \ceCO2 ranges from in binary mixture \ceCO2:\ceCH4 which is significantly higher than the pure gas diffusion coefficient. Robeson plot comparisons show that the permselectivity obtained from pure gas diffusion data are significantly lower than that predicted using mixture diffusivity data. Specifically in the case of the \ceCO2:\ceN2 mixture we find that using mixture diffusivities led to permeslectivites lying above the Robeson limit highlighting the importance of using mixture diffusivity data for an accurate evaluation of the membrane performance. Combined with gas solubilities obtained from grand-canonical Monte Carlo simulations, our work shows that simulations with the TEKMC method can be used to reliably evaluate the performance of materials for gas separations.
keywords:
Multi-component diffusion, Permeability, Kinetic Monte Carlo, Molecular Dynamics, Carbon Capture and StorageMD, kMC, TEKMC, GCMC, CMS
1 Introduction
Separating \ceCO2 from natural gas streams primarily involves the separation of \ceCO2 from gas mixtures. Separation technologies largely comprise solvent-based extraction techniques, cryogenic distillation, and membrane-based separations 1. Solvent based extraction techniques, like amine filtration, exhibit long term environmental concerns regarding energy consumption, operating challenges, and emission of hazardous by-products 2. Currently, industrial applications are dominated by cryogenic distillation. However, it has serious drawbacks pertaining to high energy requirements and high operating costs 3. Membrane-based gas separation offers significant advantages, due to increased stability, scalability, with potential to improve performance based on synthesis of novel materials, while being relatively hazard-free 4. Carbon based membranes have shown a lot of promise for effectively separating \ceCO2 from natural gas streams. Carbon molecular sieving (CMS) membranes are carbon-based high-performance gas separation membranes, derived from the pyrolysis of polymeric precursors in vacuum or inert atmosphere. CMS membranes present a bimodal pore-size distribution and a rich network of interconnected micropores and ultra-micropores that can differentiate between pairs of gas molecule having similar kinetic diameters 5, 6, 7, 8. Similar pore network topologies are observed in a variety of other polymeric membranes, enabling one to modify membranes by varying the chemistry and processing conditions 9. Membrane based technologies also have the advantage of excellent gas selectivity with high gas permeability, chemical and thermal stability 10, 11. CMS membranes show great promise in carbon capture and storage applications, with their monomer composition and choice of precursor playing an important role in determining their gas adsorption and selectivity performances.
Molecular simulations are widely used to study gas adsorption and separation processes. Grand-canonical Monte-Carlo (GCMC) simulations have been used to obtain adsorption isotherms for a variety of molecules and microporous materials such as metal organic frameworks (MOFs), zeolites and carbon based materials. These simulations are carried out under equilibrium conditions. In contrast the transport mechanism of gases inside membranes occur in non-equilibrium conditions across an applied pressure gradient between the upstream feed gas to be separated and the downstream gas. In this regard, polymeric membranes have been widely studied for effective \ceCO2 separations. Gas transport through dense polymer membranes are generally modelled by the sorption-diffusion mechanism 12, 13, 14. Gas molecules first adsorb in the membrane at the upstream conditions, diffuse under the influence of a chemical potential gradient, and finally desorb from the membrane at the downstream compartment. The diffusive flux of the gas molecule through the membrane is measured using its permeability,
| (1) |
where and are the solubility and diffusion coefficients of the gas molecule respectively in the membrane 15. High permeability values can be achieved by increasing either or or both and . If the upstream pressure is much larger than the downstream pressure then the solubility can be obtained from an equilibrium GCMC simulation evaluated at the thermodynamic conditions at the upstream pressure. Molecular dynamics (MD) simulations have been widely used to evaluate the diffusion coefficient, in a variety of microporous materials 16, 17, 18, 19, 20. Due to the complex porous networks present in glassy polymeric membranes and their derivatives, there is a drastic slowing down of the dynamics of the diffusing species. As a result carrying out all-atom MD simulations to adequately sample the diffusive regime and reliably evaluate is a computational challenge. Alternate approaches have been devised to overcome this limitation with the primary goal of evaluating the self-diffusion coefficients of slowly diffusing gas species. Thornton et al. presented an approximate dependence of gas diffusivity on fractional free volume of the porous media and the kinetic diameter of the gas, derived empirically from available experimental data 21. Bousige et. al. analyzed the residence and relocation times of fluid in ultraconfining disordered porous materials by mapping MD simulations to mesoscopic random walks 22. Neyertz et al. proposed a variant of kinetic Monte Carlo (kMC), referred to as trajectory extending kinetic Monte Carlo (TEKMC) 23. The algorithm has been successfully used to calculate the diffusion coefficients of small molecules such as H2O, O2, \ceN2 in glassy polymers 23, 24.
While assessing a given material for a particular gas separation technology both solubility and diffusion coefficients in a gas mixture need to be evaluated. The gas solubility can be obtained from mixture GCMC simulations, however evaluating diffusion coefficients of mixtures is more challenging 25, 26. There are several reports of computing gas permeabilities in polymers, metal organic frameworks, zeolites using both pure and mixture gas data while comparing with the Robeson upper limit 27, 28 where higher selectivity is correlated with lowered permeability. These plots are used as a standard to assess the performance of newly fabricated adsorbents where the goal is to design a material with both high selectivity and permeability. There are also ongoing efforts to redefine and increase the upper limits for different materials 29, 30, 31. With a wide range of data available, machine learning based techniques have also been leveraged to understand and find materials that can surpass the Robeson upper bounds 32. Recent attempts to address mixture diffusivities from MD simulations showed that gas molecules tend to oscillate between adsorption sites 33 making it difficult to evaluate the long-time gas diffusivity. Since the evaluation of diffusion coefficients in mixtures is challenging several studies evaluate the permeabilities using pure component diffusion coefficients. Semi-empirical approaches which have been developed with varying degrees of success to obtain mixture diffusion coefficients from pure diffusivity data 34. Lattice-based techniques have been used to compute diffusion of gases inside such variable pore structures 35, 36, however they require various parameters which are difficult to determine. In this work, to overcome these limitations, we extend the TEKMC technique to reliably obtain mixture diffusivities of gases inside the 6F-CMSM membrane. Robeson plot comparisons are made with permeability data obtained from both pure and mixture diffusivities to highlight the limitations of using pure component diffusivity data while designing membranes for gas separation applications.
In our previous study 37, we modelled CMS membranes derived from 6FDA/BPDA-DAM precursor polymer melt 38, 39 (denoted as 6F-CMSM). The molecular structures were built in close correspondence with experimental compositions using density functional theory (DFT) for optimizing the two monomeric units (pyridine and pyrrole) followed by their polymerization using all-atom MD simulations. GCMC simulations were used to obtain gas adsorption isotherms inside the membrane for a range of pressures. Our simulated 6F-CMSM morphologies helped understand the importance of the length of carbon chains in determining density of the membrane and their accessible pore volumes, which in turn affect their adsorption performances. More details about the CMS membrane simulations can be found in our previous publication 37. In continuation of our previous study, here we analyze the dynamics of the adsorbed gases through the porous networks of the 6F-CMSM. The solubility coefficients needed in this work are obtained from the previous gas adsorption isotherms under different pressures. Predicting accurate values of requires estimating both and for each gas component. The novelty of our work lies in using TEKMC to obtain self-diffusion coefficients of \ceCO2, \ceCH4 and \ceN2 in pure gases and the multicomponent diffusivities in binary mixtures, as a function of pressure. We obtain the permeability for pure gases and binary \ceCO2:\ceCH4 and \ceCO2:\ceN2 mixtures to evaluate the membrane performance. The manuscript is organized as follows. We first discuss in detail the methodology used to perform the TEKMC steps. Next we study the variation of gas diffusivities and ultimately their permeation through the 6F-CMSM. We study the relative permeabilities of these gases in both the pure state and binary mixtures in the 6F-CMSM polymeric membrane to understand its dependence on system pressure and gas compositions. We finally present the Robeson plots for the different systems to illustrate the importance of using accurate mixture diffusion coefficients while assessing a materials capacity for separating a given gas mixture.
2 Method
2.1 Computational modeling and simulation
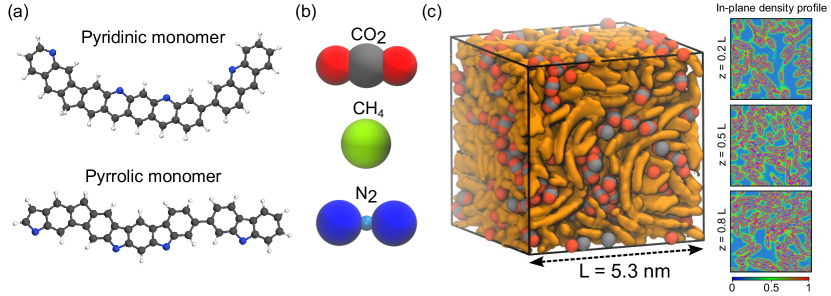
The 6F-CMSM membrane used in this work is composed from pyridinic and pyrrolic monomer units shown in Fig. 1a. These monomers polymerize to form various morphologies, among which we select the structure with closest resemblance to experimental gas adsorption isotherms as discussed in our earlier work 37. The structure of \ceCO2, \ceCH4 and \ceN2 molecules used are shown in Fig. 1b. The interactions involving the gas molecules are modeled using the TraPPE force fields 40 and the 6F-CMSM atoms are modelled using modified Dreiding 38, 41. The force field values used in this work are reported in Table A1 of the Appendix. The distribution of gas molecules inside the 6F-CMSM are obtained from GCMC simulations as discussed in our earlier work. To account for the structural rearrangement of monomer constituents upon interaction with gas molecules, the 6F-CMSM is modelled as a flexible membrane. We first perform all-atom MD simulations of 6F-CMSMs along with the adsorbed gases for duration in an NVT ensemble using LAMMPS 42. The temperature of the system is maintained at using a Nosé-Hoover thermostat. The coordinates of the gas molecules from the MD simulation are stored at an interval of . Fig. 1c shows a snapshot from our all-atom MD simulation of 6F-CMSM loaded with \ceCO2 corresponding to pressure. The porous nature of the membrane for different cross-sections along the bulk of the membrane is also visible from the simulation snapshot.
2.2 Implementing kinetic Monte Carlo
The simulation box is uniformly divided into voxels of grid size along and directions. Each voxel is identified by a single index, spanning from to , for a cubic simulation box having length on each side. All gas molecules are mapped from their real-space coordinates to their respective voxel indices. The trajectories of the gas molecules from the MD simulations are used to compute the transition probability matrix required as input for the TEKMC simulation. We define the probability of transition between voxels and , given that the gas is in voxel as,
| (2) |
where is the number of transitions between voxels and and is the number of times the gas molecule visits voxel . Since the transition probability matrix is constructed from the all-atom MD trajectories, implicitly takes into account all the gas-gas and gas-membrane interactions. The probability matrix is symmetrized to maintain detailed balance, such that , which is equivalent to
| (3) |
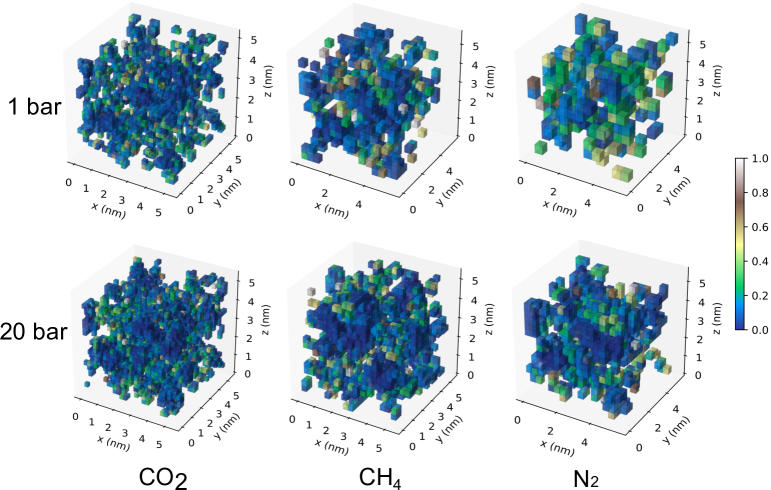
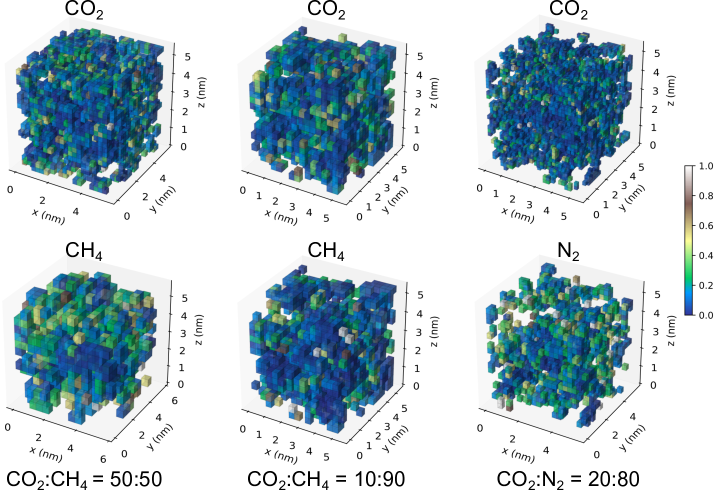
where and are the recorded number of transitions from voxel to and to respectively. Voxels with indicate regions inside the simulation box where the atoms of the CMS molecules are located. The values of for \ceCO2, \ceCH4 and \ceN2 for and pressures are shown in Fig. A1 of the appendix. In case of binary gas mixtures, of each component is obtained from the trajectory of that component. The interaction between two components changes the probability distribution from the pure gas system, shown in Fig. A2 of the appendix for pressure. From conservation of number of particles, we have the condition . For each kMC move, a walker is placed randomly in one of the visited voxels such that . The voxel that the walker visits form is determined from the sum, . The destination voxel is identified to be when is just satisfied, where is a random number drawn from a uniform distribution. A total of 5000 random walkers are inserted for each simulation and the time associated with each kMC step is . The trajectories of these random walkers are mapped back from the voxel index to the real space coordinates and their average mean squared displacement (MSD) is determined.
| P (bar) | 0.1 | 0.6 | 1 | 6 | 10 | 15 | 20 |
|---|---|---|---|---|---|---|---|
| \ceCO2 | 0.41 | 0.32 | 0.22 | 0.19 | 0.20 | 0.20 | 0.20 |
| \ceCH4 | 0.61 | 0.42 | 0.34 | 0.30 | 0.32 | 0.24 | 0.25 |
| \ceN2 | 0.60 | 0.55 | 0.47 | 0.45 | 0.44 | 0.35 | 0.33 |
2.3 Optimization to obtain diffusion and permeability
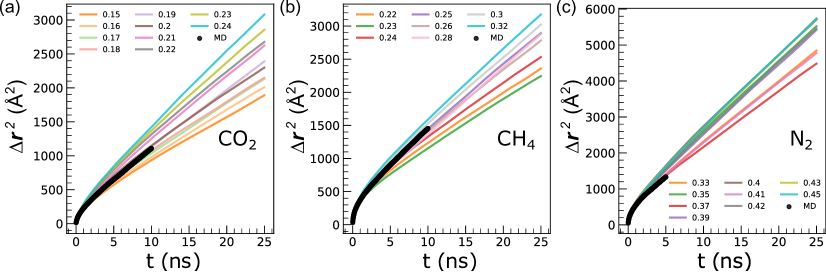
The optimal values of and combinations first needs to be determined for obtaining the correct MSD from the TEKMC simulation. Different techniques can been used to obtain the time interval between two successive kMC steps, 43. We follow the procedure prescribed by Neyertz et al. where . Fig. 2 illustrates the values of MSD obtained from all-atom MD and TEKMC simulations for \ceCO2, \ceCH4 and \ceN2 at pressure. For a diffusing particle the MSD, . The value of the exponent from the MSD data obtained from MD simulations lies in the range of indicating the sub-diffusive nature of the diffusing molecule in the polymeric membrane. In the diffusive regime where the value of , the diffusivity is obtained from the Einstein relation,
| (4) |
where represent averages over all particles, and shifted time origins (). The TEKMC simulations enable us to access the Brownian regime for restricted diffusing molecules which predominantly sample the sub-diffusive regime during the small timescale of MD simulations. In order to determine the optimal value of we used the lowest mean squared error (MSE) between MSDs obtained from the MD simulation and that obtained from TEKMC simulations. The optimum values of for the different cases considered are shown in Table 1. To determine the diffusion coefficients we carry out additional TEKMC simulations for three different values, which include the optimal (Table 1) as well as simulations at . For these three different values of , random walks are performed up to to ensure all gases attain the Brownian diffusion regime and the reported values of are an average over these TEKMC simulations. The in-house TEKMC code developed in this study was validated by reproducing the diffusivity of bulk water and is discussed in section A0.2 of the appendix. From TEKMC, we obtain diffusion coefficient of SPC/E water to be at , in agreement to literature 44 45. The algorithm is generic and can be used for other systems where such kMC algorithms are applicable. The solubility coefficient of the gas species , in a membrane is the ratio between its volumetric loading and its partial pressure at a constant temperature 46,
| (5) |
The adsorption isotherm is expressed in terms of the volumetric loading,
| (6) |
where is the number of gas molecules adsorbed in the 6F-CMSM membrane at temperature and pressure , is the volume of the 6F-CMSM membrane, is the Boltzmann constant, and correspond to standard temperature and pressure respectively. The equilibrated values of were obtained using the Peng-Robinson equation of state 47 implemented in RASPA 48, detailed in our previous work 37. The solubility coefficients can be estimated accurately using the above equations, ultimately allowing us to compute their corresponding permeabilities.
3 Results and discussion
3.1 Gas dynamics inside 6F-CMSM
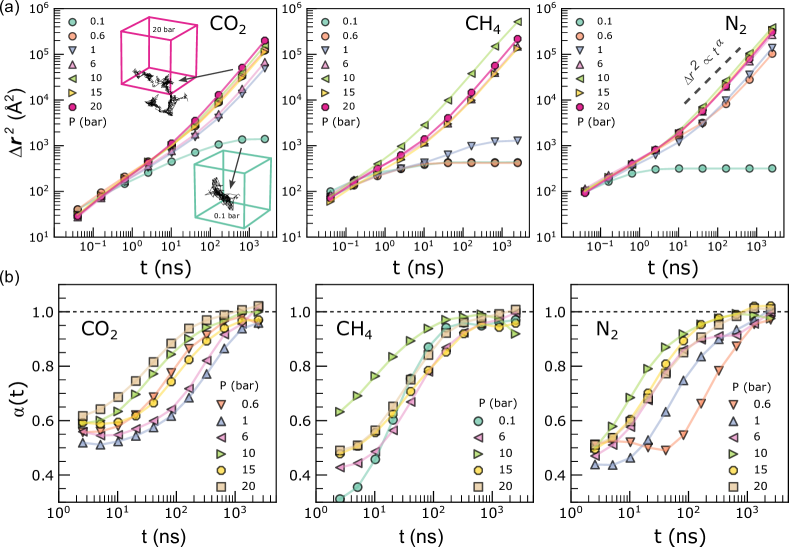
Fig. 3a shows the averaged MSD of \ceCO2, \ceCH4 and \ceN2 for the entire range of system pressures obtained from TEKMC simulations and the corresponding values of the exponent are illustrated in Fig. 3b. The time taken to attain the Brownian regime for the three gases is significantly higher at low pressures compared to the time taken at higher pressure. We observe a slow growth of the exponent towards and the Brownian regime is observed above a sampling time of . The inset in Fig. 3a illustrates two representative trajectories for \ceCO2 molecules corresponding to and pressures. At low pressures gas molecules remain trapped in higher energy adsorption sites restricting displacements to a small region of the CMS membrane and results in a sub-diffusive nature of the MSD even after . At higher pressures, a distinct crossover from sub-diffusive to diffusive regimes is observed. We note that at higher pressure, increased gas uptake results in swelling of 6F-CMSM giving rise to flexible permeation pathways 37.
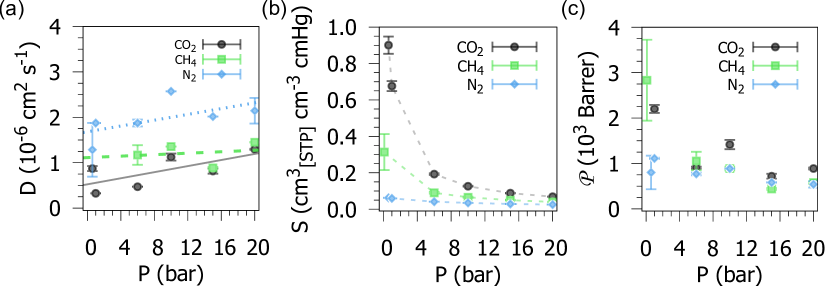
The diffusion coefficients obtained from the Brownian regimes, , for different pressures are shown in Fig. 4a. In literature, the experimentally reported value of for \ceCO2 inside 6F-CMSM derived from 6FDA/BPDA-DAM pyrolysed at is 49. Our calculated value of is in excellent agreement with the experimental value. From the values obtained in Fig. 3, the estimated timescale for obtaining diffusive regime at presure is around for \ceCO2. For cross-validation against all-atom MD results, we performed an additional all-atom MD simulation for . The diffusion coefficient from the all-atom MD . Both the experimental and all-atom MD values are close to the converged value obtained using TEKMC. This remarkable agreement further allows us to conclude that the algorithm can successfully extrapolate short MD results to longer duration and can be successfully used for computing diffusion of confined gas molecules. We also observe that a sufficient number of percolating pathways are required during the atomistic MD simulation in order to adequately access all possible pores available for the gas molecules to diffuse through. From the dependence of on , in Fig. 4a we observe a linear increase in the diffusivities of all three gases inside the 6F-CMSM as a function of pressure. The loading-dependent diffusion coefficients have been observed for hydrocarbons in metal organic frameworks 17 which lead to structural changes of the adsorbing framework 50. There is a monotonic increase of in the pressure range studied for all gases, which is non-trivial and to the best of our knowledge not reported earlier for CMS membranes. We observe that \ceN2 diffuses faster than \ceCO2 inside 6F-CMSM which is similar to the diffusive nature inside zeolites reported in literature 18.
3.2 Solubility and permeability of pure gases
The solubilities, of \ceCO2, \ceCH4, and \ceN2 versus pressure for 6F-CMSM corresponding to temperature using the values of from our previous study of gas uptake in 6F-CMSM 37 and calculated using Eq. 5 are shown in Fig. 4b. The values of for \ceCO2 are the highest followed by \ceCH4. \ceN2 solubilities are the lowest and independent of pressure. We observe a monotonic decrease in the solubility coefficient with increase in pressure for all gases inside the 6F-CMSM. Permeability is then obtained using Eq. 1 in units of Barrer and shown in Fig. 4c. In general, the permeability values for \ceCO2 are the highest when compared with \ceCH4 and \ceN2. We also observe that the permeability decreases with pressure with the most noticeable variation seen in \ceCO2 and \ceCH4, the effect is less pronounced for \ceN2. The linear growth of with , signifies that any variation in is strongly dominated by .
3.3 Permselectivity in binary gas mixtures
In order to understand the relative permeability of different gases inside 6F-CMSM, we also compute the permselectivity of \ceCO2 in binary gas mixtures of \ceCO2:\ceCH4 and and \ceCO2:\ceN2 . The permselectivity in gas mixture is given by,
| (7) |
where denotes \ceCO2 and denotes \ceCH4 or \ceN2 depending on the composition of gas mixture. The diffusion coefficient of gas molecules are influenced by their interactions with the membrane as well as with neighboring gas molecules. Consequently, the diffusion coefficient of each component in a mixture deviates from the corresponding pure gas diffusion coefficients. The deviation is non-trivial and there is an on-going effort to understand multicomponent gas diffusion in different adsorbing frameworks 16, 18, 19, 51, 52. To address this challenge, we extended the TEKMC simulations to gas mixtures of different compositions. The probability matrix for the binary gas mixture is created by tracking the positions of individual gas species during the MD runs as was done for the pure single component system described earlier. We performed separate TEKMC simulations for each species in the binary gas mixture system, to obtain the corresponding mixture diffusion coefficients for each component in the mixture. The TEKMC optimization was also carried out independently for each mixture at different pressures, to obtain the diffusivities.
| P (bar) | cm2s | cmcm-3cmHg | Barrer | |||
|---|---|---|---|---|---|---|
| \ceCO2 : \ceCH4 | ||||||
| \ceCO2 | \ceCH4 | \ceCO2 | \ceCH4 | \ceCO2 | \ceCH4 | |
| 4 | 1.34 0.12 | 0.78 0.26 | 39.96 3.00 | 4.85 0.76 | 5.34 0.61 | 0.38 0.14 |
| 6 | 1.65 0.20 | 0.50 0.13 | 29.78 2.22 | 3.59 0.56 | 4.91 0.69 | 0.18 0.06 |
| 10 | 3.35 0.14 | 4.75 0.83 | 20.09 1.49 | 2.35 0.38 | 6.72 0.58 | 1.12 0.27 |
| 15 | 3.42 0.44 | 4.24 0.78 | 14.36 1.03 | 1.68 0.26 | 4.91 0.72 | 0.71 0.11 |
| 20 | 7.02 0.67 | 13.55 0.78 | 11.22 0.78 | 1.27 0.20 | 7.88 0.93 | 1.73 0.28 |
| \ceCO2 : \ceCH4 | ||||||
| \ceCO2 | \ceCH4 | \ceCO2 | \ceCH4 | \ceCO2 | \ceCH4 | |
| 4 | 2.07 0.07 | 0.73 0.26 | 78.28 28.29 | 8.55 0.80 | 16.16 5.87 | 0.62 0.23 |
| 6 | 5.87 0.35 | 7.25 0.52 | 61.31 19.76 | 6.61 0.56 | 35.99 11.80 | 4.80 0.53 |
| 10 | 5.4 0.43 | 9.92 0.53 | 43.21 10.66 | 4.62 0.3 | 23.31 6.04 | 4.59 0.39 |
| 15 | 2.12 0.20 | 1.47 0.13 | 32.34 7.76 | 3.41 0.22 | 6.87 1.77 | 0.50 0.06 |
| 20 | 7.41 0.36 | 12.90 0.82 | 26.01 5.64 | 2.70 0.16 | 19.27 4.28 | 3.48 0.30 |
| \ceCO2 : \ceN2 | ||||||
| \ceCO2 | \ceN2 | \ceCO2 | \ceN2 | \ceCO2 | \ceN2 | |
| 4 | 1.50 0.12 | 3.00 0.45 | 71.91 7.66 | 2.03 0.49 | 10.77 1.44 | 0.61 0.17 |
| 6 | 2.14 0.19 | 2.80 0.16 | 56.13 5.41 | 1.58 0.35 | 11.98 1.56 | 0.44 0.10 |
| 10 | 2.44 0.16 | 2.11 0.19 | 39.59 3.53 | 1.14 0.23 | 9.65 1.07 | 0.24 0.05 |
| 15 | 1.44 0.08 | 2.27 0.22 | 29.57 2.47 | 0.86 0.02 | 4.26 0.43 | 0.20 0.04 |
| 20 | 2.35 0.16 | 3.18 0.22 | 23.81 2.00 | 0.67 0.01 | 5.59 0.60 | 0.21 0.04 |
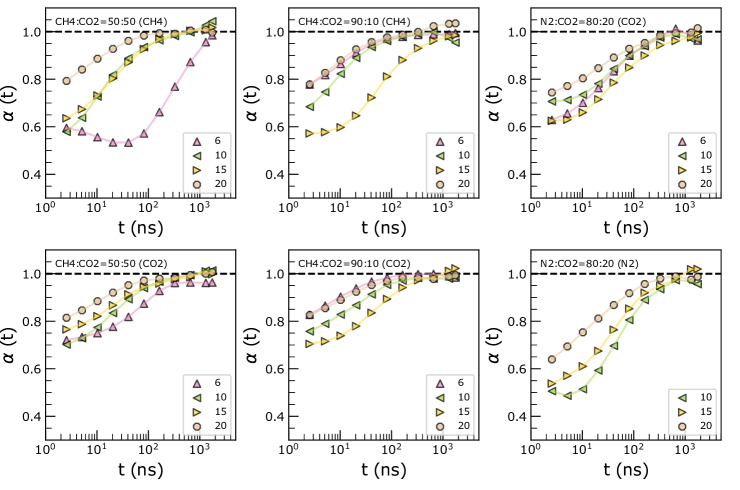
This data is obtained from long TEKMC simulations and the diffusivities were computed from the MSD data over to sample the Brownian diffusive regime (Fig. A3). For the binary mixtures, the permeability for the component is obtained from the corresponding solubility . values are obtained using Eq. 5, from binary mixture GCMC simulations reported in our previous work 37. The corresponding values of , and for the different gas mixtures are given in Table 2. The variations of the diffusive exponent for the mixtures are illustrated in Fig. A3 of the appendix. We observe that the diffusivities of \ceCO2, \ceCH4, and \ceN2 in their binary mixtures deviate significantly from the pure component values. is greater in majority of the binary mixtures when compared to diffusivity of pure \ceCO2 for a given pressure value reflecting the altered energy landscape for \ceCO2 in the mixture. The diffusivity of both \ceCH4 and \ceN2 are higher than that of \ceCO2 particularly at higher pressures. The difference in the mixture diffusivities of the two species is higher for \ceCH4 than \ceN2. However, the high adsorption of \ceCO2 onto 6F-CMSM leads to significantly higher which in turn results in a greater increase for when compared with \ceCH4 and \ceN2. We also note a decrease in the diffusivities for the \ceCO2 : \ceCH4 () at a pressure of 15 bar, however the reason for this particular deviation is not completely understood as the MSD data was well within the diffusive regime for both species.
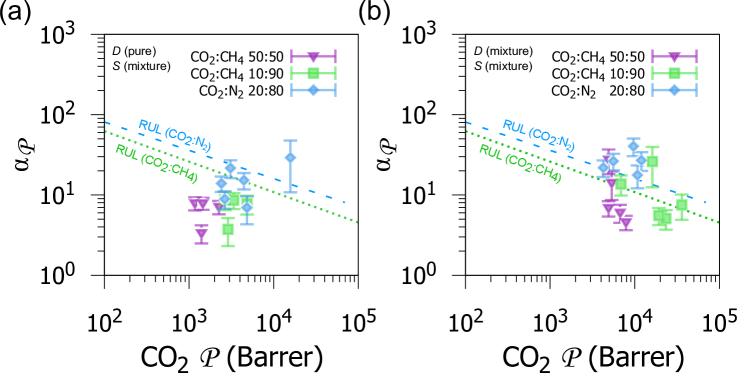
Fig. 5a shows the Robeson plots for different mixtures where we have used the solubility mixture data with pure component diffusivity values to obtain the permeabilities. In Fig. 5b mixture data (Table 2) was used for both the solubilities and diffusivities. The Robeson upper limit for different \ceCO2:\ceCH4 and \ceCO2:\ceN2 are plotted for comparison 27. Upon comparing Fig. 5a, b, we first note that both and increase while using values for and computed from mixture data. Using pure component values for the Robeson plot results in a lowering of the corresponding values leading to underpredicting the performance of a given material. In Fig. 5a we observe a single point for the \ceCO2:\ceN2 mixture that lies above the Robeson limit. This point corresponds to the lowest pressure of 0.6 bar for which we did not evaluate the corresponding mixture diffusivities. Interestingly we observe that the data for the \ceCO2:\ceN2 mixture lies at or above the Robeson upper limit when mixture diffusivity data is used (Fig. 5b). Similar trends are observed for the \ceCO2:\ceCH4 mixture as well as the \ceCO2:\ceCH4 (). The increase in for \ceCO2 is primarily due to the increase in the diffusivities of \ceCO2 in the mixtures compared to the pure gas diffusivities. The increased permselectivities, are due to a higher diffusivity ratio obtained with mixture diffusivities.
Our results indicate that using values of single component gas diffusivities can lead to an underestimation of the true permselectivity of a membrane. Hence obtaining accurate estimates of the diffusivity in both experiments and simulations are needed in order to assess the separation performance of a given material. This will also facilitate a better understanding of the Robeson upper limits possessed by different membranes synthesized in the laboratory as well as from in silico predictions using MD simulations and machine learning based predictions 30, 32. We finally point out that although we have observed these trends for a specific adsorbent, in this case the 6F-CSM membrane, a similar analysis would be required to assess the generality of the trends observed in this study.
4 Conclusion and outlook
In this work we obtained the permeability of \ceCO2, \ceCH4 and \ceN2 gases inside a 6F-CMS membrane for different pressure conditions using multiscale computational techniques, namely all-atom molecular dynamics followed by trajectory extending kinetic Monte Carlo simulations. The dynamics of adsorbed gas molecules inside the membrane is usually retarded, leading to sub-diffusive mean squared displacements in the timescales of typical all-atom molecular dynamics simulations. To sample the diffusive dynamics regime, the TEKMC algorithm enables us to extend all-atom MD trajectories to timescales where the diffusive limit can be reliably sampled. The constructed transition probability matrices also helps us understand accessible and inaccessible regions of the complex pore networks in the membrane. In a distinct departure from earlier works we extend the TEKMC simulations to obtain diffusion coefficients of gas mixtures. To our knowledge this is the first time that mixture diffusivity data has been obtained using this method. For pure components \ceCO2, \ceN2 and \ceCH4, We report a linear increase in the gas diffusivity confined in the 6F-CMSM matrix with increasing in pressure. Conversely both the solubility and permeability of the gases are found to decrease with pressure.
We make a detailed comparison of the permselectivity using both pure component and mixture diffusivity data in the 6F-CMS membrane to assess the extent of deviations observed when pure component diffusivity data are used in lieu of mixture diffusivities. The implementation of the TEKMC algorithm is available as a package on request. Gas solubility data are calculated using previous GCMC mixture simulations 37. \ceCO2 diffusivities in both \ceCH4, and \ceN2 mixtures in the 6F-CMS membrane were found to be higher than the pure component values. This leads to a significant increase in both the permselectivity and permeabilities with the use of mixture diffusivities on the Robeson plots, with data lying at or above the Robeson upper limit for the \ceCO2:\ceN2 mixtures. Our analysis indicates that for the \ceCO2:\ceCH4 and \ceCO2:\ceN2 mixtures investigated in this study, pure component diffusivities underestimates the membrane performance by varying amounts. Our findings emphasizes the importance of obtaining accurate mixture diffusivity data while designing membranes for a given separation process. Coupled with GCMC and combined MD and TEKMC simulations our study provides a complete in silico framework that can be routinely used to assess the performance of membranes for gas separation processes. We restricted our analysis to the TEKMC study of self-diffusion coefficients in order to determine the gas permeabilities for the Robeson plots to assess separation performance in the polymeric membranes. The TEKMC analysis can potentially be extended to obtain the mutual diffusion coefficients, determined from cross correlations between different species in the mixture. 53. Correlations between species in a mixture are a function of the pore size, gas loading and interactions between the gas and the surface. A detailed analysis is needed to fully assess the determination of transport diffusivities while evaluating the gas permeabilities in polymeric membranes.
5 Data Availability Statement
The data underlying this study are available on request. The code is openly available at https://github.com/PKMLab/tekmc.
The authors thank the Department of Science and Technology, India for funding and providing computational resources.
6 Appendix
A0.1 Force field parameters
The interactions involving the gas molecules are modeled using the TraPPE force fields 40 and the 6F-CMSM atoms are modelled using modified Dreiding 38, 41. The values are shown in Table A1.
| Molecule | Site | (Å) | (K) | q (e) | Bond length (Å) |
|---|---|---|---|---|---|
| CMS | H | ||||
| N_R | |||||
| C_3 | |||||
| C_R_r | |||||
| C_R | |||||
| CH4 | CH4 | 3.73 | 148.0 | ||
| CO2 | C | 2.80 | 27.0 | C O | |
| O | 3.05 | 79.0 | |||
| N2 | N | 3.31 | 36.0 | N N | |
| COM | 0.0 | 0.0 |
A0.2 Validation of TEKMC algorithm using bulk water simulations
We performed a fully atomistic MD simulation of the bulk water system consisting of 800 SPC/E 54 water molecules using LAMMPS. Initial positions of water molecules were randomly assigned inside the MD box with a constraint that all of them are separated by a threshold distance greater than the bond length of water. Periodic boundary conditions were enforced in all directions. The bulk water system was energetically minimized to remove bad contacts. The minimization comprised of 500 steps of steepest descent followed by 500 steps of conjugate gradient. After the energy minimization, the system was heated to in steps of , each for 10 ps, using a Langevin thermostat 55. The system is next simulated in an NPT ensemble so that the system attains appropriate density at 1 atm pressure. During the NPT run of at temperature and 1 atm pressure, the density of the system reaches equilibrium by varying the MD box boundaries. To maintain a constant pressure of 1 atm, Nosé-Hoover barostat was used with a coupling constant of . Finally, we perform a production run for in an NVT ensemble. Nosé-Hoover thermostat 56, 57 with a heat bath coupling constant of was used to maintain a constant temperature during the production run. The velocity-Verlet scheme was used to do the MD integration with an integration time step of . The OH bond was constrained using the SHAKE 58 algorithm. To compute the long-range Coulomb potential, particle-particle particle-mesh Ewald summation method (PPPM) 59 was used with a tolerance of . The trajectory of water molecules was dumped every .
The TEKMC algorithm uses trajectories obtained from the production run to extend the MSD to a longer time scale. Trajectories obtained from the NVT simulation are used by the TEKMC algorithm to extend the MSDs to larger time scales. The timestep between the MD frames analyzed by TEKMC is . Hence, the timestep between steps of the random walk is . From the NVT simulation of SPC/E water, the transition probability matrix is estimated during the first stage of the TEKMC algorithm. We perform 3000 random walks for various grid sizes up to and tune the grid size to match with the MSD of MD simulation.
Random walks of TEKMC were extended till for these grid sizes. MSD and diffusion coefficient till obtained from the MD simulation are also shown. Grid size of best matches the MD data (having the lowest MSE). The exponent is 1.0, indicating that MSD is linear with time and SPC/E water follows Fickian diffusion in this time scale. From TEKMC, we obtain diffusion coefficient of SPC/E water to be , in good agreement to the literature value of 44. The diffusion coefficient of bulk water obtained from simulations is subject to finite size effects based on the size of the box and number of molecules 45. The main goal of our validation was to reproduce the MD obtained MSD by tuning during TEKMC. Once validated, our main focus is on the gas diffusivity inside the ultramicropores. Diffusion in the polymeric membrane is related to the inherent pore size distribution in the membrane which could be influenced by finite size effects. We point out that the polymeric membranes used in this study have been prepared by using extensive compression and decompression cycles which has shown to reproduce the experimental pore size distribution and adsorption isotherm for this system 37. The finite size corrected diffusivities may also be obtained by a suitable further tuning of . The self-diffusion coefficient of pure water has been measured to be at from experimental techniques like diaphragm-cell technique60 or the pulsed-gradient spin echo (PGSE) NMR method61.
A0.3 Probability distribution of gases used for performing TEKMC
A0.4 Binary component diffusion inside 6F-CMSM
We perform MD simulations of binary gas mixtures inside 6F-CMSM corresponding to different pressure conditions. The obtained trajectories are then extended till to obtain mixture diffusion coefficients of the different gases. We find the diffusivities are significantly different in the mixture compared with the pure gases shown in the main accompanying text. The diffusivity of \ceCO2 is comparable to \ceCH4 or \ceN2 only for low pressures. The diffusivity is also affected by the molar ratio of the mixtures.
References
- Carta 2015 Carta, M. In Encyclopedia of Membranes; Drioli, E., Giorno, L., Eds.; Springer Berlin Heidelberg: Berlin, Heidelberg, 2015; pp 1–3
- Nielsen et al. 2012 Nielsen, C. J.; Herrmann, H.; Weller, C. Atmospheric Chemistry and Environmental Impact of the Use of Amines in Carbon Capture and Storage (Ccs). Chemical Society Reviews 2012, 41, 6684–6704
- Bhatta et al. 2015 Bhatta, L. K. G.; Subramanyam, S.; Chengala, M. D.; Olivera, S.; Venkatesh, K. Progress in hydrotalcite like compounds and metal-based oxides for CO2 capture: a review. Journal of Cleaner Production 2015, 103, 171–196, Carbon Emissions Reduction: Policies, Technologies, Monitoring, Assessment and Modeling
- Koros 2004 Koros, W. J. Evolving Beyond the Thermal Age of Separation Processes: Membranes Can Lead the Way. Aiche Journal 2004, 50, 2326–2334
- Kamath et al. 2020 Kamath, M. G.; Itta, A. K.; Hays, S. S.; Sanyal, O.; Liu, Z.; Koros, W. J. Pyrolysis End-Doping To Optimize Transport Properties of Carbon Molecular Sieve Hollow Fiber Membranes. Industrial & Engineering Chemistry Research 2020, 59, 13755–13761
- Vu et al. 2002 Vu, D. Q.; Koros, W. J.; Miller, S. J. High Pressure CO2/CH4 Separation Using Carbon Molecular Sieve Hollow Fiber Membranes. Industrial & Engineering Chemistry Research 2002, 41, 367–380
- Kumar et al. 2019 Kumar, R.; Zhang, C.; Itta, A. K.; Koros, W. J. Highly Permeable Carbon Molecular Sieve Membranes for Efficient CO2/N2 Separation At Ambient and Subambient Temperatures. Journal of Membrane Science 2019, 583, 9 – 15
- Rungta et al. 2017 Rungta, M.; Wenz, G. B.; Zhang, C.; Xu, L.; Qiu, W.; Adams, J. S.; Koros, W. J. Carbon Molecular Sieve Structure Development and Membrane Performance Relationships. Carbon 2017, 115, 237–248
- Song et al. 2022 Song, W.; Park, J.; Dasgupta, S.; Yao, C.; Maroli, N.; Behera, H.; Yin, X.; Acharya, D. P.; Zhang, X.; Doherty, C. M.; Maiti, P. K.; Freeman, B. D.; Kumar, M. Scalable Pillar[5]Arene-Integrated Poly(Arylate-Amide) Molecular Sieve Membranes To Separate Light Gases. Chemistry of Materials 2022, 34, 6559–6567
- Li et al. 2018 Li, L.; Xu, R.; Song, C.; Zhang, B.; Liu, Q.; Wang, T. A review on the progress in nanoparticle/C hybrid CMS membranes for gas separation. Membranes 2018, 8, 134
- Williams 2006 Williams, P. J. Analysis of Factors Influencing the Performance of Cms Membranes for Gas Separation. Ph.D. thesis, Georgia Institute of Technology, 2006
- Paul 1976 Paul, D. The Solution-Diffusion Model for Swollen Membranes. Separation and Purification Methods 1976, 5, 33–50
- Wijmans and Baker 1995 Wijmans, J. G.; Baker, R. W. The Solution-Diffusion Model: A Review. Journal of Membrane Science 1995, 107, 1–21
- Lonsdale 1982 Lonsdale, H. The Growth of Membrane Technology. Journal of Membrane Science 1982, 10, 81–181
- Suloff 2002 Suloff, E. Permeability, Diffusivity, and Solubility of Gas and Solute Through Polymers. Sorption Behav. An Aliphatic Ser. Aldehydes Presence Poly (Ethylene Terephthalate) Blends Contain. Aldehyde Scav. Agents 2002, 29–99
- Skoulidas et al. 2006 Skoulidas, A. I.; Sholl, D. S.; Johnson, J. K. Adsorption and Diffusion of Carbon Dioxide and Nitrogen Through Single-Walled Carbon Nanotube Membranes. The Journal of Chemical Physics 2006, 124, 054708
- Verploegh et al. 2015 Verploegh, R. J.; Nair, S.; Sholl, D. S. Temperature and Loading-Dependent Diffusion of Light Hydrocarbons in ZIF-8 as Predicted Through Fully Flexible Molecular Simulations. Journal of the American Chemical Society 2015, 137, 15760–15771, Pmid: 26606267
- Selassie et al. 2008 Selassie, D.; Davis, D.; Dahlin, J.; Feise, E.; Haman, G.; Sholl, D. S.; Kohen, D. Atomistic Simulations of CO2 and N2 Diffusion in Silica Zeolites: The Impact of Pore Size and Shape. The Journal of Physical Chemistry C 2008, 112, 16521–16531
- Kamala et al. 2002 Kamala, C. R.; Ayappa, K. G.; Yashonath, S. Mutual Diffusion in A Binary Ar-Kr Mixture Confined Within Zeolite Nay. Phys. Rev. E 2002, 65, 061202
- Kumar et al. 2017 Kumar, N. A.; Gaddam, R. R.; Suresh, M.; Varanasi, S. R.; Yang, D.; Bhatia, S. K.; Zhao, X. Porphyrin–Graphene Oxide Frameworks for Long Life Sodium Ion Batteries. J. Mater. Chem. A 2017, 5, 13204–13211
- Thornton et al. 2009 Thornton, A. W.; Nairn, K. M.; Hill, A. J.; Hill, J. M. New Relation Between Diffusion and Free Volume: I. Predicting Gas Diffusion. Journal of Membrane Science 2009, 338, 29–37
- Bousige et al. 2021 Bousige, C.; Levitz, P.; Coasne, B. Bridging Scales in Disordered Porous Media by Mapping Molecular Dynamics Onto Intermittent Brownian Motion. Nature Communications 2021, 12, 1043
- Neyertz and Brown 2010 Neyertz, S.; Brown, D. A Trajectory-Extending Kinetic Monte Carlo (Tekmc) Method for Estimating Penetrant Diffusion Coefficients in Molecular Dynamics Simulations of Glassy Polymers. Macromolecules 2010, 43, 9210–9214
- Neyertz et al. 2010 Neyertz, S.; Brown, D.; Pandiyan, S.; Van Der Vegt, N. F. Carbon Dioxide Diffusion and Plasticization in Fluorinated Polyimides. Macromolecules 2010, 43, 7813–7827
- Robeson 1991 Robeson, L. M. Correlation of Separation Factor Versus Permeability for Polymeric Membranes. Journal of Membrane Science 1991, 62, 165–185
- Freeman 1999 Freeman, B. D. Basis of Permeability/Selectivity Tradeoff Relations in Polymeric Gas Separation Membranes. Macromolecules 1999, 32, 375–380
- Robeson 2008 Robeson, L. M. The Upper Bound Revisited. Journal of Membrane Science 2008, 320, 390–400
- Robeson et al. 2009 Robeson, L.; Freeman, B.; Paul, D.; Rowe, B. An Empirical Correlation of Gas Permeability and Permselectivity in Polymers and Its Theoretical Basis. Journal of Membrane Science 2009, 341, 178–185
- Comesaña-Gándara et al. 2019 Comesaña-Gándara, B.; Chen, J.; Bezzu, C. G.; Carta, M.; Rose, I.; Ferrari, M.-C.; Esposito, E.; Fuoco, A.; Jansen, J. C.; Mckeown, N. B. Redefining the Robeson Upper Bounds for CO2/CH4 and CO2/N2 Separations Using A Series of Ultrapermeable Benzotriptycene-Based Polymers of Intrinsic Microporosity. Energy Environ. Sci. 2019, 12, 2733–2740
- Yang et al. 2020 Yang, Z.; Guo, W.; Mahurin, S. M.; Wang, S.; Chen, H.; Cheng, L.; Jie, K.; Meyer, H. M.; Jiang, D.-E.; Liu, G.; Jin, W.; Popovs, I.; Dai, S. Surpassing Robeson Upper Limit for CO2/N2 Separation With Fluorinated Carbon Molecular Sieve Membranes. Chem 2020, 6, 631–645
- Han and Ho 2021 Han, Y.; Ho, W. W. Polymeric Membranes for CO2 Separation and Capture. Journal of Membrane Science 2021, 628, 119244
- Barnett et al. 2020 Barnett, J. W.; Bilchak, C. R.; Wang, Y.; Benicewicz, B. C.; Murdock, L. A.; Bereau, T.; Kumar, S. K. Designing Exceptional Gas-Separation Polymer Membranes Using Machine Learning. Science Advances 2020, 6, Eaaz4301
- Li et al. 2022 Li, H.; Zhang, X.; Chu, H.; Qi, G.; Ding, H.; Gao, X.; Meng, J. Molecular Simulation On Permeation Behavior of CH4/CO2/H2S Mixture Gas in Pvdf At Service Conditions. Polymers 2022, 14, 545
- Krishna 2000 Krishna, R. Diffusion of Binary Mixtures in Zeolites: Molecular Dynamics Simulations Versus Maxwell–Stefan Theory. Chemical Physics Letters 2000, 326, 477–484
- Bashir et al. 2013 Bashir, M. A.; Al-Haj Ali, M.; Kanellopoulos, V.; Seppälä, J.; Kokko, E.; Vijay, S. The Effect of Pure Component Characteristic Parameters On Sanchez–Lacombe Equation-Of-State Predictive Capabilities. Macromolecular Reaction Engineering 2013, 7, 193–204
- Mahmood et al. 2015 Mahmood, S.; Xin, C.; Lee, J.; Park, C. Study of Volume Swelling and Interfacial Tension of the Polystyrene–Carbon Dioxide–Dimethyl Ether System. Journal of Colloid and Interface Science 2015, 456, 174–181
- Dasgupta et al. 2022 Dasgupta, S.; M., R.; Roy, P. K.; foram M. Thakkar; Pathak, A. D.; Ayappa, K. G.; Maiti, P. K. Influence of Chain Length On Structural Properties of Carbon Molecular Sieving Membranes and Their Effects On CO2, CH4 and N2 Adsorption: A Molecular Simulation Study. Journal of Membrane Science 2022, 664, 121044
- Roy et al. 2020 Roy, P. K.; Kumar, K.; Thakkar, f. M.; Pathak, A. D.; Ayappa, K. G.; Maiti, P. K. Investigations On 6fda/Bpda-Dam Polymer Melt Properties and CO2 Adsorption Using Molecular Dynamics Simulations. Journal of Membrane Science 2020, 613, 118377
- Kiyono et al. 2010 Kiyono, M.; Williams, P. J.; Koros, W. J. Effect of Pyrolysis Atmosphere On Separation Performance of Carbon Molecular Sieve Membranes. Journal of Membrane Science 2010, 359, 2–10
- Potoff and Siepmann 2001 Potoff, J. J.; Siepmann, J. I. Vapor–Liquid Equilibria of Mixtures Containing Alkanes, Carbon Dioxide, and Nitrogen. Aiche J. 2001, 47, 1676–1682
- Mayo et al. 1990 Mayo, S. L.; Olafson, B. D.; Goddard, W. A. Dreiding: A Generic force Field for Molecular Simulations. Journal of Physical Chemistry 1990, 94, 8897–8909
- Plimpton et al. 2007 Plimpton, S.; Crozier, P.; Thompson, A. Lammps-Large-Scale Atomic/Molecular Massively Parallel Simulator. Sandia National Laboratories 2007, 18, 43
- Tien and Chiu 2018 Tien, W.-J.; Chiu, C.-C. Generic Parameters of Trajectory-Extending Kinetic Monte Carlo for Calculating Diffusion Coefficients. Aip Advances 2018, 8, 065311
- Mark and Nilsson 2001 Mark, P.; Nilsson, L. Structure and Dynamics of the Tip3p, Spc, and Spc/E Water Models At 298 K. The Journal of Physical Chemistry A 2001, 105, 9954–9960
- Tsimpanogiannis et al. 2019 Tsimpanogiannis, I. N.; Moultos, O. A.; Franco, L. F. M.; de M. Spera, M. B.; Erdos, M.; Economou, I. G. Self-diffusion coefficient of bulk and confined water: a critical review of classical molecular simulation studies. Molecular Simulation 2019, 45, 425–453
- Alexander Stern 1994 Alexander Stern, S. Polymers for Gas Separations: The Next Decade. Journal of Membrane Science 1994, 94, 1–65
- Peng and Robinson 1976 Peng, D.-Y.; Robinson, D. B. A New Two-Constant Equation of State. Industrial & Engineering Chemistry Fundamentals 1976, 15, 59–64
- Dubbeldam et al. 2016 Dubbeldam, D.; Calero, S.; Ellis, D. E.; Snurr, R. Q. Raspa: Molecular Simulation Software for Adsorption and Diffusion in Flexible Nanoporous Materials. Molecular Simulation 2016, 42, 81–101
- Steel and Koros 2005 Steel, K. M.; Koros, W. J. An Investigation of the Effects of Pyrolysis Parameters On Gas Separation Properties of Carbon Materials. Carbon 2005, 43, 1843–1856
- Coudert et al. 2008 Coudert, F.-X.; Jeffroy, M.; Fuchs, A. H.; Boutin, A.; Mellot-Draznieks, C. Thermodynamics of Guest-Induced Structural Transitions in Hybrid OrganicInorganic Frameworks. Journal of the American Chemical Society 2008, 130, 14294–14302, Pmid: 18821758
- Kamala et al. 2005 Kamala, C. R.; Ayappa, K. G.; Yashonath, S. Large Distinct Diffusivity in Binary Mixtures Confined To Zeolite Nay. The Journal of Physical Chemistry B 2005, 109, 22092–22095, Pmid: 16853874
- Baker and Low 2014 Baker, R. W.; Low, B. T. Gas Separation Membrane Materials: A Perspective. Macromolecules 2014, 47, 6999–7013
- Jamali et al. 2020 Jamali, S. H.; Bardow, A.; Vlugt, T. J. H.; Moultos, O. A. Generalized Form for Finite-Size Corrections in Mutual Diffusion Coefficients of Multicomponent Mixtures Obtained from Equilibrium Molecular Dynamics Simulation. Journal of Chemical Theory and Computation 2020, 16, 3799–3806, PMID: 32338889
- Berendsen et al. 1987 Berendsen, H.; Grigera, J.; Straatsma, T. The Missing Term in Effective Pair Potentials. Journal of Physical Chemistry 1987, 91, 6269–6271
- Schneider and Stoll 1978 Schneider, T.; Stoll, E. Molecular-Dynamics Study of A Three-Dimensional One-Component Model for Distortive Phase Transitions. Physical Review B 1978, 17, 1302
- NosÉ 1984 NosÉ, S. A Unified formulation of the Constant Temperature Molecular Dynamics Methods. The Journal of Chemical Physics 1984, 81, 511–519
- Hoover 1985 Hoover, W. G. Canonical Dynamics: Equilibrium Phase-Space Distributions. Physical Review A 1985, 31, 1695
- Ryckaert et al. 1977 Ryckaert, J.-P.; Ciccotti, G.; Berendsen, H. J. Numerical Integration of the Cartesian Equations of Motion of A System With Constraints: Molecular Dynamics of N-Alkanes. Journal of Computational Physics 1977, 23, 327–341
- Hockney and Eastwood 2021 Hockney, R. W.; Eastwood, J. W. Computer Simulation Using Particles; Crc Press, 2021
- Mills 1973 Mills, R. Self-Diffusion in Normal and Heavy Water in the Range 1-45. Deg. The Journal of Physical Chemistry 1973, 77, 685–688
- Price et al. 1999 Price, W. S.; Ide, H.; Arata, Y. Self-Diffusion of Supercooled Water To 238 K Using Pgse Nmr Diffusion Measurements. The Journal of Physical Chemistry A 1999, 103, 448–450