NodLink: An Online System for Fine-Grained APT Attack Detection and Investigation
Abstract
Advanced Persistent Threats (APT) attacks have plagued modern enterprises, causing significant financial losses. To counter these attacks, researchers propose techniques that capture the complex and stealthy scenarios of APT attacks by using provenance graphs to model system entities and their dependencies. Particularly, to accelerate attack detection and reduce financial losses, online provenance-based detection systems that detect and investigate APT attacks under the constraints of timeliness and limited resources are in dire need. Unfortunately, existing online systems usually sacrifice detection granularity to reduce computational complexity and produce provenance graphs with more than 100,000 nodes, posing challenges for security admins to interpret the detection results. In this paper, we design and implement NodLink, the first online detection system that maintains high detection accuracy without sacrificing detection granularity. Our insight is that the APT attack detection process in online provenance-based detection systems can be modeled as a Steiner Tree Problem (STP), which has efficient online approximation algorithms that recover concise attack-related provenance graphs with a theoretically bounded error. To utilize the frameworks of the STP approximation algorithm for APT attack detection, we propose a novel design of in-memory cache, an efficient attack screening method, and a new STP approximation algorithm that is more efficient than the conventional one in APT attack detection while maintaining the same complexity. We evaluate NodLink in a production environment. The open-world experiment shows that NodLink outperforms two state-of-the-art (SOTA) online provenance analysis systems by achieving magnitudes higher detection and investigation accuracy while having the same or higher throughput.
I Introduction
Advanced Persistent Threat (APT) attacks have become a major threat to modern enterprises [8, 57]. Existing Endpoint Detection and Response (EDR) systems adopted by these enterprises to defend against cyber attacks have difficulties in countering APT attacks due to the lack of capability to recover the complex causality relationships between the steps of APT attacks [17, 50, 76, 66, 64, 43]. Therefore, practitioners and researchers [73, 13, 25, 59, 30, 69, 75] now analyze the system auditing events in provenance data to recover APT attack scenarios. Unfortunately, most of the existing provenance analysis systems only support post-mortem analysis for alerts of EDR systems, which can delay the accurate detection of APT attacks for a week [68] and cause significant financial losses. As shown in a recent study, it costs an enterprise about $32,000 each day when an attacker persists in the network [28].
To this end, researchers have built online provenance-based detection systems that detect and investigate APT attacks simultaneously [45, 74, 37, 46, 40]. Unlike post-mortem analysis systems, online provenance-based detection systems can detect and recover the logic of an APT attack within seconds of its occurrence, allowing security admins to respond in time and reduce potential losses. Furthermore, by conducting a comprehensive analysis on the whole APT attack campaign instead of individual system events, online provenance-based detection systems have substantially fewer false positives than conventional EDR systems, further improving the effectiveness and efficiency of APT attack investigation [41, 42].
Despite these promising early results, building an accurate online detection system is still conceptually challenging due to the constraint of limited resources and the high expectation of timeliness. Recent research has shown that the operating cost is the primary bottleneck for the industry to adopt an EDR system [21]. Thus, it is important to reduce the running cost of provenance-based detection system. Meanwhile, people still expect a provenance-based detection system to detect APT attacks in a timely online manner. Unfortunately, achieving high detection accuracy under the constraints of timeliness and limited resources is particularly challenging as provenance data is a highly structured graph (called provenance graph) [41, 92]. Existing graph processing algorithms, such as graph neural networks [38] or iterative message passing algorithms [41], cannot be directly applied due to their low efficiency.
To address these challenges, recent online provenance-based detection systems over-approximate the highly structured provenance graph with low-dimensional data structures [37] or manually crafted rules [45, 74, 46, 40]. While these systems reduce the computational complexity by sacrificing detection granularity, they make the detection result hard to interpret. For instance, given an APT attack captured in the provenance data, one of the SOTA online detection systems, UNICORN [37], may generate a provenance graph with more than 100,000 nodes. However, only fewer than 100 nodes are related to the APT attack. Thus, identifying the attack steps represented by such a small number of nodes out of the provenance graph is like “searching for a needle in a haystack,” which is extremely difficult for the security admins.
Generally, the workflow of provenance-based APT detection [45, 74, 46, 40, 92, 13, 97, 38, 85] contains three steps: ① attack candidate detection, which selects Indicators of Compromise (IOC) or anomalous events; ② provenance graph construction, which builds graphs with nodes representing system entities and edges representing entity interactions (e.g., read/write files) to uncover the interactions between the IOCs or anomalies; ③ comprehensive detection, which detects APT attacks based on the provenance graphs built in step ②. Among the three steps, the quality of the provenance graph built in step ② is the key to accurate and fine-grained detection. Unfortunately, building an optimally concise and accurate provenance graph that discloses the interactions between the IOCs or anomalies is challenging [25, 41]. The heuristics used by existing approaches either overly approximate the provenance graph [98], miss critical information [37], or are too heavy for online detection systems [92, 38]. Therefore, they cannot achieve conciseness, efficiency, and accuracy at the same time.
In this paper, we propose the FIRST online detection system that achieves fine-grained detection while maintaining detection accuracy under the constraints of timeliness and limited resources. Existing approaches fail to achieve conciseness, efficiency, and accuracy for APT detection simultaneously due to their fundamental limitation: lack of formal models of multiple goals of APT detection. Thus, to address this fundamental limitation, we propose to model the provenance graph construction (step ② of provenance detection) as an STP (Steiner Tree Problem) [49, 51], which is effective in modeling multiple goals and has efficient online approximation solutions with theoretical bounded errors. Consider IOCs or anomalies as a set of predefined nodes in STP (i.e., terminals), and assign each interaction among system entities with the same non-negative weight. Then building a provenance graph can be modeled as an online STP, which searches for a subgraph that links all anomalies with minimal numbers of edges. By doing so, we can design an approximation algorithm that ensures a subgraph with minimal edges within a theoretically bounded error range in polynomial time.
Although it sounds promising, solving the problem of APT attack detection based on STP faces three main challenges. The first one is how to detect long-term attacks. STP requires knowing the whole provenance graph in advance. However, keeping all provenance data in memory is impossible due to data size and storing it in an on-disk database is not practical either due to the I/O bottleneck. A straightforward approach of using a time window that only holds the most recent data is not always effective as attackers can take longer than the window allows. To solve this problem, we propose a novel in-memory cache design with a scoring method to prioritize events that may cause APT attacks and capture long-running attacks within the time window of STP. The second challenge is how to efficiently identify terminals in STP. Existing detection methods depend on intensive random walking and message passing on the provenance graph [38, 41, 92], which is not suitable for an online system. To solve this problem, we design an IDF-weighted three-layered Variational AutoEncoder (VAE) that requires minimal computation. The last challenge is that the current approximation algorithms for STP are still not efficient enough for APT attack detection. Existing approaches [51, 99, 77, 34] require finding the shortest path between two nodes, which is too expensive for online APT attack detection. To solve this problem, we develop an importance-oriented greedy algorithm for online STP optimization that achieves low computing complexity with a bounded competitive ratio.
We implement NodLink as a working system and deploy it to a beta version of the commercial Security Operations Center (SOC) of a security company, Sangfor. We evaluate NodLink with an open-world setting in the production environments of customers of Sangfor, including hospitals, universities, and factories. This is the first open-world evaluation on provenance-based APT detection systems. During two-day testing, NodLink successfully detected seven real attacks that happened in the customer’s production environment. It outperforms the SOTA APT attack detection systems, HOLMES [74] and UNICORN [37], in terms of the accuracy of detecting attacks from the provenance data and the accuracy of revealing attack steps from the detected attacks. Particularly, HOLMES fails to detect any attacks due to its incomplete rule set while UNICORN generates seven times more false positives on the graph level and three orders of MAGNITUDE more false positives on the node level. Besides the open-world experiment, we also evaluate NodLink with public datasets and in-lab-made datasets that simulate the internal environments of Sangfor. The conclusion is also consistent with the open-world experiments: NodLink consistently outperforms HOLMES and UNICORN by generating magnitudes fewer false positives.
In summary, our main contribution is proposing a formal and rigorous mathematical framework based on STP to model APT detection. This model enables efficient and accurate detection of APT attacks with valid approximation bounds. This is the first paper with theoretical analysis of APT detection error, to our best knowledge. Further, we did not simply apply the STP model since it is not efficient enough for online APT detection (See Section V.C HopSet Construction). Instead, we propose a novel SPT framework that is more efficient while maintaining the approximation error. We also provide new theoretical analysis of the error of our HopSet Construction in Section V.E. See Section V.C for why STP is not efficient enough. We summarize our major contributions as follows:
-
•
We model the APT detection as the online STP, which provides a new vision in online APT detection.
-
•
We design and implement an online APT detection system, NodLink, that achieves fine-grained detection with timeliness and limited resources based on STP.
-
•
We evaluate NodLink in real production environments. To the best of our knowledge, this is the first open-world evaluation of provenance-based APT attack detection.
-
•
We release an open-source version of NodLink along with a new public provenance dataset for attack detection that simulates the internal environment of Sangfor at https://github.com/Nodlink/Simulated-Data.
II Background

In this section, we introduce the background of provenance analysis and provenance-based detection systems, and describe the metrics to measure their performance.
II-A Provenance Analysis
Provenance analysis systems collect system auditing events of system calls from kernels using system monitoring tools, such as Sysdig [87] and Linux Audit [83], and build a provenance graph based on the collected events to show activities between system entities. A provenance graph is a directed graph. Its nodes are system entities, such as processes, files, and IP addresses. The edges of a provenance graph are control and data flows between system entities. For instance, there is an edge from process to process if forks . Similarly, an edge links process and file if writes data to . Currently, several pieces of research are developed to build and analyze provenance graphs. These approaches span from system monitoring tools [55, 80], data storage [26, 47, 62, 89, 101], and attack detection and investigation [45, 74, 46, 37, 73, 13]. Following the existing work [25, 92, 74, 46, 45, 13, 105], we focus on the system events that are critical to attack steps, which we list in Table I.
Despite the effectiveness of provenance analysis systems, their data logging can generate a colossal amount of records, which introduces significant pressure in log processing, and thus most existing provenance analysis systems only support post-mortem analysis for alerts of EDR systems. To address this problem, provenance-based detection system has received extensive research in recent years [45, 74, 46, 70, 37, 92, 105, 52]. It takes the system auditing events as input and outputs alerts in the form of provenance graphs when it detects attacks. Compared with the conventional EDR systems that process each event individually, provenance-based detection systems leverage the structure and dependency information of the provenance graph to design detection algorithms. However, existing solutions still suffer from challenges and limitations, as we will discuss below.
| Events | Operation Types |
|---|---|
| ProcessFile | read, write, create, chmod, rename |
| ProcessProcess | fork, clone, execve, pipe |
| ProcessIP | sendto, recvfrom, recvmsg, sendmsg |
We illustrate the challenges and limitations in detecting and investigating a real-world APT attack (APT29 [2]). Figure 1 shows the provenance graph of APT29. In APT29, an attacker compromises the Chrome browser on the victim’s machine and leverages PowerShell to run malicious scripts. Then the malicious PowerShell script tries to obtain the root privilege on the victim’s machine and, at the same time, executes the Mimikatz tool to get user credentials for lateral movement. The attacker then further attacks another host in the same network once he has the credentials of a different user.
Challenges: The challenges come from the high volume of data and the imbalanced ratio between attack and benign events. For instance, the provenance graph that contains the APT29 in Figure 1 has more than 20K events. However, there are only about 200 events that are attack-relevant (shown using red dash-dotted boxes) and more than 99% of the events are attack-irrelevant events introduced by benign system activities (shown using green solid boxes) [41, 68]. Furthermore, benign events may look similar to attack-related events in the provenance data, which further increases the difficulty in detecting attacks precisely. For instance, in Figure 1, the attacker leverages PowerShell to run malicious scripts. However, the system administrator may also use PowerShell to maintain the system. Simple solutions, such as a blacklist of process names, do not work because they cannot distinguish whether the attacker or the system administrator uses PowerShell.
Limitations of Existing Techniques: Existing provenance-based detection systems can be categorized into two groups: rule-based and learning-based systems. Numerous instances within both groups have demonstrated the capability to achieve practical graph-level accuracy [45, 74, 46, 37, 73, 13, 42]. However, existing systems cannot achieve sufficient node-level precision and node-level recall simultaneously.
Rule-based systems suffer low node-level accuracy due to the incomplete rule set. For instance, one of the SOTA rule-based systems, HOLMES [74], cannot detect the attack steps in the blue dotted boxes in Figure 1. The reason is that the rules of HOLMES are initiated from external untrusted IPs, while the mail process does not have a direct connection to the external IP addresses. Thus, the output graph of HOLMES for the attack in Figure 1 is fragmented. It fails to link the attack steps on HOST2 to the attack steps on HOST1, posing challenges for root cause analysis. Besides, rule-based systems generate many false positives on the node level since the rules cannot model all features of a dynamic system well.
On the flip side, learning-based systems have low node-level precision due to over-approximation. To support online detection, existing learning-based approaches project the provenance graph into low-dimensional data structures to reduce the computational complexity, leading to over-approximation. For instance, the SOTA learning-based online detection approach, UNICORN [37], converts the provenance graph into a hashing vector. Thus, UNICORN cannot pinpoint the attack-relevant nodes in Figure 1 (shown in red dash-dotted boxes) from the benign data (shown in green dash-dotted boxes), leading to a low node-level precision (1%).
II-B Online Steiner Tree Problem
Online STP is a combinatorial optimization problem [51] determined to be an NP-Complete problem with bounded approximation [56, 31, 61, 88, 71, 20, 95, 33]. Given an undirected graph with non-negative edges weights for each edge and a sequence of online revealed vertices (called terminals) , it outputs a subgraph of that spans . The objective is to minimize the total cost of .
The general framework of online STP optimization algorithm is presented in Algorithm 1. For each new terminal that arrives, we select the set of unselected edges that connects to the current solution of the algorithm. This set is chosen to be the cheapest, which has the minimal weighted edges, among all possible sets that connect to the existing terminals. To find this set, it uses a greedy approach: it computes the shortest path between and each previous terminal where , and then it picks the cheapest one as . We add to the solution and repeat this process until all terminals have arrived. The final solution is the union of all sets .
Competitive Ratio: The competitive ratio is a common measure for evaluating online STP. It is the worst-case cost of the online algorithm’s solution, denoted by , with the cost of an optimal solution that has full knowledge of the input, denoted by . Formally, the competitive ratio is defined as [19].
Algorithm 1 can achieve a competitive ratio of [51], where is the number of terminals. According to theoretical analysis, the competitive ratio of any online Steiner tree algorithm is [51]. Therefore, the simple greedy algorithm is optimal for online Steiner Tree building.
III Threat Model
Our threat model is similar to the previous work on learning-based provenance-based attack detection [41, 37]. We assume attacks have distinct features, which can be detected by statistical patterns or manually created rules. We assume that the system-level auditing frameworks are secure, which means that they can faithfully record system activities with sufficient details. In addition, we assume the storage and transmission of system logs are secure. Although there are several attack vectors that may compromise the collection, storage, and transmission of system logs [72, 80], they are beyond the scope of this work. We do not consider the attacks performed using implicit flows (e.g., side channels) that do not go through kernel-layer auditing and thus cannot be captured by the underlying provenance tracker. Although we allow attacks in the training data, we assume that the majority of the training data are not contaminated by attacks.
IV Overview of NodLink
Generally, NodLink is an online APT attack detection system. It accepts an event stream of system provenance events collected from the agents installed on the monitored hosts. The outputs of NodLink are concise alert provenance graphs that contain critical attack steps. An example of alert provenance graph is shown in Figure 1 (marked by the red dotted box with about 200 events).
Algorithm 2 shows the high-level workflow of NodLink, which is similar to existing detection systems [45, 74, 46, 70, 37, 92, 105, 52]. Our NodLink algorithm detects anomalies every ( = 10 in our implementation) seconds through four phases: (1) In Memory Cache Building(line 6), (2) Terminal Identification(line 7), (3) Hopset Construction(line 8), and (4) Comprehensive Detection(line 9). We fetch events and store them in a cache, allowing NodLink to track the causalities of events of long-running attacks in memory without suffering from the performance bottleneck introduced by slow I/O. Suspicious processes are identified and assigned anomaly scores based on local features, such as the command lines, process names, and accessed files. Hopsets are constructed for each terminal to connect topologically close event-level anomalies. Finally, we merge hopsets with the cache and report any subgraph with deviating anomaly scores as an alert to reduce false positives.
The key novelty of our approach is in Phase 3 of Hopset Construction. Existing approaches either use heavy graph learning algorithms [92, 106] or heuristics that are error prone [74]. In our approach, we propose an online-STP-based approach that ensures conciseness, accuracy, and efficiency. To model the APT attack detection on provenance graph as STP, we regard the attack-related processes as terminals and convert the directed graph to an undirected graph with equal non-negative weight of each edge, for simplification. It helps us to model terminals that do not have a direct causal relationship but have dependencies on the same node. Thus the object of APT detection is to identify the terminal set first and find the edge set that can connect all the attack-related nodes with the minimal total weight , which is a standard STP formula. Then, our system raises an alert if the aggregated anomaly score of the nodes in the Steiner tree is larger than a threshold.
In addition, we also design a novel in-memory cache that addresses long-running attacks while ensuring efficiency. For online APT detection, a time window is required to buffer newly coming events. However, the attacker may abuse a naive time window by taking long-running attacks. To this end, we design the time window as an in-memory cache that keeps updated and anomalous nodes in memory and evicts other nodes to the disk(line 4). While building the Steiner Trees, once our system encounters a node evicted to the disk, it loads it back to the memory. This design ensures that NodLink can handle long-running attacks while maintaining the performance of the online algorithm.
We have also adapted the standard online STP algorithm for APT attack detection. In Algorithm 1, the step of finding the shortest path between the newly arrived terminal and having seen terminals at line 6 is too time-consuming for an online detection system. Therefore we design an importance-oriented greedy algorithm that reduces the time complexity from to , where is the number of nodes, for the step of Hopset Construction. We further provide the theoretical analysis in Section V-E.
V Design Details
In this section, we present the design details of the components of NodLink.
V-A In-memory Cache
We design the time window of NodLink as an in-memory cache to address the long-running attacks and maintain the efficiency of the online STP optimization algorithm. It maintains the latest anomalous nodes in memory and evicts the outdated and benign nodes to disk.
In our design, the in-memory cache contains the edges of the provenance graph in the form of , where and are the IDs of the source and destination of an edge, respectively, and is the attribute of the edge, which includes the operation types and time stamps. The types of edges and their available operation types are listed in Table I. NodLink also stores necessary attributes for nodes in the directed graph, which are processes, files, and IP addresses. For processes, NodLink stores their command lines, process names, pids, and uids. For files and IPs, NodLink stores their paths and IPs with ports, respectively.
Cache Updates: Generally, the in-memory cache buffers subgraphs that (1) have higher anomaly scores and (2) are actively evolving. The in-memory cache updates every time window with length with the solutions of STP in the current time window. NodLink utilizes the in-memory cache for global STP solution and false positive reduction, which we will discuss in Section V-D in detail.
NodLink organizes the subgraphs in the cache as hopset and gives each hopset a hopset anomaly score (HAS). On the high level, a hopset is a subset of the provenance graph that contains the local context information of a set of event-level anomalies. HAS indicates the degree of abnormality for each hopset. We will discuss the details of hopset and HAS in the following sections.
We define the energy of a hopset, , as , where is a decaying factor, is the number of time windows passed since the last update to the hopset. if the given hopset has been updated in the last time window (e.g., new events are added to the graph). Otherwise, NodLink increases by one for every time window passes. When the cache is full, NodLink evicts the hopset with the lowest energy to the Neo4j [6] database.
Retrieving Nodes From the Disk: To detect long-term attacks, NodLink designs the storage policy of the graph database and retrieves the subgraphs from the database when encountering the evicted nodes. When evicting the hopset to the disk, NodLink stores all the relationships and attributes of nodes and edges, including the anomaly score, and removes them out. NodLink assigns a unique uuid for each node using md5 value. For processes, NodLink calculates the md5 of pid + tid + command line. For files, NodLink calculates the md5 of /full/path/filename. For IPs, NodLink calculates the md5 of src_ip:port:dst_ip:port. Thus NodLink can retrieve the attributes of the evicted node and hopset.
Since each node has a unique uuid, we can check if the node is evicted to disk by looking it up in the cache. Because the nodes in the cache are organized by a hashtable, it takes time for the lookup operation. If the node is not in the cache, NodLink queries the attributes of the node and the hopset that contains it. Then NodLink merges them and recalculates the HAS. In this way, NodLink can detect the entire APT attack campaigns.
V-B Terminal Identification
In Terminal Identification, NodLink scans the in-memory cache and identifies suspicious process nodes as terminals based on their node-level features. Note that although the output of NodLink only contains anomalous processes, it does consider anomalous files and IP addresses. NodLink merges the anomalous files and IP addresses to the processes that access them. The logic behind this design decision is that malicious files and IPs cannot be effective before being accessed by a process. Therefore, focusing on anomalous processes can reduce the duplicated alerts on files and IPs without losing node-level accuracy. NodLink analyzes three types of node-level features: the command line that starts a process (command line), the files accessed by a process (files), and IP addresses accessed by a process (network). Terminal Identification consists of two steps: First, it embeds process nodes into numerical vectors based on node-level features. Second, it uses a machine learning model to detect anomalies.
V-B1 Embedding
During Terminal Identification, NodLink first projects node-level features of a process to numerical vectors. On a high level, the embedding of a process is a weighted sum of the embedding vectors of the three node-level features. NodLink chooses to embed node-level features with Natural Language Processing (NLP) technique to handle unseen patterns in node-level features. The embedding process has two steps. NodLink first embeds command lines, file names, and IP addresses, respectively. Then it combines the embedding of them as the final embedding of a process.
In the first step, NodLink converts the command lines, file paths, and IP addresses into a sentence of natural language and then uses the document embedding tools in NLP to convert the sentence into a vector. The insight behind this design is that command lines contain natural language terms that represent the semantics of a process. For instance, in the command “date -d 4857 second ago +%s”, “date”, “second”, and “ago”, are natural language terms that indicate the functionality of the process. NodLink converts non-alphanumeric symbols into spaces to convert node-level features into sentences. For example, NodLink converts file “/etc/tmp/log.txt” into a sentence “etc tmp log txt” and converts the quadruple of IP “126.7.8.7, 80, 162.0.0.1, 8080” into a sentence “126 7 8 7 80 162 0 0 1 8080” by considering “.” as spaces. After the conversion, NodLink uses FastText [18] to convert the sentence to a numerical vector. We choose FastText because of its efficiency [18]. We can also use other more sophisticated sentence embedding techniques. However, since NodLink has achieved magnitudes higher node-level accuracy than baselines in our evaluation, we leave the design of such a better sentence embedding technique as our future work.
The main challenge for embedding node-level features is that they may contain strings that are not a part of natural languages. For example, “/var/spool/8b7dc29d0e” contains the hash string “8b7dc29d0e”. Existing NLP-based document embedding techniques cannot process these special tokens. Therefore, NodLink removes the non-natural-linguistic by deleting tokens that do not have valid meanings with the NLP technique Nostril [48].
The second step for embedding is to sum the numerical vectors of the three node-level features. Formally, the embedding vector of a process is defined as:
, where , , are the embedding vectors of the command line, files and network connections, respectively, , , and are the weights.
Formally, the weight of a file is defined as , where is the number of all the processes and is the number of the processes that operate the file. We use a similar method to calculate the weights for IP addresses. The logic behind this design is to address files and IP addresses commonly shared by different processes [68]. For example, all processes load the libc file. Thus, the libc is not useful for modeling the local features of a process. Then, we design the weight to degrade the impact of the files or IP addresses like the libc file to improve the accuracy for process modeling. Lastly, The weight of the command line is the average of the weights of all files and IPs to ensure that is on the same order of magnitude of files and IP addresses.
V-B2 Anomaly Detection
To detect terminals, NodLink leverages a VAE model [60] to calculate the anomaly score for each process node in the provenance graph and then identifies the nodes with higher anomaly scores as terminals. VAE model is widely used as a lightweight anomaly detection model in other tasks [100, 65, 109]. We choose to use the VAE model because it is efficient for an online detection system [107].
The VAE model used by NodLink is a standard one for anomaly detection [11]. The input of the model is , the embedding vector of a process node . The output is an anomaly score. The high-level process for NodLink is as follows. First, for a process node, NodLink feeds its embedding vector to the VAE model and gets the reconstruction of the input vector as . Then, NodLink compares to . If differs from significantly, the input node is more likely an anomalous node. NodLink numerically measures the difference between and with the normalized MSELoss, following other VAE-based anomaly detectors [108, 81]. To follow the common terms in machine learning, we use the reconstruction error to represent the value of the MSELoss between and . Based on existing related work in machine learning [14], measures the rareness of a process. In other words, a high means the input process node is more likely an anomaly according to historical data.
A straightforward method to calculate the anomaly score for a process node is to use the reconstruction error directly. However, this method may generate false positives for unstable processes [68], which are the processes that often access random files or IP addresses. For instance, a web browser tends to access random IP addresses. Directly using the reconstruction error will constantly identify processes like web browsers as terminals, leading to false positives. To address the problem of unstable processes, we introduce a stability score to balance the reconstruction error for unstable processes. For NodLink, we define as the cluster number of embedding vectors of the processes with the same name as in the historical data, following related work [41]. Formally, NodLink calculates its anomaly score with the equation:
, where is the embedding vector of a process, is the reconstruction error given by the VAE model, and is the stability score of the process . is divided by to reduce the impact of unstable processes.
To detect terminals, NodLink marks a process node as anomalous if its is higher than the 90th percentile of in historical data. This threshold is a widely used threshold for VAE-based anomaly detection [79, 109, 14]. In the design of NodLink, we do not use other values for the threshold to ensure that our approach can be generalized.
Offline Model-Training: Although NodLink is an online detection framework, it needs to train the FastText model, the VAE model, the model, and the threshold to raise anomalies from the historical data offline. NodLink trains the FastText model on the command lines, file paths, and IP addresses in the historical data. Then, NodLink uses trained embedding vectors to further train the VAE model. NodLink calculates offline by periodically running the DBSCAN algorithm [58] on the historical data. It first classifies the process embedding vectors into distinct groups. Then, the process name and its number of clusters are stored in an in-memory hash table for online anomaly score calculation.
V-C Hopset Construction
After detecting terminals in Terminal Identification, NodLink runs Hopset Construction to solve the STP in the current time window. The hopset in a certain time window is the neighbor context for each terminal, which includes bounded neighbor nodes and the paths to these nodes. NodLink utilizes the greedy algorithm, which we called Importance-Score-Guided Search (ISG) algorithm, to construct the hopset based on the local information, such as and node degree. Hopset Construction outputs an approximated solution of STP with low complexity and bounded competitive ratio, described in Section V-E.
Holistically, Hopset Construction follows the algorithm framework in Algorithm 1 to build the Steiner trees. However, in Algorithm 1, finding the shortest paths at line 6 has a complexity of using Dijkstra’s algorithm [44], where is the number of nodes. This is still too expensive for an online detection solution. To this end, we designed an importance-score-guided search that has a complexity of .
The workflow of Hopset Construction is as follows. Assuming that there are nodes in terminals, Hopset Construction first starts searching procedures, each for one of the terminals. The search process is greedy by an importance score of . Each greedy searching procedure generates a hopset, and the number of nodes is bounded. NodLink stops exploring new nodes if it has already discovered nodes. This early stopping is motivated by the assumption of attack polymerism [41, 38, 92, 25, 106, 46, 40], which says that attack actions are topologically close in the provenance graph because attackers need to create the execution chain of attack actions step by step through a sequence of footholds.
Our tool merges overlapping hopsets during greedy searching to efficiently connect terminals within bounded node exploring instead of utilizing the shortest path algorithm with high complexity used in the classic greedy algorithm [51]. This approximated solution reduces false positives in anomaly detection by identifying topologically close attack-related anomalies. Hopset Construction assigns a HAS to each hopset for future investigation, focusing on more important nodes based on anomaly score and distance from terminals. This deprioritizes far nodes to exclude false positives and leverage the attack polymerism of APT attacks, which states that attack-related event-level anomalies are topologically close in the provenance graph because attackers conduct attack activities through a few footholds, such as backdoors or reverse shells.
The key component of Hopset Construction is the design of the importance score, which allows NodLink to focus limited computational resources on more important nodes. Our design of considers two major factors. The first is the anomaly score . The second is the distance from the closest node in terminals. The intuition behind the distance is to leverage the attack polymerism of APT attacks [38, 46, 41], which says that the influence of an attack step candidate decreases with distance. Thus, NodLink deprioritizes the nodes that are far from terminals to further exclude false positives in terminals. Formally, of a node is defined as:
| (1) |
In Equation 1, reflects the distance between and terminals. It decreases when is far from terminals. Specifically, is a distance decaying factor, and is the number of hops between and its nearest terminals. is the anomaly score of the node, as defined in Section V-B2
In Equation 1, we also introduce a supplementary factor for a node , which is defined as . We introduce this term because we observe that some processes have the tendency to generate a multitude of “leaf” nodes that do not propagate data and control flow dependencies. These “leaf” nodes are not interesting for APT attack detection and investigation [68]. Thus, we use the term to deprioritize them. We combine and with two weights and . Note that in the design of NodLink, is the main factor, while is the supplementary factor. Thus, NodLink only requires .
Graph Anomaly Score Calculation: The last step of Hopset Construction is to assign the anomaly score HAS to each hopset. We define the HAS for a hopset as the sum of all anomaly scores of all nodes in the hopset, or formally, . Note that since NodLink has already excluded nonimportant nodes based on , nodes in hopset are likely to be attack-relevant. Thus, the sum of only includes the nodes that are highly likely to be attack-relevant. This design helps improve the node-level accuracy and graph-level accuracy, defined in Section VI-B, by avoiding attack-irrelevant events.
V-D Comprehensive Detection
To conduct comprehensive detection, NodLink first updates the cache hopsets in the memory with the hopsets that are constructed in the current time window. NodLink merges the hopsets of current time window with the hopsets in the cache if they have the same nodes. However, if we merge the hopsets directly, in the worst situation, a long-running process was identified as terminal and was updated different neighbors in each time window, which can result in dependency explosion. To prevent it, we limit the hopset of each terminal within nodes and replace the nodes with lower values with the ones with higher values while merging.
After hopset merging, NodLink assigns HAS to the updated hopsets, as described in Section V-A. In this way, we can connect the STP solutions of each time window to global solution so that we can reconstruct the long-term attack campaign. Then NodLink leverages the Grubbs’s test [10] to detect hopsets with abnormally high HAS. Grubbs’s test detects whether the largest value of a set of samples is an outlier. We choose Grubbs’s test because it is non-parameterized and robust to polluted training datasets. NodLink runs the Grubbs’s test on the in-memory cache for multiple rounds until no outliers are flagged. Finally, the detected outliers are identified as attack campaigns and alerts will be raised.
V-E Theoretical Analysis
Complexity: In Terminal Identification, NodLink embeds a process to a numerical vector considering the node-level features that the process directly accesses. Thus NodLink needs to explore the node-level features through edges with the complexity . In Hopset Construction, NodLink constructs hopset for each terminal by greedy exploring nodes. Therefore the complexity of the detection is , where is the number of nodes in the provenance graph.
Competitive Ratio: In Section V-C, we replace the shortest path exploration at line 6 of Algorithm 1 with the importance-score-guided search. This replacement may result in a larger Steiner tree in the detection, compromising the conciseness. Therefore, in this section, we analyze the new competitive ratio, which is the ratio between the size of the Steiner tree generated by our algorithm to the theoretically optimal solution. Recall that a standard online STP optimization algorithm has the competitive ratio of , where is the number of terminals. Therefore, we only need to compare our approach to the standard online STP optimization algorithm.
Formally, in our problem, in time window , NodLink gets a solution of STP , the hopsets in our algorithm. Our object is to minimize the total weight , where is the number of time windows that we have experienced. Assume is the standard STP solution with cost and is the standard STP solution with cost [39]. So the competitive ratio can be derived as:
For , we have the following derivation:
| (2) |
As we defined in Section IV, we assign each edge the weight of 1, so the total weight of the solution is the number of edges. For the first step in Equation 2, the same edges can be merged so we have . In each time window, NodLink explores at most nodes for each terminal. Thus, there are at most edges. And we guarantee the hopset of each terminal within nodes so the total number of edges is less than , where is the number of terminals. Thus we have for the second step in Equation 2. And for the weight of optimal solution , it needs at least edges for connection, so we have in the third step. Then obviously, because in most of the cases in APT detection.
To sum up, NodLink can get a bounded competitive ratio since is a constant. In other words, our importance-score-guided search does not change the worst-case competitive ratio of the original online STP algorithm.
VI Evaluation
NodLink has three design goals: (1) achieving high node-level accuracy, (2) achieving high graph-level accuracy, and (3) achieving high throughput. Therefore we focus on answering the following research questions.
-
•
RQ 1: Can NodLink achieve higher graph-level accuracy than SOTA solutions?
-
•
RQ 2: Can NodLink achieve higher node-level accuracy than SOTA solutions?
-
•
RQ 3: Can NodLink achieve higher detection efficiency than SOTA solutions?
-
•
RQ 4: What is the impact of our optimization on efficiency?
-
•
RQ 5: Can NodLink effectively detect and recover the scenarios of real attacks in a production environment?
-
•
RQ 6: How do the hyperparameters affect the performance of NodLink?
VI-A Experiment Protocol
We implement NodLink in Python with 5K+ Lines of Code (LoC) and integrate it into Sangfor’s EDR solution. NodLink leverages the agents of the industrial EDR to collect provenance data from monitored hosts. The collected data have the same format as other detection systems [37, 74].
We choose HOLMES [74] and UNICORN [37], two of the representative online provenance-based APT attack detection systems, and ProvDetector [92], one of the well-known offline provenance-based for detecting stealthy malware, as the baselines for comparison. HOLMES is one of the SOTA rule-based systems. We use HOLMES as a baseline because it provides complete detection rules in its paper so that we can re-implement it. In addition, there are two other rule-based systems, MORSE [46] and RapSheet [40], that are as effective as HOLMES. However, both alternatives rely on rules from commercial EDRs or enterprise-specific policies that are not reported in the paper. Thus, we decide not to implement MORSE and RapSheet to avoid possible bias. UNICORN is the SOTA learning-based detection system. We directly use the published source code of UNICORN and use its default parameters, but modify its data parser to accept our data format. In order to more comprehensively evaluate the performance of NodLink, we also choose one of the SOTA offline systems, ProvDetector. We implement ProvDetector and release the code in the same GitHub repository. Our experiments are carried out on a server running Ubuntu 20.04 64-bit OS with 32-core Intel(R) Xeon(R) CPU E5-2620 v4 @ 2.10GHz, 64GB memory.
The main challenge in evaluating an APT detection system is to avoid the problem of “close-world data”, which means building the solution based on a known dataset that leads to overfitting. Existing solutions [38, 41, 92, 74, 73, 46, 40], including HOLMES [74] and UNICORN [37] are facing this problem. To avoid the “close-world” problem, we conduct an open-world experiment by deploying NodLink to realistic production environments, with the parameters obtained from the close-world experiment. The high-level summarization of our datasets is in Table II.
| Dataset | #APT | Duration | #Host | Event Rate | #Activities* | |||
| Close World | DARPA-CADETS | 3 | 247h | 1 | 16.87 eps | 21 | ||
| DARPA-THEIA | 1 | 247h | 1 | 11.25 eps | 97 | |||
| DARPA-TRACE | 2 | 264h | 1 | 75.76 eps | 93 | |||
| Industrial Arena | 3 | 336h | 22 | 40.74 eps | 197 | |||
| In-lab Arena | 5 | 144h | 5 | 48.23 eps | 202 | |||
|
- | 7 | 120h | 300+ | 39.35 eps | 568 |
-
*
#Activities is the number of malicious activities in the dataset.
VI-B Metrics
Formally, we define graph-level accuracy as two metrics: graph-level precision and graph-level recall.
Graph-level accuracy. We define graph-level precision as: , where and are graph-level true positives and false positives, respectively. We say a provenance graph is if it contains attack steps and is reported as an alert. For instance, the provenance graph in Figure 1 is a . Otherwise, we consider it as . We define graph-level recall as , where is the number of graph-level false negatives. We say a provenance graph is if it contains attack steps but is not identified as an alert.
Node-level accuracy. Node-level accuracy measures the granularity of an online detection system. It includes metrics: node-level precision and node-level recall. Specifically, node-level precision is defined as , where and are the numbers of node-level true positives and false positives, respectively. We say a node in a provenance graph is if it is attack-relevant and is included in an alert. Otherwise, we consider it as . We define node-level recall as , where is the number of node-level false negatives. We say an event in a provenance graph is if it is attack-relevant but is not included in an alert.
VI-C Close-World Experiment
In the close-world evaluation, we build five datasets. The first three are CADETS, THEIA, and TRACE from the DARPA TC Engagement 3 (E3) database [1]. We choose these three datasets because they are widely used in evaluating provenance-based detection systems [37, 46]. Besides the three datasets from DARPA TC, we also build two datasets, industrial Arena and In-lab Arena, that represent the realistic production environment of a security company, Sangfor. The Industrial Arena dataset includes the provenance data of a 14-day internal security evaluation engagement of Sangfor. It contains 22 working machines of its employees and three APT attacks simulated by a professional red team. The three attacks include the well-known APT29[2] attack, the APT32[3] attack, and a new one that exploits the latest Log4j2 (CVE-2021-44228)[9] vulnerability.
In addition to the Industrial Arena dataset, we also built a smaller testbed that simulated the internal environment of Sangfor and made the collected data publicly available111https://github.com/Nodlink/Simulated-Data. The data were collected from five hosts: one Ubuntu 20.04 server, two Windows Server 2012 R2 Datacenter, one Windows Server 2019 Datacenter, and one Windows 10 desktop host. We deployed Apache and PostgreSQL on Windows Servers and Nginx and PostgreSQL on Ubuntu 20.04 to simulate servers in Sangfor. The Windows 10 desktop was used to simulate the PCs used by the employees. On Windows Server 2012 and Ubuntu 20.04, we carried out the two real attacks from Sangfor. The attacker exploits the Apache Struts2-046 (CVE-2017-5638) vulnerability [63] for remote code execution and then penetrates the database on Ubuntu 20.04 by exploiting weak passwords. On Windows Server 2012, the attacker exploits the “phpstudy” backdoor and uses “PAExec.exe” to control other Windows servers remotely. On Windows 10, we carried out APT29 [2], FIN6 [5] and SideWinder [7] using the Atomic Red Team [4] and techniques based on MITRE’s ATT&CK [12]. We have also provided detailed attack steps in the documents of our repository.
For each dataset, we partition its benign data into a training set (80% of the graphs) and a test dataset (20% of the graphs). We then trained the detection model on the benign training set and evaluated the performance of NodLink on the test set and the attack data.
To build the ground truth for the three datasets from DARPA TC, we first labeled the attack according to the documents provided by DARPA. We leverage the red team in Sangfor to label the attack steps they have made for the Industrial Arena Dataset and the In-lab Arena Dataset.
VI-D Open-World Experiment
In open-world evaluation, we integrate NodLink and baselines to a beta version of EDR of Sangfor and deploy them to monitor the systems of realistic customers. Before our experiment, we have no prior knowledge about the data of customers. Thus, we can avoid over-fitting the test data. We fine-tune the hyperparameters based on the DARPA dataset in “close-world data” for NodLink and baselines, and deploy the fine-tuned models to the “open-world data” directly. The open-world evaluation evaluates how well can NodLink detect real attacks in production environments.
Our open-world evaluation includes 300+ servers and working machines of employees of 10 industrial customers from Sangfor, including schools, research institutes, factories, and healthcare providers. The servers include both Linux and Windows servers that host databases and back-end web services, while the working machines are Windows desktops used by employees in their daily work. Overall, there are 50+ Linux machines and 250+ Windows machines. We monitor the customers for five days. We use the first three days to train the detection model for NodLink and UNICORN, and use the last two days for testing.
Ground Truth Building: It is particularly challenging to build the ground truth for the open-world evaluation. Due to the large number of monitored hosts and the open environment, we cannot manually examine all system events to identify which event is attack-relevant. To this end, we first leverage the conventional EDR with 1000+ rules customized for the customers of Sangfor to label the possible attack-relevant events. However, this conventional EDR is overly conservative. It reports about 135,700 alerts for the two-day testing period. A professional security team of Sangfor manually examined the alerts and identified about 2,000 true alerts, which we consider attack-relevant events. Note that, unlike the NodLink and the two baselines, conventional EDR cannot automatically reconstruct the attack campaigns from attack-relevant events. Therefore, the same security team manually reconstructs seven APT attack campaigns from the attack-relevant events. We put a detailed description of the attacks in Section VI-I.
Hyper-parameter Setting: We empirically set the five hyperparameters, , , and , , and , of NodLink with DARPA datasets (CADETS, THEIA, and TRACE). We set as 0.9, (,) as (100,1), , and . We will discuss our rationale for choosing these values in Section VI-J.
| Dataset | ProvDetector | HOLMES | UNICORN | NodLink | ||||
|---|---|---|---|---|---|---|---|---|
| P | R | P | R | P | R | P | R | |
| DARPA-CADETS | NA | NA | 0.03 | 1.00 | 1.00 | 1.00 | 1.00 | 1.00 |
| DARPA-THEIA | 0.05 | 1.00 | 1.00 | 1.00 | 1.00 | 1.00 | 1.00 | 1.00 |
| DARPA-TRACE | NA | NA | 0.15 | 1.00 | 0.28 | 1.00 | 0.67 | 1.00 |
| Industrial Arena | 0.75 | 1.00 | 0.04 | 1.00 | 0.67 | 1.00 | 1.00 | 1.00 |
| In-lab Arena | 0.65 | 1.00 | 0.04 | 1.00 | 0.50 | 1.00 | 1.00 | 1.00 |
| Open-World | 0.11 | 1.00 | NA | NA | 0.15 | 1.00 | 0.35 | 1.00 |
VI-E RQ 1: Graph-Level Accuracy
We report the graph-level precision and graph-level recall of NodLink and the three baselines in Table III.
Close-World Result: As shown in Table III, although these systems can detect all attacks, they report more false positives than NodLink. Specifically, ProvDetector, UNICORN and HOLMES generate 783, 14 and 416 . On the contrary, NodLink only reports one false positive in these datasets.
ProvDetector fails to detect the attack in DARPA-CADETS and cannot conduct detection on DARPA-TRACE due to memory limitation. It also has the lowest graph-level precision on DARPA-THEIA because it cannot handle browser activities that explode dependencies. For example, ProvDetector mistakenly reports false alerts when Firefox connects to new IP addresses. UNICORN has lower graph-level precision because it over-approximates the provenance graph. UNICORN projects a provenance graph to a numerical vector for detection. This step downgrades its graph-level precision. HOLMES has more because its rules are overly conservative. For example, the command-line utility rule of HOLMES marks a process as anomalous if the process runs command-line utilities after accessing an untrusted IP address. This rule generates a lot of false positives for long-running processes such as Nginx: once an Nginx process receives a connection from the untrusted IP, all shell command executions forked by the Nginx process are marked as anomalies. Although building more complex rules can improve the precision of HOLMES, it is tedious to consider the heterogeneity of systems and the number of different types of system activities.
Open-World Results: We also show the result of the open-world experiment in Table III. Overall, the result is consistent with that of the close-world experiment. NodLink has a lower node-level precision in the open-world experiment because the signal-noise ratio is much lower in the open-world experiment. NodLink outperforms the baselines. Particularly, HOLMES FAILS to detect any attacks in the open-world experiment because its rule set lacks rules to detect webshells and process hijacking attacks. Unfortunately, the attacks in the open-world experiment all leverage webshells and related attacks that hijack running processes to stay stealthy. Thus, HOLMES fails to capture any of them.
VI-F RQ 2: Node-Level Accuracy
We evaluate the node-level accuracy of NodLink and compare it to our two baselines. We show the results of node-level precision and node-level recall in Table IV and Table V.
| Node-level Precision | ||||||
|---|---|---|---|---|---|---|
| ProvDetector | HOLMES | UNICORN |
|
|||
| DARPA-CADETS | NA |
|
||||
| DARPA-THEIA | 0.01 |
|
||||
| DARPA-TRACE | NA |
|
||||
| Industrial Arena | 0.14 |
|
||||
| In-lab Arena | 0.16 |
|
||||
| Open-World | 0.13 | NA |
|
|||
| Node-level Recall | |||
|---|---|---|---|
| ProvDetector | HOLMES | NodLink | |
| DARPA-CADETS | NA | 0.95 | 1.00 |
| DARPA-THEIA | 1.00 | 0.98 | 1.00 |
| DARPA-TRACE | NA | 0.74 | 0.98 |
| Industrial Arena | 0.20 | 0.23 | 0.96 |
| In-lab Arena | 0.98 | 0.32 | 0.92 |
| Open-World | 1.00 | NA | 1.00 |
Close-World Results: The node-level precision of NodLink is comparable with offline solution, ProvDetector. For online solutions, NodLink is one to two orders of magnitude higher than HOLMES and two to three orders of magnitude higher than UNICORN.
For node-level recall, NodLink captures most of the attack steps in its reported provenance graph. On average, NodLink covers 98% of the attack-relevant events. The missed steps are about reconnaissance, such as running “whoami”, “ipconfig”, “tasklist” and “systeminfo” to collect information about a system. NodLink has captured all steps that are related to running attack payloads and lateral movement in our experiment. HOLMES has a lower node-level recall because it lacks rules to detect several attack steps. For example, it cannot detect attack steps that are initiated by internal files.
We cannot measure the node-level recall for UNICORN because it simply reports all events in a provenance graph regardless of whether an event is relevant or irrelevant to an attack. Thus, although UNICORN captures all attack steps in its reported provenance graphs, it has magnitudes lower node-level precision than others. In addition, UNICORN is incompatible with other investigation techniques because all investigation techniques need suspicious nodes or edges of IOCs to initiate the investigation. UNICORN does not produce an IOC as a starting point for investigation techniques. Instead, it generates a provenance graph that includes attacks. Therefore, we cannot combine UNICORN with post-processing steps to increase its node-level precision.
Open-World Results: We also report the results of the open-world evaluation in Table IV and Table V. We skip the data of HOLMES as it fails to detect any attacks in the open-world experiment. Generally, the results are consistent with the results of close-world experiments. NodLink achieves the same node-level recall as UNICORN with two orders of magnitude higher node-level precision.
VI-G RQ 3: Efficiency
We evaluate how efficiently NodLink can detect APT attacks in a timely manner by measuring its throughput, which is defined as how many system events can be processed per second. Before running the empirical experiments, we first report our theoretical analysis of the complexity of our baselines. ProvDetector first extracts all the paths in the provenance graph and calculates the regularity score for each event. Then it converts the detection to finding longest paths on a directed acyclic graph, which is solved by Epstein’s algorithm [24] with time complexity . HOLMES processes provenance graphs through a policy matching engine. Therefore, its time complexity is , where is the number of edges. UNICORN constructs graph histograms with the complexity and uses HistoSketch [102] to generate graph sketches in real time, where is the number of hops, and the is the number of edges, as it is claimed in its paper [37]. Remember that the complexity of NodLink is . Thus, our analysis expects that NodLink and HOLMES are much faster than ProvDetector and UNICORN.
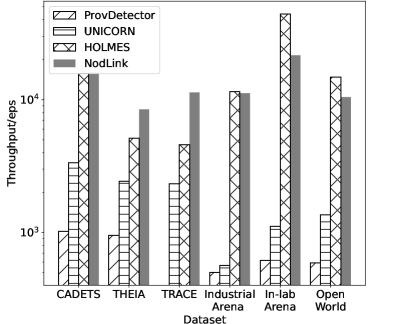
Figure 2 shows the empirical results. The y-axis is the number of events processed per second in each dataset. Overall, the throughput of NodLink is comparable to the throughput of HOLMES. NodLink has a higher throughput in DARPA-THEIA and DARPA-TRACE, while HOLMES has a higher throughput for the In-lab Arena dataset and the open-world experiment. HOLMES operates in two stages: (1) match Tactics, Techniques, and Procedures (TTPs) from provenance data, (2) link TTPs to High-level Scenario Graph (HSG). However, HOLMES fails to match some crucial steps in the in-lab arena and open-world datasets, as illustrated in Table V. This failure at the first stage eliminates the need for the second step, resulting in a higher throughput performance of HOLMES in these two datasets. ProvDetector shows the poorest throughput because it needs to calculate the regularity score for each event and find longest paths. As listed in Table II, an open-world host generates an average of 40 events per second. In industrial settings, a central-based detection system is expected to handle hundreds to thousands of hosts in a cluster [21]. With an assumption of 500 hosts, the system must process 20,000 events per second. Therefore, the throughput of UNICORN and ProvDetector falls short of industrial requirements. Overall, our evaluation shows that NodLink has a comparable or higher throughput than existing detection systems.
VI-H RQ 4: Ablation Study on Efficiency
NodLink designs in-memory cache and the ISG to improve efficiency. In this section, we conduct an ablation study on their impact respectively on efficiency using DARPA datasets. To evaluate the cache design, we disable the cache and store all the provenance data and cached graphs in the graph database Neo4j. To evaluate the ISG algorithm, we use the conventional Steiner Tree approximation algorithms, Kou [61], with time complexity, and Mehlhorn [104] with time complexity, in each time window as the baseline. We show the results in Table VI. We set the throughput of NodLink as the baseline and calculate the ratio between them. Overall, the design of the in-memory cache and the ISG search algorithm improves the detection efficiency greatly.
As shown in Table VI, when disabling the in-memory cache design, the efficiency is 82.54 - 159.06 times slower than the original design. When replacing our algorithm with Kou, the efficiency is 8406.86 times slower on the DARPA-CADETS. We failed to get the exact time of Kou due to the long processing time for the other two datasets. When replacing our algorithm with Mehlhorn, the efficiency is 3.08 - 111.21 times slower. We can find that the efficiency of these algorithms decreases as the dataset size increases, which is a consequence of their high complexity.
|
|
|
|
|||||||||
|---|---|---|---|---|---|---|---|---|---|---|---|---|
| DARPA-CADETS | 82.54 | 8406.86 | 3.08 | 1 | ||||||||
| DARPA-THEIA | 102.36 | - | 47.79 | 1 | ||||||||
| DARPA-TRACE | 159.06 | - | 111.21 | 1 |
VI-I RQ 5: Attacks Detected In Production
In this section, we show how NodLink detects real attacks in the open-world experiment with seven case studies. Overall, HOLMES fails to detect all these attacks because it lacks the rule to detect the code injection of webshell. NodLink and UNICORN can successfully detect them. However, NodLink has a much higher node-level precision, which can always be magnitudes larger than UNICORN.
Attack 1: In this attack, the attacker first hijacks the Windows IIS Web Server “w3wp.exe” through web shell injection. Then the attacker uses “csc.exe” to execute a trojan. In addition, the attacker also uploads the remote tools “GotoHTTP_x64.exe” to edit the registry and manages the devices for persistence and privilege escalation. Finally, he leaves a backdoor “Wlw.exe” to carry out intranet blasting with “fscan.exe” and uses “wevtutil” to clear footprints.
NodLink and UNICORN have successfully detected this attack. However, NodLink has a much higher node-level accuracy. Figure 3 shows the provenance graph for the attack. The part boxed by the red dashed lines is the provenance graph generated by NodLink (with about 260 nodes) and the part boxed by green dashed lines is generated by UNICORN (with more than 100K nodes). The node-level precision of NodLink in this case is 0.27, which is magnitudes larger than UNICORN. Besides, NodLink can also identify the core attack steps, such as running the webshell (“w3wp.exe”), the trojan “csc.exe”, and other attack tools, as terminals, which are marked as red-solid boxes. In Figure 3, we can observe that the provenance graph of UNICORN has many attack-irrelevant events caused by the file explorer of Windows (“explorer.exe”). These events are problematic for attack investigation. HOLMES fails to detect this attack because it lacks the rule to detect the code injection of webshell.
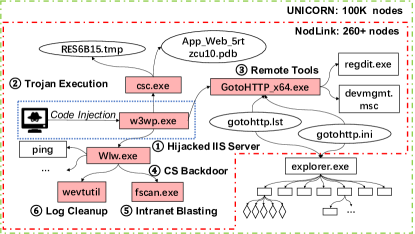
Our two baselines HOLMES and UNICORN cannot perform well on this attack scenario. For HOLMES, the code injection in the initial compromise stage, labeled with blue dotted boxes in Figure 3, cannot be matched up with the rules listed in HOLMES. Therefore it misses the whole attack. For UNICORN, although it can detect the attack, it reports the whole provenance graph with more than 100,000 nodes, which contains a large number of irrelevant events, such as the file manager application “explorer.exe”. Thus, it is very difficult for security admins to analyze the result of UNICORN.
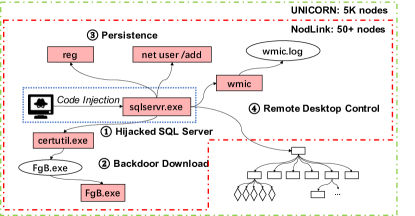
Attack 2: As shown in Figure 4, the attacker first hijacks the SQL Server on one host from an internal IP, then uses “certutil” to download a backdoor “FgB.exe”, and leverages “wmic” to set up the remote desktop control. Finally, the attacker adds a hidden user to the administrators for persistence, accesses the data stored in the database, and sends them to another internal IP for data exfiltration.
The part boxed by the red dashed lines is the provenance graph generated by NodLink (with about 50 nodes) and the part boxed by green dashed lines is generated by UNICORN (with more than 5K nodes). The node-level precision of NodLink in this case is 0.34. Besides, NodLink can also identify the core attack steps, such as hijacked SQL Server (“sqlservr.exe”), the backdoor “FgB.exe”, and other Living-Off-The-Land (LotL) attack tools, as terminals, which are marked as red-solid boxes. In Figure 4, we can observe that the provenance graph of UNICORN has many attack-irrelevant events that are generated by the normal behaviors of the SQL Server process (“sqlservr.exe”).
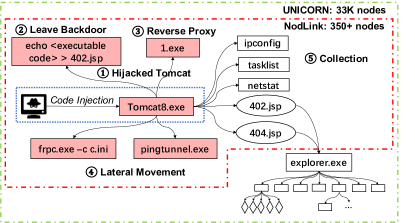
Attack 3: As shown in Figure 5, in this attack, the adversary injects a web shell to a Tomcat server “Tomcat8.exe” and leaves several backdoors. Then he uses “frpc.exe” and “pingtunnel” for lateral movement, runs a reverse proxy “1.exe” to keep C&C and scans for sensitive information.
The part boxed by the red dashed lines is the provenance graph generated by NodLink (with about 350 nodes) and the part boxed by green dashed lines is generated by UNICORN (with more than 33K nodes). The node-level precision of NodLink in this case is 0.22. Besides, NodLink can also identify the core attack steps, such as hijacked Tomcat (“Tomcat8.exe”), process that leaves a backdoor, the reverse proxy “1.exe”, and other steps for lateral movement, as terminals, which are marked as red-solid boxes. In Figure 5, we can observe that the provenance graph of UNICORN has many attack-irrelevant events that are generated by the file explorer of Windows (“explorer.exe”).
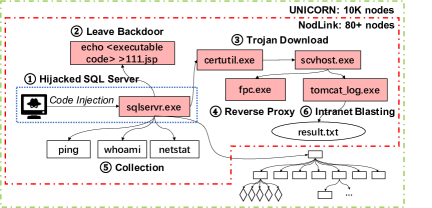
Attack 4: As shown in Figure 6, the attacker hijacks the SQL Server with backdoor “111.jsp” and uses “certutil.exe” to download “scvhost.exe”, the CS Trojan with a deceptive process name that is similar to the Host Process for Windows Services “svchost.exe”, on the server, and successfully communicates to the outside. Then he sets up a reverse proxy, collects the sensitive information and uses “fscan.exe” which is renamed as “tomcat_log.exe” to scan the intranet. It generates a “result.txt” file to record multiple intranet vulnerabilities.
The red dashed box contains the provenance graph from NodLink (with about 80 nodes), while the green dashed box holds the UNICORN-generated part (over 10K nodes). The node-level precision of NodLink in this case is 0.75. NodLink can also identify the core attack steps, such as hijacked SQL Server (“sqlservr.exe”), process that leaves a backdoor, the Trojan process “scvhost.exe”, and other steps for lateral movement and reverse proxy, as terminals, which are marked as red-solid boxes. In Figure 6, we can observe that the provenance graph of UNICORN has many attack-irrelevant events that are generated by the normal behaviors of the SQL Server process (“sqlservr.exe”).
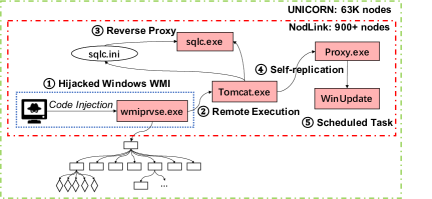
Attack 5: As shown in Figure 7, the attacker uses “wmiprvse.exe”, Windows Management Instrumentation (WMI) that provides management information and control in an enterprise environment, to run remote commands on the host through the domain account and execute the “Tomcat.exe” to copy itself to “Proxy.exe” and sets up reverse proxy tools “sqlc.exe”. Then the adversary creates scheduled tasks “WinUpdate” for permission maintenance.
The part boxed by the red dashed lines is the provenance graph generated by NodLink (with about 900 nodes) and the part boxed by green dashed lines is generated by UNICORN (with more than 63K nodes). The node-level precision of NodLink in this case is 0.22. Besides, NodLink can also identify the core attack steps, such as hijacked WMI (“wmiprvse.exe”), the remote execution “Tomcat.exe”, and other steps for reverse proxy and scheduled task, as terminals, which are marked as red-solid boxes. In Figure 7, we can observe that the provenance graph of UNICORN has many attack-irrelevant events that are generated by the normal behaviors of the SQL Server process (“sqlservr.exe”).
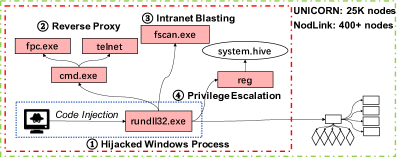
Attack 6: As shown in Figure 8, the server is attacked by malicious code memory injection into the system process “rundll32.exe” to set up malicious external connection. Then the malicious intranet proxy tool “frp” and intranet scanning tool “fscan” are subsequently implanted for reverse proxy and intranet blasting. He also uses “reg” to modify the registry for privilege escalation.
The part boxed by the red dashed lines is the provenance graph generated by NodLink (with about 400 nodes) and the part boxed by green dashed lines is generated by UNICORN (with more than 25K nodes). The node-level precision of NodLink in this case is 0.20. Besides, NodLink can also identify the core attack steps, such as hijacked “rundll32.exe”, which loads and runs 32-bit Dynamic-Link Libraries (DLLs), the process for intranet blasting “fscan.exe”, and other steps for reverse proxy and privilege escalation, as terminals, which are marked as red-solid boxes. In Figure 8, we can observe that the provenance graph of UNICORN has many attack-irrelevant events that are generated by the normal behaviors of “rundll32” that executes the normal DLLs.
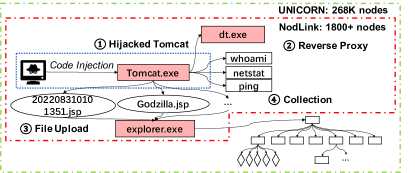
Attack 7: As shown in Figure 9, the attacker tries to connect to the webshell backdoor of the server “Tomcat.exe” and uploads a large number of files. In the temporary directory, 88 files uploaded by the attacker are found, 4 of which are Godzilla webshell and 1 is the dog-tunnel proxy tool. The rest are vulnerability test files. Then the attacker sets up “dt.exe” as reverse proxy.
The part boxed by the red dashed lines is the provenance graph generated by NodLink (with about 1800 nodes) and the part boxed by green dashed lines is generated by UNICORN (with more than 289K nodes). NodLink can identify the core attack steps, such as hijacked Tomcat (“Tomcat.exe”), the reverse proxy “dt.exe”, and the file explorer that lists a large number of malicious files, as terminals, which are marked as red-solid boxes. In Figure 9, we can observe that the provenance graph of UNICORN has many attack-irrelevant events that are generated by the normal behaviors of the file explorer (“explorer.exe”).
VI-J RQ 6: Hyperparameters
We choose the default hyperparameters using the optimal experiment results on DARPA dataset. Overall, NodLink is robust to changes in parameters because we choose to use non-parameterized learning techniques.
, and in Hopset Construction. In Hopset Construction, affects node distance’s impact on anomaly score. values of 0.5-0.9 performed equally well on graph-level accuracy and node-level accuracy. should be much larger than to prioritize nodes with close . We tested (100,1), (500,1), and (1000,1) for and and got similar results on graph-level accuracy and node-level accuracy.
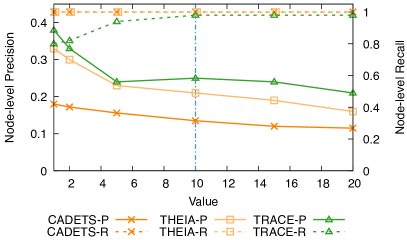
in Hopset Construction. We use node-level precision and node-level recall to measure the impact of our tool under different values. determines the search scope for each terminal, affecting graph-level and node-level accuracy. node-level precision decreases and node-level recall increases with higher values. Setting to 10 ensures complete reporting of attack scenarios while maintaining acceptable precision. The detailed result is in Figure 10(a).
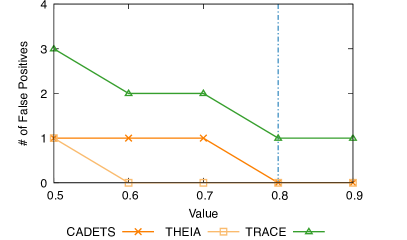
Decaying Factor . For the optimal value of the decaying factor , we measured the number of false positives and true positives by varying the value of the , as shown in Figure 10(b). In our experiment, NodLink can detect all the attacks in all the settings from 0.5-0.9, which means that the graph-level recall is 1. The results also show that, when the decaying factor is less than 0.8, more false positives are reported. Because can affect how long a graph is kept in the cache. The smaller the value, the higher the probability that the graph will be evicted from the cache. Therefore, in our experiments.
VII Related Work
King et al. [59] first introduced provenance graphs and backtracking, leading to numerous techniques for system auditing [16, 91, 42, 89, 35, 26, 53, 67], network debugging [15, 96], and access control [82]. Besides the online detection systems summarized in Section VI-A, SLEUTH [45] is the first provenance-based online APT detection system. Various offline post-mortem attack investigation systems [59, 68, 41, 38, 30, 69, 92, 36, 75] exist, using heavy graph learning algorithms. However, these can delay detection, leading to financial losses [28]. Compared to these systems, NodLink is the first online system that achieves high detection accuracy without losing detection granularity. There are also studies on conventional intrusion detection systems [29, 93, 94, 27, 86, 23, 22, 54]. However, these systems are orthogonal to NodLink since they cannot support APT attack investigation. We can borrow the idea of the recent progress in conventional intrusion detection systems to improve the accuracy of anomaly identification in Section V-B in the future. Researchers have studied approximation algorithms for STP that offer near-optimum solutions with polynomial running time [61, 32, 84, 103]. However, their complexity is too high for online APT detection.
NodLink is also related to conventional Host-based Intrusion Detection techniques (HIDS). Log2vec [66] embeds the logs into vectors by graph embedding with a random walk on the heterogeneous graph. Deeplog [23] models the sequence and context feature of logs using the Long-Short-Term-Memory (LSTM). These techniques are less effective in detecting APT attacks because they cannot link attack steps and reconstruct APT attack campaigns.
VIII Discussions
Evasion: NodLink maintains security parity with other score-propagation-based techniques like MORSE [46], PrioTracker [68], and NoDoze [41], offering efficient and accurate anomaly score calculation for provenance subgraphs. Despite its robustness, two potential attacks against NodLink are identified. First, attackers could use benign decoy events to reduce an attack path’s anomaly score, exploiting the decaying factor used in score propagation. However, this theoretical threat is less problematic in practice, as creating benign nodes often results in new anomalies and creates detectably anomalous path shapes. Secondly, attackers could attempt to evade detection by extending the time interval between each attack step, leading to anomalous nodes being purged from the cache. NodLink counters this through a node retrieval mechanism that reinstates evicted nodes from the disk, as described in Section V-A, safeguarding against long-term attack evasion.
Robustness: NodLink is resilient to a training dataset containing minor attacks, thanks to Grubbs’s test identifying and the robustness of VAE. We assessed NodLink’s robustness against polluted training data using five close-world datasets, to which we added one day of attack data. Results showed NodLink’s graph and node-level accuracy remained unaffected by the presence of a few attack-related data in the training set. This supports our design choice to employ VAE and non-parameterized anomaly detection techniques.
Other OS: NodLink supports provenance data collected from different operating systems. At present, the experimental data of NodLink is collected from Ubuntu and Windows hosts, but it also supports other systems such as openEuler.
IX Conclusion
Online provenance-based detection systems are preferred over post-mortem ones for detecting APT attacks in a timely manner. However, existing systems sacrifice detection granularity for accuracy due to limited resources and timeliness. We observe that existing systems fail to achieve fine-grained detection because they waste most of the limited resources on obviously benign events. To this end, we propose NodLink, an online provenance-based detection system that can achieve fine-grained detection while meeting the constraints of limited resources and timeliness. The key idea of NodLink is to model the APT attack detection problem as an STP, which has efficient online approximation algorithms with theoretically bounded errors. Our experiments in a production environment show that NodLink can achieve magnitudes higher detection and investigation accuracy with the same or higher throughput compared with two SOTA online provenance analysis systems.
Acknowledgments
This work was partly supported by the National Natural Science Foundation of China (62172009, 62302181, 62072046), Huawei Research Fund, CCF-Huawei Populus Grove Fund, National Key R&D Program of China (2021YFB2701000), the Key R&D Program of Hubei Province (2023BAB017, 2023BAB079). Xusheng Xiao’s work is partially supported by the National Science Foundation under the grant CNS-2028748.
References
- [1] “DARPA,” 2018, https://github.com/darpa-i2o/Transparent-Computing.
- [2] “APT29,” 2021, https://attack.mitre.org/groups/G0016/.
- [3] “APT32,” 2021, https://attack.mitre.org/groups/G0050/.
- [4] “Atomic Red Team,” 2021, https://github.com/redcanaryco/atomic-red-team.
- [5] “FIN6,” 2021, https://attack.mitre.org/groups/G0037/.
- [6] “Neo4j,” 2021, https://neo4j.com/.
- [7] “SideWinder,” 2021, https://attack.mitre.org/groups/G0121/.
- [8] “APT trends report Q1 2022,” 2022, https://securelist.com/apt-trends-report-q1-2022/106351/.
- [9] “CVE-2021-44228,” 2022, https://nvd.nist.gov/vuln/detail/CVE-2021-44228.
- [10] “Grubbs’s test,” 2022, https://en.wikipedia.org/wiki/Grubbs%27s_test.
- [11] “How to do anomaly detection using machine learning in python?” 2022, https://www.projectpro.io/article/anomaly-detection-using-machine-learning-in-python-with-example/555.
- [12] “MITRE ATT&CK,” 2022, https://attack.mitre.org/.
- [13] A. Alsaheel, Y. Nan, S. Ma, L. Yu, G. Walkup, Z. B. Celik, X. Zhang, and D. Xu, “ATLAS: A sequence-based learning approach for attack investigation,” in Proceedings of the USENIX Security Symposium (USENIX Security), 2021, pp. 3005–3022.
- [14] J. An and S. Cho, “Variational autoencoder based anomaly detection using reconstruction probability,” Special Lecture on IE, vol. 2, no. 1, pp. 1–18, 2015.
- [15] A. Bates, K. Butler, A. Haeberlen, M. Sherr, and W. Zhou, “Let SDN be your eyes: Secure forensics in data center networks,” in Proceedings of the NDSS workshop on security of emerging network technologies (SENT), 2014, pp. 1–7.
- [16] A. Bates, D. J. Tian, K. R. Butler, and T. Moyer, “Trustworthy Whole-System provenance for the linux kernel,” in Proceedings of the USENIX Security Symposium (USENIX Security), 2015, pp. 319–334.
- [17] Z. Bazrafshan, H. Hashemi, S. M. H. Fard, and A. Hamzeh, “A survey on heuristic malware detection techniques,” in The 5th Conference on Information and Knowledge Technology, 2013, pp. 113–120.
- [18] P. Bojanowski, E. Grave, A. Joulin, and T. Mikolov, “Enriching Word Vectors with Subword Information,” Transactions of the Association for Computational Linguistics, vol. 5, pp. 135–146, 2017.
- [19] A. Borodin and R. El-Yaniv, Online computation and competitive analysis. Cambridge University Press, 2005.
- [20] J. Byrka, F. Grandoni, T. Rothvoß, and L. Sanita, “An improved LP-based approximation for steiner tree,” in Proceedings of the ACM Symposium on Theory of computing (STOC), 2010, pp. 583–592.
- [21] F. Dong, S. Li, P. Jiang, D. Li, H. Wang, L. Huang, X. Xiao, J. Chen, X. Luo, Y. Guo, and X. Chen, “Are we there yet? an industrial viewpoint on provenance-based endpoint detection and response tools,” in Proceedings of the ACM SIGSAC Conference on Computer and Communications Security (CCS), 2023.
- [22] F. Dong, L. Wang, X. Nie, F. Shao, H. Wang, D. Li, X. Luo, and X. Xiao, “DISTDET: A Cost-Effective distributed cyber threat detection system,” in Proceedings of the USENIX Security Symposium (USENIX Security), 2023, pp. 6575–6592.
- [23] M. Du, F. Li, G. Zheng, and V. Srikumar, “DeepLog: Anomaly detection and diagnosis from system logs through deep learning,” in Proceedings of the ACM SIGSAC Conference on Computer and Communications Security (CCS), 2017, p. 1285–1298.
- [24] D. Eppstein, “Finding the k shortest paths,” in Proceedings 35th Annual Symposium on Foundations of Computer Science, 1994, pp. 154–165.
- [25] P. Fang, P. Gao, C. Liu, E. Ayday, K. Jee, T. Wang, Y. F. Ye, Z. Liu, and X. Xiao, “Back-Propagating system dependency impact for attack investigation,” in Proceedings of the USENIX Security Symposium (USENIX Security), 2022, pp. 2461–2478.
- [26] P. Fei, Z. Li, Z. Wang, X. Yu, D. Li, and K. Jee, “SEAL: Storage-efficient causality analysis on enterprise logs with query-friendly compression,” in Proceedings of the USENIX Security Symposium (USENIX Security), 2021, pp. 2987–3004.
- [27] H. Feng, O. Kolesnikov, P. Fogla, W. Lee, and W. Gong, “Anomaly detection using call stack information,” in Proceedings of the IEEE Symposium on Security and Privacy (IEEE S&P), 2003, pp. 62–75.
- [28] FireEye, “Incident investigation,” 2019, https://www.fireeye.com/products/incident-investigation.html.
- [29] S. Forrest, S. Hofmeyr, A. Somayaji, and T. Longstaff, “A sense of self for Unix processes,” in Proceedings of the IEEE Symposium on Security and Privacy (IEEE S&P), 1996, pp. 120–128.
- [30] P. Gao, X. Xiao, Z. Li, F. Xu, S. R. Kulkarni, and P. Mittal, “AIQL: Enabling efficient attack investigation from system monitoring data,” in Proceedings of the USENIX Annual Technical Conference (USENIX ATC), 2018, pp. 113–126.
- [31] M. R. Garey, R. L. Graham, and D. S. Johnson, “The complexity of computing steiner minimal trees,” Society for Industrial and Applied Mathematics (SIAM) Journal on Applied Mathematics, vol. 32, no. 4, pp. 835–859, 1977.
- [32] E. N. Gilbert and H. O. Pollak, “Steiner minimal trees,” Society for Industrial and Applied Mathematics (SIAM) Journal on Applied Mathematics, vol. 16, no. 1, pp. 1–29, 1968.
- [33] M. X. Goemans and D. P. Williamson, “A general approximation technique for constrained forest problems,” Society for Industrial and Applied Mathematics (SIAM) Journal on Computing, vol. 24, no. 2, pp. 296–317, 1995.
- [34] A. Gu, A. Gupta, and A. Kumar, “The power of deferral: Maintaining a constant-competitive steiner tree online,” in Proceedings of the Annual ACM Symposium on Theory of Computing (STOC), 2013, p. 525–534.
- [35] J. Gui, D. Li, Z. Chen, J. Rhee, X. Xiao, M. Zhang, K. Jee, Z. Li, and H. Chen, “APTrace: A responsive system for agile enterprise level causality analysis,” in Proceedings of the International Conference on Data Engineering (ICDE), 2020, pp. 1701–1712.
- [36] Z. Guo, D. Zhou, H. Lin, M. Yang, F. Long, C. Deng, C. Liu, and L. Zhou, “G2: A graph processing system for diagnosing distributed systems,” in Proceedings of the USENIX Annual Technical Conference (USENIX ATC), 2011.
- [37] X. Han, T. Pasquier, A. Bates, J. Mickens, and M. Seltzer, “Unicorn: Runtime provenance-based detector for advanced persistent threats,” in Proceedings of the Network and Distributed System Security Symposium (NDSS), 2022.
- [38] X. Han, X. Yu, T. Pasquier, D. Li, J. Rhee, J. Mickens, M. Seltzer, and H. Chen, “SIGL: Securing software installations through deep graph learning,” in Proceedings of the USENIX Security Symposium (USENIX Security), 2021, pp. 2345–2362.
- [39] N. Harvey, “CPSC 536N: Randomized algorithms,” 2011, https://www.cs.ubc.ca/ nickhar/W12/Lecture25Notes.pdf.
- [40] W. U. Hassan, A. Bates, and D. Marino, “Tactical provenance analysis for endpoint detection and response systems,” in Proceedings of the IEEE Symposium on Security and Privacy (IEEE S&P), 2020, pp. 1172–1189.
- [41] W. U. Hassan, S. Guo, D. Li, Z. Chen, K. Jee, Z. Li, and A. Bates, “Nodoze: Combatting threat alert fatigue with automated provenance triage,” in Proceedings of the Network and Distributed System Security Symposium (NDSS), 2019.
- [42] W. U. Hassan, D. Li, K. Jee, X. Yu, K. Zou, D. Wang, Z. Chen, Z. Li, J. Rhee, J. Gui, and A. Bates, “This is why we can’t cache nice things: Lightning-fast threat hunting using suspicion-based hierarchical storage,” in Proceedings of the Annual Computer Security Applications Conference (ACSAC), 2020, p. 165–178.
- [43] J. D. Herath, P. Yang, and G. Yan, “Real-Time evasion attacks against deep learning-based anomaly detection from distributed system logs,” in Proceedings of the ACM Conference on Data and Application Security and Privacy (CODASPY), 2021, p. 29–40.
- [44] J. E. Hopcroft, J. D. Ullman, and A. V. Aho, Data structures and algorithms. Addison-wesley Boston, MA, USA, 1983, vol. 175.
- [45] M. N. Hossain, S. M. Milajerdi, J. Wang, B. Eshete, R. Gjomemo, R. Sekar, S. D. Stoller, and V. N. Venkatakrishnan, “SLEUTH: real-time attack scenario reconstruction from COTS audit data,” in Proceedings of the USENIX Security Symposium (USENIX Security), 2017, pp. 487–504.
- [46] M. N. Hossain, S. Sheikhi, and R. Sekar, “Combating dependence explosion in forensic analysis using alternative tag propagation semantics,” in Proceedings of the IEEE Symposium on Security and Privacy (IEEE S&P), 2020, pp. 1139–1155.
- [47] M. N. Hossain, J. Wang, R. Sekar, and S. D. Stoller, “Dependence-Preserving data compaction for scalable forensic analysis,” in Proceedings of the USENIX Security Symposium (USENIX Security), 2018, pp. 1723–1740.
- [48] M. Hucka, “Nostril: A nonsense string evaluator written in Python,” Journal of Open Source Software, vol. 3, no. 25, p. 596, 2018.
- [49] F. K. Hwang and D. S. Richards, “Steiner tree problems,” Networks, vol. 22, no. 1, pp. 55–89, 1992.
- [50] N. Idika and A. P. Mathur, “A survey of malware detection techniques,” Purdue University, vol. 48, no. 2, pp. 32–46, 2007.
- [51] M. Imase and B. M. Waxman, “Dynamic steiner tree problem,” Society for Industrial and Applied Mathematics (SIAM) Journal on Discrete Mathematics, vol. 4, pp. 369–384, 1991.
- [52] M. Inam, Y. Chen, A. Goyal, J. Liu, J. Mink, N. Michael, S. Gaur, A. Bates, and W. U. Hassan, “SoK: History is a vast early warning system: Auditing the provenance of system intrusions,” in Proceedings of the IEEE Symposium on Security and Privacy (IEEE S&P), 2023, pp. 307–325.
- [53] P. Jiang, R. Huang, D. Li, Y. Guo, X. Chen, J. Luan, Y. Ren, and X. Hu, “Auditing frameworks need resource isolation: A systematic study on the super producer threat to system auditing and its mitigation,” in Proceedings of the USENIX Security Symposium (USENIX Security), 2023, pp. 355–372.
- [54] P. Jiang, J. Xiao, D. Li, H. Yu, Y. Bai, Y. Guo, and X. Chen, “Detecting malicious websites from the perspective of system provenance analysis,” IEEE Transactions on Dependable and Secure Computing (TDSC), 2023.
- [55] V. Karande, E. Bauman, Z. Lin, and L. Khan, “SGX-Log: Securing system logs with SGX,” in Proceedings of the ACM on Asia Conference on Computer and Communications Security (ASIA CCS), 2017, p. 19–30.
- [56] R. M. Karp, Reducibility among combinatorial problems. Springer, 2010.
- [57] Kaspersky, “Targeted cyberattacks logbook,” 2022, https://apt.securelist.com/.
- [58] K. Khan, S. U. Rehman, K. Aziz, S. Fong, and S. Sarasvady, “DBSCAN: Past, present and future,” in The fifth international conference on the applications of digital information and web technologies (ICADIWT 2014), 2014, pp. 232–238.
- [59] S. T. King and P. M. Chen, “Backtracking intrusions,” in Proceedings of the Nineteenth ACM Symposium on Operating Systems Principles (SOSP), 2003, p. 223–236.
- [60] D. P. Kingma and M. Welling, “Auto-Encoding Variational Bayes,” in Proceedings of the International Conference on Learning Representations, (ICLR), 2014.
- [61] L. Kou, G. Markowsky, and L. Berman, “A fast algorithm for steiner trees,” Acta informatica, vol. 15, pp. 141–145, 1981.
- [62] K. H. Lee, X. Zhang, and D. Xu, “LogGC: Garbage collecting audit log,” in Proceedings of the ACM SIGSAC Conference on Computer and Communications Security (CCS), 2013, p. 1005–1016.
-
[63]
L. Lenart, “S2-046,” 2017,
https://wiki.apache.org/confluence/display/
WW/S2-046. - [64] Z. Li, R. Yang, Q. A. Chen, and Y. Chen, “Poster: Mimic the whole attack chain: A first look at evasion against provenance graph based detection,” in Proceedings of the Annual Computer Security Applications Conference (ACSAC), 2020.
- [65] S. Lin, R. Clark, R. Birke, S. Schönborn, N. Trigoni, and S. Roberts, “Anomaly detection for time series using VAE-LSTM hybrid model,” in ICASSP 2020-2020 IEEE International Conference on Acoustics, Speech and Signal Processing (ICASSP), 2020, pp. 4322–4326.
- [66] F. Liu, Y. Wen, D. Zhang, X. Jiang, X. Xing, and D. Meng, “Log2vec: A heterogeneous graph embedding based approach for detecting cyber threats within enterprise,” in Proceedings of the ACM SIGSAC Conference on Computer and Communications Security (CCS), 2019, p. 1777–1794.
- [67] X. Liu, C. Yang, D. Li, Y. Zhou, S. Li, J. Chen, and Z. Chen, “Adonis: Practical and efficient control flow recovery through os-level traces,” ACM Transactions on Software Engineering and Methodology (TOSEM), 2023.
- [68] Y. Liu, M. Zhang, D. Li, K. Jee, Z. Li, Z. Wu, J. Rhee, and P. Mittal, “Towards a timely causality analysis for enterprise security.” in Proceedings of the Network and Distributed System Security Symposium (NDSS), 2018.
- [69] S. Ma, J. Zhai, Y. Kwon, K. H. Lee, X. Zhang, G. Ciocarlie, A. Gehani, V. Yegneswaran, D. Xu, and S. Jha, “Kernel-Supported Cost-Effective audit logging for causality tracking,” in Proceedings of the USENIX Annual Technical Conference (USENIX ATC), 2018, pp. 241–254.
- [70] E. Manzoor, S. M. Milajerdi, and L. Akoglu, “Fast memory-efficient anomaly detection in streaming heterogeneous graphs,” in Proceedings of the ACM SIGKDD International Conference on Knowledge Discovery and Data Mining (KDD), 2016, p. 1035–1044.
- [71] K. Mehlhorn, “A faster approximation algorithm for the steiner problem in graphs,” Information Processing Letters, vol. 27, no. 3, pp. 125–128, 1988.
- [72] N. Michael, J. Mink, J. Liu, S. Gaur, W. U. Hassan, and A. Bates, “On the forensic validity of approximated audit logs,” in Proceedings of the Annual Computer Security Applications Conference (ACSAC), 2020, pp. 189–202.
- [73] S. M. Milajerdi, B. Eshete, R. Gjomemo, and V. Venkatakrishnan, “POIROT: Aligning attack behavior with kernel audit records for cyber threat hunting,” in Proceedings of the ACM SIGSAC Conference on Computer and Communications Security (CCS), 2019, p. 1795–1812.
- [74] S. M. Milajerdi, R. Gjomemo, B. Eshete, R. Sekar, and V. Venkatakrishnan, “HOLMES: real-time APT detection through correlation of suspicious information flows,” in Proceedings of the IEEE Symposium on Security and Privacy (IEEE S&P), 2019, pp. 1137–1152.
- [75] K.-K. Muniswamy-Reddy, U. Braun, D. A. Holland, P. Macko, D. Maclean, D. Margo, M. Seltzer, and R. Smogor, “Layering in provenance systems,” in Proceedings of the USENIX Annual Technical Conference (USENIX ATC), 2009, p. 10.
- [76] D. Mutz, F. Valeur, G. Vigna, and C. Kruegel, “Anomalous system call detection,” ACM Trans. Inf. Syst. Secur., vol. 9, no. 1, p. 61–93, 2006.
- [77] J. Naor, D. Panigrahi, and M. Singh, “Online node-weighted steiner tree and related problems,” in 2011 IEEE 52nd Annual Symposium on Foundations of Computer Science, 2011, pp. 210–219.
- [78] M. Niepert, M. Ahmed, and K. Kutzkov, “Learning convolutional neural networks for graphs,” in Proceedings of the International Conference on Machine Learning (ICML), 2016, pp. 2014–2023.
- [79] Z. Niu, K. Yu, and X. Wu, “LSTM-Based vae-gan for time-series anomaly detection,” Sensors, vol. 20, no. 13, 2020.
- [80] R. Paccagnella, K. Liao, D. Tian, and A. Bates, “Logging to the danger zone: Race condition attacks and defenses on system audit frameworks,” in Proceedings of the ACM SIGSAC Conference on Computer and Communications Security (CCS), 2020, pp. 1551–1574.
- [81] A. Papachristodoulou, C. Kyrkou, and T. Theocharides, “DriveGuard: Robustification of automated driving systems with deep spatio-temporal convolutional autoencoder,” in Proceedings of the IEEE/CVF Winter Conference on Applications of Computer Vision (WACV) Workshops, 2021, pp. 107–116.
- [82] J. Park, D. Nguyen, and R. Sandhu, “A provenance-based access control model,” in Proceedings of the Annual International Conference on Privacy, Security and Trust (PST), 2012, pp. 137–144.
- [83] Redhat, “The linux audit framework,” 2017, https://github.com/linux-audit/.
- [84] G. Robins and A. Zelikovsky, “Tighter bounds for graph steiner tree approximation,” Society for Industrial and Applied Mathematics (SIAM) Journal on Discrete Mathematics, vol. 19, no. 1, pp. 122–134, 2005.
- [85] K. Satvat, R. Gjomemo, and V. Venkatakrishnan, “Extractor: Extracting attack behavior from threat reports,” in Proceedings of the IEEE European Symposium on Security and Privacy (EuroS&P), 2021, pp. 598–615.
- [86] R. Sekar, M. Bendre, D. Dhurjati, and P. Bollineni, “A fast automaton-based method for detecting anomalous program behaviors,” in Proceedings of the IEEE Symposium on Security and Privacy (IEEE S&P), 2001, pp. 144–155.
- [87] Sysdig, “Sysdig,” 2017, https://sysdig.com/.
- [88] H. Takahashi, “An approximate solution for steiner problem in graphs,” Math. Japonica, vol. 24, no. 6, pp. 573–577, 1980.
- [89] Y. Tang, D. Li, Z. Li, M. Zhang, K. Jee, X. Xiao, Z. Wu, J. Rhee, F. Xu, and Q. Li, “NodeMerge: Template based efficient data reduction for big-data causality analysis,” in Proceedings of the ACM SIGSAC Conference on Computer and Communications Security (CCS), 2018, p. 1324–1337.
- [90] P. Veličković, W. Fedus, W. L. Hamilton, P. Liò, Y. Bengio, and R. D. Hjelm, “Deep graph infomax,” in Proceedings of the International Conference on Learning Representations (ICLR), 2019.
- [91] Q. Wang, W. U. Hassan, A. Bates, and C. A. Gunter, “Fear and logging in the internet of things,” in Proceedings of the Network and Distributed System Security Symposium (NDSS), 2018.
- [92] Q. Wang, W. U. Hassan, D. Li, K. Jee, X. Yu, K. Zou, J. Rhee, Z. Chen, W. Cheng, C. A. Gunter et al., “You are what you do: Hunting stealthy malware via data provenance analysis.” in Proceedings of the Network and Distributed System Security Symposium (NDSS), 2020.
- [93] A. Wespi, M. Dacier, and H. Debar, “Intrusion detection using variable-length audit trail patterns,” in Proceedings of the International Workshop on Recent Advances in Intrusion Detection (RAID), 2000, p. 110–129.
- [94] A. Wespi, H. Debar, M. Dacier, and M. Nassehi, “Fixed- vs. variable-length patterns for detecting suspicious process behavior,” J. Comput. Secur., vol. 8, no. 2,3, p. 159–181, 2000.
- [95] J. Westbrook and D. C. K. Yan, “Greedy algorithms for the on-line steiner tree and generalized steiner problems,” in Proceedings of the Workshop on Algorithms and Data Structures (WADS), 1993, p. 622–633.
- [96] Y. Wu, A. Chen, A. Haeberlen, W. Zhou, and B. T. Loo, “Automated network repair with meta provenance,” in Proceedings of the ACM Workshop on Hot Topics in Networks (HotNets), 2015, pp. 1–7.
- [97] Y. Xie, D. Feng, Y. Hu, Y. Li, S. Sample, and D. Long, “Pagoda: A hybrid approach to enable efficient real-time provenance based intrusion detection in big data environments,” IEEE Transactions on Dependable and Secure Computing (TDSC), vol. 17, no. 6, pp. 1283–1296, 2020.
- [98] Y. Xie, Y. Wu, D. Feng, and D. Long, “P-Gaussian: Provenance-Based gaussian distribution for detecting intrusion behavior variants using high efficient and real time memory databases,” IEEE Transactions on Dependable and Secure Computing (TDSC), vol. 18, no. 6, pp. 2658–2674, 2021.
- [99] C. Xu and B. Moseley, “Learning-Augmented algorithms for online steiner tree,” in Proceedings of the AAAI Conference on Artificial Intelligence (AAAI), vol. 36, no. 8, 2022, pp. 8744–8752.
- [100] H. Xu, W. Chen, N. Zhao, Z. Li, J. Bu, Z. Li, Y. Liu, Y. Zhao, D. Pei, Y. Feng et al., “Unsupervised anomaly detection via variational auto-encoder for seasonal kpis in web applications,” in Proceedings of the World Wide Web Conference (WWW), 2018, pp. 187–196.
- [101] Z. Xu, Z. Wu, Z. Li, K. Jee, J. Rhee, X. Xiao, F. Xu, H. Wang, and G. Jiang, “High fidelity data reduction for big data security dependency analyses,” in Proceedings of the ACM SIGSAC Conference on Computer and Communications Security (CCS), 2016, p. 504–516.
- [102] D. Yang, B. Li, L. Rettig, and P. Cudré-Mauroux, “HistoSketch: Fast similarity-preserving sketching of streaming histograms with concept drift,” in 2017 IEEE International Conference on Data Mining (ICDM), 2017, pp. 545–554.
- [103] A. Zelikovsky, “Better approximation bounds for the network and euclidean steiner tree problems,” Tech. Rep., 1996.
- [104] A. Z. Zelikovsky, “A faster approximation algorithm for the steiner tree problem in graphs,” Information Processing Letters, vol. 46, no. 2, pp. 79–83, 1993.
- [105] J. Zeng, Z. L. Chua, Y. Chen, K. Ji, Z. Liang, and J. Mao, “Watson: Abstracting behaviors from audit logs via aggregation of contextual semantics,” in Proceedings of the Network and Distributed System Security Symposium (NDSS), 2021.
- [106] J. Zengy, X. Wang, J. Liu, Y. Chen, Z. Liang, T.-S. Chua, and Z. L. Chua, “ShadeWatcher: Recommendation-guided cyber threat analysis using system audit records,” in Proceedings of the IEEE Symposium on Security and Privacy (IEEE S&P), 2022, pp. 489–506.
- [107] S.-s. Zhang, J.-w. Liu, X. Zuo, R.-k. Lu, and S.-m. Lian, “Online deep learning based on auto-encoder,” Applied Intelligence, vol. 51, no. 8, pp. 5420–5439, 2021.
- [108] Y. Zhang, Z. Lu, and S. Wang, “Unsupervised feature selection via transformed auto-encoder,” Knowledge-Based Systems, vol. 215, p. 106748, 2021.
- [109] Y. Zhou, X. Liang, W. Zhang, L. Zhang, and X. Song, “VAE-based deep svdd for anomaly detection,” Neurocomputing, vol. 453, pp. 131–140, 2021.