reception date \Acceptedacception date \Publishedpublication date
ISM: abundances 1 — ISM: clouds2 —SM: individual (Sagittarius B2)3 — ISM: molecules4 — radio lines: ISM5
Tentative detection of cyanoformamide NCCONH2 in space
Abstract
The peptide-like molecules, cyanoformamide (NCCONH2), is the cyano (CN) derivative of formamide (NH2CHO). It is known to play a role in the synthesis of nucleic acid precursors under prebiotic conditions. In this paper, we present a tentative detection of NCCONH2 in the interstellar medium (ISM) with the Atacama Large Millimeter/submillimeter Array (ALMA) archive data. Ten unblended lines of NCCONH2 were seen around 3 noise levels toward Sagittarius B2(N1E), a position that is slightly offset from the continuum peak. The column density of NCCONH2 was estimated to be 2.4cm-2, and the fractional abundance of NCCONH2 toward Sgr B2(N1E) was . The abundance ratio between NCCONH2 and NH2CHO is estimated to be 0.01. We also searched for other peptide-like molecules toward Sgr B2(N1E). The abundances of NH2CHO, CH3NCO and CH3NHCHO toward Sgr B2(N1E) were about one tenth of those toward Sgr B2(N1S), while the abundances of CH3CONH2 was only one twentieth of that toward Sgr B2(N1S).
1 Introduction
Peptide bonds, -NHCO-, are bridges that connect amino acids to form proteins, which are the basis of life on Earth (Kaiser et al., 2013). Studies of molecules with peptide-like bonds are thus important for our understanding of the origin of life (Halfen et al., 2011; Belloche et al., 2017). A number of peptide-like molecules have been detected in space. Formamide (NH2CHO), which is a potential precursor of various organic compounds essential to life (López-Sepulcre et al., 2019), was the first peptide-like molecule detected in space. Rubin et al. (1971) reported the detection of formamide in Sagittarius B2 (hereafter Sgr B2) with the 140-foot telescope of the National Radio Astronomy Observatory (NRAO). After that, formamide was detected in a number of massive star-forming regions, including Orion KL (Turner, 1989, 1991), W3(H2O) (Bisschop et al., 2007), and W51e1/e2 (Suzuki et al., 2018) and so on. It was also found in some solar-mass protostellar cores, including the well-studied protobinary IRAS 16293-1622 (Coutens et al., 2016), the protostellar shock region L1157-B1 (Mendoza et al., 2014) and so on. Formamide was also detected in the gas and ices of some comets (Altwegg et al., 2017). The next peptide-like molecule, acetamide (CH3CONH2), was also first detected toward Sgr B2(N) (Hollis et al., 2006; Halfen et al., 2011), and later detected in more high-mass star forming regions (Ligterink et al., 2020; Colzi et al., 2021). N-methylformamide (CH3NHCHO), the isomer of acetamide, was detected towards Sgr B2(n1S), NGC 6334I, G31.41+0.31 and so on (Belloche et al., 2017, 2019; Ligterink et al., 2020; Colzi et al., 2021; Zeng et al., 2023). Urea (NH2C(O)NH2), were first identified toward Sgr B2(N) with the ALMA (Belloche et al., 2017, 2019), and later detected in molecular cloud G+0.693-0.027 in the Sgr B2 complex (Jiménez-Serra et al., 2020). In addition, propionamide C2H5CONH2 was tentatively detected toward Sgr B2(N1E) (Li et al., 2021). These observations suggest that peptide-like molecules might be widespread in space.
The organic species cyanoformamide (NCCONH2) is the cyano (CN) derivative of formamide (NH2CHO), a known interstellar molecule with a role in the synthesis of nucleic acid precursors under prebiotic conditions (Winnewisser et al., 2005). Cyanoformamide could form from the reaction between CN and formamide (Winnewisser et al., 2005). As both CN and formamide are observed to be abundant in the ISM, cyanoformamide is expected to be detectable in the ISM (Winnewisser et al., 2005). At room temperature and normal terrestrial pressure, this molecule is rather unstable. The microwave and millimeter-wave spectrum of the gas-phase species was not studied until 2005 (Christiansen, 2005; Winnewisser et al., 2005). Recently, Colzi et al. (2021) searched cyanoformamide toward hot core G31.41+0.31 but got a negative result.
Sgr B2, the giant molecular cloud located in the Galactic central region, is the most massive star-forming region in the Galaxy. It has long been regarded as the best hunting grounds for complex organic molecules (COMs) due to the extraordinary molecular richness (Belloche et al., 2013; Li et al., 2017, 2020). Most O-bearing COMs were first detected toward Sgr B2 (McGuire, 2018, 2022), such as the branched molecule i-C3H7CN (Belloche et al., 2014) and the chiral molecule CH3CHCH2O (McGuire et al., 2016). There are two main sites of star formation regions in Sgr B2, namely Sgr B2(N) and Sgr B2(M), both of which host several dense, compact, hot cores that are rich in COMs (Bonfand et al., 2017). Recently, Li et al. (2021) found evidence for the possible presence of C2H5CONH2, the largest peptide-like molecule, toward Sgr B2(N1E), suggesting that peptide-like molecules are abundant in this region.
In this paper, we present a tentative detection of NCCONH2 toward Sgr B2(N1E). Section 2 introduces the observations and data reduction. Section 3 presents the observational results. Section 4 discusses the observing results and possible formation mechanisms of NCCONH2. The summary of the work is presented in Section 5.
2 OBSERVATIONS AND DATA REDUCTION
The data used for this study were acquired from the ALMA Science archive of the ReMoCA survey (Re-exploring Molecular Complexity with ALMA) (Belloche et al., 2019). The ReMoCA survey was conducted with ALMA during Cycle 4 between 2016 and 2017. Detailed description about the observations is presented in Belloche et al. (2019). This is a compete spectral line survey toward Sgr B2(N) covering from 84.1 to 114.4 GHz. Five spectral setups were used in total. The on-source time for each frequency windows range from 47 to 50 minutes. The spectral resolution is 0.488 MHz, which corresponds to a velocity resolution of 1.3-1.7 km s-1 across the observing band. The phase center of the observations is , , which locates half way between the two main hot molecular hot cores Sgr B2(N1) and N2.
Our data reduction procedure has been introduced in Li et al. (2021). The data was calibrated using the standard ALMA data calibration pipeline with the Common Astronomy Software Applications package (CASA). CASA version 4.7.0-1 was used for the first spectral setup, while CASA version 4.7.2 was used for the other four spectral setups. The CASA version 5.6.1-8 was used to image the calibrated data. The quasar J1924-2914 was used to calibrate the bandpass for most of the data, while the quasar J1517-2422 was used to calibrate the bandpass for on execution in the second spectral setup. Quasars J1924-2914 or J1733-1304 were used to derive the absolute flux density scale. The quasar J1744-3116 was used to calibrate the phase and amplitude. The TCLEAN deconvolution algorithm in CASA was used to produce the images. Self-calibration is known to introduce artificial features into imaging by including manually chosen clean components if the structure of the target is complicated (i.e., if it is not a simple point source). Sgr B2(N) has complicated substructures (Bonfand et al., 2017; Belloche et al., 2019), therefore, self-calibration will likely introduce artifacts into images, which may affect spectral line identification, especially for the weak lines in our case. We did not perform self-calibration, but still achieved a sufficiently high imaging rms of 0.4 1 mJy beam-1, which is not much higher than that in Belloche et al. (2019). Therefore, we believe that this strategy is suitable for our purpose of identification of weak lines.
Because of high number of spectral lines detected toward hot cores in Sgr B2, the determination of baseline is challenging. As pointed out by Sánchez-Monge et al. (2018), a broad frequency coverage is necessary to ensure the presence of enough line-free frequency intervals to determine the continuum level. They think that a bandwidth of at least 1 GHz is needed. Sánchez-Monge et al. (2018) have simulated spectra that dominated by emission features, and eight methods were used to determine the continuum level of the spectra. We could see from Table 1 in Sánchez-Monge et al. (2018) that all the method over-estimated the rms noise levels by 2% to 113%. We could see from Figure 1(b) in Sánchez-Monge et al. (2018) that the continuum level of the spectra could be better determined with several groups of lowest values in the spectra after masking absorption lines. We first compared with spectra toward HII regions to mask absorption lines, then we chose several groups of lowest values to determine the continuum levels. This could properly determine the continuum levels for spectra dominated by emission lines.
The rms noise levels for the spectra window were determined using the median values of channel maps. We first investigated the rms noise levels in regions without either continuum emission or molecular lines. Then we investigated the rms noise level in regions with strong continuum emission, which are significantly larger than rms noise levels in regions without either molecular lines or continuum emission. The median values of rms noise levels were adopted in this paper.
3 RESULTS
3.1 Identification of NCCONH2
Weeds in Gildas package was used for line identification and spectral modeling. The Jet Population Laboratory (JPL) (Pickett et al., 1998) and the Cologne Database for Molecular Spectroscopy (CDMS) (Müller et al., 2005; Endres et al., 2016) databases were used. The microwave and millimeter-wave spectrum of NCCONH2 was reported by Christiansen (2005) and Winnewisser et al. (2005). The 3-mm emission of NCCONH2 is modeled assuming LTE conditions with five parameters: column density, temperature, source size, velocity offset, and linewidth. Each spectral window of each observed setup was modeled separately to account for the varying angular resolution, but with a same set of parameters.
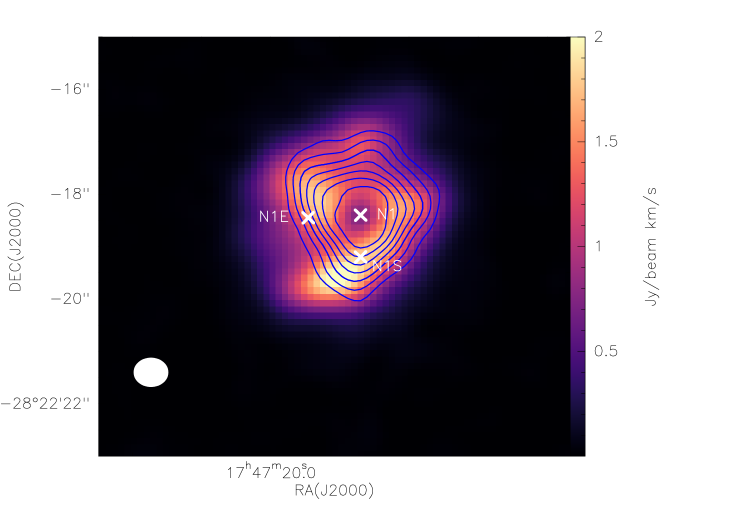
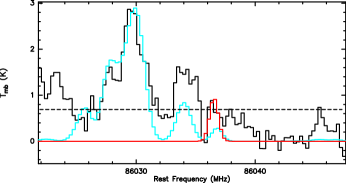
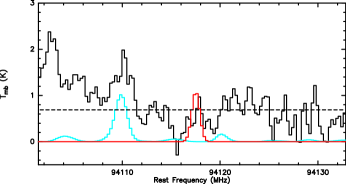
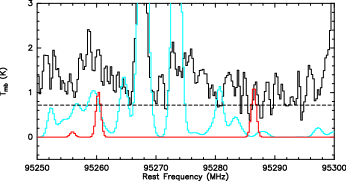
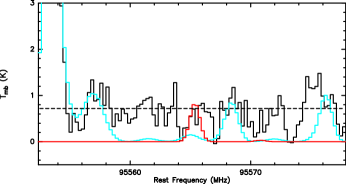
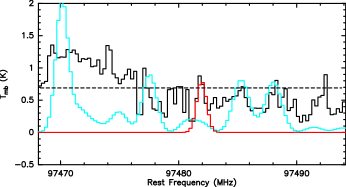
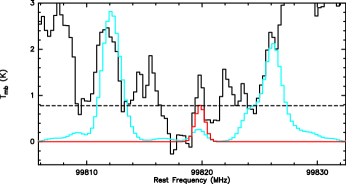
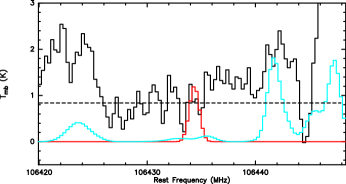
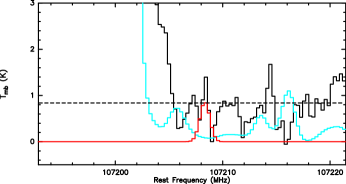
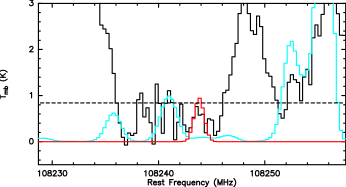
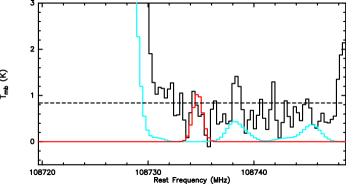
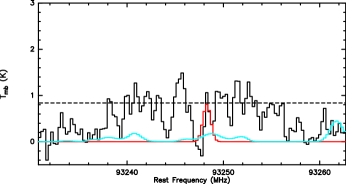
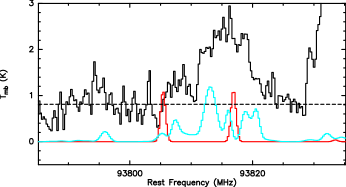
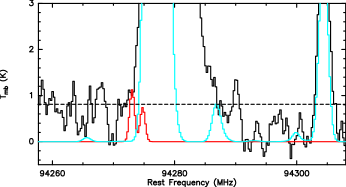
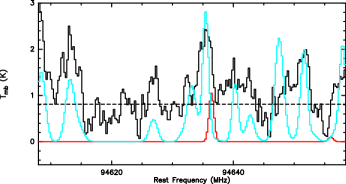
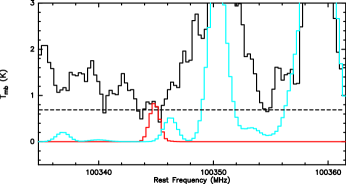
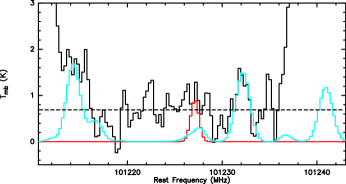
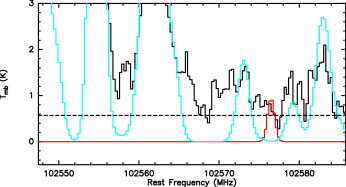
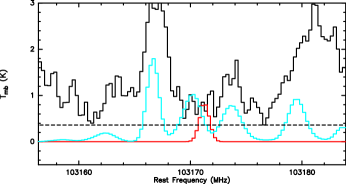
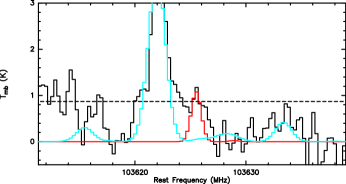
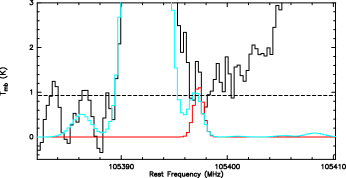
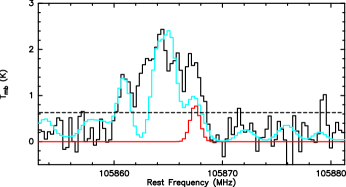
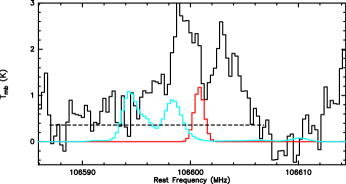
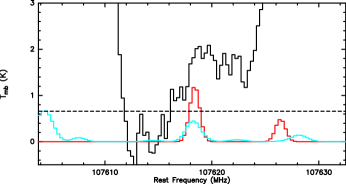
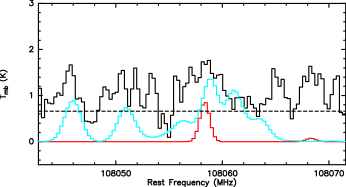
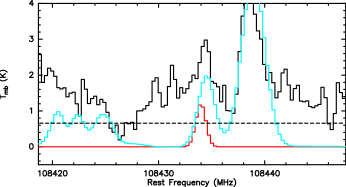
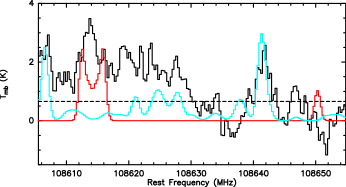
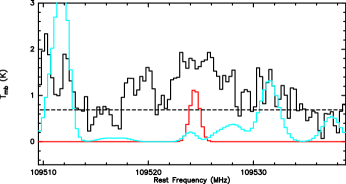
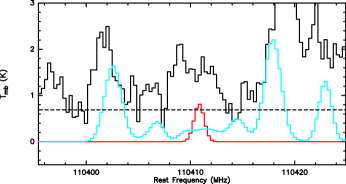
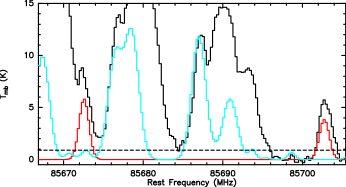
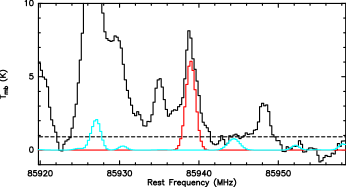
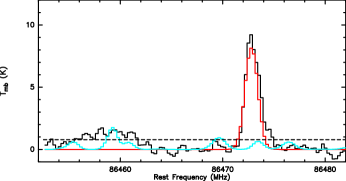
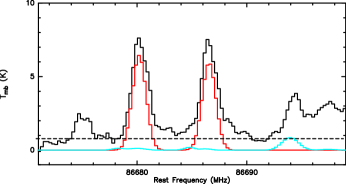
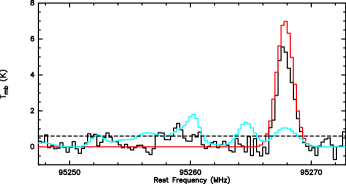
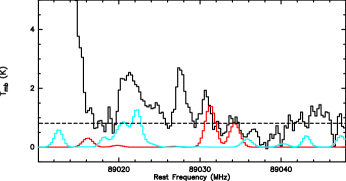
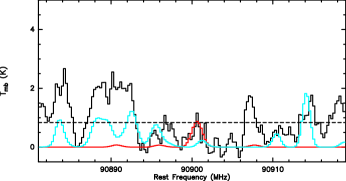
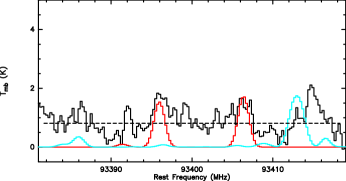
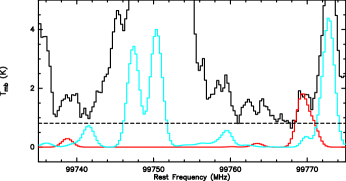
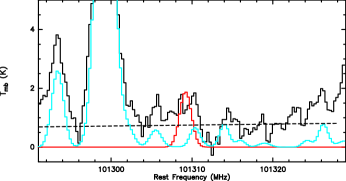
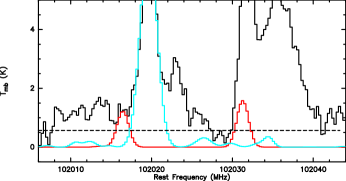
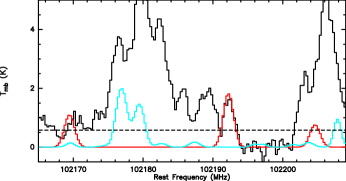
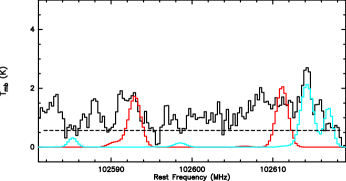
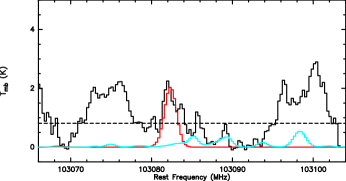
Approximately 120 NCCONH2 lines were expected to be seen in the observed frequency ranges. Ten unblended transitions, and 21 partially blended transitions of NCCONH2 were possibly seen toward Sgr B2(N1E) (Figure 1), which is about 1.5′′ to the east of the hot core Sgr B2(N1). However, since their signal-to-noise levels are around 3, it is not possible to claim secure detection of NCCONH2 with these data. The large peptide-like molecule, propionamide has been tentatively found to be relatively abundant toward Sgr B2(N1E) (Li et al., 2021). We also searched for NCCONH2 toward other regions of Sgr B2(N1). However, serious line-blending prevents detection of this molecule toward other directions. The tentatively detected lines are presented in Figures 2 and 3, and Table 1. Though the remaining 90 lines that match the considered frequency range and noise level threshold are contaminated by those of other species, the observed results do not contradict with the expected intensities. In Figure 2, the black dashed lines show the 3 noise levels adopted in Section 2.
Because of low abundance of NCCONH2 and serious line blending in Sgr B2(N1), all of these unblended lines detected toward Sgr B2(N1E) suffer from line blending toward other directions. Thus we could not get the spatial distribution of NCCONH2 in Sgr B2(N1).
3.2 Search of related molecules toward Sgr B2(N1E)
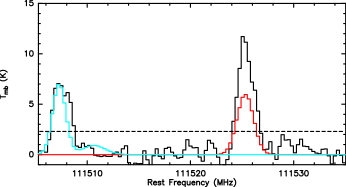
Some related molecules were also searched toward Sgr B2(N1E). Based on observing results of Belloche et al. (2019), we searched for nine relatively clean and strong transitions of CH3NCO v=0 toward Sgr B2(N1E). The CDMS database is used for the identification. Nine clean lines were detected. As nine lines are enough for the detection and modelling of molecule in Sgr B2, we did not search for all the CH3NCO v=0 toward Sgr B2(N1E). The spectra were shown in Figure 4. The intensity of CH3NCO lines toward Sgr B2(N1E) were weaker than those toward Sgr B2(N1S) (See Figure A.6 in Belloche et al. (2019)).
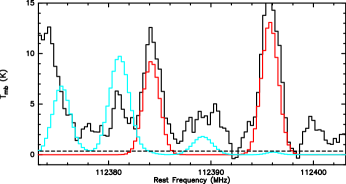
Thirteen relatively clean and strong transitions of CH3NHCHO v=0 were searched toward Sgr B2(N1E). The Lille Spectrascopic Database (https://lsd.univ-lille.fr/) is used for the identification. All of these lines were detected. The spectra were shown in Figure 5. The intensity of CH3NHCHO lines toward Sgr B2(N1E) were significantly weaker than those toward Sgr B2(N1S) (See Figure A.3 in Belloche et al. (2019)).
We also searched for urea (NH2CONH2) toward Sgr B2(N1E). To our knowledge, this molecule was only detected toward Sgr B2(N1S) (Belloche et al., 2019) and G+0.693-0.027 (Jiménez-Serra et al., 2020), a molecular cloud located in the Sgr B2 complex. It was tentatively detected toward NGC6334I(Ligterink et al., 2020). Based on observing results of Belloche et al. (2019), we searched for four clean and strong NH2CONH2 v=0 transitions toward Sgr B2(N1E). Unfortunately, all of these lines blend seriously with other molecules.
3.3 Column densities of NCCONH2 and related molecules
The column densities of NCCONH2 and related molecules are obtained by eye-fitting the spectra in Weeds. The physical size of the emission region is hard to determine, as the morphology of molecules in Sgr B2(N1) does not simply follow a 2D Gaussian profile (Busch et al., 2022). The emitting size was assumed to be 2.3\arcsec, thus the beam filling factor is 1. With a linewidth measurement of 3.0 km s-1, and an assumption of excitation temperature of 150 K (which is very close to what was obtained for molecules toward Sgr B2(N1S) by Belloche et al. (2019), the column density and centroid velocity are varied to fit the detected transitions. In this way, a column density of cm-2 was obtained for cyanoformamide (see Table 2). By adopting the H2 column density of 3.5 cm-2 derived with C18O (Li et al., 2021), the abundance relative to H2 was estimated to be for NCCONH2.
We also modeled the emission of CH3NCO and CH3NHCHO toward Sgr B2(N1E) with the same size and excitation temperature (see Table 2). A column density of 2.4 cm-2 was obtained for CH3NCO. A column density of cm-2 was obtained for CH3NHCHO.
Based on the estimated column density of NCCONH2 toward Sgr B2(N1E), the abundance ratio between NCCONH2 and formamide is found to be 0.01. This value is consistent with result in Colzi et al. (2021). They found that the abundance ratio of NCCONH2 to formamide was lower than 0.05 in G31.41+0.31.
4 DISCUSSION
4.1 Comparison of Sgr B2(N1E) and Sgr B2(N1S)
Sgr B2(N1S) is a position that is about 1\arcsecto the south of Sgr B2(N1) (see Figure 1, also see Figs. 2 and 3 in Belloche et al. (2019)), while Sgr B2(N1E) is about 1.5\arcsec to the east of Sgr B2(N1) (see Figure 1, also see Figure 2 in Li et al. (2021)). As Sgr B2(N1E) is on the edge of hot core, the excitation temperature and column density should be lower than those toward Sgr B2(N1S).
All the peptide-like molecules detected toward Sgr B2(N1S) were also detected toward Sgr B2(N1E). Table 2 presents the column densities obtained for peptide-like molecules toward Sgr B2(N1E). We compared these results with those of Sgr B2(N1S) presented in Belloche et al. (2019). The abundances of NH2CHO, CH3NCO and CH3NHCHO toward Sgr B2(N1E) were about one tenth of those toward Sgr B2(N1S). The abundance ratio of CH3NCO to NH2CHO, was 0.086 toward Sgr B2(N1E), which is in agreement with that of Sgr B2(N1S) (Belloche et al., 2019). However, the abundances of CH3CONH2 toward Sgr B2(N1E) was only one twentieth of those toward Sgr B2(N1S). A possible explanation for the low abundance of CH3CONH2 and undetection of NH2CONH2 is that the desorption energy required by CH3CONH2 and NH2CONH2 are higher in comparison with NH2CHO, CH3NCO and CH3NHCHO. According to laboratory studies in Ligterink et al. (2018), the desorption peak of NH2CONH2 is 265 K, while the desorption peak of NH2CHO is 210 K, and the desorption peak of CH3CONH2 is 219 K. In this case, both CH3CONH2 and NH2CONH2 may not efficiently desorb into gas phase, which is consistent with results present here. It is noted that the derived rotational temperature of NH2CONH2 toward Sg B2(N1S) seems to be higher than other molecules (see Table 5 in Belloche et al. (2019)), while the rotational temperature of CH3CONH2 is also higher than NH2CHO, CH3NCO and CH3NHCHO (Belloche et al., 2019). We did not search for C2H5CONH2 and NCCONH2 toward Sgr B2(N1S) because of serious line blending from other molecules.
4.2 Possible formation mechanism for interstellar cyanoformamide
The formation of NCCONH2 in the ISM is yet unclear. Winnewisser et al. (2005) proposed that NCCONH2 could form from the formamide and CN:
| (1) |
We ran quantum chemical calculations to further study this reaction. The structures of all the species studied in this work (reactants, intermediates, transition states, and products) were first optimized in the framework of the density functional theory (DFT) employing the M06-2X (Zhao & Truhlar, 2008) in conjunction with the 6-311+G(d,p) basis set (Ditchfield, Hehre, & Pople, 1971), from which rotational constants, harmonic vibrational frequencies, and zero-point energies(ZPEs) were obtained. High-performance single point energies were also calculated at the M06-2X/aug-cc-pVTZ (Dunning, 1989) level using the M06-2X structures. All quantum chemical calculations were run with the Gaussian 16 (Frisch et al., 2016).
NH2CHO molecule has several spots that could be attacked by the CN radical: the N, C, and O atoms. Therefore, besides Reaction (1), the following reactions might be also possible. Thus, we ran quantum mechanical calculations to evaluate these two reactions.
| (2) |
| (3) |
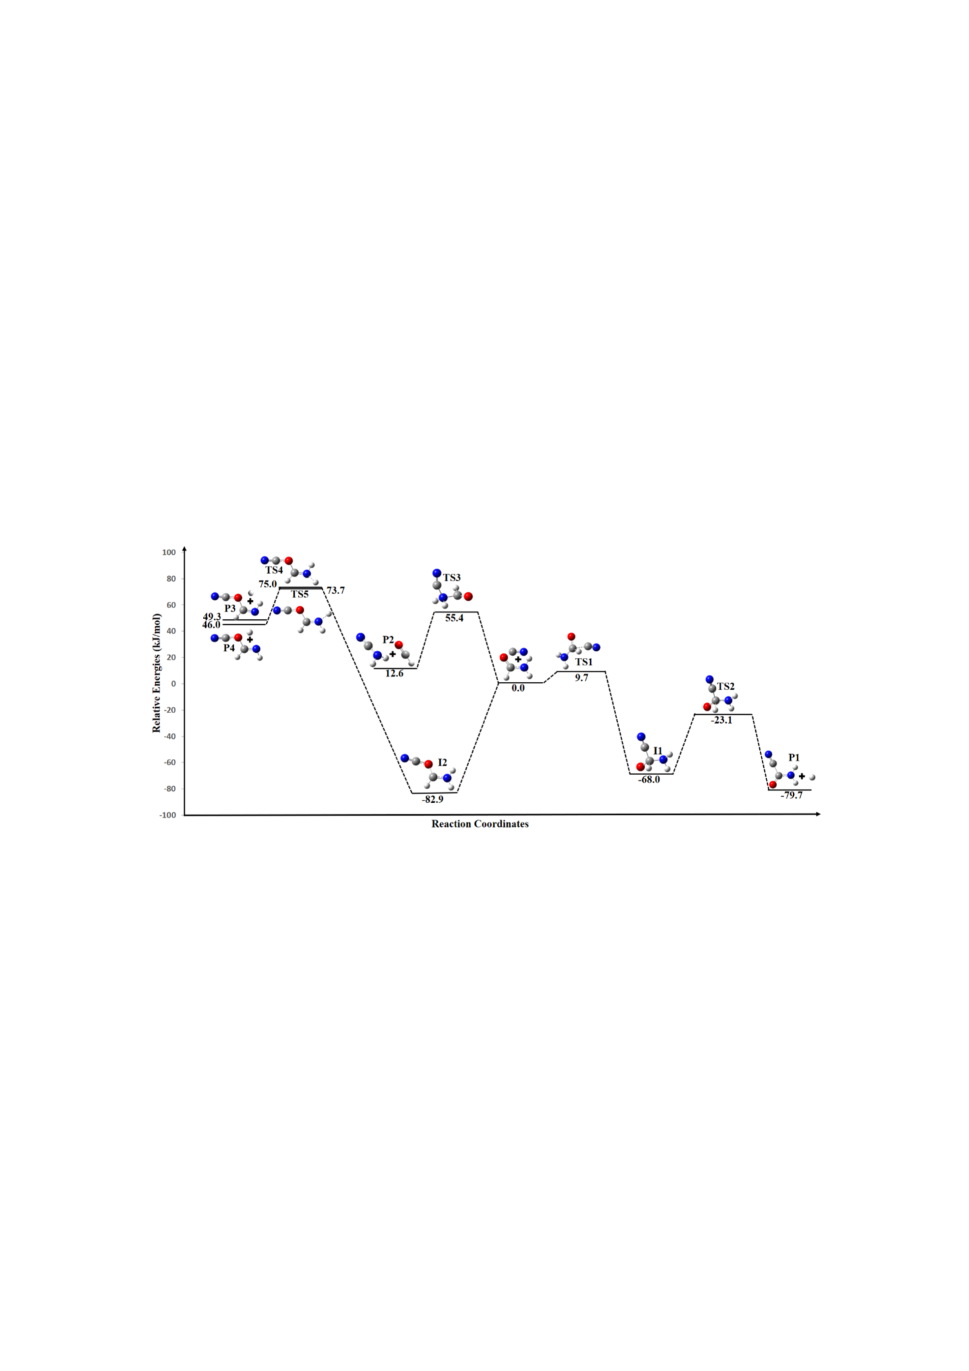
A schematic of the full PES for the reaction between CN and NH2CHO can be seen in Figure 6. Reaction (1) may initially proceed via the formation of intermediate I1 (NH2C(O)HCN) via transition state TS1. Then the intermediate II is linked to the formation of the products P1 (NH2COCN + H) via transition state TS2, as this involves the elimination of an H-atom. The reaction is exothermic. The barrier energy of this reaction is equal to the energy of transition state minus the energy of the two reactants, which is 9.7 kJ/mol (=1,167 K). We have calculated the rate coefficients of Reaction (1) by the modified Arrhenius equation. The rate coefficients are and cm3 s-1 at T = 150 and 200 K, respectively. This means that the exothermic formation reaction (1) is slow in the gas-phase. Reaction (2) is via transition state TS3 to form products P2 (NH2CN + HCO), and Reaction (3) firstly form the intermediate I2 (NH2C(H)OCN), then via transition state TS4 and TS5 to form two products P3 (cis-NCOCHNH + H) and P4 (trans-NCOCHNH + H), respectively. As Figure 6 shows, both reactions (2) and (3) are endothermic with high barriers (55 kJ/mol). Their rates would be very low under the ISM conditions.
Besides, we propose another possible reaction route of NCCONH2, where it might be formed upon recombination of two free radicals on the grain surface at low temperature as the following:
| (4) |
The radical NH2CO can be formed by CN with water molecules of the ice mantle as reported by Rimola et al. (2018).
5 CONCLUSIONS
In this paper, we present the tentative detection of NCCONH2 in ISM for the first time. The main results are summarized as follows:
1. Ten unblended transitions, and twenty one partially-blended transition of NCCONH2 were detected around 3 noise levels toward Sgr B2(N1E) with the ALMA archive data at 3-mm wavelength.
2. The column density of NCCONH2 toward Sgr B2(N1E) was estimated to be cm-2, while the abundance relative to H2 was estimated to be . The abundance ratio of NCCONH2 to formamide is 0.01.
3. Some related molecules were also searched toward Sgr B2(N1E). Both CH3NCO and CH3NHCHO were detected. The abundance ratio between NH2CHO, CH3NCO and CH3NHCHO toward Sgr B2(N1E) is same to that toward Sgr B2(N1S), while the abundance of CH3CONH2 toward Sgr B2(N1E) was much lower than those toward Sgr B2(N1S).
It is highly desirable to conduct confirmation observations on the existence of NCCONH2 in space.
ACKNOWLEDGEMENTS
We thank the referee, for his/her critical reading of the paper, and very constructive suggestions and comments of our work. JL would like to thank Dr. Laura Colzi for suggestions about this work. JL thank Prof. Vadim Illyushin, Roman Motiyenko, Laurent Margules and Yong Zhang for helpful discussions. This work made use of the High Performance Computing Resource in the Core Facility for Advanced Research Computing at Shanghai Astronomical Observatory. This work has been supported by the National Key R&D Program of China (No. 2022YFA1603101), the National Natural Science Foundation of China (Grant Nos. 11973075, U1931104), Chongqing Talents: Exceptional Young Talents Project (Grant No. cstc2021ycjh-bgzxm0027), and Fundamental Research Funds for the Central Universities (Grant No. 2020CDJXZ002). This paper makes use of the following ALMA data: ADS/JAO.ALMA#2016.1.00243.S. ALMA is a partnership of ESO (representing its member states), NSF (USA) and NINS (Japan), together with NRC (Canada), MOST and ASIAA (Taiwan), and KASI (Republic of Korea), in cooperation with the Republic of Chile. The Joint ALMA Observatory is operated by ESO, AUI/NRAO and NAOJ. Data analysis was in part carried out on the open-use data analysis computer system at the Astronomy Data Center (ADC) of NAOJ. This research has made use of NASA’s Astrophysics Data System.
| Number | Rest Freq. | Transition | |||
|---|---|---|---|---|---|
| (MHz) | (K) | (s-1) | (D2) | ||
| unblended lines | |||||
| (1) | 86036.25670(0.0053) | 20(5, 16) - 20(4, 17) | 85.0 | -4.665 | 119.7 |
| (2) | 94117.1956(0.0059) | 19(7, 13)- 19(6, 14) | 86.3 | -4.505 | 125.6 |
| (3) | 95286.1509(.0053) | 23(7, 17)-23(6, 18) | 117.7 | -4.4649 | 160.0 |
| (4) | 95565.0503(.0061) | 20(4,17) - 20(3, 18) | 80.9 | -4.645 | 91.5 |
| (5) | 97481.6183(.0068) | 13(7, 6) - 13(6, 7) | 50.4 | -4.553 | 70.027 |
| (6) | 99819.5119(0.0082) | 35(8, 27)-35(7, 28) | 256.7 | -4.359 | 268.3 |
| (7) | 106434.0041(0.0058) | 24(8,17) - 24(7, 18) | 131.6 | -4.326 | 164.9 |
| (8) | 107207.9828(0.0067) | 22(3, 19)-22( 2, 20) | 95.7 | -4.534 | 91.8 |
| (9) | 108243.4630(0.0056) | 15(3, 13) - 14(3, 12) | 45.7 | -4.465 | 71.9 |
| (10) | 108734.3241(0.0057) | 16(1,15) - 15(1, 14) | 47.3 | -4.449 | 78.4 |
| partially blended lines | |||||
| (1) | 93247.9712(0.0064) | 20(3, 17)-20(2, 18) | 80.7 | -4.675 | 91.8 |
| (2) | 93805.0949(0.0057) | 20(7, 14)-20(6,15) | 93.5 | -4.500 | 134.9 |
| (3) | 94272.7316(0.0054) | 22(7, 16)-22(6, 17) | 109.3 | -4.481 | 152.4 |
| (4) | 94636.0867(0.0061) | 18(7, 12)-18(6, 13) | 79.4 | -4.509 | 116.2 |
| (5) | 100344.5329(0.0066) | 21( 3, 18)-21(2,19) | 88.1 | -4.600 | 91.8 |
| (6) | 101226.7711(0.0082) | 32(7, 25)-32(6, 26) | 214.0 | -4.375 | 226.9 |
| (7) | 102576.1442(0.0056) | 15(1,14)-14(1,13) | 42.1 | -4.527 | 73.4 |
| (8) | 103170.9109(0.0053) | 13(3,10)-12(3, 9) | 37.2 | -4.529 | 62.5 |
| (9) | 103625.1683(0.0058) | 25(6, 20) - 25(5, 21) | 130.9 | -4.414 | 151.9 |
| (10) | 105396.9363(0.0055) | 15(2,13)-14(3,12) | 45.6 | -4.407 | 89.2 |
| (11) | 105867.1182(0.0054) | 14(5,10)-13(5, 9) | 46.9 | -4.531 | 61.9 |
| (12) | 106600.4540(0.0057) | 26(8,19)-26(7, 20) | 150.3 | -4.313 | 182.9 |
| (13) | 107618.0350(0.006) | 22(8,15)-22(7,16) | 114.4 | -4.328 | 145.6 |
| (14) | 108057.9882(0.0066) | 22(4,19)-22(3, 20) | 95.8 | -4.524 | 91.7 |
| (15) | 108433.6177(0.0061) | 21(8,14)-21(7,15) | 106.4 | -4.329 | 136.0 |
| (16) | 108612.1374(0.0058) | 17(0,17)-16(1,16) | 48.1 | -4.106 | 183.8 |
| (17) | 108613.2479(0.0058) | 17(1,17)-16(1,16) | 48.1 | -4.440 | 85.1 |
| (18) | 108614.3824(0.0058) | 17(0,17)-16(0,16) | 48.1 | -4.440 | 85.1 |
| (19) | 108615.4928(0.0058) | 17(1,17)-16(0,16) | 48.1 | -4.106 | 183.9 |
| (20) | 109524.0529(0.0065) | 19(8, 11)-19(7,12) | 91.5 | -4.338 | 117.0 |
| (21) | 110410.4446(0.0085) | 36(8, 28)-36(7, 29) | 270.4 | -4.252 | 260.6 |
Notes. Col. (2): Rest frequencies with calculated uncertainties given in parentheses; Col. (3): Transition; Col. (4): Upper level energy; Col. (5): Base 10 logarithm of the Einstein coefficient; Col. (6): Line strength .
| Molecule | Size | |||||
|---|---|---|---|---|---|---|
| (”) | (K) | () | () | () | () | |
| NCCONH2, v=0 | 2.3 | 150 | 2.4(15) | 3 | -1 | - |
| CH3NCO | 2.3 | 150 | 2.4(16) | 5 | 0 | 2.5(17) |
| HCONH2, v=0∗ | 2.3 | 150 | 2.8(17) | 6 | -1 | 2.9(18) |
| CH3CONH2, v=0∗ | 2.3 | 150 | 2.5(16) | 3.6 | -1 | 4.1(17) |
| CH3NHCHO, v=0 | 2.3 | 150 | 2.1(16) | 5 | 0 | 2.6(17) |
Notes. Col. (1): Molecule name; Col. (2): Source diameter (FWHM), Col. (3): Rotational temperature; Col. (4): Total column density of the molecule. x(y) means ; Col. (5): Linewidth (FWHM); Col. (6): Velocity offset with respect to the assumed systemic velocity of Sgr B2(N1), km s-1; Col (7): column density of the molecule toward Sgr B2(N1S) (Belloche et al., 2019). ∗: cited from Li et al. (2021). ∗∗: cited from Belloche et al. (2019).
References
- Altwegg et al. (2017) Altwegg, K., Balsiger, H., Berthelier, J. J., et al. 2017, MNRAS, 469, S130. doi:10.1093/mnras/stx1415
- Belloche et al. (2013) Belloche, A., Müller, H. S. P., Menten, K. M., et al. 2013, A&A, 559, A47. doi:10.1051/0004-6361/201321096
- Belloche et al. (2014) Belloche, A., Garrod, R.T., Holger, S.P., Müller, H. S. P., Menten, K. M., 2014, Science, 345, 1584. doi:10.1126/science.1256678
- Belloche et al. (2016) Belloche, A., Müller, H. S. P., Garrod, R. T., et al. 2016, A&A, 587, A91. doi:10.1051/0004-6361/201527268
- Belloche et al. (2017) Belloche, A., Meshcheryakov, A. A., Garrod, R. T., et al. 2017, A&A, 601, A49. doi:10.1051/0004-6361/201629724
- Belloche et al. (2019) Belloche, A., Garrod, R. T., Müller, H. S. P., et al. 2019, A&A, 628, A10. doi:10.1051/0004-6361/201935428
- Bisschop et al. (2007) Bisschop, S. E., Jørgensen, J. K., vn Dishoeck, E. F., de Wachter, E. B. M. 2007, A&A, 465, 913. doi:10.1051/0004-6361:20065963
- Bonfand et al. (2017) Bonfand, M., Belloche, A., Menten, K. M., et al. 2017, A&A, 604, A60. doi:10.1051/0004-6361/201730648
- Busch et al. (2022) Busch, L.A., Belloche, A., Garrod, R.T., et al. 2022, A&A, 665, 96. doi:10.1051/0004-6361/202243383
- Christiansen (2005) Christiansen, J. J. 2005, Journal of Molecular Spectroscopy, 231, 131. doi:10.1016/j.jms.2005.01.004
- Colzi et al. (2021) Colzi, L., Rivilla, V. M., Beltrán, M. T., et al. 2021, A&A, 653, A129. doi:10.1051/0004-6361/202141573
- Coutens et al. (2016) Coutens, A., Jørgensen, J. K., van der Wiel, M. H. D. et al. 2016, A&A, 590, L6, doi: 10.1051/0004-6361/201628612
- Ditchfield, Hehre, & Pople (1971) Ditchfield R., Hehre, W.J., Pople, J.A., 1971, J Chem Phys, 54, 724. doi:10.1063/1.1674902
- Dunning (1989) Dunning, T.H.J., 1989, J. Chem. Phys., 90, 1007. doi: 10.1063/1.456153
- Endres et al. (2016) Endres, C. P., Schlemmer, S., Schilke, P., Stutzki, J., Ml̆ler, H. S. P., 2016, J. Mol. Spectrosc., 327, 95. doi:10.1016/j.jms.2016.03.005
- Frisch et al. (2016) Frisch, M. J., Trucks, G. W., Schlegel, H. B., et al. 2016, Gaussian 16, Revision A.03 (Wallingford, CT: Gaussian, Inc.)
- Halfen et al. (2011) Halfen, D. T., Ilyushin, V., & Ziurys, L. M. 2011, ApJ, 743, 60. doi:10.1088/0004-637X/743/1/60
- Hollis et al. (2006) Hollis, J. M., Lovas, F. J., Remijan, A. J., et al. 2006, ApJ, 643, L25. doi:10.1086/505110
- Jiménez-Serra et al. (2020) J Jiménez-Serra, I., Martín-Pintado, J., Rivilla, V. M., et al. 2020, Astrobiology, 20, 1048. doi:10.1089/ast.2019.2125
- Kaiser et al. (2013) Kaiser, R. I., Stockton, A. M., Kim, Y. S., et al. 2013, ApJ, 765, 111. doi:10.1088/0004-637X/765/2/111
- Li et al. (2020) Li, J., Wang, J., Qiao, H., et al. 2020, MNRAS, 492, 556. doi:10.1093/mnras/stz3337
- Li et al. (2017) Li, J., Shen, Z., Wang, J., et al. 2017, ApJ, 849, 115. doi:10.3847/1538-4357/aa9069
- Li et al. (2021) Li, J., Wang, J., Lu, X., et al. 2021, ApJ, 919, 4. doi:10.3847/1538-4357/ac091c
- Ligterink et al. (2018) Ligterink, N. F. W., Terwisscha van Scheltinga, J., Taquet, V., et al. 2018, MNRAS, 480, 3628. doi:10.1093/mnras/sty2066
- Ligterink et al. (2020) Ligterink, N. F. W., El-Abd, S. J., Brogan, C. L., et al. 2020, ApJ, 901, 37. doi:10.3847/1538-4357/abad38
- López-Sepulcre et al. (2019) López-Sepulcre, A., Balucani, N., Ceccarelli, C., et al. 2019, ACS Earth and Space Chemistry, 3, 2122. doi:10.1021/acsearthspacechem.9b00154
- McGuire et al. (2016) McGuire, B. A., Carroll, P. B., Loomis, R. A., et al. 2016, Science, 352, 1449. doi:10.1126/science.aae0328
- McGuire (2018) McGuire, B. A. 2018, ApJS, 239, 17. doi:10.3847/1538-4365/aae5d2
- McGuire (2022) McGuire, B. A. 2022, ApJS, 259, 30. doi:10.3847/1538-4365/ac2a48
- Mendoza et al. (2014) Mendoza, E., Lefloch, B., López-Sepulcre, A., et al. 2014, MNRAS, 445, 151. doi:10.1093/mnras/stu1718
- Müller et al. (2005) Müller, H. S. P., Schlöder, F., Stutzki, J. & Winnewisser, G. 2005, J. Mol. Struct., 742, 215. doi:10.1016/j.molstruc.2005.01.027
- Pickett et al. (1998) Pickett, H. M., Poynter, R. L., Cohen, E. A., et al. 1998, J. Quant. Spec. Radiat. Transf., 60, 883. doi:10.1016/S0022-4073(98)00091-0
- Rimola et al. (2018) Rimola, A., Skouteris, D., Balucani, N., Ceccarelli, C., Enrique-Romero, J., Taquet, V., Ugliengo, P., 2018, ACS Earth Space Chem., 2, 720. doi:10.1021/acsearthspacechem.7b00156
- Rubin et al. (1971) Rubin, R. H., Swenson, G. W., Benson, R. C., et al. 1971, ApJ, 169, L39. doi:10.1086/180810s
- Sánchez-Monge et al. (2018) Sánchez-Monge, Á., Schilke, P., Ginsburg, A., et al. 2018, A&A, 609, A101. doi:10.1051/0004-6361/201730425
- Suzuki et al. (2018) Suzuki, T., Ohishi, M., Saito, M. et al. 2018, ApJS, 237, 3. doi:10.3847/1538-4365/aac8db
- Turner (1989) Turner, B.E. 1989, ApJS, 70, 539. doi:10.1086/191348
- Turner (1991) Turner, B.E. 1991, ApJS, 76, 617. doi:10.1086/191577
- Winnewisser et al. (2005) Winnewisser, M., Medvedev, I. R., De Lucia, F. C., et al. 2005, ApJS, 159, 189. doi:10.1086/430470
- Zeng et al. (2023) Zeng, S., Rivilla, V. M., Jiménez-Serra, I., et al. 2023, MNRAS, 523, 1448. doi:10.1093/mnras/stad1478
- Zhao & Truhlar (2008) Zhao, Y., Truhlar, D.-G., 2008, Theor. Chem. Acc., 120, 215