longtable
Reduced mobility? Urban exodus? Medium-term impacts of the COVID-19 pandemic on internal population movements in Latin American countries
Abstract
The COVID-19 pandemic has impacted the national systems of population movement around the world. Existing work has focused on countries of the Global North and restricted to the immediate effects of COVID-19 data during 2020. Data have represented a major limitation to monitor change in mobility patterns in countries in the Global South. Drawing on aggregate anonymised mobile phone location data from Meta-Facebook users, we aim to analyse the extent and persistence of changes in the levels (or intensity) and spatial patterns of internal population movement across the rural-urban continuum in Argentina, Chile and Mexico over a 26-month period from March 2020 to May 2022. We reveal an overall systematic decline in the level of short- and long-distance movement during the enactment of nonpharmaceutical interventions in 2020, with the largest reductions occurred in the most dense areas. We also show that these levels bounced back closer to pre-pandemic levels in 2022 following the relaxation of COVID-19 stringency measures. However, the intensity of these movements has remained below pre-pandemic levels in many areas in 2022. Additionally our findings lend some support to the idea of an urban exodus. They reveal a continuing negative net balances of short-distance movements in the most dense areas of capital cities in Argentina and Mexico, reflecting a pattern of suburbanisation. Chile displays limited changes in the net balance of short-distance movements but reports a net loss of long-distance movements. These losses were, however, temporary, moving to neutral and positive balances in 2021 and 2022.
1 Introduction
The COVID-19 pandemic triggered major changes in the patterns of human population movement across the world. Nonpharmaceuthical interventions to contain the spread of COVID-19, such as social distancing, lockdowns, business and school closures contributed to sharp declines in internal population movements within countries (Nouvellet et al. 2021). As the virus spread globally in early 2020, COVID-19 infection and mortality rates were disproportionately higher in large and dense metropolitan areas (Pomeroy and Chiney 2021), remote work reduced the need to commute (Nathan and Overman 2020) and diminished retail activity decreased the attractiveness and vibrancy of these areas (Florida, Rodríguez-Pose, and Storper 2021). In a gloomy prospect for urban centres, media headlines suggested the death of cities gathering anecdotal evidence on an “urban exodus”, claiming sudden rises in the number of people moving from large cities to suburbs and rural locales (Paybarah, Bloch, and Reinhard 2020; Marsh 2020).
Empirical evidence have examined these claims focusing on two key dimensions of internal population movements i.e. its level (or intensity), and its spatial impacts on population redistribution. Existing evidence reveals a sharp reduction in levels of overall mobility, including short- and long-distance movements, and some support for an urban exodus during the early days of COVID-2019 in 2020 as the pandemic was unfolding and strict nonpharmaceuthical measures were enacted (Rowe, González-Leonardo, and Champion 2023). Population losses through internal population movements were documented for large core metropolitan areas in Spain (González-Leonardo et al. 2022; González-Leonardo and Rowe 2022), Germany (Stawarz et al. 2022), Sweden (Vogiazides and Kawalerowicz 2022), Japan (Tønnessen 2021), Australia (Perales and Bernard 2022), the United States (Ramani and Bloom 2021) and Britain (Rowe et al. 2022). Suburban and outer parts of metropolitan areas (as in the ‘donut effect’ noted for US cities, see Ramani and Bloom (2021)), as well as more distant rural areas, were identified as gaining population.
While this research has contributed to advancing our understanding of the impacts of COVID-19 on internal population movements in the Global North, less is known about the extent and durability of population movements to and from large cities during the pandemic in the Global South and extending beyond 2020. Existing work has focused on countries in the Global North and restricted to the immediate effects of COVID-19 data during 2020. Only two studies have analysed data extending to 2021 and they offer mixed evidence. For Spain, González-Leonardo and Rowe (2022) report continuing population losses through internal migration in large cities, such as Madrid and Barcelona. In Britain, however, Rowe et al. (2022) record a recovery in the levels of internal movements in low and high density areas converging to pre-pandemic levels.
A major limitation to capture national-scale changes in the patterns of internal population movement across the rural-urban hierarchy in the Global South during the pandemic has been the lack of suitable data. Traditionally census and survey data are used to study human mobility patterns at such scale. But, these data systems are not frequently updated and suffer from slow releases, with census data for example being collected over intervals of ten years in most Latin American countries and with a considerable lag for the release of information (CEPAL 2022). These systems thus lack the temporal granularity to analyse population movements over short-time periods (Green, Pollock, and Rowe 2021). Digital footprints (DFs) left as a result of social interactions on digital platforms offer an unique source of information to capture human population movement in the unfolding data revolution (Rowe 2023). Particularly DF data from mobile phone applications have become a prominent source to sense patterns of human mobility at higher geographical and temporal resolution over in real time, and especially in data-scarce environments in less developed countries.
Drawing on Meta-Facebook users’ mobile phone location data, we aim to examine the extent and persistence of changes in the levels (or intensity) and spatial patterns of internal population movement across the rural-urban continuum in Argentina, Chile and Mexico over a 26-month period from March 2020 to May 2022. Specifically, we seek to address the following set of questions:
-
•
How have the levels of mobility changed across the rural-urban hierarchy over time?
-
•
To what degree have large cities experienced population loss through internal migration movements during the pandemic? What have been the main destinations for people leaving large cities?
-
•
To what extent have the intensity and potential negative balance of population movement from large cities have persisted over time?
We primarily focus on national capital cities. In Latin American countries, these cities have dominated the national system of internal population movement since the 1930s, although they have recorded continuing balance of moderate population losses due to internal migration over the last three decades (Bernard et al. 2017; Rodríguez-Vignoli and Rowe 2018). We could expect that the magnitude of these population losses to have accelerated during the COVID-19 pandemic. We distinguish between short- and long-distance movement to identify the potential sources of the patterns underpinning observed changes in population movements during the pandemic.
Our work contributes to expanding existing knowledge by offering new empirical evidence on the medium-term impacts of COVID-19 on internal population movement. First, it provides a systemic understanding of the overall population movement system in Latin America. While prior work has focused on daily mobility or internal migration, our study provides a more complete representation analysing how short- and long-distance mobility have evolved during COVID-19. Second, we capture the evolution of the internal population movements from 2020 to 2022. Data limitations have prevented previous studies from extending their analysis to understand the patterns of internal population movements beyond 2020. Third, we contribute some of the first empirical evidence documenting the patterns of internal population movement in a set of countries in the Global South.
The rest of the paper is structured as follows. The next section provides a brief review of recent research on internal population movements during the COVID-19 pandemic, before providing an overview of the main patterns of population movements within Latin American countries. Section 3 describes the data, and Section 4 discusses the methods used in this study. Section 5 presents the key results from our analyses before they are discussed in light of the existing literature in Section 6, which also identifies key limitations and potential avenues for future work. Section 7 provides some concluding remarks.
2 Background
2.1 The impact of COVID-19 on internal population movements
Globally, there is evidence that the COVID-19 pandemic constrained both short- and long-distance movements within national boundaries (Nouvellet et al. 2021; González-Leonardo, Rowe, and Fresolone-Caparrós 2022; Wang et al. 2022; Rowe, González-Leonardo, and Champion 2023). Declines were documented across the Global North during the first year of the pandemic in the United States (Ramani and Bloom 2021), a number of European countries, Japan and Australia (Rowe, González-Leonardo, and Champion 2023). The magnitude of these declines vary widely from 2.5% in Spain (González-Leonardo et al. 2022) to 8.5% in Australia (Perales and Bernard 2022). The shapest drops occurred when nonpharmaceutical interventions, such as stay-at-home requirements, travel restrictions, mobility restrictions, business and school closures were enacted.
These drops did not last very long. Existing evidence suggests that volume of human mobility recovered pre-pandemic levels in most countries following the ease of stringency measures, particularly lockdowns (Rowe, Robinson, and Patias 2022). In Australia, declines in the intensity of population movement were attributed to lockdowns, as well as increased teleworking and a loss of labour market dynamism resulting from the COVID-19-driven economic recession due to business closures and supply shortages (Perales and Bernard 2022). In Latin America and the Caribbean, evidence indicates that the implemention of social distancing policies resulted in 10 percenge decrease in human mobility levels 15 days after they were enacted (Aromí et al. 2023). The highest declines were recorded in Bolivia (19%), Ecuador (17%) and Argentina (16%). Smaller drops of 3% were registered in Paraguay and Venezuela (Aromí et al. 2023).
In Global North countries, evidence indicates that the COVID-19 pandemic reshaped the spatial patterns of internal population movements. Primarily the pandemic is believed to have trigger movements away from large cities to sparsely populared areas, including suburban, coastal and rural locations (Rowe, González-Leonardo, and Champion 2023). Consistent findings have been reported from the United States (Ramani and Bloom 2021), the United Kingdom (Rowe et al. 2022; Wang et al. 2022), Spain (González-Leonardo et al. 2022; González-Leonardo, Rowe, and Fresolone-Caparrós 2022), Germany (Stawarz et al. 2022), Sweden (Vogiazides and Kawalerowicz 2022), Norway (Tønnessen 2021), Australia (Perales and Bernard 2022) and Japan (Fielding and Ishikawa 2021; Kotsubo and Nakaya 2022). In the United States, Germany, Norway, Sweden and Japan the predominant pattern was net migration losses in large cities during 2020 but increases in their suburban areas. In the United States, Ramani and Bloom (2021) labelled this phenomenon as “donut effect”, reflecting an increase net population loss through population movement in metropolitan areas (urbanisation) and simultaneously a rising net population gain in suburban rings (suburbanisation) and rural areas (counterurbanisation).
In the United Kingdom, Spain and Japan, there is no evidence of a “donut effect” (Fielding and Ishikawa 2021; Rowe et al. 2022; González-Leonardo, Rowe, and Vegas-Sánchez 2023). In these countries, net population balances in suburbs did not show significant increases during 2020 and 2021. Yet, population movements to large cities did decline and movements to rural, sparsely populated areas increased, leading to unusual large population gains in these areas. In Spain, Sweden, Japan and Germany, attractive touristic, holiday and coastal areas were popular destination for large city residents (González-Leonardo, Rowe, and Fresolone-Caparrós 2022; Vogiazides and Kawalerowicz 2022; Stawarz et al. 2022). These areas tend to be locations with a prominent number of second and holiday homes, suggesting that wealthy households who were able to work remotely left large cities and settled in these areas (Haslag and Weagley 2021; Tønnessen 2021).
The cumulative evidence has also suggested that while the patterns of population movement were altered during the pandemic, the preexisting predominant trends remained mostly unchanged. Most movements continued to occur within and between urban areas, and the existing evidence suggests that the observed sudden rises in movements from large cities to rural location are not likely to endure the height of the pandemic (Rowe, González-Leonardo, and Champion 2023). In the United Kingdom, mobility levels had almost returned to prepandemic levels by August 2021 (Rowe et al. 2022; Wang et al. 2022). In Australia, changes in the patterns of internal population movements due to COVID-19 had virtually dissapered towards the end of 2020 (Perales and Bernard 2022). In Spain, however, large cities such as Madrid and Barcelona have continued to loss population through internal migration from 2020 to 2021 (González-Leonardo and Rowe 2022). While Barcelona had a record of net migration losses prior to the pandemic, population losses due to internal migration occurred during COVID-19. At the same time, unusually high levels of counterurbanisation in Spain persisted over 2021 (González-Leonardo, Rowe, and Fresolone-Caparrós 2022). Thus, while the levels and spatial patterns of internal population movements seem to have resumed pandemic trends, key changes seem to have endure the height of the COVID-19 pandemic. The long-term effects of COVID-19 remain to be established.
Overall, existing work has contributed to better understand how internal population movements across the rural-urban hierarchy were affected by the COVID-19 pandemic in the Global North. However, less is known about COVID-19 impacts on movements between cities, suburbs and rural areas in the Global South and the durability of resulting changes. Yet, that is not to say that evidence does not exist. Evidence based on small surveys carried out in India (Irudaya Rajan, Sivakumar, and Srinivasan 2020) and South Africa (Ginsburg et al. 2022) in 2020 suggests that flows from large cities to less populated areas increased as a result of the return of workers to their hometown as business closures and lockdowns were enacted, At the same time, movements to cities diminished (Irudaya Rajan, Sivakumar, and Srinivasan 2020). Both studies suggest that the economic downturn caused by nonpharmaceutical interventions during the pandemic (Ghosh, Seth, and Tiwary 2020) resulted in a reduction in inflows of workers to cities, as well as an increase in the number of return moves due to a rise in unemployment. This evidence suggests that vulnerable populations in the Global South seem to have played a key role in shaping the movements to and away from large cities during the pandemic.
Yet, this evidence differ from recent work which points to an increase in population movements made by wealthy individuals from large cities to less densely populated areas in Global South countries during the first wave of COVID-19. Lucchini et al. (2023) provide evidence analysing data from Brazil, Colombia, Indonesia, Mexico, Philippines and South Africa. They estimated that residents from high-wealthy neighborhoods were 1.5 times more likely to leave cities compared to those from low-wealthy areas. This pattern is consistent with evidence from Chile indicating an over-representation of high-income individuals in movements out of the Greater Santiago Area during the pandemic (Elejalde et al. 2023). Wealthy individuals are believed to have the resources to move, be able to work remotely, and own second residences in popular holiday destinations. Low-income households, on the other hand, may be less movable as they may lack the financial resources to move. Also, a large proportion of low-income families work in service or informal sectors of the economy and jobs in these sectors require in-person, face-to-face interactions.
Overall, there is little evidence analysing the patterns of internal population movement in Global South countries. Though, evidence suggests distinctive patterns in the selectivity of movements occurring in Latin American countries. Yet, we are still to better understand the magnitude and durability of changes to internal population movements across the urban-rural hierarchy. Here, we use mobile phone data to analyse the effect of COVID-19 on the patterns of internal population movements in Argentina, Chile and Mexico. Before, we review literature on internal population movements in Latin America, to offer some broader context about the predominant patterns of mobility that were at work before the unfolding of the COVID-19 pandemic.
2.2 Preexisting patterns of population movement
Currently, Latin America has the highest urbanisation rate in the world after North America, totaling 81% (Nations" 2019). In Latin American countries, population is highly concentrated in a few urban centres, particularly in large cities with more than one million inhabitants, where half of urban residents (Pinto da Cunha 2002; A. E. Lattes, Rodríguez, and Villa 2017). High urbanisation rates have been the result of high levels of population redistribution from rural settlements to cities, mostly during a fast phase of industrialisation between the early 1950s to late 1970s (Firebaugh 1979; A. Lattes 1995). During these decades, considerable population gains were mainly recorded in capital cities (J. Sobrino 2012).
Since the 1980s, however, movements to metropolitan areas in Latin America have diminished (Chávez Galindo et al. 2016). This has been a natural consequence as rural population stocks depleted (Chávez Galindo et al. 2016), coupled with a transition from an industrial substitution economic strategy to free-market model led to a trend of population deconcentration away from large cities, such as Santiago in Chile (González Ollino and Rodríguez Vignoli 2006; Rowe, 2013.) or Mexico City (Jaime Sobrino 2006). This transition has resulted in a reduction in the volume of long-distance movements to capital cities, leading to population losses in some cities, like Santigo (Rowe, 2013.).
As a result, middle-sized cities became more attractive population centres. They benefitted from increasing domestic and foreign investment in export-oriented industries and tourism activities, leading to geographic economic dispersal and subsequent migration inflows (Brea 2003; Pérez-Campuzano 2013; Chávez Galindo et al. 2016). Over the two past decades, movements between cities have dominated the internal migratory system in Latin American countries (Bernard et al. 2017; Rodríguez-Vignoli and Rowe 2018; Nations" 2019). About 80% of internal migrants moved between cities, according to the 2010-11 census round (Rodríguez Vignoli 2017). Medium-sized cities from 500.000 to 1 million residents record the largest population gains due to internal migration (Rodrííguez Vignoli 2017). Large cities with more than 1 million residents registered balanced rates, while small cities with less than 500.000 inhabitants recorded population losses through internal migration (Rodríguez-Vignoli and Rowe 2018).
Latin American cities have shown significant growth in terms of land development in their urban peripheries. Since the 1970s, large cities, such as Santiago de Chile, Buenos Aires and Mexico City have experienced rapid suburbanisation (Graizbord and Acuña 2007; Chávez Galindo et al. 2016). Suburbanisation flows comprise middle- and high-class families moving from cities to highly segregated areas on the periphery (Borsdorf 2003; Rodríguez Vignoli 2019). Though, some peripheral areas have also served home for low-income households settling in informal housing (Janoschka 2002; Rodríguez Vignoli and Rowe 2017). Peripheral areas have thus become major residential areas for metropolitan residents serving as satellite neighbourhoods for daily commuters to core areas of capital cities (Chávez Galindo et al. 2016). Next we describe the data we used to examine the extent to which the existing patterns of population movement have been altered during the COVID-19 pandemic.
3 Data
3.1 Meta-Facebook Data
To capture population movements during the COVID-19 pandemic, we used anonymised aggregate mobile phone location data from Meta users for Argentina, Chile and Mexico, covering an 26-month period from March 2020 to May 2022. We used two datasets Facebook Movements and Facebook Population created by Meta and accessed through their Data for Good Initiative (https://dataforgood.facebook.com). The data are built from Facebook app users who have the location services setting turned on on their smartphone. Prior to releasing the datasets, Meta ensures privacy and anonymity by removing personal information and applying privacy-preserving techniques (Maas et al. 2019). Small-count dropping is one of these techniques. A data entry is removed if the population or movement count for an area is lower than 10. The removal of small counts may mean that population counts in small sparsely populated areas are not captured. A second technique consists in adding a small undisclosed amount of random noise to ensure that it is not possible to ascertain precise, true counts for sparsely populated locations. Third, spatial smoothing using inverse distance-weighted averaging is also applied is applied to produce a smooth population count surface.
The Facebook Movements dataset offers information on the total number of Facebook users moving between and within spatial units in the form of origin-destination matrices. The Facebook Population dataset offers information on the number of active Facebook users in a spatial unit at a given point in time. Both datasets are temporally aggregated into three daily 8-hour time windows (i.e. 00:00-08:00, 08:00-16:00 and 16:00-00:00). The datasets include a baseline capturing the number of Facebook user population or movement before COVID-19 based on a 45-day period ending on March 10th 2020. The baseline is computed using an average for the same time of the day and day of the week in the period preceding March 10th. For instance, the baseline for Monday 00:00-08:00 time window is obtained by averaging over data collected on Mondays from 00:00 to 8:00 for a 45 day period. Details about the baseline can be found in Maas et al. (2019).
The Bing Maps Tile System developed by Microsoft (Microsoft) is used a spatial framework to organise the data. The Tile System is a geospatial indexing system that partitions the world into tile cells in a hierarchical way, comprising 23 different levels of detail (Microsoft). At the lowest level of detail (Level 1), the world is divided into four tiles with a coarse spatial resolution. At each successive level, the resolution increases by a factor of two. The data that we used are spatially aggregated into Bing tile levels 13. That is about 4.9 x 4.9km at the Equator (Maas et al. 2019).
3.2 COVID-19 stringency data
We used the stringency index as a measure of the level of nonpharmaceutical interventions to COVID-19, such as social distancing and lockdowns. We used these data to understand how the level and patterns of population movement changed in response to the implementation of various nonpharmaceutical interventions during COVID-19. The stringency index ranges from 0 to 100, with 100 being the value corresponding to the most strict scenario. The stringency index were retrieved from the COVID-19 government response tracker [https://www.bsg.ox.ac.uk/research/research-projects/covid-19-government-response-tracker](https://www.bsg.ox.ac.uk/research/research-projects/covid-19-government-response-tracker). See Hale et al. (2021), for more information.
3.3 WorldPop population data
We also used data from WorldPop (Tatem 2017) to measure the degree of population density of local areas. WorldPop offers open access gridded population estimates at a resolution of 3 and 30 arc-seconds approximately 100m and 1km at the Equator, respectively. WoldPop produces these gridded datasets using a top-down (i.e. dissagregating administrative area counts into smaller grid cells) or bottom-up (i.e. interpolating data from counts from sample locations into grid cells) approaches. The data are in raster and tabular data formats. We gridded population data at 1km resolution in raster format. Data at this level of resolution are needed to spatially integrate our Facebook population and movement data.
4 Methods
4.1 Population density classification
We sought to analyse the extent and durability of changes in internal population movements across the rural-urban continuum. We thus moved away from a rural-urban binary framework to understand population movements and capture the diversity of contemporary human settlement systems. Champion and Graeme (2004) and Rowe et al. (2019) serve as excellent references summarising these arguments. We focused on understanding the patterns of population movement across the rural-urban continuum, particularly population exchanges between dense urban cores, suburbs, medium-size areas and rural locations. Following Rowe et al. (2019), we measured population density to capture the rural-urban continuum.
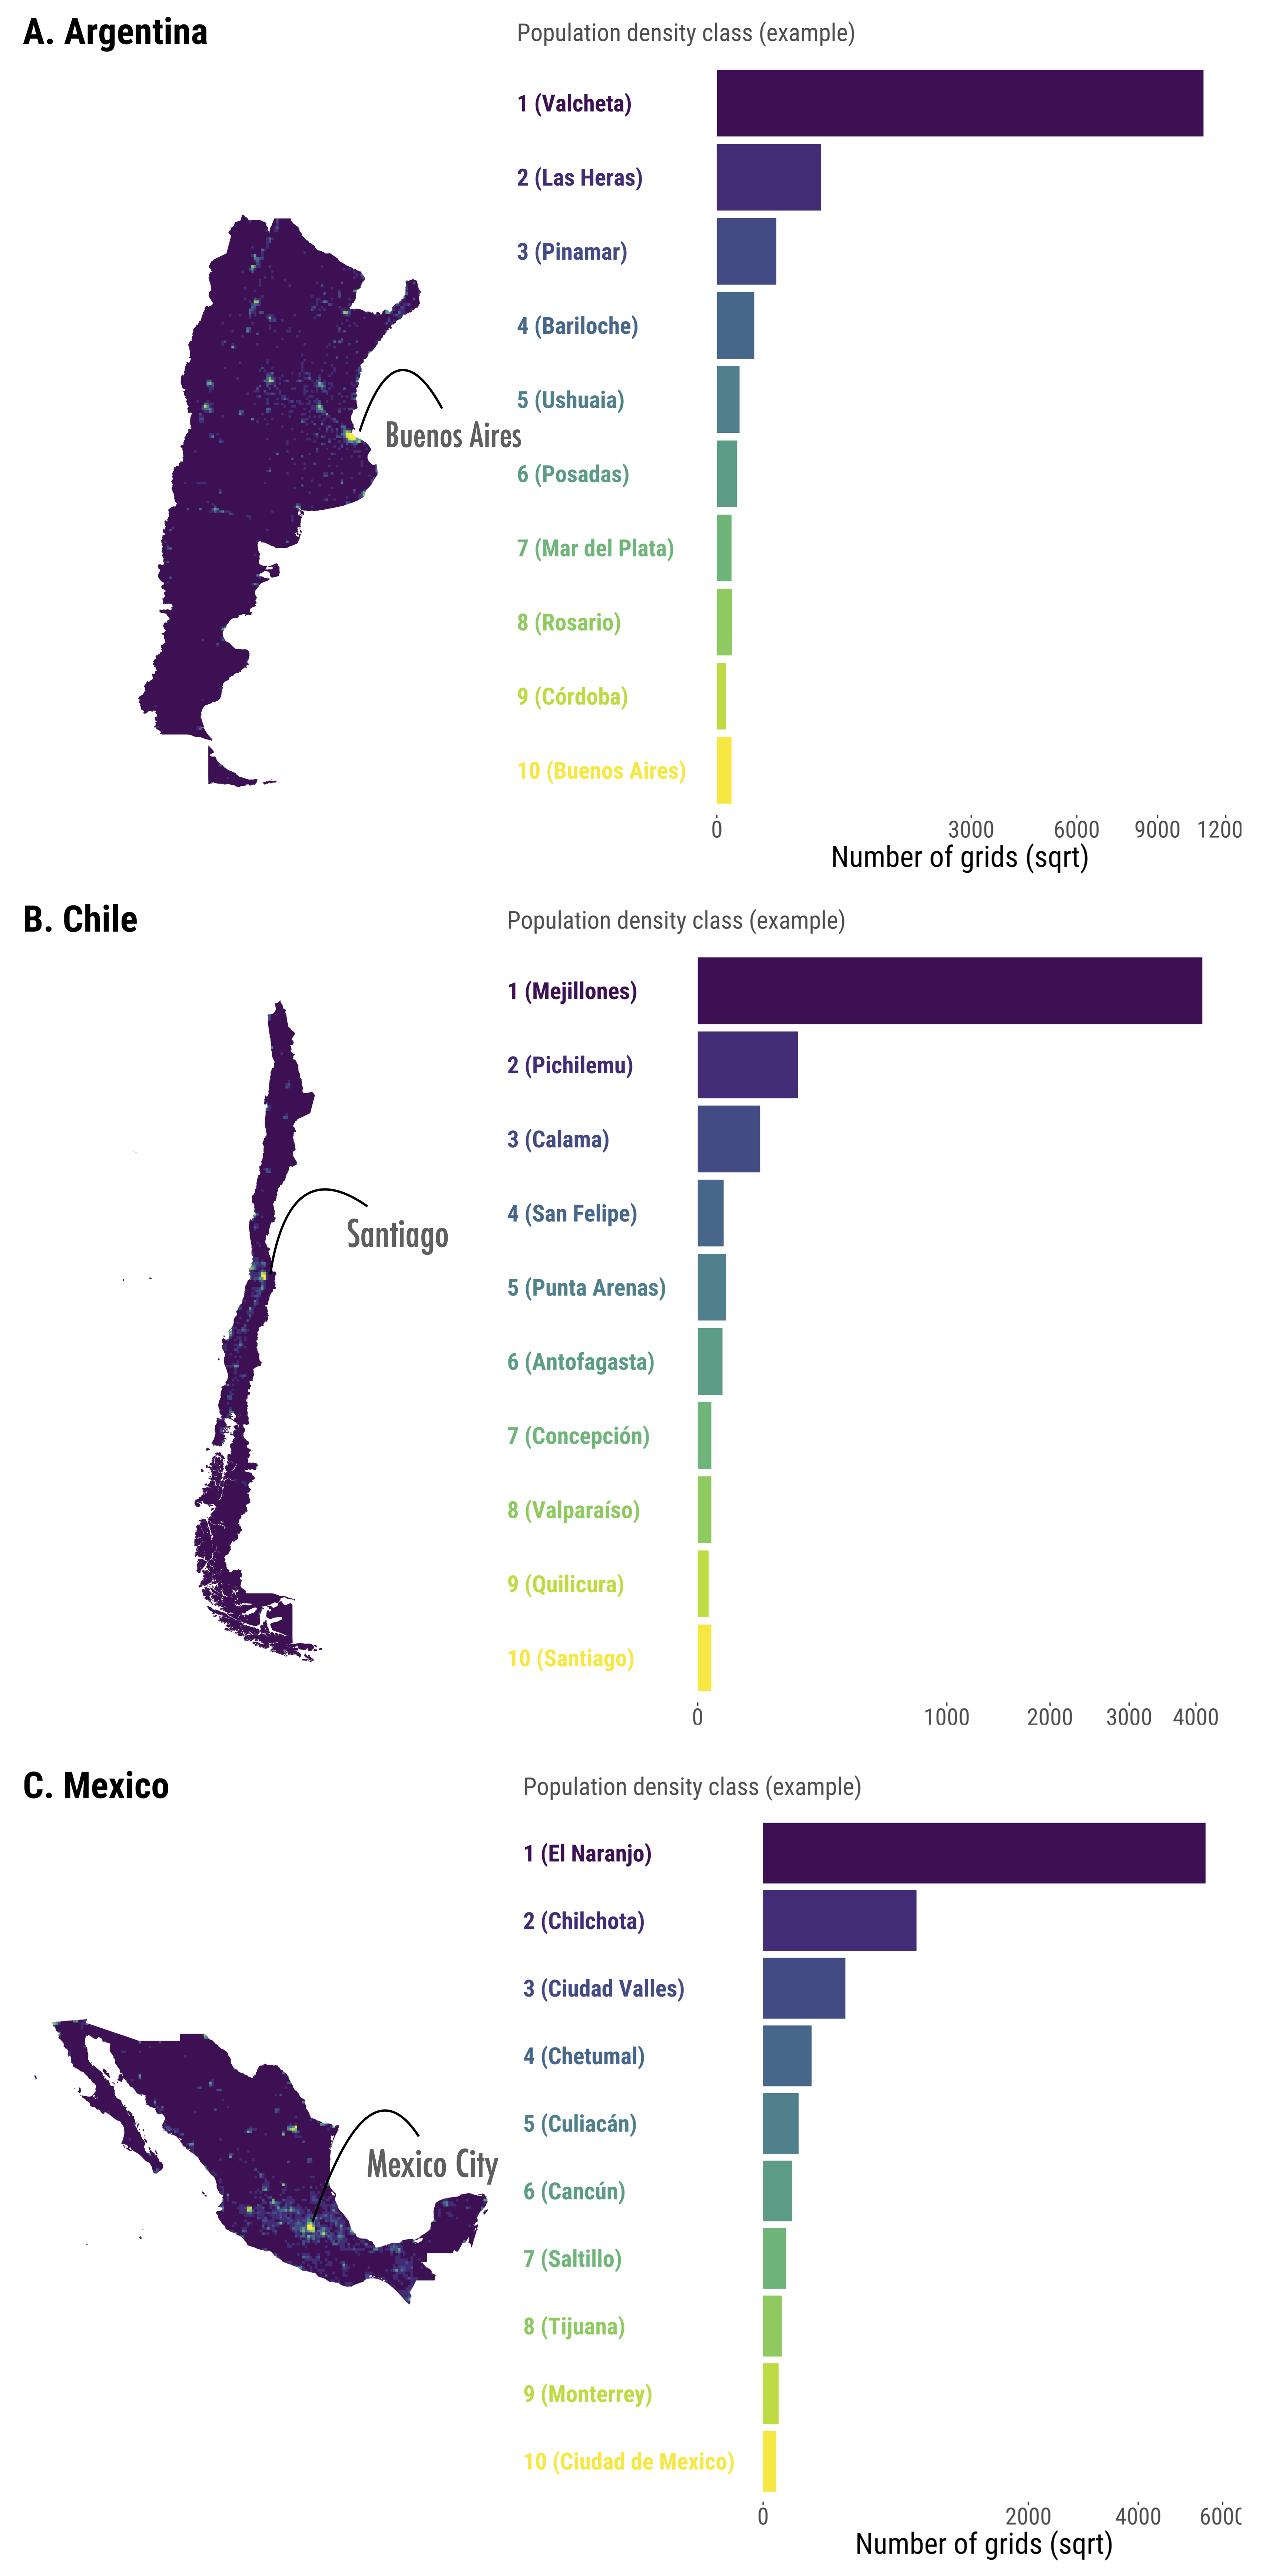
For individual countries, we spatially aggregated these the WorldPop data into the Bing tiles to correspond with our Facebook population data using spatial intersection operators and area weighted centroids. Area weighted centroids are particularly useful to allocate grids on coastal regions. We then classified the WorldPop population into population density deciles, identifiying population density classes, with 1 capturing the least dense areas to 10 representing the most dense areas. To this end, we employed the Jenks natural breaks classification method (Jenks 1967).
Figure 1 displays a map with our classification of Bing tiles coloured according to the population density classes, and a bar plot reporting the number of Bing tiles in each population classes. The bar plot also shows example areas in bracket of the areas included in each category, to provide an idea of the type of places that they include. A key observation to recall for the remainder of the paper is the fact that the most dense class 10 exclusively includes the core metropolitan areas of the national capitals (i.e. Buenos Aires in Argentina, Santiago in Chile, and Mexico City in Mexico). Class 9 areas tend to represent highly dense, suburban metropolitan areas around these national capitals, and class 1 areas tend to be small, sparely populated areas on coastal regions or around natural parks, natural reserves, agricultural and forest areas. Also note that the population density ranges for each density class differ by country. The logic of this classification is that we expect tiles belonging to the same category in individual countries have a similar function in the national settlement system.
4.2 Tile-based mobility metrics
Intensity of movement
We sought to measure two key dimensions of population movements: its level or intensity, and spatial impact (M. Bell et al. 2002). We measured changes in the intensity of movement by quantifying the variation in the number of population movements by population density category in relation to the baseline period. We focused on two distinctive months: May 2020 and March 2022 representing a period during the height of the COVID-19 pandemic when a range of stringency measures were in place, and a period at a very advanced stage of the pandemic after mass vaccination has been rolled out and stringency measures had been removed. Specifically, we used the percentage change in the intensity of a population movement in reference to the reference period, as provided in the Facebook Movement datasets (Maas et al. 2019):
| (1) |
where corresponds to the number of people moving; and, corresponds to the number of people that would be expected to move in the baseline pre-pandemic period at the same time of the day, on the same day of the week, and between the same origin and destination tiles. A positive score indicates an increase in the extent of population movement relative to baseline levels. A negative score represents a decrease, while a zero score denotes no change.
We grouped the resulting percentage change metrics by population density class for places of origin, and generate boxplots to capture the distribution of changes across these classes. We also considered the relationship between these changes in mobility and degree of stringency during the pandemic.
Spatial impact of movement
We also sought to examine the degree of population redistribution through mobility. Particularly we aimed to explore the extent to which people have moved from capital cities down in the rural-urban hierarchy. To this end, we computed the net balance between inflows and outflows:
| (2) |
where: and represent the total number of movement in and out of an area. We computed and aggregated the net balance by each tile to produce an overall metric for individual population density class. Thus, the net balance for population density class 10 areas represent the overall net balance in capital cities. Also, because we computed the net balance for individual areas at three windows during a day, we avoid focusing on daily mobility. Over the course of a day, positive and negative net balances of daily mobility would cancel out, and hence capture moves involving one-night stay.
4.3 Local and long-distance movement
To further mitigate the effect of daily and short-distance moves, we distinguish between short- and long-distance movements. In the literature, short-distance moves are often used to capture residential mobility, while long-distance moves are used to represent internal migration (Niedomysl 2011). Short-distance moves are associated primarily with housing reasons, while long-distance moves are driven primarily by labour market reasons. For the metrics described above, we therefore considered only flows with a Euclidean distance between origins and destinations greater than 0km. We defined short-distance moves as trips of less 100km, and long-distance moves as trips covering 100km or more.
In terms of expectations, we expected to observe an overall decrease in mobility as a consequence of stringency measures especially during the early stages of the COVID-19 pandemic. During this period, we also expected to find a decrease in movement in and to metropolitan cores and an increase in mobility to suburban areas or satellite cities, reflecting changes in commuting patterns. We expected to observe negative net balances of movements in big cities and positive balances down the rural-urban hierarchy, particularly in less dense, coastal towns, rural and lake areas.
5 Results
5.1 Changes in mobility in May 2020 and in March 2022
We analysed changes in the intensity of movements across our population density classes across Argentina, Chile and Mexico in May 2020 and March 2022. These two months represent two pivotal points in the pandemic. May 2020 provides a good representation of the early days when a series of strong stringency measures were enacted following the WHO’s declaration of COVID-19 on the 11th of March 2020 as a global pandemic. March 2022 captures the later days of the COVID-19 pandemic about six months after most of the COVID-19 restrictions had been relaxed in the countries in our analysis. Figure 2 and Figure 3 show boxplots of the distribution of the percentage change in the number of movements by areas according to their population density for under and over 100km. The boxplots report the percentage change in movements for each population density category during May 2020 and March 2022. The baseline levels are represented by the dotted line at . Positive values indicate increases in mobility relative to pre-pandemic levels, while negative values indicate a reduction in mobility.
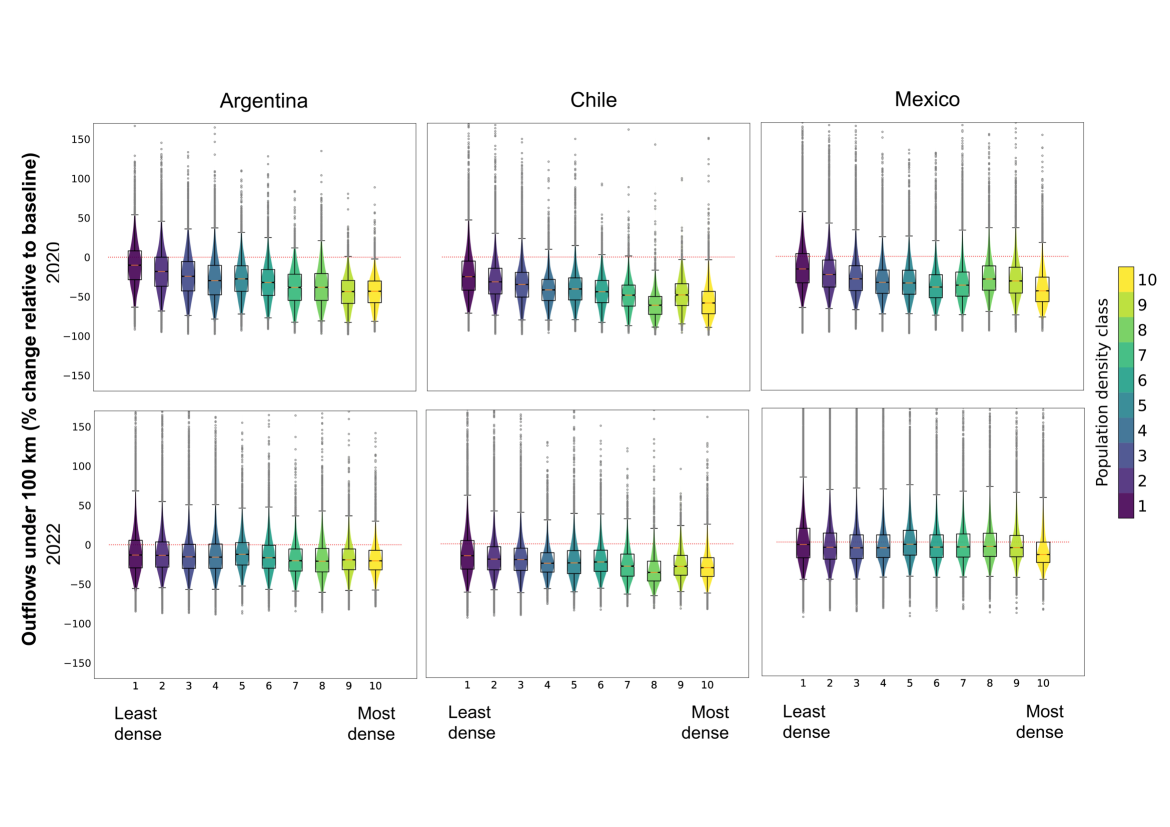
Short-distance movements
Figure 2 shows a consistent decline in movement across all population density classes for movements under 100km. This decline is consistent across all countries in our analysis and particularly pronounced in the early days of the pandemic. Figure 2 also shows a consistent gradient of decline. The most densely populated areas, comprising locations within Buenos Aires, Santiago and Mexico City, tended to record the sharpest declines in the early stages of the pandemic. Some of these areas registered drops of over 50%, notably in Chile. Declines were less pronounced in the least densely populated areas.
While Figure 2 shows that the predominant trend in May 2020 was a decline in the levels of mobility, it also reveals that there is a great degree of variability. While most areas experienced a decline in May 2020, others recorded larger volumes of movement in relation to the prepandemic period, and this occurs predominantly in the least density class areas. Some doubled their levels of mobility. This, however, does not necessarily mean large population numbers as least density class areas house very small populations, and small variations in population translate into large percentage changes. Yet, these percentage change provide an idea of the degree of impacts on these sparsely populated locations.
Additionally, Figure 2 reveals that an overall recovery of mobility levels. While some areas continued to record levels of mobility well below their prepandemic patterns, Figure 2 shows that average levels of mobility have moved closer to prepandemic levels in most areas in March 2022 with Chile displaying the most modest intensity of recovery. This evidence suggests that the pandemic may have resulted in durable changes in the patterns of short-distance mobility, particularly in highly dense areas. Such change may be the result of the adoption of remote or hybrid working as a main way of operation.
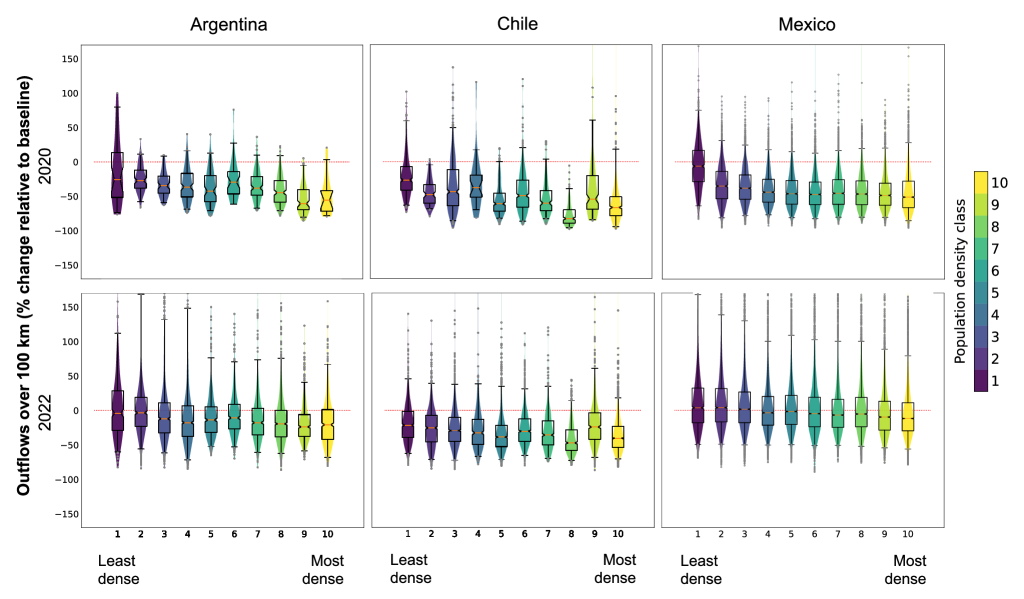
Long-distance movements
Figure 3 displays similar trends for long-distance movements to those observed for short-distance trips. It shows a consistent decline in movement across all population density classes in May 2020, with the most densely populated areas experiencing the largest drops, and small average changes in the least dense areas. Similarly, Figure 3 shows a large degree of variability within population density classes, yet the extent of increases was less pronounced than for short-distance movements. These findings indicate that the enactment of stringency measures was very effective in reducing mobility levels and potentially the extent of COVID-19 transmission in the early days of the pandemic.
Figure 3 also reveals that the average intensity of long-distance movement were virtually back to prepandemic levels in Argentina and Mexico. This trend is evidence by the boxes overlapping the baseline 0. However, Figure 3 suggests that the mobility levels were still below prepandemic volumes in Chile, particularly in moderate and high population density areas. Our estimates indicate that long-distance mobility levels were 50% below prepandemic in the highest density areas covering the Santiago metropolitan area.
5.2 Spatio-temporal patterns of population redistribution during COVID-19
We also analysed the spatial impact of mobility on redistributing population across the country during the COVID-19 pandemic. Specifically, we examined the evolution of changes in the net balance between mobility inflows and outflows across the rural-urban hierarchy during the pandemic. We calculated the monthly net movement balance as the difference between mobility inflows minus outflows for individual population density classes during March 2020 to May 2022. Figure 4 and Figure 5 show the changes in net balance for movements under 100km and over 100km, respectively.
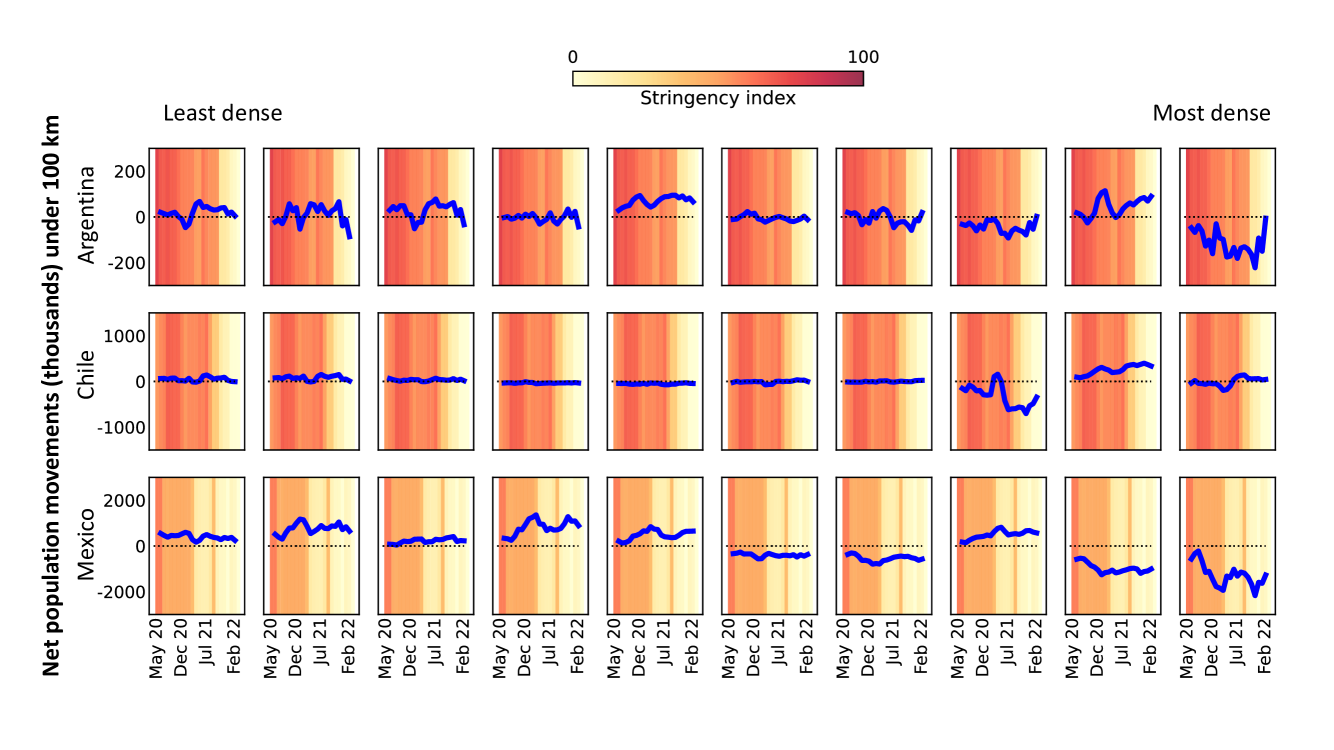
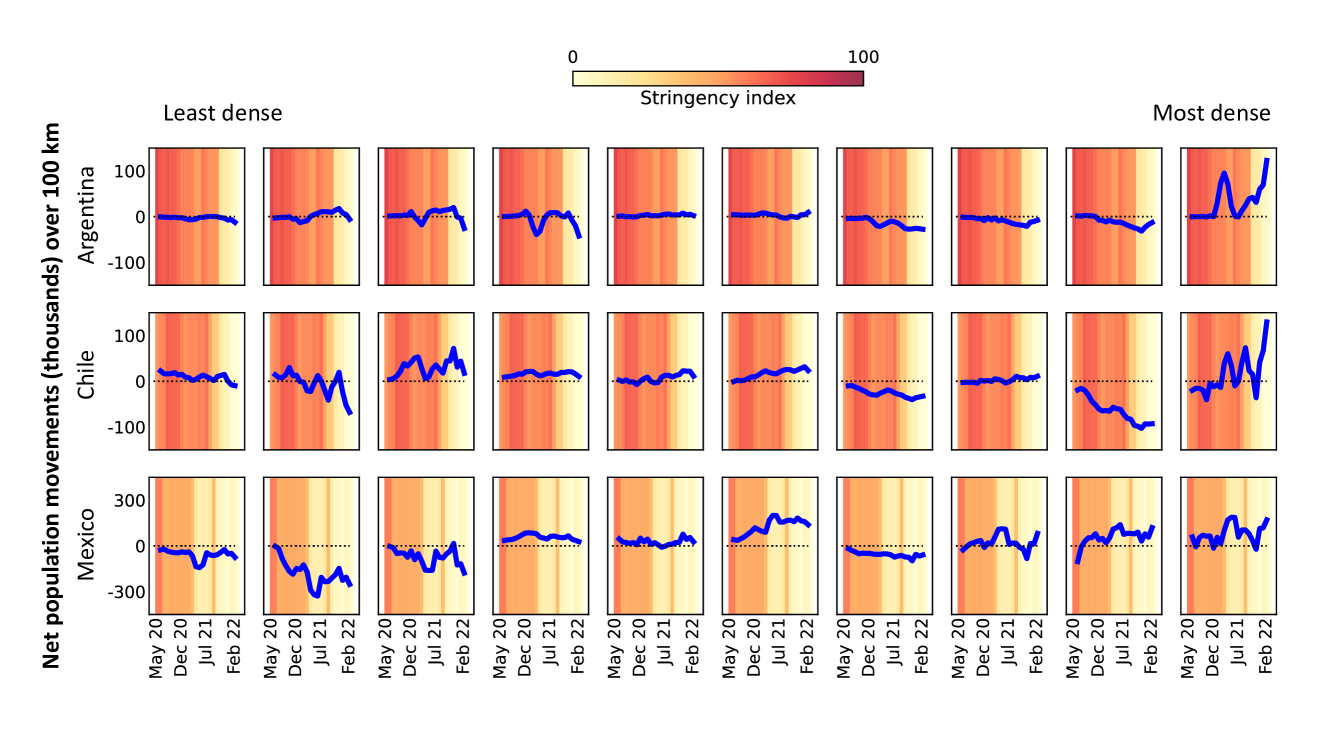
Short-distance movement
Figure 4 reveals a persistent pattern of fluctuating negative net balances of movements under 100km in the highest population density class areas in Argentina and Mexico for most of March 2020 to May 2022. The extent of these balances becomes more notably pronounced after July 2020, but they vary widely by country. Mexico displays the largest negative balances, probably reflecting the fact that it is the second most populated country in Latin America following Brazil. The trend of negative balances indicates that the highest population density class areas in Argentina and Mexico tended to record a larger number of outward movements than inward movements over distances of less than 100km. As indicated in Section 4.1, these locations comprise highly dense metropolitan cores predominantly in capital cities, including the Central Business District. In Mexico, consistently large negative net balances also occurred in areas of class 9. These areas include citie such as Monterrey, Puebla and Guadalajara. The spatial concentration of negative net balances in high density class areas mirrors the pattern of population loss identified in metropolitan areas in developed countries during the COVID-19 pandemic (Rowe, González-Leonardo, and Champion 2023).
At the same time, Figure 4 shows a relatively consistent positive net balance of movements in specific types of areas along the rural-urban hierarchy. Argentina records a consistent pattern of greater inward movement than outward movement in medium density areas of class 5 type, including small towns and cities such as Ushuaia, Trelew and San Luis, and a trend of irregular net positive balances in the least dense areas of class 1-3 and high density locations of class 9. Areas of class 1-3 in Argentina correspond to rural and sparsely populated regions across the country, while class 9 areas predominantly represent suburban metropolitan and large city areas, such as Cordoba, Mendoza and Moreno. Negative net losses also tended to occur in areas of class 7 and 8 over 2021 and 2022, predominantly including medium-sized cities such as Salta and Resistencia. In Mexico, a pattern of consistently positive net balance of movements occurred in the range of less dense areas of class 1 to 5 and 8. These balances were particularly pronounced in areas of class 2 and 4, encompassing touristic, forest and natural reserve places such as Rio Verde, Chilcota and Ciudad Valles. In Mexico, the observed patterns suggest mobility out of high density areas in Mexico City, including metropolitan core areas and suburbs, to nearby sparsely and rural areas within a radius of 100km.
Chile displays a different pattern. The most densely populated areas in the country record net balances around zero for movements under 100km. This pattern suggests limited population redistribution from and to metropolitan core areas in Santiago over short distances during the pandemic. Yet, areas of class 8 display large net losses, particularly from July 2021 following less stringent COVID-19 restrictions. At the same time, areas of class 9 report more pronounced net gains since July 2021. These findings suggest a pattern of movement up the rural-urban hierarchy from urban areas, such as Valparaíso, La Serena and Viña del Mar areas to more dense locations in the Santiago Metropolitan Area.
Long-distance movements
Figure 5 reveals a systematic pattern of net balances across Argentina, Chile and Mexico. It shows small net balances of movements over 100km in the most densely populated areas from the start of the COVID-19 outbreak to December 2020 but sizable net gains during 2021 and 2022. The pace of these gains, however, differs across countries. Argentina and Chile report rapid a rise in net gains of long-distance movements in metropolitan core areas, while the trend of increase in positive balances in Mexican highly dense areas is less marked. These patterns seem to relate to the impact of stringency levels of COVID-19 restrictions. These impacts are particularly visible in metropolitan core areas. Limited population redistribution appears to have occurred early in the pandemic when severe COVID-19 restrictions were enacted, and enlarged as the stringency level of these measures decreased. Also, comparatively, Argentina and Chile implemented stricter restrictions and reductions in stringency levels seem to have resulted in larger expansions in the net balances of metropolitan core areas than in Mexico.
Unlike other countries, Chile displays a pattern of negative net balances of movements over 100km in the highest density areas of the Santiago metropolitan area during the first year of the pandemic (Figure 5). These balances are not very large but suggest a steady flow of people moving away from high density areas of Santiago to destinations over 100km. Net positive balances of movements over 100km in less dense areas of class 1 to 3 indicate that these were the primary destinations of flows from the capital. Yet, the duration of these balances suggests that movements from metropolitan core areas were temporary. Figure 5 reveals an irregular pattern of large net positive balances in these areas from May 2021 as COVID-19 restrictions were relaxed. At the same time, we observe a continuous trend of negative net balances in highly dense areas of class 9, reflecting increasing net losses in north-west areas of the Santiago Metropolitan Area, including Quilicura and Lampa, as well as Reñaca.
5.3 Movements from and to capital cities
To understand better the nature of movements involving areas of population density class 10, we analysed the spatial patterns of movement of under and over 100km from capital cities. In our analysis, movements from population density class 10 areas exclusively represent mobility patterns from metropolitan core areas of capital cities. Figure 6 displays the number of movements out from metropolitan core areas in Buenos Aires, Santiago and Mexico City for March 2020 and April 2022. As anticipated, areas around the national capitals represent the main destinations for short-distance movements. In April 2020, movements away from capital were limited but had expanded in volume and geographical extent by March 2022.

Figure 6 reveals the main destinations for the movements underpinning the persistent losses of short-distance movement observed for class 10 areas in Argentina and Mexico. Our data revealed that nearby urban and suburban areas, such as Moreno, La Matanza and Tigre in Argentina and Ecatepec de Morelos, Aztizapán de Zaragoza and Chicoloapan de Juárez in Mexico absorbed over 80% of short-distance moves from Buenos Aires and Mexico City in March 2022. To a lesser extent, these moves have been directed to rural areas. Though, as we described in the previous section, these areas recorded a relatively large net balance of short-distance moves particularly in Mexico. In Chile, short-distance movements were quite balanced in metropolitan core areas throughout from 2020 and 2022 (Figure 4). Figure 6 reveals that these movements were predominantly to mostly rural, sparsely populated areas, such as Cordillera and Maipo.
Figure 6 also reveals a similar pattern to the donut effect documented in the US with large cities hollowing out (Ramani and Bloom 2021). The maps for short-distance moves in Figure 6 show that suburban areas closer to metropolitan core areas absorbed larger counts of short-distance moves, with neighbouring rural locations and towns attracting smaller numbers. In Argentina and Chile, this pattern seem to have been relatively uniform with areas closer to core metropolitan areas of Buenos Aires and Santiago absorbing large numbers. In Mexico, areas on the west and north-west, such as Lerma, Metepec and Chiautla have tended to record the largest numbers from Mexico City.
Figure 6 identifies the destination areas underpinning the negative balance of long-distance movements in the early months of the pandemic observed for Santiago, Chile. The 2020 bottom map for long-distance in Figure 6 reveal that key destinations in Chile were central-southern areas in the provinces of Talca, Curico and Colchagua. Movements to these destinations are thought to have been moves from affluent households, with second or holiday homes in these areas and jobs which could be done remotely. Additionally, Figure 6 shows that the provinces of Antofagasta and El Loa also attracted a relatively large number of moves. The main economic sector in these areas is mining suggesting that movements to these regions may have been long-distance commuting moves, rather than migratory moves.
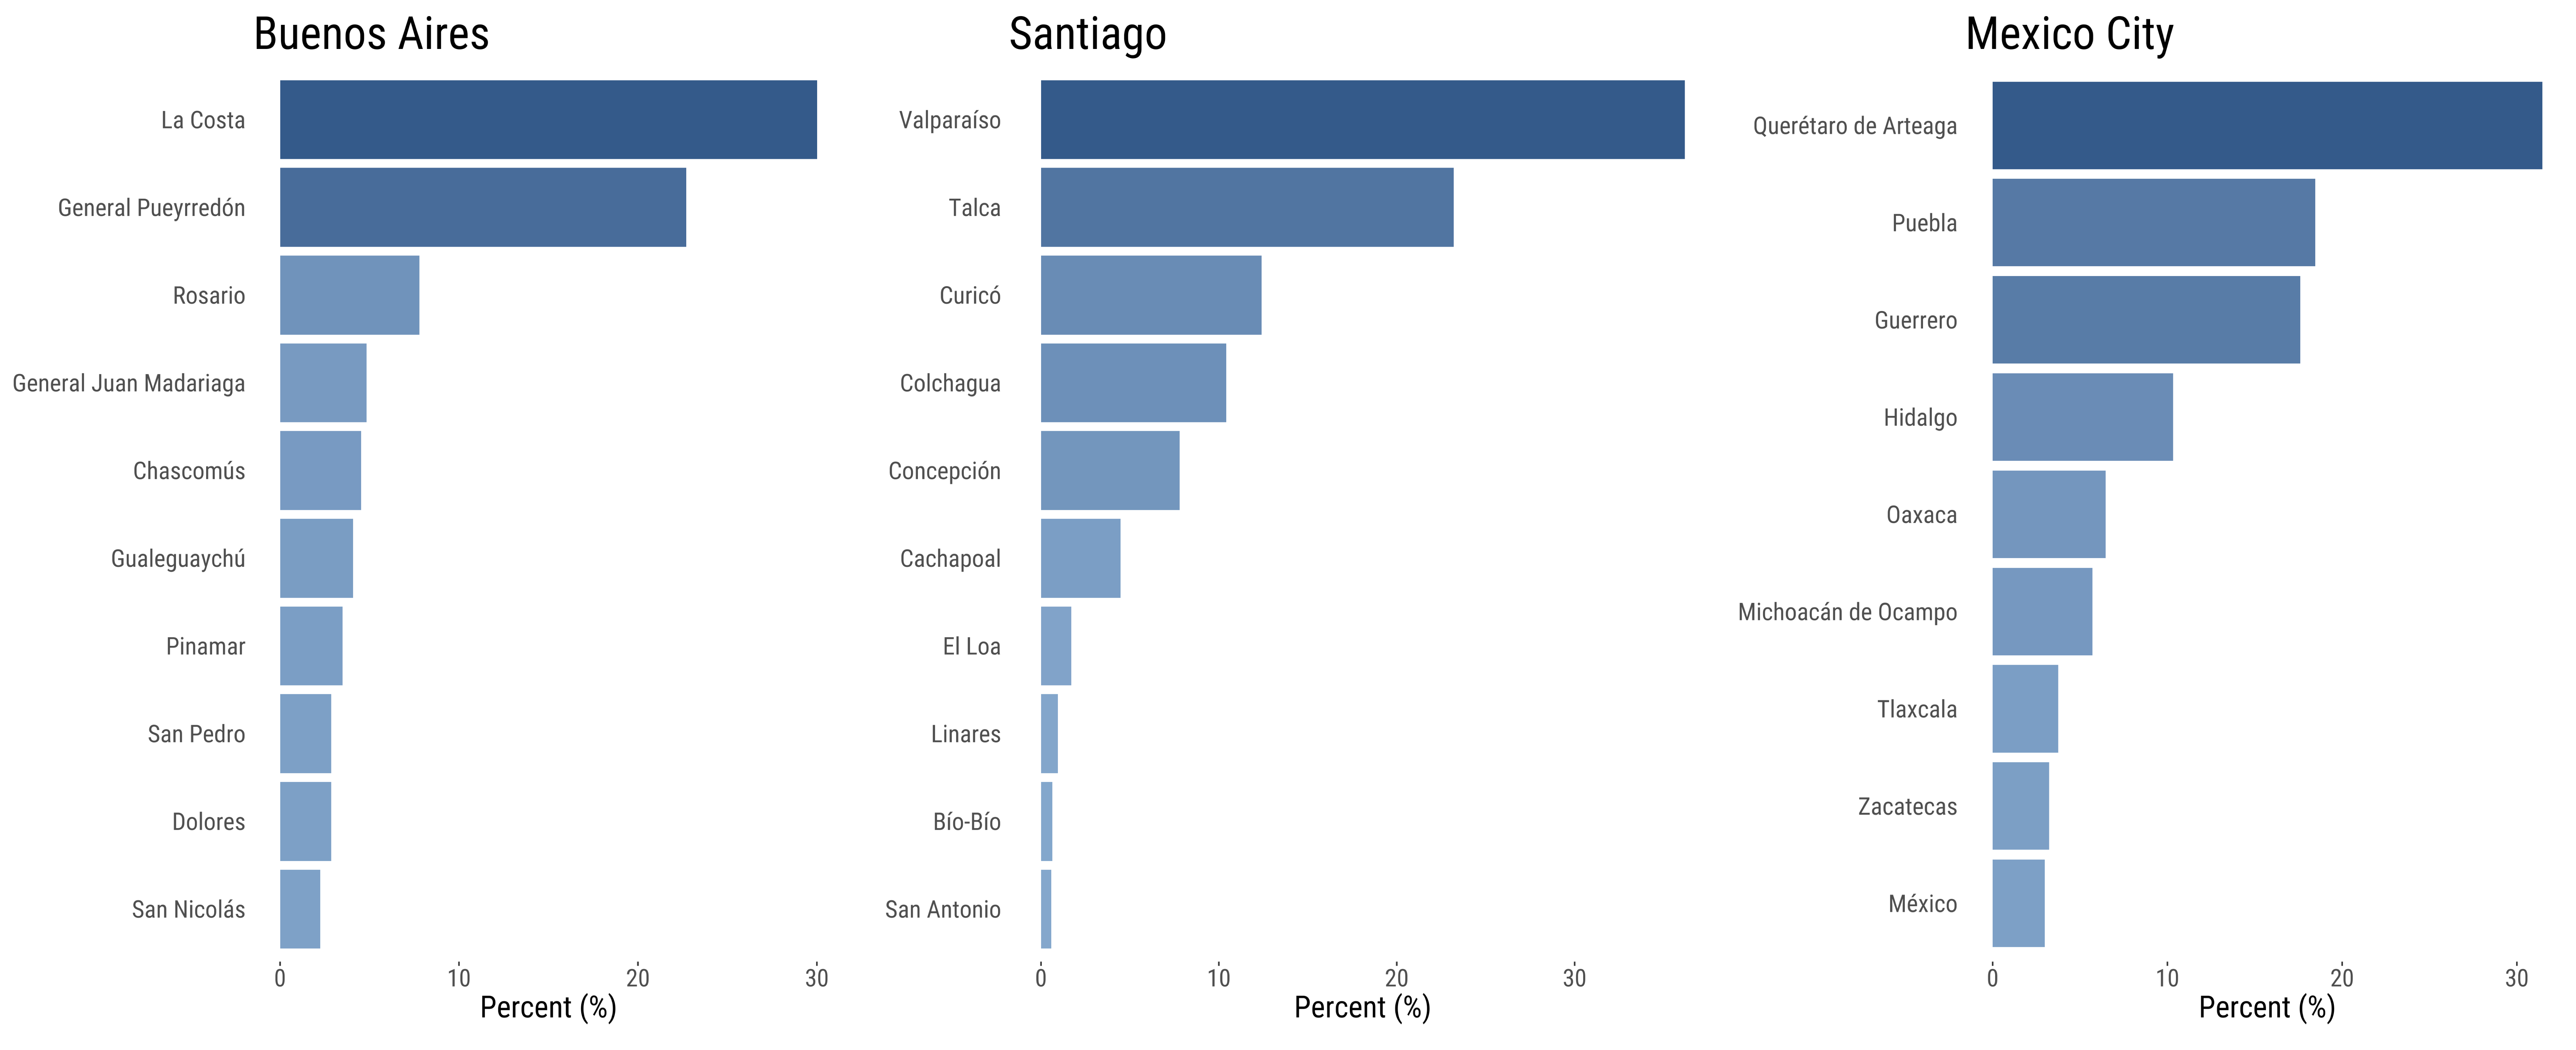
Figure 5 showed that metropolitan core areas in the three countries in our analysis have tended to record consistent positive balances of long-distance movements from early 2021. Figure 7 reports the top ten areas of origins for these flows in March 2020, revealing that over 25% of all inflows over 100km were originated from coastal areas in Argentina and Chile and from the small central state of Querétaro in Mexico. These are known as popular tourism destination suggesting that these flows may reflect temporary moves made to second or holiday homes by capital city residents during the pandemic. Contrary to early speculations of the death of cities, this pattern also highlights the resilience of cities to endure crises and as a key engine of economic growth, innovation and prosperity, attracting population from long distances.
6 Discussion
6.1 Key findings
Emerging evidence has indicated that the COVID-19 pandemic resulted in a urban exodus from large cities in developed countries. Anecdotal evidence has suggested that a similar pattern occurred in Latin American countries. However, lack of access to suitable data has prevented the analysis of changes in internal population movements over the pandemic. Drawing on location data from Meta-Facebook users, we sought to analyse the extent and durability of changes in internal population movements across the rural–urban hierarchy in Argentina, Chile and Mexico during the COVID-19 pandemic from March 2020 to May 2022. We found evidence of an overall systematic decline in the level of population internal movement during the enactment of nonpharmaceutical interventions in May 2020 across all three countries. We showed that declines occurred across the rural-urban continuum for movements over both short and long distances. The largest reductions occurred in the most dense areas of Argentina, Chile and Mexico. Average levels of declines in less dense areas were less pronounced as a large number of them recorded rises mobility levels. We also revealed that the intensity of mobility bounced back closer to pre-pandemic levels in May 2022 following the relaxation of COVID-19 stringency measures. Yet, the intensity of movement remained below pre-pandemic levels in many areas.
Additionally, we presented evidence of sustained negative net balances of movements under 100km in the highest density areas of Argentina and Mexico during 2020 and 2022, particularly since July 2020. At the same time, we identified a positive net balance of movements for distances under 100km in areas of low and moderate population density. In Chile, population redistribution for movements under 100km is limited across the urban hierarchy, except for moderately high density areas. These patterns differ from those observed for movements over 100km. In all three countries, the most dense areas registered overall positive net balances of movements over 100km particularly from early 2021. Only in Chile, we found evidence of a negative net balance for movements over 100km in the hightest density areas during 2020, when COVID-19 began spreading throughout the country and stringency measures were enforced. The patterns of population redistribution at lower levels of the urban hierarchy varied by country. In Argentina, we observed moderate negative net balances of movements over 100km in dense areas. In Chile, a pronounced and growing negative net balance for these movements occurred in highly dense areas around the Santiago Metropolitan Area and neighbouring cities. In Mexico, large negative net balances were recorded in low density areas.
6.2 Interpretation
Our findings suggest that levels of internal population movement over both short and long distances declined in 2020 and remained below pre-pandemic levels in May 2022. In Chile, seasonality in mobility patterns may prompt these conclusions as the pre-pandemic baseline coincides with the national period of summer holidays when levels of internal movements over long distances are typically higher than during the rest of the year. Yet, we argue that such seasonality produces a substitution effect by trading short-distance commuting moves for long-distance travel, rather than increasing overall levels of mobility across the country. Additionally, we argue that hybrid forms of working that emerged during the height of the pandemic may have had a continuing effect on internal population movements in the three countries in our analysis. Hybrid working may have precipitated a secular trend of internal migration decline which was in motion before the pandemic (Martin Bell et al. 2017), and led to reduced rates of mobility in many countries during COVID-19 (Rowe, González-Leonardo, and Champion 2023). Furthermore, global analyses indicate that hybrid working is thus expected to reduce the need for daily commuting travel and living in close proximity to work places (Barrero, Bloom, and Davis 2021; Aksoy et al. 2022). Hybrid working has become a new future of our working life as stigma associated with working from home has diminished (Aksoy et al. 2022). Large investments on working environments to enable hybrid work have been made; and, working-from-home experiences in terms of productivity and work-life balance have been better than expected (Barrero, Bloom, and Davis 2021; Aksoy et al. 2022).
Additionally, our study lends some support for the theory of an urban exodus providing evidence of negative net balances of movements in the most dense areas of capital cities. These patterns are consistent with ‘the donut effect’ identified by Ramani and Bloom (2021) to describe net population losses in dense city centres in most US metropolitan areas during ealy stages of the COVID-19 pandemic. In Argentina, Chile and Mexico, distinct processes seem to have underpinned these patterns of negative net balances. In Argentina, sustained negative balances in highly dense areas were associated with short-distance movements, likely reflecting a pattern of suburbanisation in the metropolitan area of Buenos Aires. In Mexico, the pattern of negative balances were also associated with short-distance moves but extended to a wider set of highly dense areas around the metropolitan area of Mexico City, and generated positive balances of moves in sparsely populated areas, suggesting a pattern of counterurbanisation. In Chile, negative balances in highly dense areas of the metropolitan area of Santiago were underpinned by long-distance moves. These losses were however temporary, switching to neutral and positive balances in 2021 and 2022.
Overall, we contributed to expanding existing evidence on the impact of COVID-19 on the levels and spatial patterns of internal population movement. Existing work has focused on developed countries and restricted to the immediate effects of COVID-19 analysing data from 2020. The cumulative evidence suggest that the levels of human mobility declined in 2020, that large cities lost population through internal migration, and that suburbs and rural areas experienced population gains. To our knowledge, only two studies have analysed data extending to 2021 for Spain (González-Leonardo and Rowe 2022) and Britain (Rowe et al. 2022). In Spain, large cities continued to report population losses through internal migration. In Britain, low and high density areas returned to display net balances of movement similar to those observed before the COVID-19 pandemic.
We expanded the existing evidence by investigating the patterns of internal population movement in Latin America over a period stretching from March 2020 to May 2022. Our evidence suggests that negative balances of moves in highly dense areas and large cities recorded for various countries in 2020 may have persisted over 2021 and 2022, as we documented for short-distance moves in Argentina and Mexico. They suggest a structural change from a core city preference for suburban and less populated areas. Though, this seemed to be shifting back in Argentina. Alternatively, our findings suggest that population losses due to long-distance movement in highly dense areas in the metropolitan area of Santiago were short-lived, shifting to neutral and positive balances over 2021 and 2022. Contrary to the initial expectations of apocalyptic headlines - ‘empty cities’, ‘dead cities’, ‘ghost cities’, ‘deserted cities’ and ‘silent cities’- on the media, the evidence emerging from Chile attests the attraction of cities to absorb population. Economies agglomeration in dense urban spaces are likely to continue to facilitate and foster knowledge exchange, innovation and economic growth (Storper and Venables 2004). At the same time, digital infrastructure in rural locales of Latin American countries remain deficient (Pick, Sarkar, and Parrish 2020), representing a major challenge to permanently relocate to these areas.
6.3 Limitations and future work
We distinguished between short- and long-distance moves. Typically short-distance moves are typically used to capture local residential and routine moves, and long-distance moves are used to account for more permanent and infrequent moves, such as internal migration (Owen and Green 1992). However, we cannot identify moves involving permanent changes of residential address. Our data capture these movements but also include frequent and daily travel behaviour, such as commuting and shopping trips. Future work could extend and validate our work identifying changes to moves relating permanent and temporary displacements, and triangulating alternative DFD and traditional data sources, such as censuses and representative surveys collecting information on residential location.
We focused on analysing the levels and spatial patterns of internal population movement. Available evidence from the Global North suggests systematic differences in the mobility patterns of more and less socio-economically advantaged individuals during the early stages of the pandemic (Gauvin et al. 2021; Long and Ren 2022; Santana et al. 2023). While empirical evidence is lacking, existing findings suggest that more socio-economically advantaged individuals seem to have been able to relocate more “permanently” away from large and dense urban areas during the height of the pandemic (Gauvin et al. 2021). They are more likely to have second or holidays homes and have jobs which can be done remotely. Less socio-economically advantaged individuals were less able to relocate away from their home as they are more likely to work on less well paid service jobs requiring face-to-face interaction (Santana et al. 2023). Drawing on area-level population attributes, future work could investigate the occurrence and persistence of these patterns in Global South countries where socio-economic inequalities are more acute (Qureshi 2023).
Further research is also needed to establish the cause of the observed changes in the spatial patterns of internal population movement since the start of the COVID-19 pandemic. Understanding these causes can assist in anticipating long-term structural changes in the direction of mobility flows in the coming years. A combination of factors, including social distancing, business shutdowns, school closures, telework and unemployment, have all been cited as key forces recasting preexisting patterns of population movement in the early stages of the pandemic. While some of these factors vanished as COVID-19 restrictions were relaxed, others such as telework has endured the pandemic (Aksoy et al. 2022). Determining the extent to which forms and workers have and will continue to adopt remote work will be key to understand future residential and mobility choices within and away from large and dense urban areas.
Additionally, accessing and working with DFD to measure human mobility and migration is challenging. DFD are known to suffer from biases and issues of statistical representation reflecting differences in technology usage and accessibility (Rowe 2023). While concerted efforts to develop data services and methodological frameworks to leverage on DFD exist in the Global North [REF], limited progress has been done in Latin America. National government and statistical agencies have a prime position to promote the creation of data sharing partnerships with private companies and create the digital infrastructure to ensure equal and secure access to DFD sources for the social good. With academia, these agencies could play a major role in promoting the creation of a methodological framework for the use and analysis of DFD, setting common definitions, metrics, and standard approaches to measure and correct data biases and validate data analyses. Location data have been proven key to monitor and develop appropriate policy responses to population displacement and movement during natural disasters, wars and epidemics (Green, Pollock, and Rowe 2021). We envision resources like those created by the European Commission Joint Research Centre (2022) and the UNSD (2019), identifying sources of non-traditional data and establishing methodological guidelines for the use of mobile phone data for official mobility statistics. Existing resources have a global character, we call for initiatives with a regional focus accounting for differences in the local landscape of data availability and digital technology usage.
7 Conclusion
The COVID-19 pandemic significantly altered civil liberties and the ways people move in 2020. Over the last two years, research has been undertaken to understand the immediate impacts of the COVID-19 pandemic on human mobility particularly in the Global North. Limited research has focused on understanding the persistence of the impacts of the COVID-19 pandemic beyond 2020 in the Global South context, primarily due to the lack of suitable data. Drawing on aggregate anonymised mobile phone data, we examined the extent and durability of changes in the levels and spatial patterns of internal population movement across the rural-urban continuum in Argentina, Chile and Mexico over a 26-month period from March 2020 to May 2022. We presented evidence of an overall systematic decline in the level of short- and long-distance movement during the enactment of nonpharmaceutical interventions in 2020, with the largest reductions occurring in the most dense areas. While levels of movements recovered and moved closer to pre-pandemic levels in 2022, they have remained below pre-pandemic levels. This trend aligns with a broader pattern of declining migration intensities in many industrialised countries (Martin Bell et al. 2017). Additionally we also showed evidence offering some support for the idea of an urban exodus. We found a continuing negative net balance of short-distance movements in the highly dense areas of capital cities in Argentina and Mexico, reflecting a pattern of suburbanisation. In Chile, we recorded very limited changes in the net balance of short-distance movements but we found a net loss of long-distance movements. However, these losses were temporary. Yet, our findings point to long-lasting effects of COVID-19 in Argentina and Mexico, resulting in sustained losses of movements in core metropolitan areas of capital cities and gains in suburban locations. These patterns are contrary to population gains through internal migration in cities over 1 million people in the region of Latin America and Caribbean (Rodríguez Vignoli 2017), and may reflect the enduring effect of remote work and differences in housing costs as centrifugal forces.
References
reAksoy, Cevat Giray, Jose Maria Barrero, Nicholas Bloom, Steven Davis, Mathias Dolls, and Pablo Zarate. 2022. “Working from Home Around the World.” https://doi.org/10.3386/w30446.
preAromí, Daniel, María Paula Bonel, Julian Cristia, Martín Llada, Juan Pereira, Xiomara Pulido, and Julieth Santamaria. 2023. “#StayAtHome: Social Distancing Policies and Mobility in Latin America and the Caribbean.” Economía 22 (1). https://doi.org/10.31389/eco.4.
preBarrero, Jose Maria, Nicholas Bloom, and Steven Davis. 2021. “Why Working from Home Will Stick.” https://doi.org/10.3386/w28731.
preBell, Martin, Elin Charles-Edwards, Aude Bernard, and Philipp Ueffing. 2017. “Global Trends in Internal Migration.” In Internal Migration in the Developed World, edited by T Champion, T Cooke, and I Shuttleworth, 76–97. Routledge.
preBell, M, M Blake, P Boyle, O Duke-Williams, P Rees, J Stillwell, and G Hugo. 2002. “Cross-National Comparison of Internal Migration: Issues and Measures.” Journal of the Royal Statistical Society: Series A (Statistics in Society) 165 (3): 435–64. https://doi.org/10.1111/1467-985x.00247.
preBernard, Aude, Francisco Rowe, Martin Bell, Philipp Ueffing, and Elin Charles-Edwards. 2017. “Comparing Internal Migration Across the Countries of Latin America: A Multidimensional Approach.” Edited by Osman Alimamy Sankoh. PLOS ONE 12 (3): e0173895. https://doi.org/10.1371/journal.pone.0173895.
preBorsdorf, Axel. 2003. “Cómo Modelar El Desarrollo y La Dinámica de La Ciudad Latinoamericana.” EURE (Santiago) 29 (86). https://doi.org/10.4067/s0250-71612003008600002.
preBrea, J. 2003. “Population Dynamics in Latin America.” Population Bulletin 58: 3–36. https://population.un.org/wup/Publications/Files/WUP2018-Report.pdf.
preCEPAL. 2022. “Lineamientos Generales Para La Captura de Datos Censales: Revisión de Métodos Con Miras a La Ronda de Censos de 2020.” Publicación de Las Naciones Unidas. https://repositorio.cepal.org/server/api/core/bitstreams/fa5dc0a5-9003-4ee2-95a0-bc3bd7e531be/content.
preChampion, Tony, and Hugo Graeme. 2004. New Forms of Urbanization: Beyond the Urban-Rural Dichotomy. Routledge.
preChávez Galindo, Ana María, Jorge Rodríguez Vignoli, Mario Acuña, Jorge Barquero, Daniel Macadar, José Marcos Pinto da Cunha, and Jaime Sobrino. 2016. “Migración Interna y Cambios Metropolitanos.” Revista Latinoamericana de Población 10 (18): 7–41. https://doi.org/10.31406/relap2016.v10.i1.n18.1.
preElejalde, Erick, Leo Ferres, Víctor Navarro, Loreto Bravo, and Emilio Zagheni. 2023. “The Social Stratification of Internal Migration and Daily Mobility During the COVID-19 Pandemic.” https://doi.org/10.48550/ARXIV.2309.11062.
preEuropean Commission Joint Research Centre. 2022. Data innovation in demography, migration and human mobility. LU: Publications Office. https://doi.org/10.2760/027157.
preFielding, Tony, and Yoshitaka Ishikawa. 2021. “COVID-19 and Migration: A Research Note on the Effects of COVID-19 on Internal Migration Rates and Patterns in Japan.” Population, Space and Place 27 (6). https://doi.org/10.1002/psp.2499.
preFirebaugh, Glenn. 1979. “Structural Determinants of Urbanization in Asia and Latin America, 1950- 1970.” American Sociological Review 44 (2): 199. https://doi.org/10.2307/2094505.
preFlorida, Richard, Andrés Rodríguez-Pose, and Michael Storper. 2021. “Critical Commentary: Cities in a Post-COVID World.” Urban Studies 60 (8): 1509–31. https://doi.org/10.1177/00420980211018072.
preGauvin, Laetitia, Paolo Bajardi, Emanuele Pepe, Brennan Lake, Filippo Privitera, and Michele Tizzoni. 2021. “Socio-Economic Determinants of Mobility Responses During the First Wave of COVID-19 in Italy: From Provinces to Neighbourhoods.” Journal of The Royal Society Interface 18 (181): 20210092. https://doi.org/10.1098/rsif.2021.0092.
preGhosh, Somenath, Pallabi Seth, and Harsha Tiwary. 2020. “How Does Covid-19 Aggravate the Multidimensional Vulnerability of Slums in India? A Commentary.” Social Sciences & Humanities Open 2 (1): 100068. https://doi.org/10.1016/j.ssaho.2020.100068.
preGinsburg, Carren, Mark A. Collinson, F. Xavier Gómez-Olivé, Sadson Harawa, Chantel F. Pheiffer, and Michael J. White. 2022. “The Impact of COVID-19 on a Cohort of Origin Residents and Internal Migrants from South Africa’s Rural Northeast.” SSM - Population Health 17 (March): 101049. https://doi.org/10.1016/j.ssmph.2022.101049.
preGonzález Ollino, Daniela, and Jorge Rodríguez Vignoli. 2006. “Spatial Redistribution and Internal Migration of the Populationin Chile over the Past 35 Years (1965-20).” Estudios Demográficos y Urbanos 21 (2): 369. https://doi.org/10.24201/edu.v21i2.1253.
preGonzález-Leonardo, Miguel, Antonio López-Gay, Niall Newsham, Joaquín Recaño, and Francisco Rowe. 2022. “Understanding Patterns of Internal Migration During the COVID-19 Pandemic in Spain.” Population, Space and Place 28 (6). https://doi.org/10.1002/psp.2578.
preGonzález-Leonardo, Miguel, and Francisco Rowe. 2022. “Visualizing Internal and International Migration in the Spanish Provinces During the COVID-19 Pandemic.” Regional Studies, Regional Science 9 (1): 600–602. https://doi.org/10.1080/21681376.2022.2125824.
preGonzález-Leonardo, Miguel, Francisco Rowe, and Alberto Fresolone-Caparrós. 2022. “Rural Revival? The Rise in Internal Migration to Rural Areas During the COVID-19 Pandemic. Who Moved and Where?” Journal of Rural Studies 96 (December): 332–42. https://doi.org/10.1016/j.jrurstud.2022.11.006.
preGonzález-Leonardo, Miguel, Francisco Rowe, and Arturo Vegas-Sánchez. 2023. “A ‘Donut Effect’? Assessing Housing Transactions During COVID-19 Across the Spanish Rural–urban Hierarchy.” Regional Studies, Regional Science 10 (1): 471–73. https://doi.org/10.1080/21681376.2023.2191684.
preGraizbord, Boris, and Beatriz Acuña. 2007. “Movilidad Residencial En La Ciudad de México / Residential Mobility in Mexico City.” Estudios Demográficos y Urbanos 22 (2): 291. https://doi.org/10.24201/edu.v22i2.1281.
preGreen, Mark, Frances Darlington Pollock, and Francisco Rowe. 2021. “New Forms of Data and New Forms of Opportunities to Monitor and Tackle a Pandemic.” In, 423–29. Springer International Publishing. https://doi.org/10.1007/978-3-030-70179-6_56.
preHale, Thomas, Noam Angrist, Rafael Goldszmidt, Beatriz Kira, Anna Petherick, Toby Phillips, Samuel Webster, et al. 2021. “A Global Panel Database of Pandemic Policies (Oxford COVID-19 Government Response Tracker).” Nature Human Behaviour 5 (4): 529–38. https://doi.org/10.1038/s41562-021-01079-8.
preHaslag, Peter H., and Daniel Weagley. 2021. “From L.A. To Boise: How Migration Has Changed During the COVID-19 Pandemic.” SSRN Electronic Journal. https://doi.org/10.2139/ssrn.3808326.
preIrudaya Rajan, S., P. Sivakumar, and Aditya Srinivasan. 2020. “The COVID-19 Pandemic and Internal Labour Migration in India: A ‘Crisis of Mobility’.” The Indian Journal of Labour Economics 63 (4): 1021–39. https://doi.org/10.1007/s41027-020-00293-8.
preJanoschka, Michael. 2002. “El Nuevo Modelo de La Ciudad Latinoamericana: Fragmentación y Privatización.” EURE (Santiago) 28 (85). https://doi.org/10.4067/s0250-71612002008500002.
preJenks, George F. 1967. “The Data Model Concept in Statistical Mapping.” International Yearbook of Cartography 7: 186–90.
preKotsubo, Masaki, and Tomoki Nakaya. 2022. “Trends in Internal Migration in Japan, 2012–2020: The Impact of the COVID-19 Pandemic.” Population, Space and Place 29 (4). https://doi.org/10.1002/psp.2634.
preLattes, A. 1995. “Urbanización, Crecimiento Urbano y Migraciones En América Latina. Población y Desarrollo: Tendencias y Desafíos.” Notas de Población 62: 211–60. https://repositorio.cepal.org/handle/11362/38594.
preLattes, Alfredo E., Jorge Rodríguez, and Miguel Villa. 2017. “Population Dynamics and Urbanization in Latin America: Concepts and Data Limitations.” In, 89–111. Routledge. https://doi.org/10.4324/9781315248073-5.
preLong, Jed A., and Chang Ren. 2022. “Associations Between Mobility and Socio-Economic Indicators Vary Across the Timeline of the Covid-19 Pandemic.” Computers, Environment and Urban Systems 91 (January): 101710. https://doi.org/10.1016/j.compenvurbsys.2021.101710.
preLucchini, Lorenzo, Ollin Langle-Chimal, Lorenzo Candeago, Lucio Melito, Alex Chunet, Aleister Montfort, Bruno Lepri, Nancy Lozano-Gracia, and Samuel P. Fraiberger. 2023. “Socioeconomic Disparities in Mobility Behavior During the COVID-19 Pandemic in Developing Countries.” https://doi.org/10.48550/ARXIV.2305.06888.
preMaas, P., S. Iyer, A. Gros, W. Park, L. McGorman, C. Nayak, and P. A. Dow. 2019. “Facebook Disaster Maps: Aggregate Insights for Crisis Response and Recovery.” In 16th International Conference on Information Systems for Crisis Response and Management, 836–47.
preMarsh, Sarah. 2020. “Escape to the Country: How Covid Is Driving an Exodus from Britain’s Cities.” The Guardian 26: 2020.
preMicrosoft. “Bing Maps Tile System - Bing Maps.” https://learn.microsoft.com/en-us/bingmaps/articles/bing-maps-tile-system.
preNathan, Max, and Henry Overman. 2020. “Will Coronavirus Cause a Big City Exodus?” Environment and Planning B: Urban Analytics and City Science 47 (9): 1537–42. https://doi.org/10.1177/2399808320971910.
preNations", "United. 2019. “World Urbanization Prospects. The 2018 Revision.” https://population.un.org/wup/Publications/Files/WUP2018-Report.pdf.
preNiedomysl, Thomas. 2011. “How Migration Motives Change over Migration Distance: Evidence on Variation Across Socio-Economic and Demographic Groups.” Regional Studies 45 (6): 843–55. https://doi.org/10.1080/00343401003614266.
preNouvellet, Pierre, Sangeeta Bhatia, Anne Cori, Kylie E. C. Ainslie, Marc Baguelin, Samir Bhatt, Adhiratha Boonyasiri, et al. 2021. “Reduction in Mobility and COVID-19 Transmission.” Nature Communications 12 (1). https://doi.org/10.1038/s41467-021-21358-2.
preOwen, D, and A Green. 1992. “Migration Patterns and Trends.” In Migration Processes and Patterns: Research Progress and Prospects, edited by T Champion and T Fielding. Belhaven Press.
prePaybarah, Azi, Matthew Bloch, and Scott Reinhard. 2020. “Where New Yorkers Moved to Escape Coronavirus.” The New York Times 16.
prePerales, Francisco, and Aude Bernard. 2022. “Continuity or Change? How the Onset of COVID-19 Affected Internal Migration in Australia.” Population, Space and Place 29 (2). https://doi.org/10.1002/psp.2626.
prePérez-Campuzano, C., E. y Santos-Cerquera. 2013. “Tendencias Recientes de La Migración Interna En México.” "Papeles de Población" 19: 53–88. https://www.scielo.org.mx/scielo.php?script=sci_arttext&pid=S1405-74252013000200003.
prePick, James, Avijit Sarkar, and Elizabeth Parrish. 2020. “The Latin American and Caribbean Digital Divide: A Geospatial and Multivariate Analysis.” Information Technology for Development 27 (2): 235–62. https://doi.org/10.1080/02681102.2020.1805398.
prePinto da Cunha, J. M. P. 2002. “Urbanización, Redistribución Espacial de La Población y Transformaciones Socioeconómicas En América Latina.” United Nations. https://repositorio.cepal.org/bitstream/handle/11362/7168/1/S029663_es.pdf.
prePomeroy, Robin, and Ross Chiney. 2021. “Has COVID Killed Our Cities? World Economic Forum.” https://www.weforum.org/agenda/2020/11/cities-podcast-new-york-dead/.
preQureshi, Zia. 2023. “Rising Inequality: A Major Issue of Our Time.”
preRamani, Arjun, and Nicholas Bloom. 2021. “The Donut Effect of Covid-19 on Cities.” https://doi.org/10.3386/w28876.
preRodríguez Vignoli, Jorge, and Francisco Rowe. 2017. “¿Contribuye La Migración Interna a Reducir La Segregación Residencial?” Revista Latinoamericana de Población 11 (21): 7–45. https://doi.org/10.31406/relap2017.v11.i2.n21.1.
preRodríguez-Vignoli, Jorge, and Francisco Rowe. 2018. “How Is Internal Migration Reshaping Metropolitan Populations in Latin America? A New Method and New Evidence.” Population Studies 72 (2): 253–73. https://doi.org/10.1080/00324728.2017.1416155.
preRodríguez Vignoli, Jorge. 2017. “Migración Interna y Asentamientos Humanos En América Latina y El Caribe (1990-2010).” https://repositorio.cepal.org/items/87177405-76af-475e-a730-118841674013.
pre———. 2019. “Efectos Cambiantes de La Migración Sobre El Crecimiento, La Estructura Demográfica y La Segregación Residencial En Ciudades Grandes: El Caso de Santiago, Chile, 1977-2017.” Población y Desarrollo. https://hdl.handle.net/11362/44367.
preRowe, Francisco. 2023. “Big Data.” In Concise Encyclopedia of Human Geography, 42–47. Edward Elgar Publishing.
pre———. 2013. “Spatial Labour Mobility in a Transition Economy: Migration and Commuting in Chile.” PhD thesis. https://doi.org/10.14264/uql.2017.427.
preRowe, Francisco, Martin Bell, Aude Bernard, Elin Charles-Edwards, and Philipp Ueffing. 2019. “Impact of Internal Migration on Population Redistribution in Europe: Urbanisation, Counterurbanisation or Spatial Equilibrium?” Comparative Population Studies 44 (November). https://doi.org/10.12765/cpos-2019-18.
preRowe, Francisco, Alessia Calafiore, Daniel Arribas-Bel, Krasen Samardzhiev, and Martin Fleischmann. 2022. “Urban Exodus? Understanding Human Mobility in Britain During the COVID-19 Pandemic Using Meta-Facebook Data.” Population, Space and Place 29 (1). https://doi.org/10.1002/psp.2637.
preRowe, Francisco, Miguel González-Leonardo, and Tony Champion. 2023. “Virtual Special Issue: Internal Migration in Times of COVID-19.” Population, Space and Place, March. https://doi.org/10.1002/psp.2652.
preRowe, Francisco, Caitlin Robinson, and Nikos Patias. 2022. “Sensing Global Changes in Local Patterns of Energy Consumption in Cities During the Early Stages of the COVID-19 Pandemic.” Cities 129 (October): 103808. https://doi.org/10.1016/j.cities.2022.103808.
preSantana, Clodomir, Federico Botta, Hugo Barbosa, Filippo Privitera, Ronaldo Menezes, and Riccardo Di Clemente. 2023. “COVID-19 Is Linked to Changes in the Time–space Dimension of Human Mobility.” Nature Human Behaviour, July. https://doi.org/10.1038/s41562-023-01660-3.
preSobrino, J. 2012. “La Urbanización En El México Contemporáneo.” Notas de Población 94: 93–122. https://repository.eclac.org/handle/11362/12898.
preSobrino, Jaime. 2006. “Comptetitiveness and Employment in the Largest Metropolitan Areas of Mexico.” In, 309–54. El Colegio de México. https://doi.org/10.2307/j.ctv3dnrw3.15.
preStawarz, Nico, Matthias Rosenbaum-Feldbrügge, Nikola Sander, Harun Sulak, and Vanessa Knobloch. 2022. “The Impact of the COVID-19 Pandemic on Internal Migration in Germany: A Descriptive Analysis.” Population, Space and Place 28 (6). https://doi.org/10.1002/psp.2566.
preStorper, M., and A. J. Venables. 2004. “Buzz: Face-to-Face Contact and the Urban Economy.” Journal of Economic Geography 4 (4): 351–70. https://doi.org/10.1093/jnlecg/lbh027.
preTatem, Andrew J. 2017. “WorldPop, Open Data for Spatial Demography.” Scientific Data 4 (1). https://doi.org/10.1038/sdata.2017.4.
preTønnessen, Marianne. 2021. “Movers from the City in the First Year of Covid.” Nordic Journal of Urban Studies 1 (2): 131–47. https://doi.org/10.18261/issn.2703-8866-2021-02-03.
preUNSD. 2019. “Handbook on the Use of Mobile Phone Data for Official Statistics.”
preVogiazides, Louisa, and Juta Kawalerowicz. 2022. “Internal Migration in the Time of Covid: Who Moves Out of the Inner City of Stockholm and Where Do They Go?” Population, Space and Place 29 (4). https://doi.org/10.1002/psp.2641.
preWang, Yikang, Chen Zhong, Qili Gao, and Carmen Cabrera-Arnau. 2022. “Understanding Internal Migration in the UK Before and During the COVID-19 Pandemic Using Twitter Data.” Urban Informatics 1 (1). https://doi.org/10.1007/s44212-022-00018-w.
p