Respiratory Anomaly Detection using
Reflected Infrared Light-wave Signals
††thanks: This work was supported by the National Science Foundation under Grant 2008556.
††thanks: This work has been submitted to the IEEE for possible publication. Copyright may be transferred without notice, after which this version may no longer be accessible.
Abstract
In this study, we present a non-contact respiratory anomaly detection method using incoherent light-wave signals reflected from the chest of a mechanical robot that can breathe like human beings. In comparison to existing radar and camera-based sensing systems for vitals monitoring, this technology uses only a low-cost ubiquitous light source (e.g., infrared light emitting diode) and sensor (e.g., photodetector). This light-wave sensing (LWS) system recognizes different breathing anomalies from the variations of light intensity reflected from the chest of the robot within a 0.5 m-1.5 m range. The anomaly detection model demonstrates up to 96.6% average accuracy in classifying 7 different types of breathing data using machine learning. The model can also detect faulty data collected by the system that does not contain breathing information. The developed system can be utilized at home or healthcare facilities as a smart, non-contact and discreet respiration monitoring method.
Index Terms:
Non-contact vitals monitoring, respiration monitoring, light-wave sensing, anomaly detection, signal classification.I Introduction
Human respiratory rate and its pattern convey useful information about the physical and mental states of the subject. Anomalous breathing can be a symptom of fatal health problems like asthma, obstructive sleep apnea, bronchitis, emphysema, lung cancer, chronic obstructive pulmonary disease, COVID-19 etc. It can also be a precursor of unstable mental conditions including stress, panic, anxiety, fatigue, anger etc. Contact-based monitoring is not effective enough in capturing the true essence of one’s breathing, because people may undergo a shift in breathing pattern when they know that they are being monitored. Moreover, the subject might be too young or too ill (patients affected by contagious diseases, patients in burn unit etc.) to apply contact-based approaches for longer duration. Existing automated technologies for non-contact breathing monitoring are typically based on sensing electromagnetic signals (i.e., radar [1, 2, 3, 4, 5, 6, 7, 8], WiFi [9, 10, 11, 12] etc.) or extracting breathing information from videos and images captured by RGB [13, 14, 15, 16, 17, 18, 19, 20] or thermal infrared cameras [21, 22, 23, 24, 25, 26].
We have developed a non-contact respiration monitoring and anomaly detection system that is based on sensing incoherent infrared (IR) light reflected from the subject’s chest. This technology is superior to existing technologies because of the safe, ubiquitous and discreet nature of infrared light and the absence of privacy issues as there are with camera-based approaches. The main functional components of the system include the LWS hardware, the signal processing and feature extraction algorithms, and the classification algorithms. Infrared LED sources are used to illuminate the subject’s chest. The reflected intensity of the light varies with the movement of the chest and is captured and converted into an electrical voltage by a commercially-available photodetector. The collected data are processed to extract features using signal processing algorithms and then classified by using machine learning models.
The remainder of this manuscript is organized as follows. Section II describes the system model including hardware setup and software algorithms to detect breathing anomalies from the collected data. Section III presents an evaluation of the proposed anomaly detection paradigm and its results. Finally, Section IV draws conclusions from the effort and forecasts future research directions.
II System Design and Implementation
II-A Experimental Setup
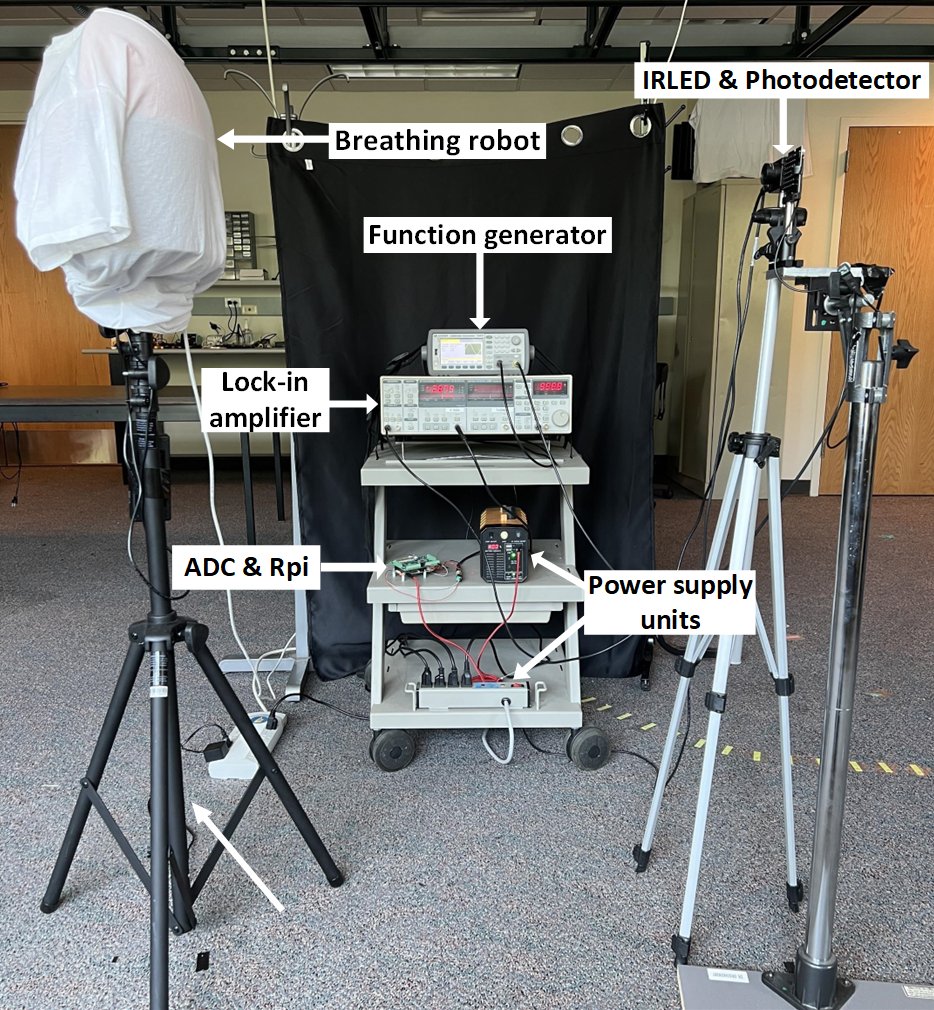
Human subjects are generally incapable of breathing with precise frequency, amplitude and patterns repeatedly. Hence, a mechanical robot that can actuate human breathing in various programmable patterns was developed and used for this study. The LWS setup consisted of infrared light sources as the transmitter, a photodetector as the receiver, a lock-in amplifier to detect breathing signals from the collected noisy data, a digital signal processing unit to convert the signal from analog to digital, and an electronic module to store the digital data. The light source was an invisible 940 nm IR lamp board (48 black LED illuminator array) having a 30 ft range and 120° wide beamwidth [27]. A commercial photodetector, Thorlabs PDA100A, was served as the receiver [28]. For lock-in detection, SR830DSP frequency lock-in amplifier [29] was used. The reference signal for the lock-in amplifier was provided by a Keysight 33500B function generator [30]. DAQC2Piplate analog-to-digital converter (ADC) [31] circuit followed by a Raspberry Pi handled the data digitization and collection. The overall experimental setup is shown in Fig. 1.
II-B Measurement Procedure Overview
In order to collect respiration data, the infrared light transmitted by the LED source was modulated using a 1 kHz sinusoidal voltage wave with 3.8 V peak-to-peak amplitude and 8.1 V DC offset from the function generator. This voltage amplitude and DC offset were chosen to ensure linear LED operation with sufficiently high light intensity. The photodetector along with a converging lens of 25.4 mm focal length was used to receive the reflected light. The gain of the photodetector was set to 40 dB. The output of the photodetector was connected to the lock-in amplifier whose time constant was set to be 100 ms. The filtered signal at the output of the lock-in amplifier was digitized by the ADC. Finally, the Raspberry Pi collected and stored the voltage amplitude data along with their timestamps using a Python script.
| \hlineB2 Class | Class name | Breathing rate (BPM) | Breathing depth (%) |
|---|---|---|---|
| 0 | Eupnea | 12-20 | 30-58 |
| 1 | Apnea | 0 | 0 |
| 2 | Tachypnea | 21-50 | 30-58 |
| 3 | Bradypnea | 1-11 | 30-58 |
| 4 | Hyperpnea | 12-20 | 59-100 |
| 5 | Hypopnea | 12-20 | 1-29 |
| 6 | Kussmaul’s | 21-50 | 59-100 |
| 7 | Faulty data | Any | Any |
| \hlineB2 |
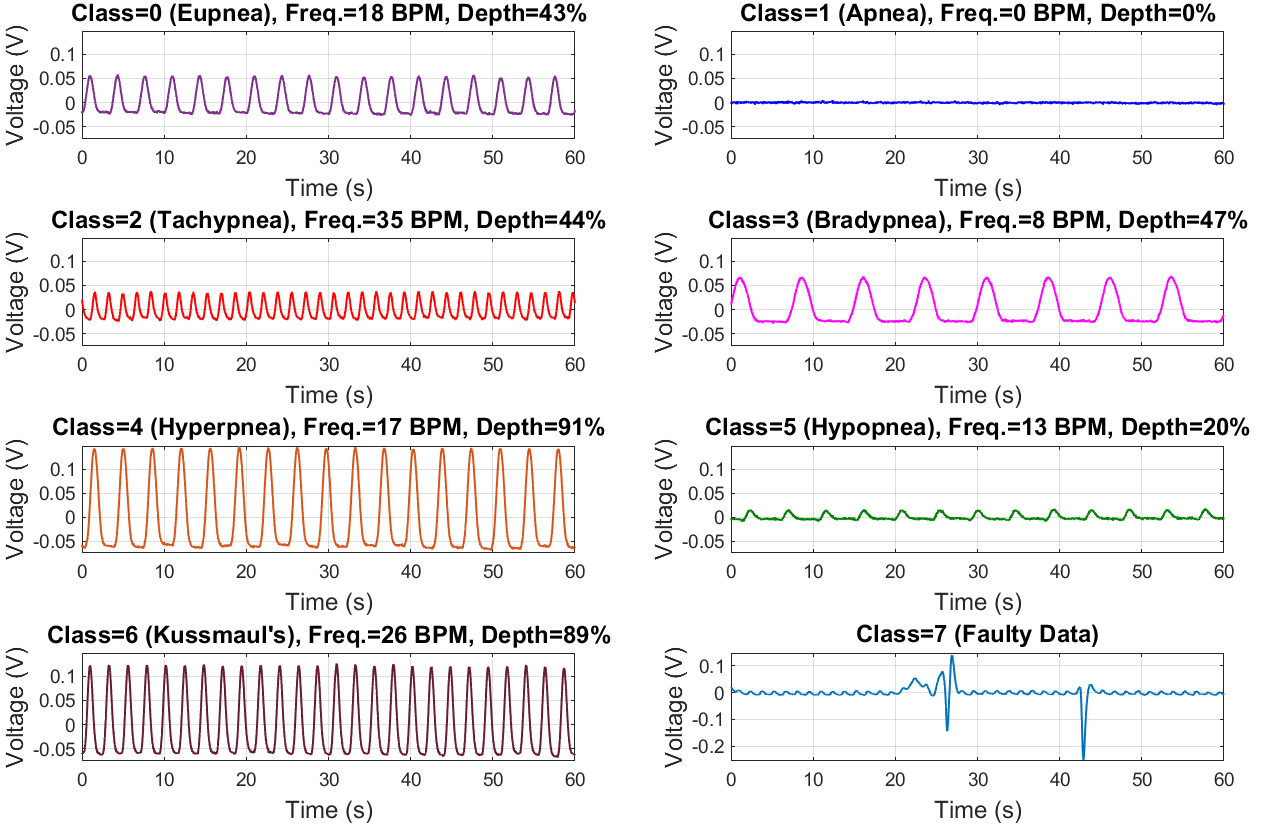
From the literature, 7 different types of human breathing were identified and their characteristics, in terms of breathing rate (frequency) and depth (amplitude)111Breathing depth is measured from the human rib cage movement and it is expressed as a percentage of the maximum movement of the rib cage [32]., were summarized in Table I [33, 7, 32, 34, 35, 21, 36, 37, 38, 39, 40, 41]. One of them (Eupnea) was normal breathing, while the rest were examples of abnormal breathing. The robot was programmed to breathe with frequencies and amplitudes in the appropriate ranges according to Table I to generate data for each class. Data for one additional class called ‘faulty data’ were generated too by manually interrupting the system or the surroundings during data collection. This class was introduced to detect erroneous data generated due to environmental noise or internal malfunction so that they can be discarded and recollected. Thus, the breathing anomaly detection problem was reduced to an eight-class classification task. waveform was found to have the closest match with human breathing, hence this pattern was used in the robot for all breathing classes. A total of 1200 data instances (150 per class) were collected during the daytime, keeping the windows of the room unshaded and internal lighting common for an office environment. Within each class, 50 instances of data were collected at 0.5 m, 1 m and 1.5 m distances each. Each data was 60 s long and collected at 100 Hz sampling frequency. All the collected data were saved in a single CSV (Comma Separated Value) file with their class labels (0 to 7) using MATLAB script for further offline processing. Fig. 2 shows the time domain representations of a few samples of raw data (one from each class, collected at 1 m distance).
II-C Data Processing and Feature Extraction
The collected data were filtered using 50 points moving average filter to reduce the noise from it. Some data were noticed to have a drift or trend in them which added unwanted low-frequency components and increased the amplitude range of the data. Hence, all data were detrended by subtracting a 5th-order polynomial trend from the data using MATLAB. The following four handcrafted features were extracted from the data:
II-C1 Peak-to-peak Amplitude
If the maximum and minimum values of the detrended data are and , then, peak-to-peak amplitude , which roughly represents a number proportional to the breathing depth.
II-C2 Breathing Rate
It is the breathing frequency expressed in breaths per minute (BPM). Discrete Fourier Transform of each detrended data was taken and the frequency index that had the highest spectral amplitude was converted to BPM and taken as the breathing rate.
II-C3 Effective Spectral Amplitude
It is the percentage count of frequencies in the spectrum of the data after detrending whose spectral amplitude is greater than or equal to a predefined threshold value. The threshold was chosen to be 20% of the peak spectral amplitude. This number helps differentiating between a very clean spectrum with just a few large peaks (which are the breathing rate and its harmonics) and a spectrum with multiple peaks of similar magnitude at various frequencies.
II-C4 Signal to Noise Ratio
Signal to noise ratio (SNR) of a signal is an indicator of the received signal quality. Noise data were collected separately for each distance using the LWS setup when the robot is not breathing. Average SNR was approximately calculated from the ratio of the root-mean-squared powers of the collected raw data signal and the noise data (after subtracting their mean values from both) and converted to decibels.
III Evaluation and Results
The extracted features from the data were fed to two machine learning models, decision tree and random forest, for breathing anomaly detection. The breathing classes, defined in Table I, were differentiated by two categorical variables (breathing rate and depth) which led to a structure like a binary tree. Random forest is an ensemble learning technique where multiple uncorrelated decision trees were used to classify the data and finally the majority vote on the class label is taken to avoid data overfitting. Hence, decision tree and random forest models yielded higher classification accuracy than other models with our breathing dataset.
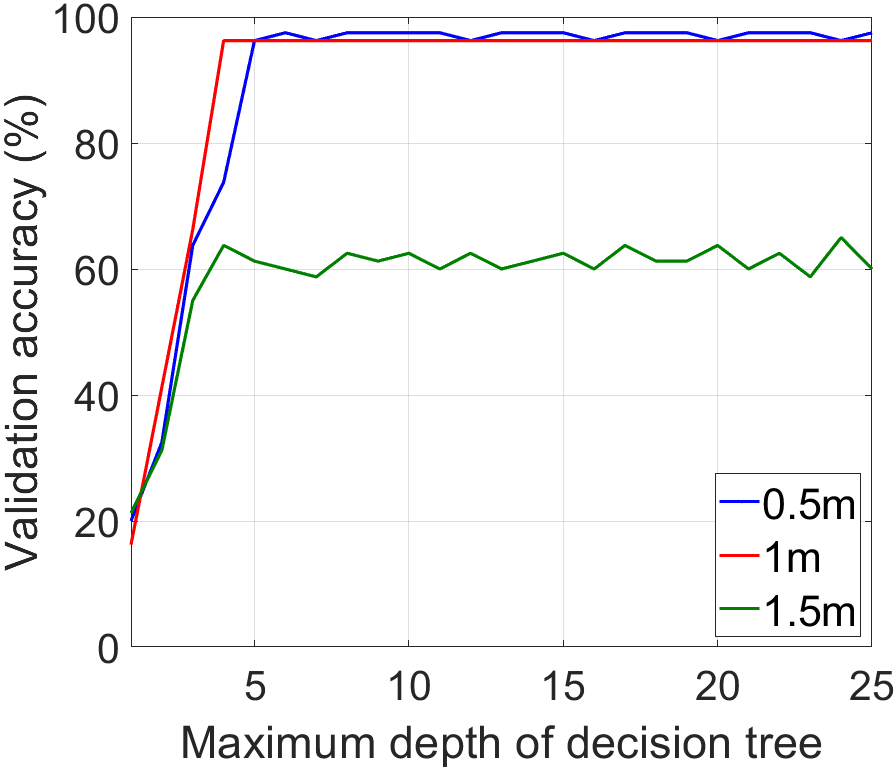
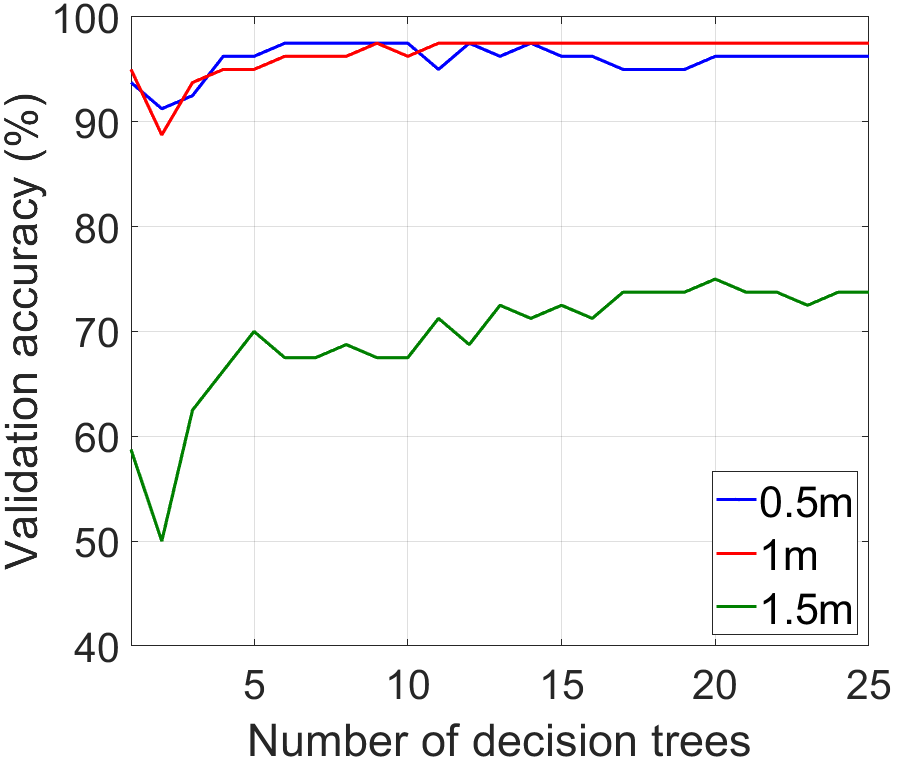
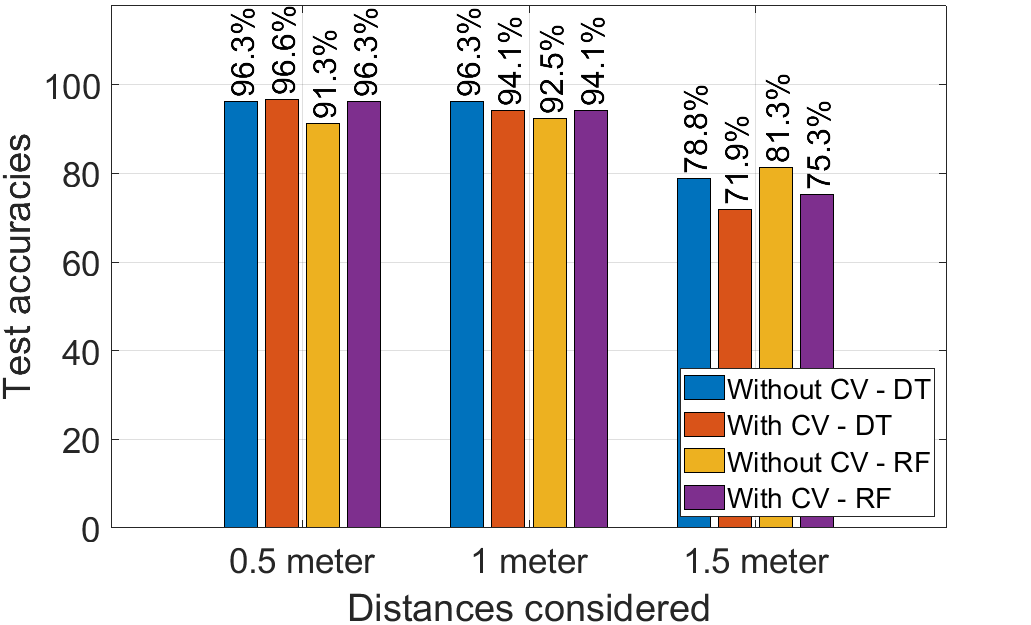
Data collected at 0.5 m, 1 m and 1.5 m were considered separately for classification, one distance at a time. The data for each distance were divided into train-validation-test sets following a ratio of 60%-20%-20%. The models were initially trained on the training dataset and tested on the validation dataset to choose the optimum hyperparameters of the models. The validation accuracies with varying hyperparameters are plotted in Fig. 3. From Fig. 3(a), the optimum value of the maximum depth of decision tree was found to be 5. Fig. 3(b) showed the optimum number of decision trees for random forest model to be 12. Models were trained using these hyperparameter values and they were tested on completely unseen test data (the rest 20%). In order to generate more robust results, 10-fold cross-validation (CV) was performed using the models by dividing the combined training and validation dataset (80% of the total amount of data) into 10 subsets and considering each of these subsets as test dataset for only once while using the rest of the subsets as training dataset. Finally, the average classification accuracies of 10 iterations were calculated.
The test accuracies, with and without cross-validation, obtained through decision tree and random forest models were presented in Fig. 4 as a bar chart. From this figure, it is evident that decision tree and random forest models both are capable of detecting breathing anomalies with classification accuracy obtained through cross-validation. Classification accuracy decreased significantly at distances longer than 1 m because of increased intra-class variances originated from the lower received light intensity and higher level of noise in the data. Random forest model performed better than a single decision tree in anomaly detection when the subject was located at 1.5 m distance from the LWS setup.
IV Conclusion and Future Directions
We have demonstrated that the infrared light-wave sensing system was able to detect faulty data and breathing anomalies with the highest accuracy of 96.6%. Random forest model was able to generate the most generalized model for classifying the data that had higher intra-class variance. Future studies can be conducted to improve the system’s performance by extracting more handcrafted features or applying deep learning techniques to extract subtle features automatically from the data for anomaly detection. The effectiveness and limitations of the system model can be further investigated by evaluating it with a more realistic dataset that had higher variances in breathing rates, depths, distances from the LWS setup and ambient conditions.
References
- [1] Y. Xiao, C. Li, and J. Lin, “Accuracy of a low-power Ka-band non-contact heartbeat detector measured from four sides of a human body,” in 2006 IEEE MTT-S International Microwave Symposium Digest, 2006, pp. 1576–1579.
- [2] Y. Xiao, J. Lin, O. Boric-Lubecke, and V. M. Lubecke, “Frequency-tuning technique for remote detection of heartbeat and respiration using low-power double-sideband transmission in the Ka-band,” IEEE Transactions on Microwave Theory and Techniques, vol. 54, no. 5, pp. 2023–2031, 2006.
- [3] D. T. Petkie, C. Benton, and E. Bryan, “Millimeter wave radar for remote measurement of vital signs,” in 2009 IEEE Radar Conference, 2009, pp. 1–3.
- [4] J. Salmi and A. F. Molisch, “Propagation parameter estimation, modeling and measurements for ultrawideband MIMO radar,” IEEE Transactions on Antennas and Propagation, vol. 59, no. 11, pp. 4257–4267, 2011.
- [5] D. Kocur, D. Novák, and J. Demčák, “A joint localization and breathing rate estimation of static persons using UWB radar,” in 2017 IEEE International Conference on Systems, Man, and Cybernetics (SMC), 2017, pp. 1728–1733.
- [6] F. Adib, H. Mao, Z. Kabelac, D. Katabi, and R. C. Miller, “Smart homes that monitor breathing and heart rate,” in Proceedings of the 33rd annual ACM conference on human factors in computing systems, 2015, pp. 837–846.
- [7] A. T. Purnomo, D. B. Lin, T. Adiprabowo, and W. F. Hendria, “Non-contact monitoring and classification of breathing pattern for the supervision of people infected by COVID-19,” Sensors, vol. 21, no. 9, pp. 1–26, 2021.
- [8] V. Dang, T. Phan, and O. Kilic, “Compressive sensing based approach for detection of human respiratory rate,” IEEE Antennas and Propagation Society, AP-S International Symposium (Digest), vol. 2015-Octob, pp. 394–395, 2015.
- [9] H. Abdelnasser, K. A. Harras, and M. Youssef, “Ubibreathe: A ubiquitous non-invasive WiFi-based breathing estimator,” in Proceedings of the 16th ACM International Symposium on Mobile Ad Hoc Networking and Computing, 2015, pp. 277–286.
- [10] Y. Gu, X. Zhang, Z. Liu, and F. Ren, “WiFi-based real-time breathing and heart rate monitoring during sleep,” in 2019 IEEE Global Communications Conference (GLOBECOM), 2019, pp. 1–6.
- [11] X. Liu, J. Cao, S. Tang, J. Wen, and P. Guo, “Contactless respiration monitoring via off-the-shelf WiFi devices,” IEEE Transactions on Mobile Computing, vol. 15, no. 10, pp. 2466–2479, 2016.
- [12] C. Chen, Y. Han, Y. Chen, H. Q. Lai, F. Zhang, B. Wang, and K. J. Liu, “TR-BREATH: Time-Reversal Breathing Rate Estimation and Detection,” IEEE Transactions on Biomedical Engineering, vol. 65, no. 3, pp. 489–501, 2018.
- [13] M. Bartula, T. Tigges, and J. Muehlsteff, “Camera-based system for contactless monitoring of respiration,” in 2013 35th Annual International Conference of the IEEE Engineering in Medicine and Biology Society (EMBC), 2013, pp. 2672–2675.
- [14] M. Kumar, A. Veeraraghavan, and A. Sabharwal, “DistancePPG: Robust non-contact vital signs monitoring using a camera,” Biomedical Optics Express, vol. 6, no. 5, p. 1565, 2015.
- [15] L. Tarassenko, M. Villarroel, A. Guazzi, J. Jorge, D. A. Clifton, and C. Pugh, “Non-contact video-based vital sign monitoring using ambient light and auto-regressive models,” Physiological Measurement, vol. 35, no. 5, pp. 807–831, 2014.
- [16] M. Villarroel, A. Guazzi, J. Jorge, S. Davis, P. Watkinson, G. Green, A. Shenvi, K. McCormick, and L. Tarassenko, “Continuous non-contact vital sign monitoring in neonatal intensive care unit,” Healthcare technology letters, vol. 1, no. 3, pp. 87–91, 2014.
- [17] M. Villarroel, J. Jorge, C. Pugh, and L. Tarassenko, “Non-contact vital sign monitoring in the clinic,” in 2017 12th IEEE International Conference on Automatic Face & Gesture Recognition (FG 2017), 2017, pp. 278–285.
- [18] M. Z. Poh, D. J. McDuff, and R. W. Picard, “Advancements in noncontact, multiparameter physiological measurements using a webcam,” IEEE Transactions on Biomedical Engineering, vol. 58, no. 1, pp. 7–11, 2011.
- [19] K. S. Tan, R. Saatchi, H. Elphick, and D. Burke, “Real-time vision based respiration monitoring system,” in 2010 7th International Symposium on Communication Systems, Networks & Digital Signal Processing (CSNDSP 2010), 2010, pp. 770–774.
- [20] J. Brieva, H. Ponce, and E. Moya-Albor, “Non-contact breathing rate monitoring system using a magnification technique and convolutional networks,” in 15th international symposium on medical information processing and analysis, vol. 11330. SPIE, 2020, pp. 181–189.
- [21] P. Jagadev and L. I. Giri, “Non-contact monitoring of human respiration using infrared thermography and machine learning,” Infrared Physics and Technology, vol. 104, 2020.
- [22] A. K. Abbas, K. Heiman, T. Orlikowsky, and S. Leonhardt, “Non-contact respiratory monitoring based on real-time IR-thermography,” in World Congress on Medical Physics and Biomedical Engineering, September 7-12, 2009, Munich, Germany. Springer, 2009, pp. 1306–1309.
- [23] D.-Y. Chen and J.-C. Lai, “HHT-based remote respiratory rate estimation in thermal images,” in 2017 18th IEEE/ACIS International Conference on Software Engineering, Artificial Intelligence, Networking and Parallel/Distributed Computing (SNPD). IEEE, 2017, pp. 263–268.
- [24] R. Murthy and I. Pavlidis, “Noncontact measurement of breathing function,” IEEE Engineering in medicine and biology magazine, vol. 25, no. 3, pp. 57–67, 2006.
- [25] P. Jakkaew and T. Onoye, “Non-contact respiration monitoring and body movements detection for sleep using thermal imaging,” Sensors (Switzerland), vol. 20, no. 21, pp. 1–14, 2020.
- [26] B. Schoun, S. Transue, A. C. Halbower, and M. H. Choi, “Non-contact comprehensive breathing analysis using thermal thin medium,” in 2018 IEEE EMBS International Conference on Biomedical and Health Informatics, BHI 2018, vol. 2018-Janua, no. March, 2018, pp. 239–242.
- [27] 940 nm IR lamp Board with Light Sensor (48 Black LED Illuminator Array). Amazon.com, Inc. Accessed on: 07-20-2022. [Online]. Available: https://www.amazon.com/gp/product/B0785W2RQQ
- [28] PDA100A. Thorlabs, Inc. Accessed on: 01-20-2022. [Online]. Available: https://www.thorlabs.com/thorproduct.cfm?partnumber=PDA100A
- [29] Lock-In Amplifier - SR810 & SR830 — 100 kHz DSP lock-in amplifiers. Stanford Research Systems. Accessed on: 03-17-2022. [Online]. Available: https://www.thinksrs.com/products/sr810830.html
- [30] 33500B and 33600A Series Trueform Waveform Generators (20, 30, 80, 120 MHz), Keysight Technologies. [Online]. Available: https://www.keysight.com/us/en/assets/7018-05928/data-sheets/5992-2572.pdf
- [31] DAQC2plate. Pi-Plates. Accessed on: 10-7-2022. [Online]. Available: https://pi-plates.com/daqc2r1/
- [32] V. F. Parreira, C. J. Bueno, D. C. França, D. S. Vieira, D. R. Pereira, and R. R. Britto, “Breathing pattern and thoracoabdominal motion in healthy individuals: influence of age and sex.” Revista brasileira de fisioterapia (São Carlos (São Paulo, Brazil)), vol. 14, pp. 411–416, 2010.
- [33] C. Barbosa Pereira, X. Yu, M. Czaplik, V. Blazek, B. Venema, and S. Leonhardt, “Estimation of breathing rate in thermal imaging videos: a pilot study on healthy human subjects,” Journal of Clinical Monitoring and Computing, vol. 31, no. 6, pp. 1241–1254, 2017.
- [34] M. Ali, A. Elsayed, A. Mendez, Y. Savaria, and M. Sawan, “Contact and Remote Breathing Rate Monitoring Techniques: A Review,” IEEE Sensors Journal, vol. 21, no. 13, pp. 14 569–14 586, 2021.
- [35] M. Rehman, R. A. Shah, M. B. Khan, S. A. Shah, N. A. Abuali, X. Yang, A. Alomainy, M. A. Imran, and Q. H. Abbasi, “Improving machine learning classification accuracy for breathing abnormalities by enhancing dataset,” Sensors, vol. 21, no. 20, pp. 1–15, 2021.
- [36] A. G. de Moraes and S. Surani, “Effects of diabetic ketoacidosis in the respiratory system,” World Journal of Diabetes, vol. 10, no. 1, pp. 16–22, 2019.
- [37] C. Li and J. Lin, “Recent advances in doppler radar sensors for pervasive healthcare monitoring,” in 2010 Asia-Pacific Microwave Conference, 2010, pp. 283–290.
- [38] A. R. Fekr, M. Janidarmian, K. Radecka, and Z. Zilic, “Respiration Disorders Classification with Informative Features for m-Health Applications,” IEEE Journal of Biomedical and Health Informatics, vol. 20, no. 3, pp. 733–747, may 2016.
- [39] R. S. Leung, V. R. Comondore, C. M. Ryan, and D. Stevens, “Mechanisms of sleep-disordered breathing: Causes and consequences,” pp. 213–230, 2012.
- [40] G. Weinreich, J. Armitstead, V. Töpfer, Y. M. Wang, Y. Wang, and H. Teschler, “Validation of apnealink as screening device for cheyne-stokes respiration,” Sleep, vol. 32, no. 4, pp. 553–557, 2009.
- [41] M. K. Uçar, M. R. Bozkurt, C. Bilgin, and K. Polat, “Automatic detection of respiratory arrests in OSA patients using PPG and machine learning techniques,” Neural Computing and Applications, vol. 28, no. 10, pp. 2931–2945, 2017.