Dissimilar thermal transport properties in -Ga2O3 and -Ga2O3 revealed by machine-learning homogeneous nonequilibrium molecular dynamics simulations
Abstract
The lattice thermal conductivity (LTC) of Ga2O3 is an important property due to the challenge in the thermal management of high-power devices. We develop machine-learned neuroevolution potentials for single-crystalline -Ga2O3 and -Ga2O3, and apply them to perform homogeneous nonequilibrium molecular dynamics simulations to predict their LTCs. The LTC of -Ga2O3 was determined to be , , and along [100], [010], and [001], respectively, aligning with previous experimental measurements. For the first time, we predict the LTC of -Ga2O3 along [100], [010], and [001] to be , , and , respectively, showing a nearly isotropic thermal transport property. The reduced LTC of -Ga2O3 versus -Ga2O3 stems from its restricted low-frequency phonons up to . Furthermore, we find that the phase exhibits a typical temperature dependence slightly stronger than , whereas the phase shows a weaker temperature dependence, ranging from to .
I Introduction
Ultra-wide bandgap semiconductors, such as Ga2O3, diamond, AlN, etc., have also become the focus of attention materials for next-generation electronics and optoelectronics. Owing to a bandgap of about , exceptional breakdown electrical field, and cost-effective production, Ga2O3 offers considerable promise for ultra-high power devices applications.Pearton et al. (2018a); Zhang et al. (2022); Ueda et al. (1997) However, the lattice thermal conductivity (LTC) of Ga2O3 is subpar, leading to pronounced heat dissipation issues in certain semiconductor devices.Pearton et al. (2018a) Understanding the phonon thermal transport in Ga2O3 is crucial for its practical applications.
The Ga2O3 crystal actually exists in five distinct phases: , , , , and (sometimes referred to as ). Of these, the phase (space group C2/m) is the most stable one, which has been extensively explored for applications in deep-ultraviolet transparent conductive electrodes,Orita et al. (2000) solar blind detectors,Feng et al. (2006); Zhou et al. (2022) high-performance field effect transistors,Hwang et al. (2014) Schottky rectifiers Pearton et al. (2018b) and high temperature gas sensors.Pearton et al. (2018a) In recent years, further efforts have been made to overcome the poor thermal stability and immature synthesis methods of other phases. Hexagonal crystal -Ga2O3 (space group P63mc) was reported to be the second most stable phase obtained at low temperatures Playford et al. (2013); Zhuo et al. (2017), whereas subsequent studies claimed that the crystal structure of the polycrystalline form at low temperatures has an orthorhombic structure at the nanoscale (), named -Ga2O3 (space group Pna21).Cora et al. (2017); Janzen et al. (2021) The strong polarization in -Ga2O3 is a prominent feature that -Ga2O3 does not possess, which may benefit potential device applications. For example, -Ga2O3 can form heterojunctions with other semiconductors such as GaN or AlN, and its polarization was utilized to regulate interface transport while effectively alleviating thermal problems. Chen et al. (2022); Krishna et al. (2022) Considering the distinct crystal structures of and -Ga2O3, a comparative understanding of the LTC for both phases is essential for their device thermal design, particularly as the phase remains unexplored.
Currently, growing large-scale single-crystalline -Ga2O3 is a challenging endeavor experimentally, and assessing its LTC is anticipated to be even more demanding. From a computational perspective, its LTC can be predicted using atomistic simulation techniques, such as molecular dynamics (MD) simulations and the combination of Boltzmann transport equation (BTE) with the anharmonic lattice dynamics (ALD) method. While atomic interactions can be derived from either empirical potentials or quantum mechanical density functional theory (DFT) calculations, intricate crystals like -Ga2O3, which possess 40 atoms in their primitive cell, introduce substantial hurdles - accuracy concerns for empirical potentials and computational overhead for DFT. Recently, machine-learned potentials (MLPs)-based large-scale MD simulations have been demonstrated to be a reliable approach to calculate the LTC of complex crystals including amorphous silicon Wang et al. (2023), amorphous HfO2 Zhang et al. (2023), amorphous silica Liang et al. (2023), metal-organic frameworks Ying et al. (2023a), and violet phosphorene Ying et al. (2023b), which can account for phonon anharmonicity to arbitrary order. Several MLPs for Ga2O3 have been developed, addressing both the perfect bulk system Liu et al. (2020); Li et al. (2020) and more intricate, disordered structures Zhao et al. (2023); Liu et al. (2023).
In this work, we apply the neuroevolution potential (NEP) framework Fan et al. (2021); Fan (2022); Fan et al. (2022) to develop two MLPs on demand for Ga2O3 against quantum-mechanical DFT calculations, one for phase and one for phase. We choose the NEP approach here, because this method has been demonstrated to be highly efficient Fan et al. (2022). We apply the developed NEPs to perform extensive homogeneous non-equilibrium molecular dynamics (HNEMD) simulations to investigate the LTC of the two phases of Ga2O3. Our results show that the LTC of the phase is much lower than that of the phase, and exhibits low anisotropy and weak temperature dependence.
II Methods
II.1 Structural model and DFT calculations
All DFT calculations were performed using projected augmented wave methodBlöchl (1994) with Perdew-Burke-Ernzerhof functional of generalized gradient approximation Perdew, Burke, and Ernzerhof (1996) implemented in the VASP package Kresse and Furthmüller (1996); Kresse and Joubert (1999). The kinetic energy cutoff was set to , and the convergence value for the total energy was . The stopping criteria for structural optimizations were that the maximum residual Hellmann-Feynman force on atoms was less than . A \numproduct10x10x6 and \numproduct10x6x6 -centered k-point grid was employed for the primitive cell of -Ga2O3 and -Ga2O3 respectively. Additionally, to validate the accuracy of the MLP, the phonon dispersions of -Ga2O3 and -Ga2O3 were further calculated on \numproduct2x2x2 and \numproduct2x1x1 supercells, respectively, using the density functional perturbation theory together with the Phonopy package Togo and Tanaka (2015).
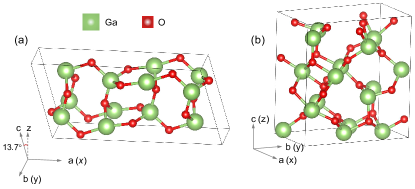
Meanwhile, according to widely used conventions, we have optimized the corresponding conventional unit cell as the initial cell for the MD simulation. The -Ga2O3 lattice structure remains unchanged, but the number of atoms in the conventional unit cell of -Ga2O3 is higher than that in the primitive cell. The calculated lattice constants of -Ga2O3 are = , = and = , while these values for -Ga2O3 are = , = and = , which are close to reported values Janzen et al. (2021); Åhman, Svensson, and Albertsson (1996). As shown in Figure 1, the conventional unit cell of -Ga2O3 has 20 atoms, while -Ga2O3 has a relatively large number of 40 atoms. In the calculations of the reference datasets for NEP training, the \numproduct2x2x2 and \numproduct2x1x1 supercells were used for -Ga2O3 and -Ga2O3, respectively, with \numproduct1x4x2 and \numproduct3x3x3 k-point grids.
II.2 The NEP model training
We used the identical method to construct the reference data sets for the and phases of Ga2O3. The reference structures were obtained by ab initio molecular dynamics (AIMD) simulations and random perturbations. For each phase, the AIMD simulations were run under an isothermal ensemble with temperature increasing linearly from for 10,000 steps and a time step of . We uniformly extracted 1,000 structures from AIMD simulations for each case. For random perturbations, 200 structures were generated with random cell deformations ranging from -4% to 4% and atomic displacements less than , all based on optimized structures. For both phases, our total data set has 1,200 structures including energy, atomic forces, and virials obtained from DFT calculations as outlined in subsection II.1. We randomly divided the total data set into a training set of 1,000 structures and a test set of 200 structures.
After obtaining the training set and test set, we applied the third generation of the NEP framework Fan et al. (2022) implemented in GPUMD (version 3.5) to train the MLP for and phases of Ga2O3, which were denoted as NEP- and NEP-, respectively. NEP used a feedforward neural network (NN) to represent the site energy with atomic cluster expansion (ACE) Drautz (2019)-like descriptor components including radial and angular terms. The parameters of NEP models were optimized using the separable natural evolution strategy (SNES) Schaul, Glasmachers, and Schmidhuber (2011), with the loss function defined as a weighted sum over the root mean square error (RMSE) values of energy, atomic force and virial.
We used the same hyperparameters for these two NEP models. After extensive testing, the selected hyperparameters were determined as follows: the radial and angular cutoffs are = and = , respectively. The number of radial and angular descriptor components are and , respectively. For angular parameters, we have for three-body and for four-body terms, respectively. The number of neurons in the hidden layer of the NN is 50. The size of the population is and the number of generations is . The weights of energy, force, and virial RMSEs in the loss function were set to 1.0, 1.0, and 0.1, respectively.
II.3 Thermal conductivity calculations
We performed MD simulation using the GPUMD package (version 3.5) Fan et al. (2017, 2022) to calculate the LTCs for the two phases of Ga2O3. Based on the HNEMD method, the LTC can be calculated from the relation Evans (1982); Fan et al. (2019)
| (1) |
where is the thermal conductivity tensor, is the system temperature and is the system volume. The non-equilibrium heat current is induced by the external driving force related to a driving-force parameter with the dimension of inverse length Gabourie et al. (2021)
| (2) |
Here, is the virial tensor of atom . The magnitude of the driving-force parameter we used for both phases at different temperatures are small enough to keep the system within the linear-response regime.
All MD simulations were conducted at the target temperature using the Nose-Hoover chain method Tuckerman (2023) with a time step of . Initially, the simulation was run for in the isothermal-isobaric ensemble, and subsequently in the isothermal ensemble for to achieve equilibrium. Afterwards, HNEMD simulations were performed in the isothermal ensemble for to calculate the running LTCs. We employed \numproduct4x16x8 and \numproduct9x5x5 supercells for -Ga2O3 and -Ga2O3, respectively, containing 10240 and 9000 atoms. The simulation sizes were validated to be sufficiently large to eliminate finite-size effects. For each case, the predicted LTC was calculated as the average of five independent simulations, and the corresponding standard error was also estimated.
III Results and discussion
III.1 Validation of the NEP models
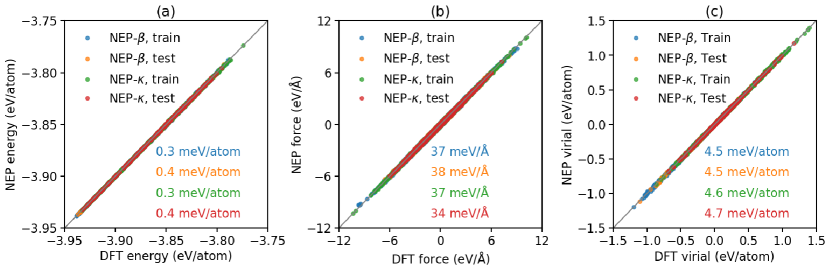
Figure 2(a)-(c) show a comparison between the predicted energy, force, and virial values obtained from the NEP models and the corresponding DFT reference values for both the training and test sets of the two phases. In all scenarios, the RMSEs for energy, force, and virial are below , , and , respectively. These results demonstrate a very high accuracy of our NEP models. In addition to their high accuracy, our NEPs are remarkably efficient. For a system comprising 10,000 atoms, our NEPs can attain a computational speed of approximately atom-step per second in the GPUMD package using a single GeForce RTX 3090 GPU card. This efficiency enabled us to perform extensive simulations to characterize the LTCs of the Ga2O3 crystals.
| LTC components | -Ga2O3 | -Ga2O3 |
|---|---|---|
| 10.3 (0.2) | 4.5 (0.0) | |
| 19.9 (0.2) | 3.9 (0.0) | |
| 12.5 (0.2) | 4.0 (0.1) | |
| 0.2 (0.2) | 0.0 (0.1) | |
| 0.4 (0.2) | 0.0 (0.1) | |
| 0.0 (0.1) | 0.0 (0.1) |
III.2 Phonon dispersions
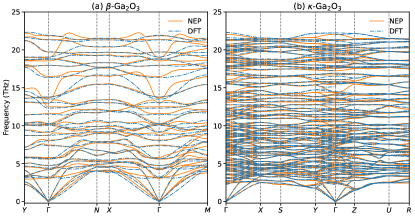
To assess the reliability of our NEP models in capturing the phonon transport properties of -Ga2O3 and -Ga2O3, we compare the calculated phonon dispersions using both NEP and DFT methods, as shown in Figure 3. It can be seen that for both phases, the acoustic branches predicted by NEP and DFT are very close, while the optical branches of phase show deviations, especially at high frequencies. Because the theoretical calculation finds that the high-frequency optical branches () contribute minimally to LTC, Yan and Kumar (2018) which is confirmed by subsequent calculations of the spectrally decomposed LTC in this work. Thus, we believe that the NEP models can reliably predict the LTC of the two phases of Ga2O3.
III.3 Thermal conductivity
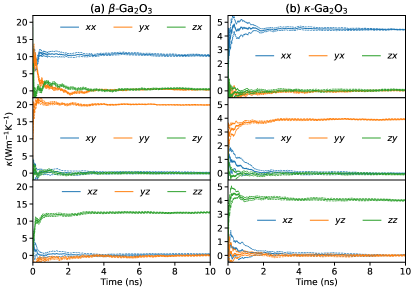
After confirming the accuracy of the NEP models, we apply them to calculate LTCs using the HNEMD method. Figure 4 presents the LTCs for both - and -Ga2O3 using the HNEMD method at . Notably, Figure 1(a) reveals that -Ga2O3 possesses a monoclinic crystal structure, suggesting the potential for non-zero values in the off-diagonal elements in the LTC tensor. Fortunately, the HNEMD approach (see Equation 1) allows us to fully determine the LTC tensor as listed in Table 1, by applying the external driving force along three orthogonal axes sequentially. As anticipated, the phase exhibits minor couplings between the and directions. In contrast, the off-diagonal elements of the LTC tensor for the phase are zero, attributed to its orthorhombic crystal structure.
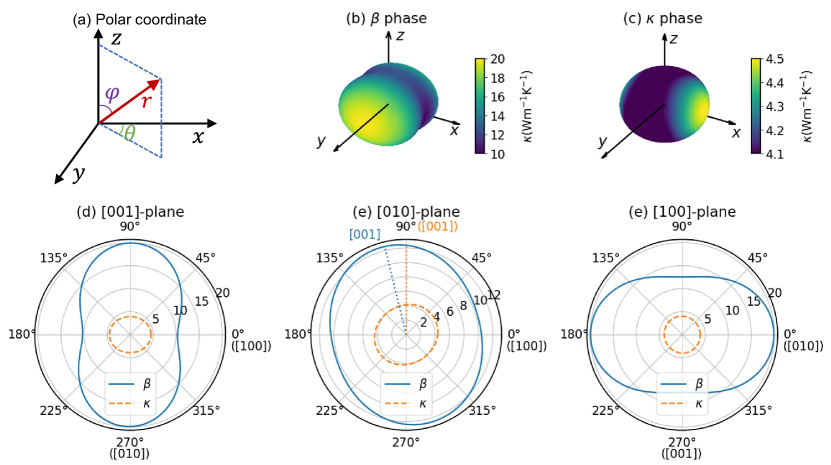
Based on the polar coordinates as shown in Figure 5(a), we can determine the LTC along any crystal direction:Jiang et al. (2018)
| (3) |
with
| (4) |
Figure 5(b) and (c) show the 3D distribution of LTC for the and phases, respectively. The corresponding 2D projection in the [001], [010], and [100]-planes are presented in Figure 5(d)-(f), respectively.
For the phase, the LTC is highest along the [010] direction with , followed by [001] with (see the blue dotted line in Figure 5(e)), and [100] at . As shown in LABEL:table:comparisons, our HNEMD results are consistent with previous experimental results Jiang et al. (2018); Guo et al. (2015) using time-domain thermoreflectance and theoretical predictions based on the BTE-ALD method Santia, Tandon, and Albrecht (2015); Liu et al. (2020); Yan and Kumar (2018); Chen et al. (2023) or the equilibrium molecular dynamics (EMD) method Li et al. (2020). This further demonstrates the reliability of our HNEMD approach based on machine-learned NEP in characterizing the LTC of Ga2O3 crystals.
| Method | [100] | [010] | [001] |
|---|---|---|---|
| Current HNEMD | 10.3 (0.2) | 19.9 (0.2) | 12.6 (0.2) |
| Experiment Jiang et al. (2018) | 9.5 (1.8) | 22.5 (2.5) | 13.3 (1.8) |
| Experiment Guo et al. (2015) | 10.9 (1.0) | 27.0 (2.0) | 15.0 |
| EMD Li et al. (2020) | 10.7 | 20.8 | 12.6 |
| BTE-ALD Liu et al. (2020) | 13.9 | 24.8 | 19.8 |
| BTE-ALD Santia, Tandon, and Albrecht (2015) | 16.1 | 21.5 | 21.2 |
| BTE-ALD Yan and Kumar (2018) | 12.7 | 20.0 | 17.8 |
| BTE-ALD Chen et al. (2023) | 10.02 | 23.74 | 12 |
To our knowledge, the LTC of -Ga2O3 has not been investigated before. Here, we predict the LTC for -Ga2O3 to be , , and along the [100], [010], and [001] directions, respectively. These values are about one-fifth to half of those of -Ga2O3. While the phase displays a significant LTC anisotropy with an anisotropy index of 1.94 (the maximum-to-minimum ratio of the LTC, see spatial distribution in Figure 5(b)), the phase exhibits a nearly isotropic LTC pattern with an anisotropy index of 1.15. (see Figure 5(c)).
To elucidate the disparities in the LTC observed between the two phases, we decomposed the LTC as a function of phonon frequency: Fan et al. (2019)
| (5) |
Here is the virial-velocity correlation function Gabourie et al. (2021), in which and are the virial tensor and the velocity of atom , respectively.
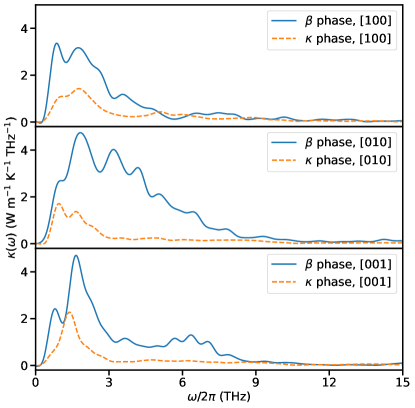
Figure 6 presents the spectrally decomposed LTC of -Ga2O3 and -Ga2O3 calculated from Equation 5. Taken as a whole, only phonon modes with frequencies in the range are really involved in thermal transport. It also can be found that, although in both phases the low-frequency acoustic phonons contribute significantly to the LTC, the phase has a much broader distribution of phonon frequencies contributing to its LTC than the phase. This is also related to the the phonon dispersions as shown in Figure 3. The branches of the phase with a phonon frequency in the range of are much flatter than those of the phase, leading to much lower phonon group velocities. Moreover, in the phase, we observe significant overlaps between multiple bands for phonon frequencies greater than , indicating the presence of multiple scattering channels, a phenomenon previously observed in Violet phosphorene Ying et al. (2023b).
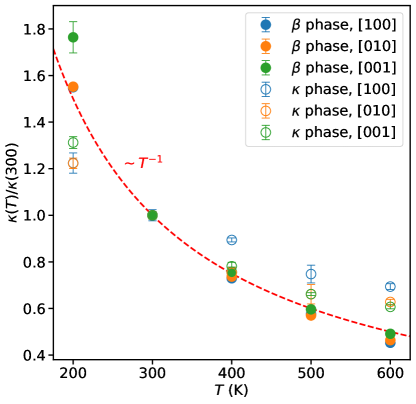
Furthermore, Figure 7 shows the temperature-dependent LTC for - and -Ga2O3. In the temperature range of , the LTCs of both phases decrease with increasing temperature. The LTC of the phase exhibits a temperature dependence slightly stronger than , as typical for systems dominated by three-phonon scattering processes Lindsay, Broido, and Reinecke (2013). However, the LTC of -Ga2O3 shows a clearly weaker temperature dependence, which is along the [100] direction and along the the [010] and [001] directions, suggesting a significant impact of higher-order anharmonic phonon scatterings attributable to its complex crystal structures Lindsay et al. (2019).
IV Conclusions
In summary, we have developed machine-learned NEP models trained against quantum-mechanical DFT data for the and phases of Ga2O3, which have been demonstrated to be accurate and efficient in predicting energy, atomic forces, virial, and phonon dispersions in both phases. Based on large-scale HNEMD simulations, we reached a consistent prediction with previous experimental measurements for the phase, and predicted the LTC of the phase for the first time. We found that the phase has a much lower LTC than the phase, due to its phonon frequency contributions being limited to below compared to the range of the phase. Furthermore, the phase exhibits an almost isotropic spatial distribution with an anisotropy index of 1.15 at , in contrast to the pronounced anisotropy index of 1.94 for the phase. We also examined the temperature dependence of the LTC in the two phases, and found that the LTC of the phase follows a temperature dependence slightly stronger than , whereas the phase shows a weaker temperature dependence from to , indicating a significant effect of high-order anharmonicity distinct as in low-LTC materials. Our wok demonstrates that the machine-learned NEP-driven HNEMD simulations can reliably and effectively characterize phonon thermal transport properties for complex crystals such as -Ga2O3, and thus we expect that this approach can be used to explore the LTCs of other phases of Ga2O3 as well.
Acknowledgements.
This work was supported by the Key-Area Research and Development Program of Guangdong Province (Grant No.2020B010169002), the Guangdong Special Support Program (Grant No.2021TQ06C953), and the Science and Technology Planning Project of Shenzhen Municipality (Grant No. JCYJ20190806142614541).Conflict of Interest
The authors have no conflicts to disclose.
Data availability Complete input and output files for the NEP training of -Ga2O3 and -Ga2O3 crystals are freely available at https://gitlab.com/brucefan1983/nep-data.The source code and documentation for GPUMD are available at https://github.com/brucefan1983/GPUMD and https://gpumd.org, respectively.
References
- Pearton et al. (2018a) S. Pearton, J. Yang, P. H. Cary, F. Ren, J. Kim, M. J. Tadjer, and M. A. Mastro, “A review of Ga2O3 materials, processing, and devices,” Applied Physics Reviews 5 (2018a), 10.1063/1.5006941.
- Zhang et al. (2022) J. Zhang, P. Dong, K. Dang, Y. Zhang, Q. Yan, H. Xiang, J. Su, Z. Liu, M. Si, J. Gao, et al., “Ultra-wide bandgap semiconductor Ga2O3 power diodes,” Nature Communications 13, 3900 (2022).
- Ueda et al. (1997) N. Ueda, H. Hosono, R. Waseda, and H. Kawazoe, “Anisotropy of electrical and optical properties in -Ga2O3 single crystals,” Applied physics letters 71, 933–935 (1997).
- Orita et al. (2000) M. Orita, H. Ohta, M. Hirano, and H. Hosono, “Deep-ultraviolet transparent conductive -Ga2O3 thin films,” Applied Physics Letters 77, 4166–4168 (2000).
- Feng et al. (2006) P. Feng, J. Y. Zhang, Q. H. Li, and T. H. Wang, “Individual -Ga2O3 nanowires as solar-blind photodetectors,” Applied Physics Letters 88, 153107 (2006).
- Zhou et al. (2022) X. Zhou, M. Li, J. Zhang, L. Shang, K. Jiang, Y. Li, L. Zhu, J. Chu, and Z. Hu, “Flexible solar-blind photodetectors based on -Ga2O3 films transferred by a stamp-based printing technique,” IEEE Electron Device Letters 43, 1921–1924 (2022).
- Hwang et al. (2014) W. S. Hwang, A. Verma, H. Peelaers, V. Protasenko, S. Rouvimov, A. Seabaugh, W. Haensch, C. V. de Walle, Z. Galazka, M. Albrecht, et al., “High-voltage field effect transistors with wide-bandgap -Ga2O3 nanomembranes,” Applied Physics Letters 104 (2014), 10.1063/1.4879800.
- Pearton et al. (2018b) S. J. Pearton, F. Ren, M. Tadjer, and J. Kim, “Perspective: Ga2O3 for ultra-high power rectifiers and MOSFETS,” Journal of Applied Physics 124, 220901 (2018b).
- Playford et al. (2013) H. Y. Playford, A. C. Hannon, E. R. Barney, and R. I. Walton, “Structures of uncharacterised polymorphs of gallium oxide from total neutron diffraction,” Chemistry–A European Journal 19, 2803–2813 (2013).
- Zhuo et al. (2017) Y. Zhuo, Z. Chen, W. Tu, X. Ma, Y. Pei, and G. Wang, “-Ga2O3 versus -Ga2O3: Control of the crystal phase composition of gallium oxide thin film prepared by metal-organic chemical vapor deposition,” Applied Surface Science 420, 802–807 (2017).
- Cora et al. (2017) I. Cora, F. Mezzadri, F. Boschi, M. Bosi, M. Čaplovičová, G. Calestani, I. Dódony, B. Pécz, and R. Fornari, “The real structure of -Ga2O3 and its relation to -phase,” CrystEngComm 19, 1509–1516 (2017).
- Janzen et al. (2021) B. M. Janzen, P. Mazzolini, R. Gillen, V. F. Peltason, L. P. Grote, J. Maultzsch, R. Fornari, O. Bierwagen, and M. R. Wagner, “Comprehensive raman study of orthorhombic /-Ga2O3 and the impact of rotational domains,” Journal of Materials Chemistry C 9, 14175–14189 (2021).
- Chen et al. (2022) Y. Chen, H. Ning, Y. Kuang, X.-X. Yu, H.-H. Gong, X. Chen, F.-F. Ren, S. Gu, R. Zhang, Y. Zheng, et al., “Band alignment and polarization engineering in -Ga2O3/GaN ferroelectric heterojunction,” Science China Physics, Mechanics & Astronomy 65, 277311 (2022).
- Krishna et al. (2022) S. Krishna, Y. Lu, C.-H. Liao, V. Khandelwal, and X. Li, “Band alignment of orthorhombic Ga2O3 with gan and aln semiconductors,” Applied Surface Science 599, 153901 (2022).
- Wang et al. (2023) Y. Wang, Z. Fan, P. Qian, M. A. Caro, and T. Ala-Nissila, “Quantum-corrected thickness-dependent thermal conductivity in amorphous silicon predicted by machine learning molecular dynamics simulations,” Physical Review B 107, 054303 (2023).
- Zhang et al. (2023) H. Zhang, X. Gu, Z. Fan, and H. Bao, “Vibrational anharmonicity results in decreased thermal conductivity of amorphous at high temperature,” Phys. Rev. B 108, 045422 (2023).
- Liang et al. (2023) T. Liang, P. Ying, K. Xu, Z. Ye, C. Ling, Z. Fan, and J. Xu, “Mechanisms of temperature-dependent thermal transport in amorphous silica from machine-learning molecular dynamics,” (2023), arXiv:2310.09062 [cond-mat.mtrl-sci] .
- Ying et al. (2023a) P. Ying, T. Liang, K. Xu, J. Zhang, J. Xu, Z. Zhong, and Z. Fan, “Sub-Micrometer Phonon Mean Free Paths in Metal–Organic Frameworks Revealed by Machine Learning Molecular Dynamics Simulations,” ACS Applied Materials & Interfaces 15, 36412–36422 (2023a).
- Ying et al. (2023b) P. Ying, T. Liang, K. Xu, J. Xu, Z. Fan, T. Ala-Nissila, and Z. Zhong, “Variable thermal transport in black, blue, and violet phosphorene from extensive atomistic simulations with a neuroevolution potential,” International Journal of Heat and Mass Transfer 202, 123681 (2023b).
- Liu et al. (2020) Y. Liu, J. Yang, G. Xin, L. Liu, G. Csányi, and B. Cao, “Machine learning interatomic potential developed for molecular simulations on thermal properties of -Ga2O3,” The Journal of Chemical Physics 153, 144501 (2020).
- Li et al. (2020) R. Li, Z. Liu, A. Rohskopf, K. Gordiz, A. Henry, E. Lee, and T. Luo, “A deep neural network interatomic potential for studying thermal conductivity of -Ga2O3,” Applied Physics Letters 117, 152102 (2020).
- Zhao et al. (2023) J. Zhao, J. Byggmästar, H. He, K. Nordlund, F. Djurabekova, and M. Hua, “Complex Ga2O3 polymorphs explored by accurate and general-purpose machine-learning interatomic potentials,” npj Computational Materials 9, 159 (2023).
- Liu et al. (2023) Y. Liu, H. Liang, L. Yang, G. Yang, H. Yang, S. Song, Z. Mei, G. Csányi, and B. Cao, “Unraveling thermal transport correlated with atomistic structures in amorphous gallium oxide via machine learning combined with experiments,” Advanced Materials 35, 2210873 (2023).
- Fan et al. (2021) Z. Fan, Z. Zeng, C. Zhang, Y. Wang, K. Song, H. Dong, Y. Chen, and T. Ala-Nissila, “Neuroevolution machine learning potentials: Combining high accuracy and low cost in atomistic simulations and application to heat transport,” Phys. Rev. B 104, 104309 (2021).
- Fan (2022) Z. Fan, “Improving the Accuracy of the Neuroevolution Machine Learning Potential for Multi-Component Systems,” Journal of Physics: Condensed Matter 34, 125902 (2022).
- Fan et al. (2022) Z. Fan, Y. Wang, P. Ying, K. Song, J. Wang, Y. Wang, Z. Zeng, K. Xu, E. Lindgren, J. M. Rahm, A. J. Gabourie, J. Liu, H. Dong, J. Wu, Y. Chen, Z. Zhong, J. Sun, P. Erhart, Y. Su, and T. Ala-Nissila, “GPUMD: A package for constructing accurate machine-learned potentials and performing highly efficient atomistic simulations,” The Journal of Chemical Physics 157, 114801 (2022).
- Blöchl (1994) P. E. Blöchl, “Projector augmented-wave method,” Physical review B 50, 17953 (1994).
- Perdew, Burke, and Ernzerhof (1996) J. P. Perdew, K. Burke, and M. Ernzerhof, “Generalized gradient approximation made simple,” Physical review letters 77, 3865 (1996).
- Kresse and Furthmüller (1996) G. Kresse and J. Furthmüller, “Efficient Iterative Schemes for Ab Initio Total-Energy Calculations Using a Plane-Wave Basis Set,” Physical Review B 54, 11169 (1996).
- Kresse and Joubert (1999) G. Kresse and D. Joubert, “From Ultrasoft Pseudopotentials to the Projector Augmented-Wave Method,” Physical Review B 59, 1758 (1999).
- Togo and Tanaka (2015) A. Togo and I. Tanaka, “First principles phonon calculations in materials science,” Scripta Materialia 108, 1–5 (2015).
- Åhman, Svensson, and Albertsson (1996) J. Åhman, G. Svensson, and J. Albertsson, “A reinvestigation of -gallium oxide,” Acta Crystallographica Section C: Crystal Structure Communications 52, 1336–1338 (1996).
- Drautz (2019) R. Drautz, “Atomic cluster expansion for accurate and transferable interatomic potentials,” Physical Review B 99, 014104 (2019).
- Schaul, Glasmachers, and Schmidhuber (2011) T. Schaul, T. Glasmachers, and J. Schmidhuber, “High Dimensions and Heavy Tails for Natural Evolution Strategies,” in Proceedings of the 13th Annual Conference on Genetic and Evolutionary Computation, GECCO ’11 (Association for Computing Machinery, New York, NY, USA, 2011) pp. 845–852.
- Fan et al. (2017) Z. Fan, W. Chen, V. Vierimaa, and A. Harju, “Efficient Molecular Dynamics Simulations with Many-Body Potentials on Graphics Processing Units,” Computer Physics Communications 218, 10–16 (2017).
- Evans (1982) D. J. Evans, “Homogeneous NEMD algorithm for thermal conductivity—Application of non-canonical linear response theory,” Physics Letters A 91, 457–460 (1982).
- Fan et al. (2019) Z. Fan, H. Dong, A. Harju, and T. Ala-Nissila, “Homogeneous Nonequilibrium Molecular Dynamics Method for Heat Transport and Spectral Decomposition with Many-Body Potentials,” Physical Review B 99, 064308 (2019).
- Gabourie et al. (2021) A. J. Gabourie, Z. Fan, T. Ala-Nissila, and E. Pop, “Spectral decomposition of thermal conductivity: Comparing velocity decomposition methods in homogeneous molecular dynamics simulations,” Physical Review B 103, 205421 (2021).
- Tuckerman (2023) M. E. Tuckerman, Statistical mechanics: theory and molecular simulation (Oxford university press, 2023).
- Yan and Kumar (2018) Z. Yan and S. Kumar, “Phonon mode contributions to thermal conductivity of pristine and defective -Ga2O3,” Phys. Chem. Chem. Phys. 20, 29236–29242 (2018).
- Jiang et al. (2018) P. Jiang, X. Qian, X. Li, and R. Yang, “Three-dimensional anisotropic thermal conductivity tensor of single crystalline -Ga2O3,” Applied Physics Letters 113, 232105 (2018).
- Guo et al. (2015) Z. Guo, A. Verma, X. Wu, F. Sun, A. Hickman, T. Masui, A. Kuramata, M. Higashiwaki, D. Jena, and T. Luo, “Anisotropic thermal conductivity in single crystal -Ga2O3,” Applied Physics Letters 106, 111909 (2015).
- Santia, Tandon, and Albrecht (2015) M. D. Santia, N. Tandon, and J. Albrecht, “Lattice thermal conductivity in -Ga2O3 from first principles,” Applied Physics Letters 107 (2015), 10.1063/1.4927742.
- Chen et al. (2023) Y. Chen, L. Peng, Y. Wu, C. Ma, A. Wu, H. Zhang, and Z. Fang, “Anomalous Temperature-Dependent Phonon Anharmonicity and Strain Engineering of Thermal Conductivity in -Ga2O3,” The Journal of Physical Chemistry C 127, 13356–13363 (2023).
- Lindsay, Broido, and Reinecke (2013) L. Lindsay, D. A. Broido, and T. L. Reinecke, “Ab initio thermal transport in compound semiconductors,” Phys. Rev. B 87, 165201 (2013).
- Lindsay et al. (2019) L. Lindsay, A. Katre, A. Cepellotti, and N. Mingo, “Perspective on ab initio phonon thermal transport,” Journal of Applied Physics 126, 050902 (2019).