Dense stellar clump formation driven by strong quasar winds in the FIRE cosmological hydrodynamic simulations
Abstract
We investigate the formation of dense stellar clumps in a suite of high-resolution cosmological zoom-in simulations of a massive, star forming galaxy at under the presence of strong quasar winds. Our simulations include multi-phase ISM physics from the Feedback In Realistic Environments (FIRE) project and a novel implementation of hyper-refined accretion disk winds. We show that powerful quasar winds can have a global negative impact on galaxy growth while in the strongest cases triggering the formation of an off-center clump with stellar mass , effective radius , and surface density . The clump progenitor gas cloud is originally not star-forming, but strong ram pressure gradients driven by the quasar winds (orders of magnitude stronger than experienced in the absence of winds) lead to rapid compression and subsequent conversion of gas into stars at densities much higher than the average density of star-forming gas. The AGN-triggered star-forming clump reaches and , converting most of the progenitor gas cloud into stars in 2 Myr, significantly faster than its initial free-fall time and with stellar feedback unable to stop star formation. In contrast, the same gas cloud in the absence of quasar winds forms stars over a much longer period of time (35 Myr), at lower densities, and losing spatial coherency. The presence of young, ultra-dense, gravitationally bound stellar clumps in recently quenched galaxies could thus indicate local positive feedback acting alongside the strong negative impact of powerful quasar winds, providing a plausible formation scenario for globular clusters.
keywords:
galaxies: evolution — galaxies: formation — star clusters: general — quasars: general — cosmology: theory1 Introduction
A broad range of galaxy formation models suggest that feedback from accreting supermassive black holes (BHs) in the core of active galaxies, also known as Active Galactic Nuclei (AGN), plays a critical role in the evolution of galaxies and is likely responsible for a variety of observed phenomena (Hopkins & Elvis, 2010; Alexander & Hickox, 2012; Somerville & Davé, 2015; Harrison et al., 2018; Di Matteo et al., 2023). AGN feedback manifests in different forms operating on varying scales, with examples including fast accretion-driven winds (Faucher-Giguère & Quataert, 2012; Faucher-Giguère et al., 2012; Zubovas & Nayakshin, 2012a; Tombesi et al., 2013; Nardini et al., 2015), galaxy scale outflows (Feruglio et al., 2010; Sturm et al., 2011; Greene et al., 2012; Cicone et al., 2014; Zakamska & Greene, 2014; Circosta et al., 2018; Wylezalek et al., 2020; Ramos Almeida et al., 2022), and large-scale jets (Fabian, 2012). Observed strong winds powered by luminous AGN (Alatalo et al., 2015; Wylezalek & Zakamska, 2016; Fiore et al., 2017; Harrison, 2017; Wylezalek et al., 2020) can potentially provide the negative effects required in galaxy evolution models to reduce the star formation rate (SFR) in massive galaxies, but despite much recent progress, the detailed propagation and impact of AGN winds from parsec (pc) to circumgalactic medium (CGM) scales is still not fully understood (Somerville & Davé, 2015; Hopkins et al., 2016; Harrison et al., 2018; Choi et al., 2018; Costa et al., 2020; Torrey et al., 2020; Byrne et al., 2023; Di Matteo et al., 2023; Wellons et al., 2023).
In contrast, some observations suggest that AGN feedback can have positive effects, triggering rather than suppressing star formation in galaxies. Plausible signatures of positive AGN feedback include the identification of ongoing star formation in outflowing material (Santoro et al., 2016; Maiolino et al., 2017; Cresci & Maiolino, 2018; Gallagher et al., 2019; Rodríguez del Pino et al., 2019), the spatial anti-correlation between wind-dominated central cavities and high star-forming regions (Cresci et al., 2015a, b; Carniani et al., 2016; Shin et al., 2019; Perna et al., 2020; Bessiere & Ramos Almeida, 2022; Schutte & Reines, 2022), jet-induced star formation within the host-galaxy (Bicknell et al., 2000; Zirm et al., 2005; Drouart et al., 2016), and large-scale bubbles driven by jets possibly triggering star formation in other galaxies (Gilli et al., 2019). In some cases, spatially resolved observations seem to indicate that positive and negative AGN feedback can coexist and operate simultaneously within a single host galaxy (Cresci et al., 2015b; Al Yazeedi et al., 2021; Bessiere & Ramos Almeida, 2022).
Some idealized simulations and analytic models have proposed that positive triggering of star formation could be the dominant outcome of AGN feedback, with several works arguing that positive AGN feedback can explain the similarity in the cosmic history of star formation and AGN activity, trigger observed extreme starbursts in high-redshift galaxies, or even drive the BH–galaxy scaling relations (Gaibler et al., 2012; Ishibashi & Fabian, 2012; Zubovas & Nayakshin, 2012b; Silk, 2013; Zubovas et al., 2013; Nayakshin, 2014; Bieri et al., 2015; Bieri et al., 2016; Zubovas & Bourne, 2017). These models are in stark contrast with a variety of hydrodynamic simulations of galaxy evolution in a cosmological context, where AGN feedback is implemented to negatively impact star formation in massive galaxies (Choi et al., 2015; Schaye et al., 2015; Hirschmann et al., 2016; Anglés-Alcázar et al., 2017a; Tremmel et al., 2017; Weinberger et al., 2017; Davé et al., 2019; Dubois et al., 2021; Habouzit et al., 2021, 2022; Byrne et al., 2023; Wellons et al., 2023). Given the difficulty in explicitly modeling the propagation and impact of AGN winds across scales in a full cosmological context (Somerville & Davé, 2015; Di Matteo et al., 2023) and the degeneracies between sub-grid model parameters in cosmological large-volume simulations (Villaescusa-Navarro et al., 2021; Jo et al., 2023; Ni et al., 2023), it has remained a challenge to fully discriminate between positive and negative AGN feedback scenarios.
In Mercedes-Feliz et al. (2023), we investigated the plausible dual role of AGN feedback in galaxies using high-resolution cosmological zoom-in simulations from the Feedback In Realistic Environments (FIRE111http://fire.northwestern.edu) project (Hopkins et al., 2014, 2018, 2023b), implementing local star formation and stellar feedback processes in a multi-phase interstellar medium (ISM) while also including a novel implementation of hyper-refined accretion-driven AGN winds that captures self-consistently their propagation and impact from the inner 10 pc to CGM scales (Anglés-Alcázar et al., 2023; Byrne et al., 2023; Cochrane et al., 2023; Hopkins et al., 2023b; Wellons et al., 2023). These simulations are among the most detailed models of a powerful quasar phase in a massive star-forming galaxy at its peak of activity ( at ) and are thus ideally suited to investigate the impact of AGN winds on resolved galaxy properties. Comparing identical simulations with either no AGN feedback or varying AGN feedback strength, Mercedes-Feliz et al. (2023) demonstrated that strong quasar winds with kinetic power 1046 erg/s persisting for 20 Myr can have a strong global negative impact on the host galaxy, driving the formation of a central gas cavity and significantly reducing the SFR surface density across the galaxy disc. Nonetheless, we identified several potential indicators of local positive AGN feedback coexisting with the global negative effects, including spatial anti-correlations between wind-dominated regions and star-forming clumps similar to observations (Cresci et al., 2015a; Carniani et al., 2016; Shin et al., 2019), higher local star formation efficiency in compressed gas at the edge of the cavity, as seen in some local active galaxies (Shin et al., 2019; Perna et al., 2020; Schutte & Reines, 2022), and the presence of outflowing material with ongoing star formation, qualitatively consistent with some observations (Maiolino et al., 2017; Gallagher et al., 2019).
In this work, we extend our previous analyses to investigate in more detail what appears to be the strongest manifestation of positive AGN feedback occurring in our simulations: the formation of very dense stellar clumps with stellar mass , stellar effective radius , and stellar surface density . These extreme clumps occur exclusively in our simulations with very strong AGN winds, while their presence is not observed in simulations with weaker AGN feedback. The presence of ultra-dense stellar clumps in galaxies that are otherwise experiencing global quenching of star formation could thus be a unique signature of co-existing local positive and global negative feedback by powerful quasar winds. Here we reconstruct the full evolution of these stellar clumps in detail and demonstrate the direct role of quasar winds on their formation.
The outline of this paper is as follows: §2 provides a brief summary of the galaxy formation framework and our methodology to implement AGN winds; §3 presents an overview of the simulations and the identified stellar clumps; §4 explores the impact of AGN winds on global and local star formation; §5 investigates the direct role of strong AGN winds driving the formation of the stellar clumps; §6 discusses our results in the context of previous work; and §7 provides a summary of our findings and the main conclusions of this work.
| Name | ||||
|---|---|---|---|---|
| noAGN | - | - | - | - |
| m0.1e0.5 | 0.1 | 0.005 | 2.22 | |
| m1e5 | 1 | 0.05 | 22.2 | |
| m2e10 | 2 | 0.1 | 44.4 | |
| m4e20 | 4 | 0.2 | 88.8 | |
| m10e50 | 10 | 0.5 | 222 |
2 Methods
The simulations and methodology that we use are presented and fully described in Anglés-Alcázar et al. (2023), which we briefly summarize below. The same simulations have been previously analyzed in Mercedes-Feliz et al. (2023) and Cochrane et al. (2023).
2.1 FIRE-2 galaxy formation model
Our simulations are part of the Feedback In Realistic Environments (FIRE) project222http://fire.northwestern.edu and we use specifically the “FIRE-2” galaxy formation physics implementation (Hopkins et al., 2018). The simulations use the -body and hydrodynamics code GIZMO333http://www.tapir.caltech.edu/~phopkins/Site/GIZMO.html in its “meshless finite mass” (MFM) hydrodynamics mode (Hopkins, 2015), a Lagrangian Godunov formulation which sets both hydrodynamic and gravitational (force-softening) spatial resolution in a fully-adaptive Lagrangian manner, with fixed mass resolution. As outlined in Hopkins et al. (2018), we include cooling and heating from ; star formation in locally self-gravitating, dense (), molecular, and Jeans-unstable gas; and stellar feedback from OB & AGB mass-loss, Type Ia & II Supernovae (SNe), and multi-wavelength photo-heating and radiation pressure; with each star particle representing a single stellar population with known mass, age, and metallicity with all stellar feedback quantities and their time dependence directly taken from the starburst99 population synthesis model (Leitherer et al., 1999).
2.2 Initial conditions
Our simulations use snapshots from pre-existing FIRE-2 simulations as initial conditions to perform new simulations that include AGN-driven winds. We focus primarily on the massive FIRE-2 halo A4 from Anglés-Alcázar et al. (2017b). In those simulations, the halo reaches mass at and was evolved down to including on-the-fly BH growth driven by gravitational torques (Hopkins & Quataert, 2011; Anglés-Alcázar et al., 2013; Anglés-Alcázar et al., 2015, 2017a) but no AGN feedback. The new simulations with AGN winds adopt the same baryonic mass resolution as well as gravitational force softenings , and , for the gas (minimum adaptive force softening), stellar, and dark matter components. We assume a CDM cosmology with parameters , , , , and (Hinshaw et al., 2013).
We select the simulation snapshot as the time to inject AGN winds in the new simulations, which will be referenced as throughout the rest of the paper. At this time, the galaxy is undergoing a strong starburst phase which will lead to the formation of an overcompact and overdense stellar component due to stellar feedback no longer being able to regulate star formation (Wellons et al., 2020; Parsotan et al., 2021; Anglés-Alcázar et al., 2023; Cochrane et al., 2023). A separate set of Lagrangian hyper-refinement simulations have shown explicitly that strong gravitational torques from the stellar component are driving at this time an inflow rate down to sub-pc scales sufficient to power a luminous quasar (Anglés-Alcázar et al., 2021), motivating further our choice of initial conditions to re-simulate including strong quasar winds. For further details, see Mercedes-Feliz et al. (2023).
2.3 Hyper-refined black hole-driven winds
We inject AGN winds at hyper-Lagrangian resolution using the method described in Anglés-Alcázar et al. (2023). This method builds on earlier particle spawning techniques in idealized simulations of galaxies and massive haloes (Richings & Faucher-Giguère, 2018; Torrey et al., 2020; Su et al., 2021) and has now been implemented in FIRE-3 simulations with BH physics (Hopkins et al., 2023b; Wellons et al., 2023). The BH is modelled as a collisionless particle with an initial mass , located at the center of the main simulated galaxy. For simplicity, the BH is assumed to be accreting at a constant rate, set at the Eddington rate (), which represent a luminous quasar phase () lasting 40 Myr. Mass conservation is ensured with stochastic swallowing of gas particles within the BH interaction kernel (defined to contain particles, e.g., Anglés-Alcázar et al., 2017a).
The following main properties specify our AGN wind model: the mass outflow rate , the initial wind velocity , and the initial wind geometry. We consider that a fraction of the AGN bolometric luminosity emerges as a fast isotropic wind that expands radially outward from the BH, with an initial velocity and temperature . We assume that the wind immediately interacts with the ambient medium and attains a post-shock velocity and temperature given by and K (Faucher-Giguère & Quataert, 2012). We model the AGN wind by spawning new gas particles within a sphere around the BH, with an initial velocity and temperature given by the post-shock properties and , implementing a target wind particle mass of (20 times higher mass resolution than the original simulation). We implement discrete ejection events containing wind particles distributed isotropically and moving radially outward from the BH. Other fluid quantities are immediately recomputed for the wind particles after spawning, modeling self-consistently the hydrodynamic interaction of winds with the ISM gas of the host galaxy. Particle spawning allows us to fully capture the propagation and impact of fast winds with Lagrangian hyper-refinement (see also Costa et al., 2020), injecting feedback locally around the BH and capturing the wind-ISM interaction robustly regardless of gas geometry and at significantly higher resolution than nearest neighbor-based feedback coupling models.
Table 1 summarizes the main properties of the simulations analyzed here. All simulations start from the same initial conditions described in 2.2, containing a central BH with mass accreting at the Eddington rate, and implementing the same post-shock wind velocity and temperature while varying the mass outflow rate . Along with the standard FIRE-2 simulation that excludes AGN feedback (noAGN), we investigate the impact of AGN-driven winds with kinetic feedback efficiencies in the range –50%, which brackets a range of observational constraints (e.g. Cicone et al., 2014; Fiore et al., 2017; Harrison et al., 2018) and assumed feedback efficiencies in previous simulations (e.g. Di Matteo et al., 2005; Weinberger et al., 2017; Davé et al., 2019). The simulation name in each feedback case encodes the value of the mass loading factor () and the kinetic feedback efficiency (). The times mentioned in this work are relative to the start of the quasar phase at , with referring to the time that has passed since then as . The two simulations that we reference the most throughout this work are:
-
1.
noAGN: The control simulation using standard FIRE-2 physics, where we model the evolution of a massive galaxy () starting at ( Myr) and no AGN winds are introduced. The BH is still accreting at the Eddington rate, .
-
2.
m4e20: AGN winds are turned on at Myr with the same initial conditions as the noAGN case. We consider a luminous quasar phase with bolometric luminosity erg s-1, driving a wind with kinetic efficiency and mass loading factor , corresponding to a mass outflow rate in winds .
We save snapshots every for and every for for all of the AGN-wind simulation, while the time between snapshots in the noAGN case is for the duration of the simulation.
3 Overview of Simulations
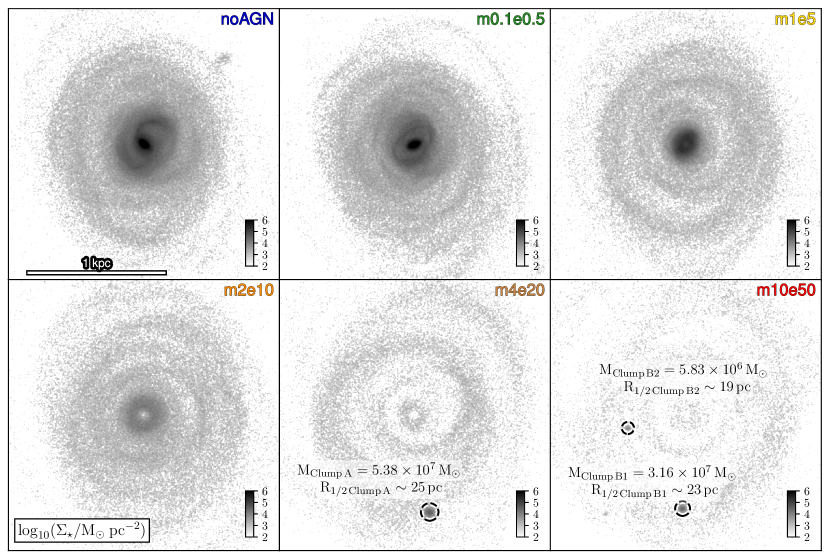
Figure 1 shows the face-on projected stellar mass surface density for six different simulations of the same massive star-forming galaxy (, at ), one with no AGN feedback (noAGN) and the rest including AGN feedback, with their AGN wind parameters varied as shown in Table 1. Each panel shows the population of stars that formed in the since the start of the quasar wind phase (). The noAGN simulation shows that, in the absence of AGN winds, the galaxy forms an ultra-dense nuclear stellar disk, with in the central pc and nuclear spiral and bar-like features. The second panel corresponds to the simulation with the weakest AGN winds, m0.1e0.5. With a mass outflow rate of and a kinetic efficiency , AGN feedback only decreases slightly the stellar mass formed relative to the noAGN simulation. As we continue to increase the strength of AGN winds with and in simulation m1e5, winds are strong enough to create a nuclear gas cavity ejecting a considerable amount of gas from the center, reducing star formation and the total stellar mass within pc to . With the reduced global SFR, we begin to see ring-like structures with stars tracing the spiral arms where they formed. For the first panel in the bottom row, m2e10, we now have an outflow rate of , where the gas cavity evacuated by the winds reached pc (Mercedes-Feliz et al., 2023), leaving a cavity imprinted also in the stellar component, and the global suppression of star formation limits the total stellar mass growth to .
The second strongest feedback case, m4e20, with a wind outflow rate of , has a dramatic negative impact on the global SFR, limiting the stellar mass growth to . In this case, besides the central cavity in the stellar distribution and the ring-like structures, the most prominent feature is a very dense stellar clump located pc from the center of the galaxy. This dense stellar region, which we denote as Clump A, has a half mass radius of with an enclosed stellar mass of . The strongest feedback case, m10e50, with an outflow rate of , has an even more dramatic effect on the galaxy, with the total stellar mass growth limited to . Interestingly, despite the strong suppression of star formation, we find two very dense stellar clumps with properties similar to Clump A in m4e20. We denote these two dense stellar regions as Clump B1 and Clump B2, with similar half mass radii and and stellar masses and , respectively. In this paper, we analyze in detail the formation of these ultra dense stellar clumps driven by strong AGN winds.
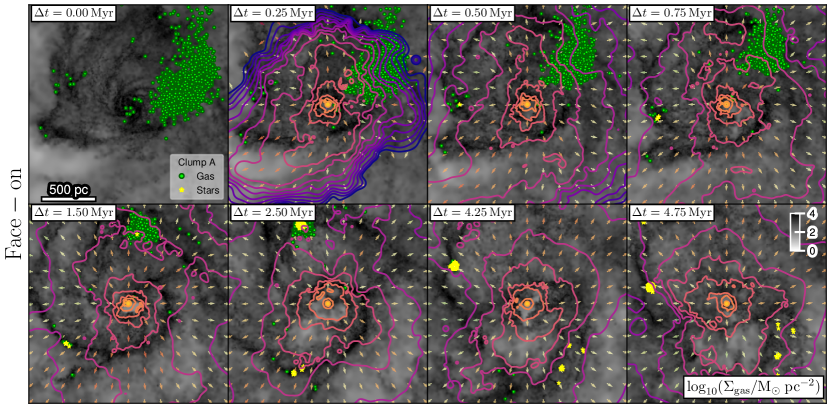
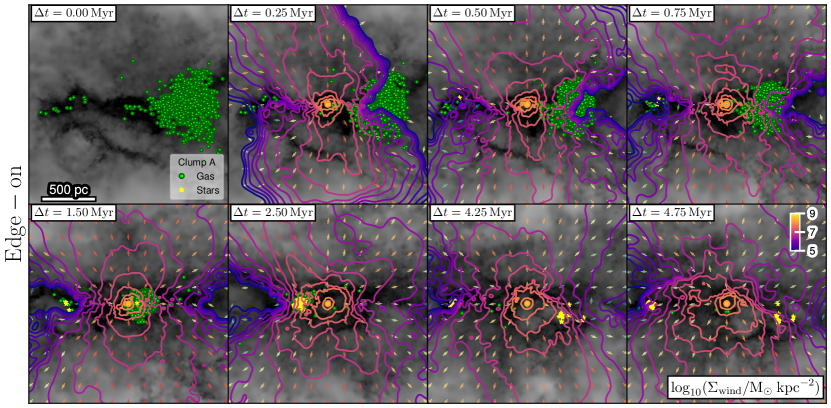
Figure 2 illustrates the formation of Clump A in simulation m4e20, where we show the projected gas surface density distribution for the central region at various snapshots in time. Green points indicate the location of gas particles that end up forming stars in Clump A (switching to yellow as they turn into stars) and the contours represent the wind mass surface density () with the arrows indicating the wind velocity. The top two rows show a face-on view of how the clump particles as well as the surrounding ISM interact with the AGN-driven winds, while the bottom two rows show an edge-on view to better indicate the depth at which the winds penetrate through the galaxy. At the beginning of the simulation, the galaxy resembles a turbulent, clumpy, kpc-scale disk with dense gas regions along fractured spiral arms and the even denser gas within the nuclear region. Progenitor Clump A particles are initially spread over a kpc-scale region, encompassing gas structures in two spiral arms and extending beyond the plane of the disk. At Myr, the AGN winds have effectively reached kpc whilst pushing the clump particles radially outwards in the plane of the disk and squeezing them into a wedge in the vertical direction. As the simulation proceeds, the AGN winds continue to propagate outward, blowing out the gas closest to the SMBH while compressing the progenitor gas particles (a significant fraction still infalling) into a dense gas clump that quickly turns into stars.
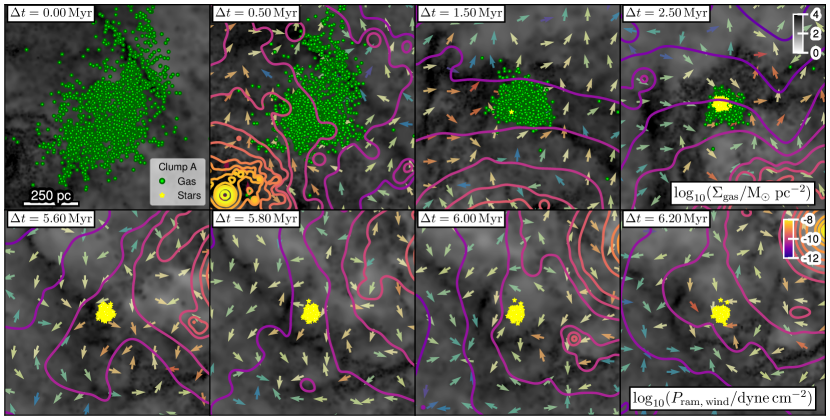
To further study the formation of Clump A, in simulation m4e20, Figure 3 provides an in-depth examination by showing face-on gas surface density projections, zooming into the 1 kpc region around the center of mass of Clump A. The contours are now outlining the mass-weighted ram pressure for the AGN winds, while the vector field shows the ram pressure gradient, in order to find any correlations with the clump formation. The top row shows how the AGN winds have impacted the clump particles as they continue to push the inner parts of the cloud while the outer part continues to infall to the center of the gravitational potential well, further compressing the cloud. The lower row focuses on the clump once it has efficiently exhausted its gas content, quickly forming into stars before stellar feedback can regulate star formation. We also see how SNe remove any remaining gas as a quasi-spherical shell expanding in the last three panels.
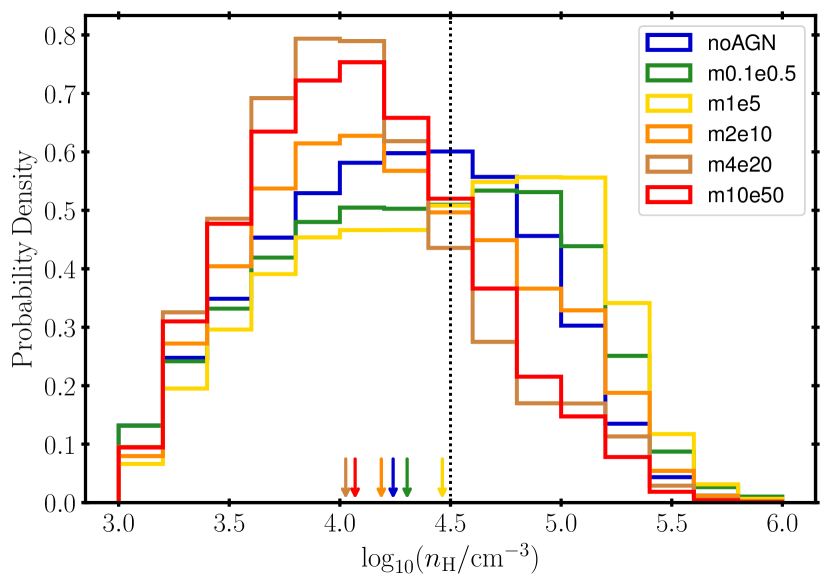
Every particle in the simulation has a unique set of identifiers (IDs), which are the same across snapshots, allowing us to link particles across time. This is useful for tracking particles between snapshots or even between the different simulation suites. Once a gas particle satisfies the star-forming conditions briefly mentioned in §2.1, it turns into a star particle. That star particle will retain the IDs of its “parent” gas particle. This allows us to find and trace star particles back in time to before they formed. We select all star particles that have formed within 35 Myr since the beginning of the quasar phase for each simulation (as seen in Figure 1) and track them back in time to the start of the quasar wind phase (), identifying their last instance as gas particle and recording the “final” gas density () right before turning into a star particle. Figure 4 shows the normalized probability distribution of final gas densities for stars that formed since the start of the quasar phase for each simulation. The black dotted line highlights the peak in the noAGN (blue) distribution. By using the noAGN simulation as the baseline, we see two interesting trends in the densities that gas particles reach right before turning into stars as we vary feedback parameters. In the simulations with relatively weak feedback, m0.1e0.5 (green) and m1e5 (yellow), a larger number of stars formed at densities higher than , with the peak skewing to higher densities as we make the AGN winds stronger. For simulations with even stronger winds, however, we see the opposite trend, with more stars forming at lower densities, the peak of the distribution shifting to , and a tail end extending to densities as high as . We will explicitly compare the same set of particles tracked across simulations below, but we can already see that varying the AGN wind strength can change the densities at which stars are forming for the overall stellar population.
4 Star Formation under Extreme Conditions
4.1 Gas density prior to star formation
In this section, we make comparisons between star-forming particles within the m4e20 simulation and those of the Clump A particles. We compare various properties in order to identify any systematic differences in the physical conditions of gas that forms stars in dense clumps compared to the galaxy disk.
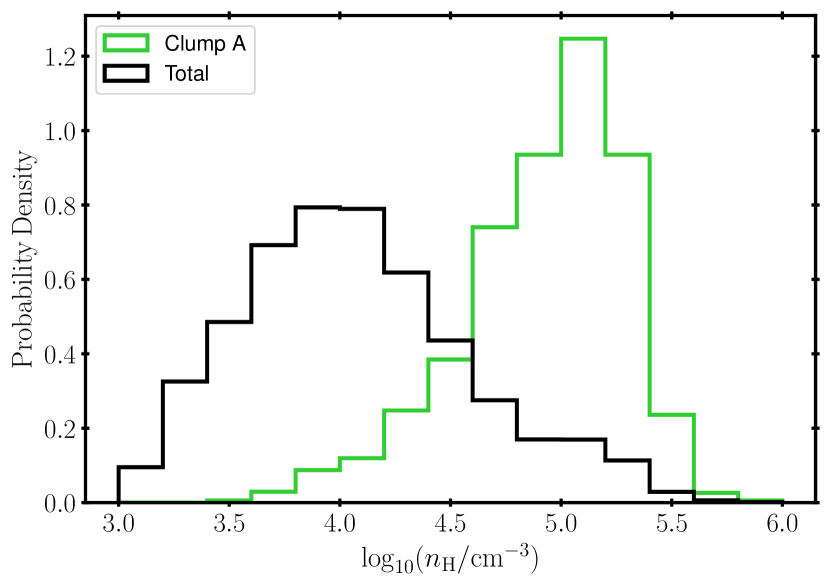
We use similar analysis as in Figure 4 to construct Figure 5, where we show the normalized probability distribution of final gas densities () for stars that formed within 35 Myr in simulation m4e20 (see also the middle bottom panel in Figure 1), including Clump A. The black line is the distribution for all of the stars that formed within 35 Myr of the start of the quasar phase (35,000 particles). As expected, all stars form at densities higher than the star formation density threshold in FIRE-2 (), where gas is also required to be molecular, self-gravitating, and Jeans unstable to form stars (Hopkins et al., 2018). The distribution peaks at with a long tail end to even higher densities. Alongside the overall population of stars formed within the simulation, we also show the distribution for the star particles in Clump A as the green line (1,700 tracked particles), which is much narrower and reaches significantly higher densities than the overall stellar population. The Clump A distribution peaks at a gas density of with a tail end at lower densities, reaching , a factor of three times above the density threshold. This indicates that Clump A particles form under quantitatively different conditions compared to the overall population of stars.
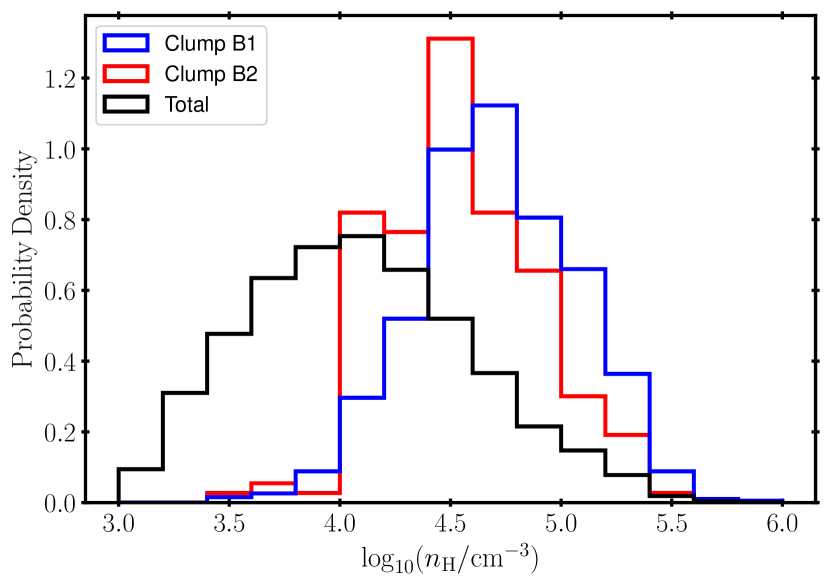
We perform the same analysis for the two clumps that we identify in simulation m10e50, which represents the strongest feedback case. Figure 6 shows the distributions of gas density prior to star formation for Clumps B1 (blue; 1,000 particles) and B2 (red, 200 particles) compared to the overall stellar population formed within 35 Myr in the presence of AGN winds (black; 18,000 star particles). The distribution for the overall population is similar to that of the simulation m4e20, with the peak at but with fewer stars forming overall than in the m4e20 case, reflective of the impact of stronger winds and faster quenching of star formation (the m10e50 simulation forms approximately half as many stars as the m4e20 simulation, in the same period). Interestingly, Clumps B1 and B2 combined represent about the same fraction of stars forming at as Clump A relative to the overall stellar population ( 50 %). However, the distributions for Clumps B1 and B2 differ from that of Clump A in some respects. Compared to Clump A, Clumps B1 and B2 exhibit a narrower range of densities and no prominent tail ends at either extreme. The distribution for Clump B1 peaks at , while the second clump peaks at a slightly lower density (compared to for Clump A). In conclusion, the three distinct clumps identified in the two simulations with the strongest AGN winds form their stars at higher densities than the overall population of stars formed in the presence of AGN winds. In the following, we focus our analysis on the formation of Clump A but similar results are obtained for clumps B1 and B2.
4.2 Time evolution of density and pressure gradients
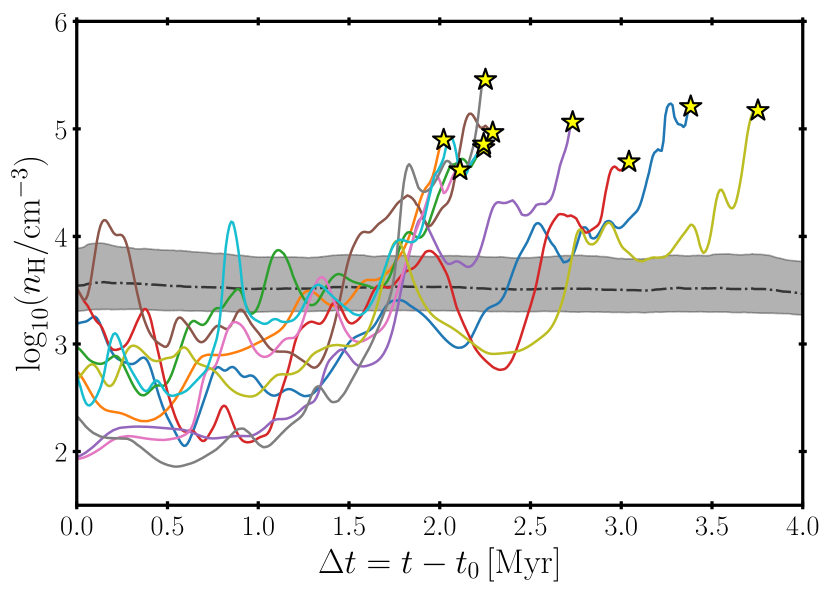
We can perform a more detailed analysis of clump formation compared to regular star formation by tracking the full time evolution of individual gas particles that end up forming stars in the clump. In Figure 7, we take ten randomly selected particles from Clump A and track their gas densities as a function of time. We compare these gas densities to the average density for star-forming gas in the galaxy during the first Myr of the simulation (as representative of more normal star formation before AGN winds completely disrupt the star-forming gas reservoir). Specifically, we consider star-forming gas within 2 kpc and calculate the percentiles of gas density at each time. For clarity, we smooth the resulting gas density histories by applying a running average with a time window of 0.05 Myr. At the start of the simulation, most progenitor clump particles have densities below that of the average star-forming gas in the galaxy, and often well below the threshold for star formation (). At 1.5 Myr after the beginning of the quasar phase, gas densities rise sharply as the clump begins to form, surpassing the average density of star-forming gas by more than one order of magnitude and resulting in the formation of stars (denoted by the star markers) at densities , as expected from Figure 5.
Figures 5-7 show that stars forming in the identified clumps do so at higher densities, by over an order of magnitude, than the overall population of stars that formed under the presence of AGN winds. This qualitative difference could be attributed to different physical mechanisms or events affecting progenitor clump particles. One way to quantify the plausible impact the AGN-driven winds on clump particles is to study the difference in pressure gradients compared to the remaining star-forming gas in the galaxy.
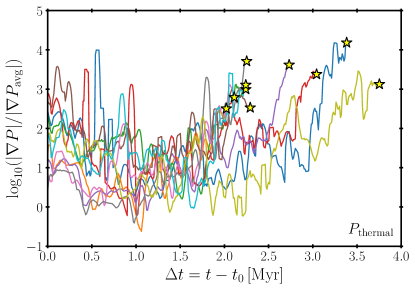
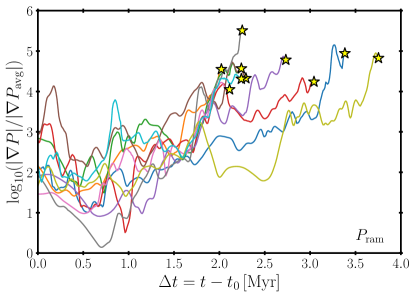
Figure 8 shows the magnitude of the thermal pressure gradient (top) and ram pressure gradient (bottom) acting on Clump A progenitor gas particles relative to regular star-forming gas, where we follow the time evolution of the same 10 particles and apply the same 0.05 Myr running average as in Figure 7. We compute the thermal pressure as , where is the gas density, is the internal energy for the gas, and is the adiabatic index which we set as . For the ram pressure, we simply take , where is the magnitude of the fluid velocity at the location of each gas particle. For both and , we consider all gas particles (AGN winds and pre-existing ISM gas) and compute pressure gradients in post-processing using Meshoid.444The Meshoid Python repository is available at https://github.com/mikegrudic/meshoid.
Both panels show that Clump A progenitor particles experience up to four and five orders of magnitude larger thermal and ram pressure gradients, respectively, compared to regular star-forming gas in the galaxy. We show below that ram pressure greatly dominates over thermal pressure (§5) which, together with the increased over-pressurization leading to the final conversion of gas into stars relative to average suggests that AGN winds play a key role triggering clump formation. We can make two clear distinctions between both panels: (i) the boosting of the ram pressure is shifted up by an order of magnitude, and (ii) the evolutionary tracks of each particle for the ram and thermal pressure gradients exhibit a similar trend up until the particle turns into a star particle. Overall both panels show similar results as in Figure 7: the clump particles exhibit higher pressure gradients for both ram and thermal pressure compared to the star-forming galaxy average, with the notable feature of showing that at all times the particles are experiencing steeper pressure gradients as opposed to the star-forming gas in the galaxy on average.
5 AGN Winds as Primary Driver of Clump Formation
Using the IDs for each particle within Clump A allows us to track them back in time to follow their evolution from a gas element up until they form into a star particle (as shown in §4.1), but we can also track the same particles between simulations of varying feedback strengths as well as in our noAGN simulation. This provides us with the opportunity to compare various properties between the two simulation runs and identify differences that can point to the plausible effect of AGN-driven winds on the formation of the clump. By tracking the same particles between both the m4e20 and noAGN simulations we can gain further insight into the reasons behind the absence of the clump in the noAGN simulation.
5.1 Impact of AGN winds on density and pressure gradients
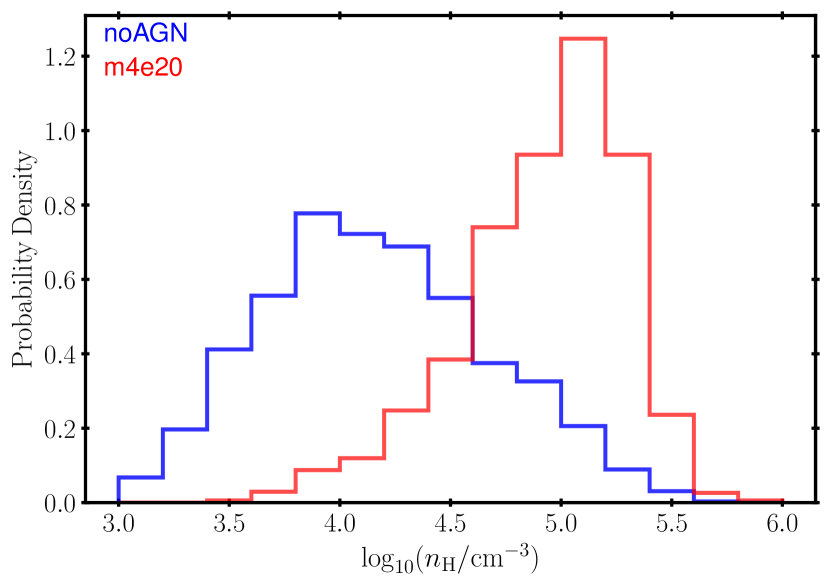
Due to the high efficiency of star formation in the noAGN simulation, we find that a majority of the progenitor Clump A particles that turned into star particles in the m4e20 simulation also do so in the absence of AGN winds. Figure 9 investigates the formation of these stars in the noAGN case compared to the m4e20 simulation by showing the normalized probability distribution of gas density just prior to forming into stars in each simulation. Although the noAGN simulation forms 95 % of the stars from the same gas progenitor particles of Clump A, they form at significantly lower densities (more than an order of magnitude) compared to the strong AGN wind case. The distribution for progenitor clump particles in the noAGN simulation is broadly consistent with the overall population of stars (Figure 4), and we show below (§5.2) that they do not form a clump or coherent stellar structure in the absence of AGN winds.
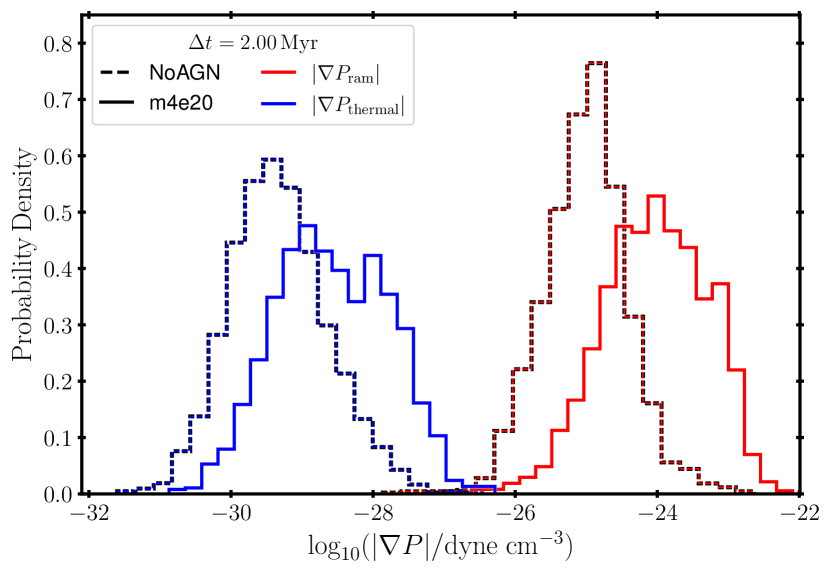
Figure 10 shows the normalized probability density distribution of the magnitude of the ram pressure (red) and thermal pressure (blue) gradients for Clump A progenitor gas particles at Myr in simulation m4e20 (solid lines) compared to the same gas particles in the noAGN simulation (dashed lines). We find that the ram pressure gradients are always stronger than the thermal pressure gradients by more than four orders of magnitude in both simulations. Importantly, the pressure gradient distributions are very different in the m4e20 and noAGN simulations, with the same clump progenitor gas particles experiencing much stronger pressure gradients in the presence of AGN winds. At this time ( Myr), Clump A is rapidly forming stars in simulation m4e20 while the same gas elements fuel significantly lower SFR in the noAGN simulation (shown explicitly in §5.2), pointing to pressurization by strong AGN winds as a key driver of the formation of the identified ultra dense stellar clumps.
5.2 Clump Growth and Size Evolution
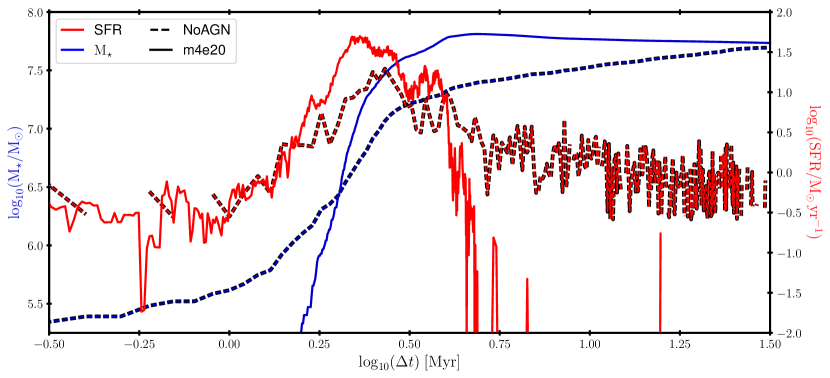
Figure 11 shows the SFR (red) and stellar mass growth (blue) of Clump A in simulation m4e20 as a function of time (solid lines), tracking the clump progenitor particles, compared to the SFR and build up of stellar mass of the same gas particles identified by ID in the noAGN simulation (dashed lines). We see that the progenitor clump particles actually begin to form stars earlier in the noAGN simulation while AGN winds appear to suppress their SFR in the first 1 Myr. However, as the AGN winds compress the progenitor gas particles, a short burst of star formation reaching at Myr forms most of the stellar mass of Clump A in less than 4 Myr. Meanwhile, the same gas particles in the noAGN simulation continue to form stars at a slower rate during 35 Myr, providing further indication that strong AGN winds are required for such an extreme clump formation event to occur. By the end of the simulation (), we see that both the m4e20 and noAGN simulations reach roughly similar stellar mass out of the same parent gas particles but under rather different conditions.
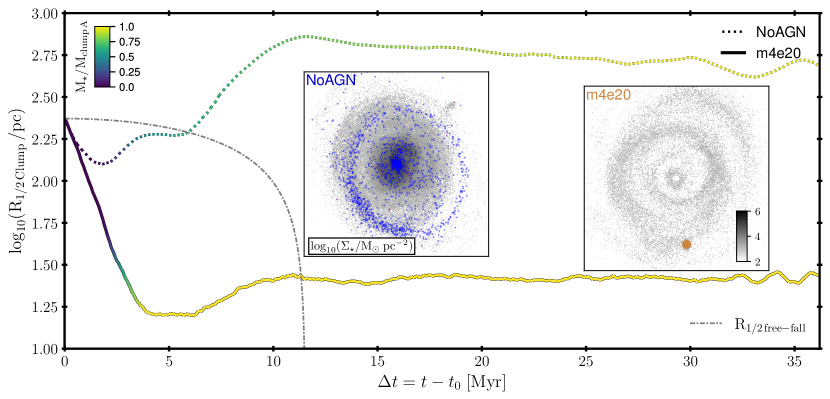
Figure 12 further explores the conditions that are driving the formation of Clump A under the presence of strong AGN winds, while the clump is absent in the noAGN simulation. For all Clump A progenitor particles (either gas or stars already formed), we compute the radius containing half of their total mass relative to their center of mass at each time. This effective clump radius, , is thus a measure of how compact or spread the progenitor gas cloud is as the clump forms. Figure 12 shows the effective radius of Clump A as a function of time (solid line) compared to calculated for the same set of progenitor particles identified in the noAGN simulation (dotted line), with the fraction of mass in the form of stars encoded by the color scale in each case. For reference, we also plot the half mass radius versus time for an idealized spherical gas cloud with the same mass and initial size as Clump A, uniform density, initially at rest, and collapsing under its own gravity neglecting all other forces (gray dash-dotted line). Following the derivation of the free-fall time, applying Newton’s second law to the equation of motion for a test particle at the edge of a cloud we instead solve for the radius. We numerically solve the second-order differential equation , with initial conditions (i) and (ii) . This free-fall time thus represents the shortest amount of time that Clump A would require to form in the absence of external forces and neglecting support from thermal pressure, turbulence, internal rotation, or shear forces.
Under the presence of strong AGN winds, the progenitor gas cloud is quickly compressed from down to 20 pc in less than 4 Myr, while most of the clump gas is converted into stars once at . In contrast, an idealized gas cloud with similar mass and size collapsing under its own weight would require 10 Myr to form a dense clump even neglecting any forces that could provide support against gravitational collapse. Compression by strong AGN winds therefore appears as a key ingredient for the fast formation of ultra dense stellar clumps. In the absence of AGN winds, the progenitor gas cloud collapses more slowly and less coherently into different structures, with a significant fraction of gas forming stars in the nuclear region and an off-center, lower-density clump that ends up disrupted by tidal forces as illustrated in the inset panel.
6 Discussion
In Mercedes-Feliz et al. (2023), we showed that AGN winds powered by a rapidly accreting central BH in FIRE simulations of a massive star-forming galaxy at the peak of activity can have global negative effects (suppressing star formation) for a range of assumed kinetic feedback efficiencies. We also identified several different signatures of local positive AGN feedback, including higher local star formation efficiency in compressed gas along the central cavity and the presence of outflowing material with ongoing star formation, but we showed that in all cases the negative AGN feedback effects always dominate, suppressing more than triggering star formation. The detailed analysis presented here further supports these conclusions for the case of very strong quasar winds, in qualitative agreement with the overall negative effects of previous AGN feedback implementations in galaxy formation simulations (Choi et al., 2015; Schaye et al., 2015; Hirschmann et al., 2016; Anglés-Alcázar et al., 2017a; Tremmel et al., 2017; Weinberger et al., 2017; Davé et al., 2019; Habouzit et al., 2021, 2022; Byrne et al., 2023; Wellons et al., 2023) but in contrast with some analytic models and idealized simulations suggesting that AGN feedback could have net positive effects and even drive strong starbursts (Gaibler et al., 2012; Ishibashi & Fabian, 2012; Zubovas & Nayakshin, 2012b; Silk, 2013; Zubovas et al., 2013; Nayakshin, 2014; Bieri et al., 2015; Bieri et al., 2016; Zubovas & Bourne, 2017).
The ultra-dense stellar clumps analysed here, with 10 of stars packed into 20 pc, represent the most extreme examples of local positive AGN feedback identified in our simulations. By carefully tracking back in time their formation and identifying the same progenitor gas cloud in an identical simulation without AGN winds, we have shown explicitly that the rapid compression of gas by AGN winds is indeed driving the formation of these extreme stellar clumps. Intriguingly, only the most powerful quasar winds implemented here appear to be capable of forming such clumps, corresponding to kinetic outflows with energy injection rate erg s-1 produced by an Eddington-limited BH with and kinetic efficiency . Luminous red quasars exhibit bolometric luminosities reaching (Goulding et al., 2018), with inferred outflow energies spanning of the quasar luminosity (Perrotta et al., 2019; Heckman & Best, 2023) which are thus roughly consistent with the strongest quasar winds modeled here. Nonetheless, collimated winds or jets, as opposed to isotropic winds, could have a similar effect compressing gas clumps at lower net energy output. In our simulations, strong quasar winds are able to fully quench star formation in the host galaxy in 20 Myr (Anglés-Alcázar et al., 2023; Cochrane et al., 2023; Mercedes-Feliz et al., 2023) while leaving one or two off-center ultra-dense stellar clumps as a direct signature of positive AGN feedback during the global quenching process.
Observational and theoretical works indicate different pathways for the formation of star clusters in galaxies, including gravitational instabilities, turbulent fragmentation, merging of smaller clumps, and hierarchical assembly (Rieder et al., 2013; Inoue et al., 2016; Kim et al., 2018a; Webb et al., 2019; Li & Gnedin, 2019; Adamo et al., 2020; Phipps et al., 2020; García-Bernete et al., 2021; Grudić et al., 2021; Faisst et al., 2022; Han et al., 2022; Larson et al., 2022; Li et al., 2022; Reina-Campos et al., 2022; Sameie et al., 2023). Massive, gas-rich galaxies at cosmic noon () often show signs of extended rotating discs along with giant star-forming clumps that can reach masses 10 and sizes 100–1000 pc (Elmegreen et al., 2009; Wuyts et al., 2012; Guo et al., 2015; Huertas-Company et al., 2020). Hydrodynamic simulations of gas-rich discs generally show that such clumps can either originate from infalling satellites or form via disc instabilities with a mass near or below the characteristic Toomre mass (Genel et al., 2012; Hopkins et al., 2012b; Anglés-Alcázar et al., 2014; Moody et al., 2014; Mandelker et al., 2017; Oklopčić et al., 2017; Ma et al., 2018; Dekel et al., 2022), where the fate of these clumps (whether they quickly disrupt or slowly sink to form the central bulge) depends on resolution and stellar feedback implementation (Genel et al., 2012; Hopkins et al., 2012b; Oklopčić et al., 2017; Ceverino et al., 2023). Galaxy mergers are another proposed pathway to form stellar clumps due to the high-pressure, gas-rich environments produced (Renaud et al., 2008a; Renaud et al., 2008b; Teyssier et al., 2010; Herrera et al., 2011; Renaud et al., 2015; Kim et al., 2018a; Moreno et al., 2019). Our simulations without AGN winds also produce massive, star-forming clumps through turbulent fragmentation and gravitational instability, but these are typically short-lived and quickly disrupted by radiative feedback, in agreement with previous FIRE simulations (Oklopčić et al., 2017; Ma et al., 2018, 2020).
The AGN feedback-triggered stellar clump formation scenario identified in our simulations is, however, clearly distinct from the traditional star-forming clumps formed in gas-rich galaxies via gravitational instability or mergers. With stellar mass and surface density , the stellar clumps analyzed here have properties similar to observed nuclear star clusters, super star clusters, and ultra compact dwarfs in the low- Universe (Bastian et al., 2013; Norris et al., 2014; Grudić et al., 2019) as well as some of the densest clumps observed in lensed systems at (Bouwens et al., 2021; Meštrić et al., 2022). A crucial aspect of this positive AGN feedback clump formation scenario is that AGN winds compress the progenitor gas cloud to much higher densities and much faster that could happen otherwise, with the gas cloud shrinking by a factor 1000 in volume and converting most of its mass into stars in only 2 Myr. The immediate impact of radiative feedback from massive stars is the dominant cloud dispersion mechanism before the first SNe go off, but the clump mass surface density is high enough to prevent disruption. Theoretical and observational studies have shown that the star formation efficiency (SFE) in collapsing clouds scales with the total mass surface density (; Hopkins et al., 2012a; Grudić et al., 2018; Kim et al., 2018b; Wong et al., 2019), with clouds reaching expected to turn most of their gas into stars as gravity overcomes the total momentum input from stellar feedback (Grudić et al., 2018; Grudić et al., 2020) and the fraction of stars formed in a gravitationally bound cluster also quickly rising at high SFE (Grudić et al., 2021). In our simulations, strong AGN winds trigger the formation of gas clumps with densities much higher than , resulting in the formation of massive, gravitationally bound stellar clumps with SFE 1.
Previous simulations have argued that other physical mechanisms besides self-gravity are helping giant molecular clouds collapse and form stars in starburst galaxies (Ma et al., 2020; He et al., 2023), and violent mergers of proto-galaxies at high-redshift have been proposed as a viable mechanism to quickly form globular clusters before stellar feedback can regulate star formation in the densest gas clouds (Kim et al., 2018a). We have shown that our extreme stellar clumps form on a timescale significantly shorter than the initial free-fall time of the progenitor gas cloud, demonstrating that gravity alone cannot form these objects and that ram pressure gradients provided by strong AGN winds are a crucial ingredient. In fact, the same progenitor gas cloud in the absence of AGN winds forms stars at significantly lower densities and over a much longer period of time (), with the resulting stellar structure quickly losing spatial coherency owing to tidal disruption by the host galaxy. In contrast, the ultra-dense stellar clump formed by positive AGN feedback remains gravitationally bound until the end of the simulation (), completing a few orbits around the center of the galaxy without signs of tidal disruption. Positive feedback by strong AGN winds may thus represent a plausible formation scenario for globular clusters.
Our results complement and extend previous work by Ma et al. (2020) on the formation of bound star clusters in a sample of high-resolution cosmological zoom-in simulations of galaxies from the FIRE project. They identified gravitationally bound star clusters that form in high-pressure clouds under the influence of stellar feedback. Notably, they found that stars in clusters tend to form in gas that is one order of magnitude denser than the typical gas density at which normal star formation occurs in the host galaxy. These high-density clouds are compressed by stellar feedback-driven winds and collisions of smaller clouds in highly turbulent environments, with the cloud-scale star formation efficiency approaching unity owing to the fast formation relative to the time for internal stellar feedback to react and stop star formation. While we focus on a more massive host galaxy at lower redshift and undergoing a luminous quasar phase, many of our findings mirror the results of Ma et al. (2020) for the case of positive AGN feedback instead of stellar feedback-triggering of star formation. The stellar clumps analyzed here are nonetheless representative of significantly more extreme and rarer conditions, where strong quasar winds provide just the right amount of ram pressure on a gas cloud with the optimal geometry and timing to quickly make it collapse to very high density while the remaining ISM gas content is evacuated from the host galaxy.
High gas mass resolution and adaptive gravitational softenings, explicit treatments of star formation in self-gravitating molecular gas and local stellar feedback (Hopkins et al., 2018), and hyper-refined AGN winds self-consistently capturing the geometry-dependent wind-ISM interaction (Torrey et al., 2020; Anglés-Alcázar et al., 2023) are all crucial ingredients to model the formation of these ultra-dense stellar clumps. Lower resolution simulations and/or relying on pressurized ISM models where star formation occurs at much lower average densities (e.g., Pillepich et al., 2018; Schaye et al., 2015; Davé et al., 2019) are thus not expected to resolve the formation of dense stellar clumps even in the presence of strong AGN winds. With stellar gravitational softening , our simulations predict stellar clump half-mass radii , suggesting that they could reach even higher densities in higher resolution simulations. The details of the star formation prescription (e.g., Hopkins et al., 2018; Nobels et al., 2023) may also impact the detailed properties of ultra dense stellar clumps, but they nonetheless appear to be the strongest manifestation of local positive AGN feedback in massive star-forming galaxies at their peak of activity.
Overall, our results support the dual role of AGN feedback in galaxies, which can trigger star formation locally while globally suppressing galaxy growth, and identify the conditions that can lead to the formation of ultra-dense stellar clumps and possibly globular clusters driven by powerful quasar winds. Future work should explore the AGN wind-ISM interaction and the dual role of AGN feedback for a broader range of host galaxy properties and redshifts (Wellons et al., 2023; Byrne et al., 2023) in cosmological hyper-refinement simulations with highly resolved multi-phase ISM (Anglés-Alcázar et al., 2021; Hopkins et al., 2023a), and investigate the frequency, lifetime, and observability of ultra-dense stellar clumps driven by local positive AGN feedback.
7 Summary and Conclusions
We have presented a detailed analysis of ultra-dense stellar clumps identified in a set of high-resolution cosmological zoom-in simulations of a massive galaxy near the peak of star formation activity ( at ) undergoing a strong quasar wind phase. The goal of this study is to investigate the implications of AGN feedback on the formation of these stellar structures and to further investigate the plausible positive versus negative effects of AGN feedback during a luminous quasar phase (Mercedes-Feliz et al., 2023). Our simulations include local stellar feedback and resolved multi-phase ISM physics from the FIRE-2 project (Hopkins et al., 2018), as well as hyper-refined AGN-driven winds which simultaneously capture their propagation and impact from the inner few pc to CGM scales (Anglés-Alcázar et al., 2023). Our main results can be summarized as follows:
-
1.
Only simulation variants with very strong AGN winds (mechanical energy injection rate erg s-1) lead to the formation of ultra-dense, off-center clumps with stellar mass , effective radius , and surface density . Collimated (as opposed to isotropic) outflows could have a similar effect at lower net energy output.
-
2.
Star particles that formed within the clumps do so at significantly higher gas density than the overall population of stars formed during the same time, reaching or roughly two orders of magnitude above the density threshold for star formation ().
-
3.
Progenitor clump particles are typically below the star formation threshold but increase their density rapidly owing to ram pressure gradients orders of magnitude larger than the pressure gradients experienced by regular star-forming gas in the galaxy.
-
4.
Tracking the same clump progenitor particles in the noAGN simulation, we demonstrate that most of that gas also forms stars but at significantly lower densities and experiencing much weaker pressure gradients compared to the same gas cloud in the presence of strong AGN winds.
-
5.
Rapid compression of gas by AGN winds drives a strong burst of star formation reaching and which converts most of the progenitor gas cloud into gravitationally bound stars in 2 Myr, with stellar feedback unable to regulate star formation. In contrast, the same gas cloud in the absence of AGN winds forms stars over a much longer period of time () and losing spatial coherency.
-
6.
The rate at which the progenitor gas cloud collapses to form the stellar clump ( in ) is much faster than the free-fall time under its own gravity even neglecting internal pressure support, turbulence, or shear forces, further emphasizing the need for strong AGN winds to enable the formation of these extreme stellar clumps.
Our results suggest that young, ultra-dense stellar clumps in recently quenched galaxies could be a unique signature of local positive AGN feedback acting alongside strong negative feedback by quasar winds, providing a plausible formation scenario for globular clusters.
Acknowledgements
The simulations were run on Flatiron Institute’s research computing facilities (Gordon-Simons, Popeye, and Iron compute clusters), supported by the Simons Foundation. We thank the Scientific Computing Core group at the Flatiron Institute for outstanding support. Additional numerical calculations were run on the Caltech compute cluster “Wheeler,” allocations FTA-Hopkins supported by the NSF and TACC, and NASA HEC SMD-16-7592, and XSEDE allocation TG-AST160048 supported by NSF grant ACI-1053575. JMF was supported in part by a NASA CT Space Grant Graduate Fellowship. DAA acknowledges support by NSF grants AST-2009687 and AST-2108944, CXO grant TM2-23006X, JWST grant GO-01712.009-A, Simons Foundation Award CCA-1018464, and Cottrell Scholar Award CS-CSA-2023-028 by the Research Corporation for Science Advancement. JM is funded by the Hirsch Foundation. CAFG was supported by NSF through grants AST-2108230, AST-2307327, and CAREER award AST-1652522; by NASA through grants 17-ATP17-0067 and 21-ATP21-0036; by STScI through grant HST-GO-16730.016-A; and by CXO through grant TM2-23005X. Support for PFH was provided by NSF Research Grants 1911233, 20009234, 2108318, NSF CAREER grant 1455342, NASA grants 80NSSC18K0562, HST-AR-15800.
Data Availability
The data supporting the plots within this article are available on reasonable request to the corresponding author. FIRE-2 simulations are publicly available (Wetzel et al., 2023) at http://flathub.flatironinstitute.org/fire. Additional FIRE simulation data, including initial conditions and derived data products, are available at https://fire.northwestern.edu/data/. A public version of the GIZMO code is available at http://www.tapir.caltech.edu/~phopkins/Site/GIZMO.html.
References
- Adamo et al. (2020) Adamo A., et al., 2020, Space Sci. Rev., 216, 69
- Al Yazeedi et al. (2021) Al Yazeedi A., Katkov I. Y., Gelfand J. D., Wylezalek D., Zakamska N. L., Liu W., 2021, ApJ, 916, 102
- Alatalo et al. (2015) Alatalo K., et al., 2015, ApJ, 798, 31
- Alexander & Hickox (2012) Alexander D. M., Hickox R. C., 2012, New Astron. Rev., 56, 93
- Anglés-Alcázar et al. (2013) Anglés-Alcázar D., Özel F., Davé R., 2013, ApJ, 770, 5
- Anglés-Alcázar et al. (2014) Anglés-Alcázar D., Davé R., Özel F., Oppenheimer B. D., 2014, ApJ, 782, 84
- Anglés-Alcázar et al. (2015) Anglés-Alcázar D., Özel F., Davé R., Katz N., Kollmeier J. A., Oppenheimer B. D., 2015, ApJ, 800, 127
- Anglés-Alcázar et al. (2017a) Anglés-Alcázar D., Davé R., Faucher-Giguère C.-A., Özel F., Hopkins P. F., 2017a, MNRAS, 464, 2840
- Anglés-Alcázar et al. (2017b) Anglés-Alcázar D., Faucher-Giguère C.-A., Quataert E., Hopkins P. F., Feldmann R., Torrey P., Wetzel A., Kereš D., 2017b, MNRAS, 472, L109
- Anglés-Alcázar et al. (2021) Anglés-Alcázar D., et al., 2021, ApJ, 917, 53
- Anglés-Alcázar et al. (2023) Anglés-Alcázar D., Mercedes-Feliz J., et al. 2023, in prep.
- Bastian et al. (2013) Bastian N., Schweizer F., Goudfrooij P., Larsen S. S., Kissler-Patig M., 2013, MNRAS, 431, 1252
- Bessiere & Ramos Almeida (2022) Bessiere P. S., Ramos Almeida C., 2022, MNRAS, 512, L54
- Bicknell et al. (2000) Bicknell G. V., Sutherland R. S., van Breugel W. J. M., Dopita M. A., Dey A., Miley G. K., 2000, ApJ, 540, 678
- Bieri et al. (2015) Bieri R., Dubois Y., Silk J., Mamon G. A., 2015, ApJ, 812, L36
- Bieri et al. (2016) Bieri R., Dubois Y., Silk J., Mamon G. A., Gaibler V., 2016, MNRAS, 455, 4166
- Bouwens et al. (2021) Bouwens R. J., Illingworth G. D., van Dokkum P. G., Ribeiro B., Oesch P. A., Stefanon M., 2021, AJ, 162, 255
- Byrne et al. (2023) Byrne L., et al., 2023, arXiv e-prints, p. arXiv:2310.16086
- Carniani et al. (2016) Carniani S., et al., 2016, A&A, 591, A28
- Ceverino et al. (2023) Ceverino D., Mandelker N., Snyder G. F., Lapiner S., Dekel A., Primack J., Ginzburg O., Larkin S., 2023, MNRAS, 522, 3912
- Choi et al. (2015) Choi E., Ostriker J. P., Naab T., Oser L., Moster B. P., 2015, MNRAS, 449, 4105
- Choi et al. (2018) Choi E., Somerville R. S., Ostriker J. P., Naab T., Hirschmann M., 2018, ApJ, 866, 91
- Cicone et al. (2014) Cicone C., et al., 2014, A&A, 562, A21
- Circosta et al. (2018) Circosta C., et al., 2018, A&A, 620, A82
- Cochrane et al. (2023) Cochrane R. K., et al., 2023, MNRAS, 523, 2409
- Costa et al. (2020) Costa T., Pakmor R., Springel V., 2020, MNRAS, 497, 5229
- Cresci & Maiolino (2018) Cresci G., Maiolino R., 2018, Nature Astronomy, 2, 179
- Cresci et al. (2015a) Cresci G., et al., 2015a, A&A, 582, A63
- Cresci et al. (2015b) Cresci G., et al., 2015b, ApJ, 799, 82
- Davé et al. (2019) Davé R., Anglés-Alcázar D., Narayanan D., Li Q., Rafieferantsoa M. H., Appleby S., 2019, MNRAS, 486, 2827
- Dekel et al. (2022) Dekel A., Mandelker N., Bournaud F., Ceverino D., Guo Y., Primack J., 2022, MNRAS, 511, 316
- Di Matteo et al. (2005) Di Matteo T., Springel V., Hernquist L., 2005, Nature, 433, 604
- Di Matteo et al. (2023) Di Matteo T., Angles-Alcazar D., Shankar F., 2023, arXiv e-prints, p. arXiv:2304.11541
- Drouart et al. (2016) Drouart G., Rocca-Volmerange B., De Breuck C., Fioc M., Lehnert M., Seymour N., Stern D., Vernet J., 2016, A&A, 593, A109
- Dubois et al. (2021) Dubois Y., et al., 2021, A&A, 651, A109
- Elmegreen et al. (2009) Elmegreen B. G., Elmegreen D. M., Fernandez M. X., Lemonias J. J., 2009, ApJ, 692, 12
- Fabian (2012) Fabian A. C., 2012, ARA&A, 50, 455
- Faisst et al. (2022) Faisst A. L., Chary R. R., Brammer G., Toft S., 2022, ApJ, 941, L11
- Faucher-Giguère & Quataert (2012) Faucher-Giguère C.-A., Quataert E., 2012, MNRAS, 425, 605
- Faucher-Giguère et al. (2012) Faucher-Giguère C.-A., Quataert E., Murray N., 2012, MNRAS, 420, 1347
- Feruglio et al. (2010) Feruglio C., Maiolino R., Piconcelli E., Menci N., Aussel H., Lamastra A., Fiore F., 2010, A&A, 518, L155
- Fiore et al. (2017) Fiore F., et al., 2017, A&A, 601, A143
- Gaibler et al. (2012) Gaibler V., Khochfar S., Krause M., Silk J., 2012, MNRAS, 425, 438
- Gallagher et al. (2019) Gallagher R., Maiolino R., Belfiore F., Drory N., Riffel R., Riffel R. A., 2019, MNRAS, 485, 3409
- García-Bernete et al. (2021) García-Bernete I., et al., 2021, A&A, 645, A21
- Genel et al. (2012) Genel S., et al., 2012, ApJ, 745, 11
- Gilli et al. (2019) Gilli R., et al., 2019, A&A, 632, A26
- Goulding et al. (2018) Goulding A. D., et al., 2018, ApJ, 856, 4
- Greene et al. (2012) Greene J. E., Zakamska N. L., Smith P. S., 2012, ApJ, 746, 86
- Grudić et al. (2018) Grudić M. Y., Hopkins P. F., Faucher-Giguère C.-A., Quataert E., Murray N., Kereš D., 2018, MNRAS, 475, 3511
- Grudić et al. (2019) Grudić M. Y., Hopkins P. F., Quataert E., Murray N., 2019, MNRAS, 483, 5548
- Grudić et al. (2020) Grudić M. Y., Boylan-Kolchin M., Faucher-Giguère C.-A., Hopkins P. F., 2020, MNRAS, 496, L127
- Grudić et al. (2021) Grudić M. Y., Kruijssen J. M. D., Faucher-Giguère C.-A., Hopkins P. F., Ma X., Quataert E., Boylan-Kolchin M., 2021, MNRAS, 506, 3239
- Guo et al. (2015) Guo Y., et al., 2015, ApJ, 800, 39
- Habouzit et al. (2021) Habouzit M., et al., 2021, MNRAS, 503, 1940
- Habouzit et al. (2022) Habouzit M., et al., 2022, MNRAS, 509, 3015
- Han et al. (2022) Han D., Kimm T., Katz H., Devriendt J., Slyz A., 2022, ApJ, 935, 53
- Harrison (2017) Harrison C. M., 2017, Nature Astronomy, 1, 0165
- Harrison et al. (2018) Harrison C. M., Costa T., Tadhunter C. N., Flütsch A., Kakkad D., Perna M., Vietri G., 2018, Nature Astronomy, 2, 198
- He et al. (2023) He H., Bottrell C., Wilson C., Moreno J., Burkhart B., Hayward C. C., Hernquist L., Twum A., 2023, ApJ, 950, 56
- Heckman & Best (2023) Heckman T. M., Best P. N., 2023, Galaxies, 11, 21
- Herrera et al. (2011) Herrera C. N., Boulanger F., Nesvadba N. P. H., 2011, A&A, 534, A138
- Hinshaw et al. (2013) Hinshaw G., et al., 2013, ApJS, 208, 19
- Hirschmann et al. (2016) Hirschmann M., De Lucia G., Fontanot F., 2016, MNRAS, 461, 1760
- Hopkins (2015) Hopkins P. F., 2015, MNRAS, 450, 53
- Hopkins & Elvis (2010) Hopkins P. F., Elvis M., 2010, MNRAS, 401, 7
- Hopkins & Quataert (2011) Hopkins P. F., Quataert E., 2011, MNRAS, 415, 1027
- Hopkins et al. (2012a) Hopkins P. F., Quataert E., Murray N., 2012a, MNRAS, 421, 3522
- Hopkins et al. (2012b) Hopkins P. F., Kereš D., Murray N., Quataert E., Hernquist L., 2012b, MNRAS, 427, 968
- Hopkins et al. (2014) Hopkins P. F., Kereš D., Oñorbe J., Faucher-Giguère C.-A., Quataert E., Murray N., Bullock J. S., 2014, MNRAS, 445, 581
- Hopkins et al. (2016) Hopkins P. F., Torrey P., Faucher-Giguère C.-A., Quataert E., Murray N., 2016, MNRAS, 458, 816
- Hopkins et al. (2018) Hopkins P. F., et al., 2018, MNRAS, 480, 800
- Hopkins et al. (2023a) Hopkins P. F., et al., 2023a, arXiv e-prints, p. arXiv:2309.13115
- Hopkins et al. (2023b) Hopkins P. F., et al., 2023b, MNRAS, 519, 3154
- Huertas-Company et al. (2020) Huertas-Company M., et al., 2020, MNRAS, 499, 814
- Inoue et al. (2016) Inoue S., Dekel A., Mandelker N., Ceverino D., Bournaud F., Primack J., 2016, MNRAS, 456, 2052
- Ishibashi & Fabian (2012) Ishibashi W., Fabian A. C., 2012, MNRAS, 427, 2998
- Jo et al. (2023) Jo Y., et al., 2023, ApJ, 944, 67
- Kim et al. (2018a) Kim J.-h., et al., 2018a, MNRAS, 474, 4232
- Kim et al. (2018b) Kim J.-G., Kim W.-T., Ostriker E. C., 2018b, ApJ, 859, 68
- Larson et al. (2022) Larson K. L., et al., 2022, arXiv e-prints, p. arXiv:2212.11425
- Leitherer et al. (1999) Leitherer C., et al., 1999, ApJS, 123, 3
- Li & Gnedin (2019) Li H., Gnedin O. Y., 2019, MNRAS, 486, 4030
- Li et al. (2022) Li H., Vogelsberger M., Bryan G. L., Marinacci F., Sales L. V., Torrey P., 2022, MNRAS, 514, 265
- Ma et al. (2018) Ma X., et al., 2018, MNRAS, 477, 219
- Ma et al. (2020) Ma X., et al., 2020, MNRAS, 493, 4315
- Maiolino et al. (2017) Maiolino R., et al., 2017, Nature, 544, 202
- Mandelker et al. (2017) Mandelker N., Dekel A., Ceverino D., DeGraf C., Guo Y., Primack J., 2017, MNRAS, 464, 635
- Mercedes-Feliz et al. (2023) Mercedes-Feliz J., et al., 2023, MNRAS, 524, 3446
- Meštrić et al. (2022) Meštrić U., et al., 2022, MNRAS, 516, 3532
- Moody et al. (2014) Moody C. E., Guo Y., Mandelker N., Ceverino D., Mozena M., Koo D. C., Dekel A., Primack J., 2014, MNRAS, 444, 1389
- Moreno et al. (2019) Moreno J., et al., 2019, MNRAS, 485, 1320
- Nardini et al. (2015) Nardini E., et al., 2015, Science, 347, 860
- Nayakshin (2014) Nayakshin S., 2014, MNRAS, 437, 2404
- Ni et al. (2023) Ni Y., et al., 2023, arXiv e-prints, p. arXiv:2304.02096
- Nobels et al. (2023) Nobels F. S. J., Schaye J., Schaller M., Ploeckinger S., Chaikin E., Richings A. J., 2023, arXiv e-prints, p. arXiv:2309.13750
- Norris et al. (2014) Norris M. A., et al., 2014, MNRAS, 443, 1151
- Oklopčić et al. (2017) Oklopčić A., Hopkins P. F., Feldmann R., Kereš D., Faucher-Giguère C.-A., Murray N., 2017, MNRAS, 465, 952
- Parsotan et al. (2021) Parsotan T., Cochrane R. K., Hayward C. C., Anglés-Alcázar D., Feldmann R., Faucher-Giguère C. A., Wellons S., Hopkins P. F., 2021, MNRAS, 501, 1591
- Perna et al. (2020) Perna M., et al., 2020, A&A, 643, A139
- Perrotta et al. (2019) Perrotta S., Hamann F., Zakamska N. L., Alexandroff R. M., Rupke D., Wylezalek D., 2019, MNRAS, 488, 4126
- Phipps et al. (2020) Phipps F., Khochfar S., Varri A. L., Dalla Vecchia C., 2020, A&A, 641, A132
- Pillepich et al. (2018) Pillepich A., et al., 2018, MNRAS, 473, 4077
- Ramos Almeida et al. (2022) Ramos Almeida C., et al., 2022, A&A, 658, A155
- Reina-Campos et al. (2022) Reina-Campos M., Keller B. W., Kruijssen J. M. D., Gensior J., Trujillo-Gomez S., Jeffreson S. M. R., Pfeffer J. L., Sills A., 2022, MNRAS, 517, 3144
- Renaud et al. (2008a) Renaud F., Theis C., Boily C. M., 2008a, Astronomische Nachrichten, 329, 1050
- Renaud et al. (2008b) Renaud F., Boily C. M., Fleck J. J., Naab T., Theis C., 2008b, MNRAS, 391, L98
- Renaud et al. (2015) Renaud F., Bournaud F., Duc P.-A., 2015, MNRAS, 446, 2038
- Richings & Faucher-Giguère (2018) Richings A. J., Faucher-Giguère C.-A., 2018, MNRAS, 474, 3673
- Rieder et al. (2013) Rieder S., Ishiyama T., Langelaan P., Makino J., McMillan S. L. W., Portegies Zwart S., 2013, MNRAS, 436, 3695
- Rodríguez del Pino et al. (2019) Rodríguez del Pino B., Arribas S., Piqueras López J., Villar-Martín M., Colina L., 2019, MNRAS, 486, 344
- Sameie et al. (2023) Sameie O., et al., 2023, MNRAS, 522, 1800
- Santoro et al. (2016) Santoro F., Oonk J. B. R., Morganti R., Oosterloo T. A., Tadhunter C., 2016, A&A, 590, A37
- Schaye et al. (2015) Schaye J., et al., 2015, MNRAS, 446, 521
- Schutte & Reines (2022) Schutte Z., Reines A. E., 2022, Nature, 601, 329
- Shin et al. (2019) Shin J., Woo J.-H., Chung A., Baek J., Cho K., Kang D., Bae H.-J., 2019, ApJ, 881, 147
- Silk (2013) Silk J., 2013, ApJ, 772, 112
- Somerville & Davé (2015) Somerville R. S., Davé R., 2015, ARA&A, 53, 51
- Sturm et al. (2011) Sturm E., et al., 2011, ApJ, 733, L16
- Su et al. (2021) Su K.-Y., et al., 2021, MNRAS, 507, 175
- Teyssier et al. (2010) Teyssier R., Chapon D., Bournaud F., 2010, ApJ, 720, L149
- Tombesi et al. (2013) Tombesi F., Cappi M., Reeves J. N., Nemmen R. S., Braito V., Gaspari M., Reynolds C. S., 2013, MNRAS, 430, 1102
- Torrey et al. (2020) Torrey P., et al., 2020, MNRAS, 497, 5292
- Tremmel et al. (2017) Tremmel M., Karcher M., Governato F., Volonteri M., Quinn T. R., Pontzen A., Anderson L., Bellovary J., 2017, MNRAS, 470, 1121
- Villaescusa-Navarro et al. (2021) Villaescusa-Navarro F., et al., 2021, ApJ, 915, 71
- Webb et al. (2019) Webb J. J., Bovy J., Carlberg R. G., Gieles M., 2019, MNRAS, 488, 5748
- Weinberger et al. (2017) Weinberger R., et al., 2017, MNRAS, 465, 3291
- Wellons et al. (2020) Wellons S., Faucher-Giguère C.-A., Anglés-Alcázar D., Hayward C. C., Feldmann R., Hopkins P. F., Kereš D., 2020, MNRAS, 497, 4051
- Wellons et al. (2023) Wellons S., et al., 2023, MNRAS, 520, 5394
- Wetzel et al. (2023) Wetzel A., et al., 2023, ApJS, 265, 44
- Wong et al. (2019) Wong T., et al., 2019, ApJ, 885, 50
- Wuyts et al. (2012) Wuyts S., et al., 2012, ApJ, 753, 114
- Wylezalek & Zakamska (2016) Wylezalek D., Zakamska N. L., 2016, MNRAS, 461, 3724
- Wylezalek et al. (2020) Wylezalek D., Flores A. M., Zakamska N. L., Greene J. E., Riffel R. A., 2020, MNRAS, 492, 4680
- Zakamska & Greene (2014) Zakamska N. L., Greene J. E., 2014, MNRAS, 442, 784
- Zirm et al. (2005) Zirm A. W., et al., 2005, ApJ, 630, 68
- Zubovas & Bourne (2017) Zubovas K., Bourne M. A., 2017, MNRAS, 468, 4956
- Zubovas & Nayakshin (2012a) Zubovas K., Nayakshin S., 2012a, MNRAS, 424, 666
- Zubovas & Nayakshin (2012b) Zubovas K., Nayakshin S., 2012b, MNRAS, 424, 666
- Zubovas et al. (2013) Zubovas K., Nayakshin S., King A., Wilkinson M., 2013, MNRAS, 433, 3079