Mode-locked GaN waveguide polariton laser
Abstract
We introduce a novel mode-locking scheme based on polariton-polariton interactions and we demonstrate its operation in a long GaN-based waveguide cavity. The exciton-polariton active layer acts both as a gain medium and as a self-focusing medium with a large Kerr-like nonlinearity. The monitoring of the cavity free spectral range across the lasing threshold evidences the linearization of the strongly nonlinear mode dispersion due to self-phase modulation. The Gross-Pitaevskii equation for the coupled exciton and photon fields taking into account the exact cavity geometry, predicts the appearance of optical pulses within the cavity that correspond to optical solitons. Pulses widths are about 100 fs, both in theory and experiment.
I Introduction
Exciton-polaritons (polaritons) are photon modes mixed with excitons. The frequency range around the exciton frequency where this mixing is sizable is a few times the so-called Rabi splitting, which quantifies the strength of the exciton-photon interaction. Their exciton fraction confers polaritons a strongly interacting character. In the language of non-linear optics, this corresponds to a large Kerr-like non-linearity. This feature was well identified in the 2000’s, when parametric amplification [1], parametric oscillation [2, 3, 4, 5], and bistability [6, 7] have been observed in planar microcavities. The resonant processes associated with polaritons are several orders of magnitude more efficient than in other non-linear materials.
These results were obtained in GaAs-based microcavities, where the Rabi splitting is 10 meV or less, resulting in a relatively narrow bandwidth detrimental to mode-locking and where excitons are only stable at very low temperature. A first approach to move to room temperature polaritonic devices has been based on the use of large band gap semiconductors, namely GaN and ZnO, for which room temperature polariton lasing has been first proposed [8, 9] and then observed [10, 11, 12, 13]. The development of room-temperature polaritonics has been widened thanks to the use of organics [14, 15] and, more recently, of perovskites [16, 17, 18] and transition metal dichalcogenides (TMDs) [19]. However, the smaller exciton Bohr radius and, in most structures, the use of a bulk active medium instead of quantum wells makes the non-linear response in GaN and ZnO weaker than in equivalent GaAs structures. Thus non-linear effects have not been straightforwardly observed in these materials. In parallel to the developments in vertical microcavities, and starting from the middle of the 2010’s, the study of polariton waveguides and polariton photonic crystal slabs has gained a lot of interest due to the expected benefits in terms of polariton propagation speeds, polariton lifetimes and ease of fabrication [20]. Using GaAs polariton waveguides and resonant excitation [21], evidence for bright soliton creation was reported [22], and explained by an increase of the self-focusing non-linearity by two orders of magnitude compared with other standard non-linear media (for instance, SiN). In large band gap semiconductor waveguides polariton lasing was predicted [23] and observed recently both in ZnO [24] and GaN [25] horizontal cavities. These in-plane cavities were several tens of micrometers long, opening up the potential for mode-locking via four-wave mixing processes. A weak signature of nonlinear polariton-polariton interaction under non-resonant optical pumping was reported in a waveguide containing GaN-quantum wells as an active medium [26].
In Fabry-Perot cavities, photonic modes are equally spaced in frequency only if the material is non-dispersive, i.e. if it has a constant group index. However, when a dispersive Kerr-medium fills the cavity, non-linearities renormalize the eigenmode frequencies by an effect called self-phase modulation [27, 28] in optics. Indeed, indication for self-phase modulation in a GaN-based planar waveguide has been observed under pulsed resonant excitation [29]. Under these conditions, scattering processes involving two particles at energy and giving rise to particles at energies and become phase-matched and, thus, allowed. So-called mode locking can occur, where instead of a monomode laser a bright temporal soliton, with equally spaced frequency components, forms and propagates back and forth in the cavity. This dynamic behaviour results in a pulsed laser output [30, 31, 32]. Mode-locking exploiting the polaritonic nonlinearity has been predicted/suggested [24, 26, 29, 33] but it has never been observed so far.
In this work we investigate waveguide polariton lasers based on a GaN ridge waveguide surrounded by in-plane distributed Bragg reflectors, which define horizontal Fabry-Perot resonators. In the 60 m-long cavity, we resolve Fabry-Perot modes and determine thereby the corresponding exciton-polariton dispersion. At low temperature (70 K) monomode polariton lasing is observed. At higher temperature (150 K), where polariton relaxation is enhanced, lasing takes place at lower energy and becomes intrinsically multimode. The renormalization of the eigenenergies gives rise to equally spaced mode frequencies, which is a clear evidence of the buildup of resonant parametric processes where non-linear interactions produce self-phase modulation compensating for the polariton group velocity dispersion. We find a polariton mediated Kerr non-linear index , orders of magnitude larger than non-linearity based on other mechanisms in semiconductors and in full agreement with theoretical expectations based on the magnitude of the polariton-polariton interactions. The envelope of the lasing modes is well fitted by a bright soliton wave function. This picture is confirmed by numerical simulations using the modified Gross-Pitaevskii equation and considering the precise geometry of our cavity. We thus demonstrate the first pulsed polariton laser that display mode locking. This is a clear demonstration of polariton non-linearities in large band gap semiconductors, with the prospect of attaining room-temperature operation.
II Results
A Sample design
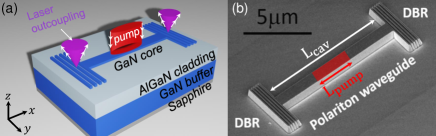
The epilayer heterostructure consists of a 3--thick GaN buffer, a 1.5--thick Al0.08Ga0.92N cladding and a 150-nm-thick GaN waveguide core grown by metal-organic vapor phase epitaxy (MOVPE) on c-plane sapphire. The planar slab waveguide is then patterned by electron beam lithography and dry deep etching, as described in Ref. [25] and shown in Fig. 1(a,b). The laser devices consist of 1 m-wide ridge waveguides ended by 4 pairs in-plane distributed Bragg reflectors (GaN-air DBRs). This work focuses on a device with a cavity length L=60 m.
B Linear regime: polariton dispersion below threshold
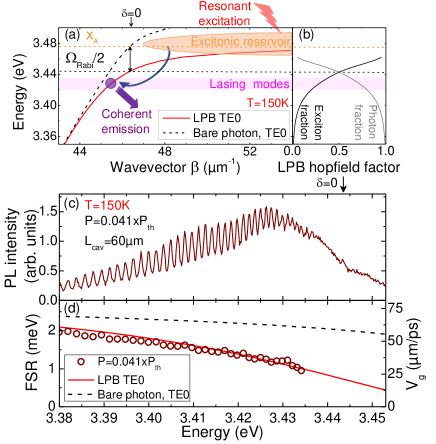
The in-plane cavities are optically pumped with a ns-pulsed laser rate, pulses) that excites resonantly the exciton reservoir, as sketched in Fig. 2(a). The line-shaped pump profile (Fig. 1(b)) is adjusted to excite partially, or entirely, the cavity length (pump length , controlling thereby the size of the exciton reservoir. These excitons in the reservoir relax and feed the lower polariton branch (LPB). The polariton dispersion evidences the strong exciton-photon coupling regime through the anti-crossing of the LPB and the exciton resonance (Fig. 2(a)), as measured and modelled in similar planar waveguides in Ref. [34]. Within the cavity, the LPB is quantized into Fabry-Perot modes with discrete wavevectors, whose signal is partially redirected to the vertical direction by the DBRs, which act not only as in-plane mirrors but also as outcouplers. This signal can be collected by the microscope objective of a micro-photoluminescence set-up. Figure 2(c) illustrates the emission spectrum of a m-long cavity in linear scale. The measurement was performed at a temperature of with a power level significantly below threshold. The spectrum displays Fabry-Perot modes from to . The free spectral range (FSR) between the modes is directly proportional to the first derivative of the polariton dispersion, i.e. to the group velocity
| (1) |
where is the energy of the lower polariton branch, and the propagation constant in the waveguide.
The achievement of the strong coupling regime can therefore be assessed by comparing the measured cavity FSR to the theoretical model with and without exciton resonances: Fig. 2(d) shows a good quantitative agreement when considering the strong-coupling between the photonic TE0 mode and the GaN excitons, following the procedure detailed in Ref. [24, 25]. The decrease of the FSR from 2.0 to (55 change) is reproduced by the polariton dispersion (solid red line), exhibiting a strong group velocity dispersion (see Appendix A). On the other hand, the FSR calculated without exciton resonances in the dielectric function (“TE0 bare photon”, dashed black lines) is almost constant around varying by only 12 in the same energy range. In the model the GaN exciton energy is determined from the reflectivity spectra of the same active layer taken at 150 K, whereas the core and cladding thicknesses are measured from scanning electron micrographs. At zero exciton-photon detuning , this model provides a precise estimate of the Rabi splitting, , characterizing the exciton-photon coupling strength, as shown in Figure 2(a).
C Nonlinear regime at 70 K: single-mode polariton laser operation
In a waveguide polariton laser, lasing occurs as soon as the population of one of the Fabry-Perot cavity modes overcomes unity so that bosonic stimulation enhances the scattering processes towards the lasing mode. Polariton laser operation in a continuous wave (CW) regime has been demonstrated for the investigated devices in Ref. [25], where they were modelled in detail. It was notably shown that polariton lasing could be achieved by pumping the entire laser cavity, as in a standard edge-emitting laser, but also when pumping only a fraction of the total length, which can be much smaller than of the cavity length. This establishes a clear distinction between waveguide polariton lasers and edge-emitting lasers based on an electron-hole plasma. Furthermore, it was shown that when the pump length L amounts to only of the cavity length, the polariton laser threshold shows just a three-fold increase compared to pumping the whole cavity.
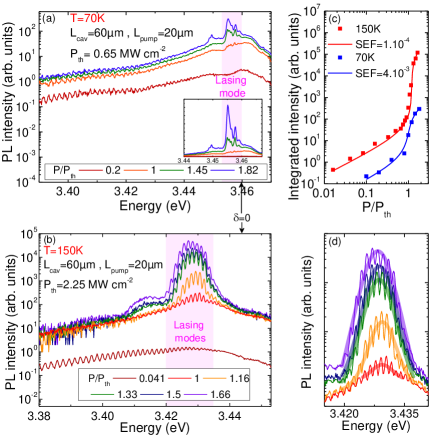
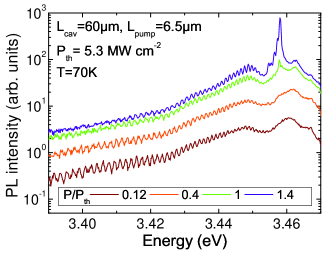
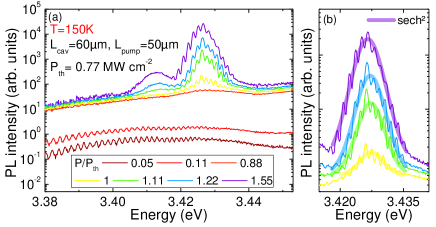
Figure 3(a) presents the CW laser operation measured at T=70 K, which is very similar to the one reported in Ref. [25]: the spectrally-resolved emission below threshold shows a set of Fabry-Perot modes covering a wide spectral range. Upon increasing the pumping intensity, some modes around 3.458 eV (close to zero exciton-photon detuning ) undergo a strong nonlinear intensity increase and a line narrowing, indicating CW lasing that rapidly extends to a few modes. Single-mode CW lasing for a shorter pump length (L=6.5 m) is presented in the Appendix D (Figure 7) for exactly the same cavity.
D Nonlinear regime at 150 K: multimode polariton laser operation with mode synchronization
As the sample temperature is increased to T=150 K (Fig. 3(b)), the spectrum is almost unchanged below threshold. However, for the same pump length as in section C, the threshold value is 3.5 times larger than at 70 K. The behaviour at threshold is radically different since the emission is inherently multimode, with a well-defined envelope nicely described by a secant hyperbolic function (Fig. 3(d), see Appendix C), and about ten modes involved in the non-linear emission. The Hopfield coefficients of the lasing modes are about excitonic and photonic (Fig. 2(b)). The input-output characteristics (Fig. 3(c)) show that the non-linear increase of the emitted intensity is much steeper at T=150 K (multimode case) than at T=70 K (monomode case), with a spontaneous emission factor SEF decreasing by a factor 40, from to .
The change of the waveguide polariton dispersion at threshold provides a detailed insight into the phase synchronization of the laser modes. We therefore analyze the energy shift of each cavity mode across threshold (Figure S3(a)) and the corresponding cavity FSR, shown in Figure 4(a).
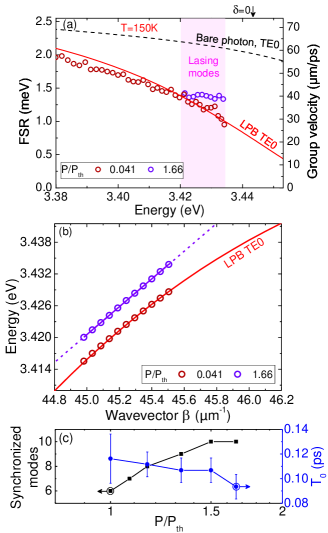
It is noteworthy that at T=150 K (Figure 4(a)) beyond threshold, the FSR of the lasing modes around 3.43 eV becomes constant, indicating that these modes now propagate at a common group velocity (right axis). The number of modes with a constant FSR increases from 6 modes at lasing threshold to 10 modes at (Figure 4(c)). A more detailed sweep in terms of pumping intensities can be found in Figure 8. The corresponding linearization of the polariton dispersion, deduced from the measured energy shift of each lasing mode, is shown Fig. 4(b) (bare data in Figure 9(a)). The data are directly deduced from Figure 9(a) by attributing the value to the central lasing mode at 3.423 eV, in accordance with the theoretical dispersion far below threshold, and then adding multiples of to as imposed by the wavevector quantization in the cavity.
In semiconductor edge-emitting lasers operating in the weak coupling regime, the linearization is usually interpreted in terms of mode locking, which occurs when the group velocity dispersion parameter and the nonlinear refractive index (defined in Appendix A and B) have opposite signs and the self-focusing condition is fulfilled [28]. In exciton-polariton systems, the non-linear refractive index is linked with a well-defined microscopic mechanism: polariton-polariton interactions. Meanwhile, the modification of the dispersion is interpreted in terms of the elementary excitations of the polariton fluid, at the heart of parametric processes [2, 35] and superfluidity [36, 37].
The spectral linewidth of the pulses (Fig. 3(d)) increases with the pumping power beyond the laser threshold, and the corresponding duration of the pulses decreases from to (Figure 4(c)). The pulse width at half maximum (see Appendix C, Eq. (11)) is about 17 times smaller than the period between pulses for and
Note that the waveguide polariton lasers discussed so far in this work were achieved by pumping just a fraction of the cavity length, similar to our previous CW operation demonstration [25]. One can wonder what role is actually played by the unpumped section of the cavity. The Figure 10 in Appendix C presents the spectra of the same device discussed above but pumped along almost the full cavity length instead of The effect on the laser threshold is very similar to the one reported under CW operation conditions[25]: when increasing the length of the pumping spot by a factor , the threshold pump power density decreases by a factor 3. The threshold pump energy per pulse, integrated over the pumped section, increases only by from nJ/pulse to nJ/pulse. This attests to the small impact of the potential additional losses associated with a large unpumped section in the cavity, which would have been totally detrimental in an edge-emitting laser operating in the weak coupling regime. Interestingly, the mode-locking dynamics is independent of the pump length: it is characterized by the same lasing energy, the same multimode emission with a hyperbolic secant spectral lineshape, and thus the same deduced pulse widths . This demonstrates that the unpumped section of the cavity does not act as a saturable absorber.
E Simulation of polariton mode-locking dynamics
In order to understand the lasing regimes observed in the experimental results, we simulate the laser dynamics inside the waveguide cavities thanks to the temporal resolution of the 1D Gross-Pitaevskii equation (GPE) for coupled excitons and photons, which is closely related to the non-linear Schrödinger equation describing mode locking in lasers. In general, theoretical modelling of the coupled condensate-reservoir system always needs to focus on the detailed description of one of the subsystems: the condensate or the reservoir. This is due to the opposite nature of the two: the condensate is fully coherent (well-described with the Gross-Pitaevskii equation), and the reservoir is fully incoherent (well-described with the Boltzmann equations). The choice depends on what is more important in the particular problem: the dynamics of the condensate [38, 39] (in which case the reservoir needs to be simplified) or the dynamics of the reservoir[23, 26, 25] (in which case the condensate coherent dynamics is neglected). To describe the mode locking due to the interactions in the condensate, we obviously need to focus on the dynamics of the condensate, therefore neglecting the reservoir. The equations, qualitatively similar to [38], read:
| (2) | |||||
| (3) |
where is the photon wavefunction, the exciton wave function, the Rabi splitting value. The kinetic energy operator encodes the 1D-dispersion of the photonic guided modes and is defined as , with being the 1D Fourier transform, its inverse, and the dispersion of the guided photonic mode. Similarly, the gain operator is defined by , where is the gain profile, which we use as an input of the model respecting features obtained in previous works [23, 26, 25]. Qualitatively the gain profile shifts toward lower energy and becomes wider when increasing either the temperature or the pumping power. The coefficient is a scattering rate, is the mean exciton density in the condensate and a saturation density for the mean value of the 1D density (the density can locally be larger). is a weak white noise term aiming to describe spontaneous scattering processes, which are absent from the Gross-Pitaevskii equation. and are the photonic and excitonic potentials, respectively, both containing high barriers at the end of the cavities with an imaginary part representing the losses at the DBRs. The excitonic potential also contains a contribution of the exciton reservoir , with a variable amplitude , whose profile is defined by the pumping spatial distribution . This reservoir contribution embeds both the exciton-exciton interaction and the screening of the exciton oscillator strength. is the 1D exciton-exciton interaction constant, obtained by dividing the 3D constant [40] ( meV is the exciton binding energy nm the exciton Bohr radius) by the transverse effective area of the guided modes m2 (the product of the active layer thickness nm and the ridge width m).
To summarize, the adjustable parameters of the model are the gain profile (in particular, its width) and the saturation density . All other quantities (including the center of the gain profile) are extracted from the experiment or calculated from first principles. The simulation is performed by solving the equations (2) and (3) over time with zero initial condition, until the system settles in a quasistationary regime.
For a narrow gain profile (2 meV wide) centered at polariton states corresponding to a detuning meV and weak interactions meV, the model predicts a stationary monomode lasing regime in agreement with experimental observations made at 70 K and in [25]. To describe data taken at 150 K, we use a gain centered at detuning meV, meV and we adjust the gain width to reproduce the experiment. Figure 5 shows the results of this simulation for a gain width of 6 meV, for which a single bright temporal soliton forms in the cavity, with a roundtrip period of 3.05 ps (panel a).
Figure 5(b) shows the Fourier transform of the temporal evolution of the soliton over a time window of 3 ns taken at one edge of the waveguide. It is compared with the experimentally measured output spectrum at . The spacing between peaks in theory is almost constant and equal to 1.35 meV for all the ten modes shown in the figure, in good agreement with the experiment. On the other hand, the frequency width of the envelope is smaller by about 20% in theory. The theoretical spectrum can be made broader using a wider gain. However, this leads to the development of several temporal solitons competing within the cavity and the spectrum becomes less regular. We cannot conclude currently if this is a feature of the simplified model we use (we neglect the decoherence and energy relaxation within the polariton modes, for example), or if this multi-soliton regime is also present in the experiment. The experimental spectrum seems very regular and is well fitted by a function, which tends to suggest a single soliton regime. The simulation on Fig. 5 can be compared to the profile both in time and in frequency, leading to a time-bandwidth product equal to ; this value slightly exceeds the lower limit expected for Fourier-transform pulses, indicating that a small contribution of chirping exists in the simulated pulses.
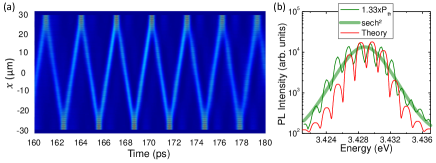
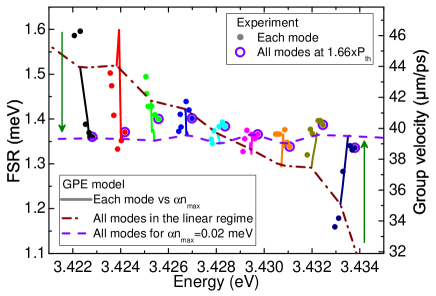
Figure 6 shows in solid line, for the same gain width used to simulate Fig. 5, the theoretically computed FSR for increasing values of pumping (represented by in the model). It is compared to the experimentally extracted FSR for pumping values ranging between and . Below threshold, the experimental FSR (brown dotted-dashed line) varies from 1.55 meV to 1.15 meV in this frequency range (20% change), which is also the case in theory, which confirms that the experimental and theoretical energy dispersion relations are in good agreement. Increasing pumping, the FSR of modes at lower energy decreases from 1.55 to 1.35 meV, whereas the FSR of modes at higher energy increases from 1.15 to 1.35 meV. The FSR of central modes stays constant. At the highest pumping value the FSR of the 10 modes involved in the soliton becomes constant in energy at 1.35-1.36 meV, within an accuracy of 2%, which is a very clear signature of a mode locking effect. The theoretical calculation reproduces this effect completely. The trajectory of individual FSR is well described, including the fact that FSR does not evolve monotonically versus pumping: FSR can slightly increase first and then decrease towards 1.35 meV, or viceversa.
These observations clearly confirm the possibility of mode-locking and self-pulsing via polaritonic nonlinearities as suggested in earlier works on polariton amplification in ZnO and GaN polariton waveguides [24, 26, 29, 41], and in theoretical proposals on polariton lasing in GaN microrings [33], but had never been achieved.
III Quantification of polaritons nonlinearities
The observed mode locking of a polariton laser exhibits distinct characteristics compared to the standard figures of merit in other nonlinear optical systems (as defined in [28] and detailed in the Appendix) :
(i) Due to the short cavity length, the roundtrip time of the pulse train (3 ps) corresponds to a repetition frequency larger than A direct time-resolved observation of the pulsed regime is therefore very difficult to provide experimentally.
(ii) As shown in figure 4(a), the group velocity varies by more than (from 40 to ) within the spectral range involved in mode-locked lasing; this relates to a group velocity dispersion parameter which is 4 orders of magnitude larger than in nonlinear optical fibers [42] and 2 orders of magnitude larger than in AlGaAs waveguides investigated for soliton formation [43]. The corresponding “dispersion length” is [28] (see Appendix A), one order of magnitude smaller than the typical mm-scaled values in nonlinear waveguides [43] and comparable to the cavity length in the presently investigated cavities.
(iii) The energy per pulse of the current mode-locked laser is difficult to estimate since the in-plane output of the laser devices cannot be directly accessed: indeed, only a small and unknown fraction of the laser emission is collected thanks to the scattering by the DBRs. To obtain a quantitative estimation, we here consider that the lasing modes occupancy at threshold is close to one. The integrated intensity is rising at threshold by a factor (Figure 3(c)). We therefore consider that the soliton contains polaritons. This corresponds to a soliton energy of , and a soliton peak power Such pulse energies are 2 to 3 orders of magnitude smaller than the threshold for phase modulation reported in similar waveguides under resonant excitation per long pulse, with a 5 times wider transverse mode profile)[29].
We can also estimate the magnitude of the polariton-polariton interaction in each soliton where is the exciton fraction and is the exciton-exciton interaction defined in the previous section. The total interaction energy in the soliton is and the FSR shift is . Taking the FSR shift of the order of 0.2 meV which is obtained both experimentally (Figure 6) and in the simulation yields . We can compare this measured value to the theory using the exciton-exciton interaction constant in 3D and using the soliton volume which is computed as the product of the mode transverse effective area and the soliton healing length along the ridge (). Using these parameters we find a theoretical value which is very close to the one obtained from experimental data. One should notice that in theory the interaction energy in the soliton is 15 times larger than because the polaritons present in the system are not distributed along the 60 of the sample, but concentrated in the 4 of the soliton.
Finally we can estimate which fraction of the pumping laser is transferred to the soliton, which turns out to be of the order of : indeed, each ns-long pump pulse has an energy of nJ at threshold, and generates a train of about 1000 mode-locked pulses, based on the round-trip time. This conversion from the optical pump to the polariton laser emission accounts for the geometrical matching between the pump spot and the m-wide ridge, for the absorption by the active layer, and for the competition between exciton spontaneous emission in the reservoir and exciton stimulated relaxation towards the polariton lasing modes.
(iv) In nonlinear optics the Kerr type non-linearities can be expressed as a contribution to the refractive index where is the electric field irradiance. This imposes a phase modulation of the propagating wave along a wire where is the wave vector and the coordinate. In the Gross Pitaevskii picture describing non-linearities in terms of interaction between particles, the interaction energy induces a phase modulation where is the propagation time. By writing that position and propagation time are linked by the phase velocity where is the refractive index allows to express versus as: where is the polariton energy. Using the measured value of gives cm2W-1. Replacing by its theoretical expression related to the polariton-polariton interaction allows to write:
| (4) |
yielding cm2W-1, which is quite close (just a factor 2 difference) to the experimental value found above. It is three orders of magnitude larger than in bulk nonlinear materials, and similar to the one measured in AlGaAs waveguides [43]. Accounting for the transverse effective area of the the guided modes , we can estimate the nonlinear length m.
The estimated value of is close to the estimates of ref. [29] for QW based nitride polariton waveguides, which are similar to ours but without Fabry-Perot cavities. Indeed, in ref. [29] the deposited gratings are only used for the coupling of the resonant excitation laser to the waveguide polariton modes and their collection. Instead, in the present work the DBRs define an in-plane cavity providing the necessary laser feedback. Besides, they also outcouple a fraction of the laser emission to the vertical direction, enabling us to collect it. A spectral broadening of the injected fs-long light pulses was observed [29] and interpreted in terms of polariton non-linearities involving the exciton-exciton repulsion and the reduction of the exciton oscillator strength, both contributing to a density-dependent blueshift of the polariton frequency. The non-linearity was measured for free propagating polaritons without feedback, down to propagation lengths of m and resonant pump energies of pJ/pulse. Under non-resonant excitation, similar waveguides without cavity feedback also evidenced the onset of modulation instability of the polariton relaxation [26], which is an additional evidence of Kerr-like parametric processes.
The present results, with both a flattening of the FSR and a hyperbolic secant spectral lineshape, provide a clear demonstration that the parametric processes foster mode synchronization among the lasing modes. We emphasize that the orders of magnitude of the nonlinear length , of the dispersion length and of the roundtrip length in our cavities are comparable, which is consistent with the onset of mode-locking in our devices. This exemplifies how polariton waveguide devices are prone to reduce both the length scale and the energy scale of nonlinear photonic devices, and increase the operation frequency.
IV Connection with conventional mode-locked semi-conductors and solid-state lasers
Passive mode-locking, i.e. mode-locking which does not demand an external modulation, is usually achieved via a saturable absorber, most often on semiconductor basis [32], although the resulting pulse might be close to a Kerr-soliton [44, 45, 46]. Even in the case of the so-called Kerr-lens mode-locking in Ti:Saphire lasers [47] (and some vertical-cavity semiconductor lasers [48, 49]), the mode-locking is primarily not a dispersive effect but achieved via saturable losses, i.e. a generalized form of saturated absorption, as the change of modal size due to nonlinear lensing changes the losses at intra-cavity apertures [32]. Similarly, nonlinear polarization rotation in fibre lasers controls losses in the polarization sensitive elements [50]. In edge-emitting semiconductor lasers, saturable absorption is usually provided by an unpumped absorber section and a pumped gain section in so-called two-section devices [51, 52, 53]. On the contrary, in our results the independence of the mode-locking on the fraction of pumped cavity length indicates that the polariton system does not operate as a two-sections device, in the sense described before.
There have been some observations of passive mode-locking in single-section edge-emitting lasers, in particular for quantum dash and quantum dot gain materials [54, 55, 56]. This has been sometimes referred to as ‘magic’ mode-locking [57], in analogy to the ‘magic’ mode-locking in Ti:Saphire lasers before the role of saturable losses at apertures in Kerr-lens mode-locking was understood [32]. There has been some debate whether mode-locking in single-section devices is due to intrinsic nonlinearities as the Kerr-nonlinearity from four-wave-mixing only or whether unintentional saturable absorption in not sufficiently pumped perimeter areas plays a role [58]. Recent work indicates that four-wave mixing in combination with other nonlinearities as gain saturation and spatial hole burning can be indeed enough to explain sustained mode-locking [58, 59, 53] but its quality and stability depends strongly on injection levels [58] and/or extra-cavity pulse suppression might be required for longer lasers [56]. Polaritonic systems with very strong Kerr interactions are hence expected to be more robust.
V Conclusion
In summary, we have presented the demonstration of a pulsed polariton laser relying on a mode locking mechanism based on the strong polariton-polariton Kerr nonlinearity. This last nonlinearity is strong enough to compensate for the large group velocity dispersion associated to the lower polariton branch in the strong exciton-photon coupling regime. The chosen cavity geometry, with a GaN-based active layer, is highly similar to standard ridge semiconductor edge-emitting lasers, but our investigation as a function of the gain length highlights the strong difference with the saturable absorber approach to mode-locking. The spectral signatures of mode-locking are well reproduced through simulations solving the Gross-Pitaevskii equation for the coupled exciton and photon fields, leading to solitons. The estimated soliton energy per pulse and the laser repetition frequency beyond are promising figures of merit for the development of polariton-based pulsed lasers for integrated photonics.
Acknowledgments
The authors acknowledge fundings from the French National Research Agency (ANR-11-LABX-0014, ANR-21-CE24-0019-01, IDEX-ISITE 16-IDEX-0001 ”CAP 20-25”) and the Region Occitanie (ALDOCT-001065), and the support of the European Union’s Horizon 2020 program, through a FET Open research and innovation action under the grant agreement No. 964770 (TopoLight). C2N is a member of RENATECH-CNRS, the French national network of large micro-nanofacilities.
Appendix A Mode-propagation constant in a dispersive material
The mode-propagation constant can be expressed as a Taylor series expansion, which captures its behavior in terms of the frequency that denotes the central point of the pulse spectrum. It is given by [28]:
| (5) |
where and are interconnected with the refractive index and its derivatives. They can be related through the following expressions:
| (6) | |||
| (7) |
The parameter corresponds to the group-velocity dispersion (GVD), which characterizes the pulse broadening phenomenon caused by dispersion in the group velocity. It is specifically known as the GVD parameter.
Appendix B Nonlinear refractive index
The refractive index can be expressed as the sum of a linear term and a nonlinear term, which is typically related to the nonlinear refractive index coefficient and the electric field amplitude [28, 43]:
| (8) |
where is the transverse effective area of the guided modes. is indeed a measure of the strength of nonlinearity in the material.
In the case of a Kerr medium, is related to the real part of third-order nonlinear susceptibility [28]:
| (9) |
Appendix C Secant hyperbolic pulse propagation in a dispersive nonlinear material
Let us here consider the propagation of a secant hyperbolic pulse, with the envelope of the electric field amplitude given by:
| (10) |
measures the pulse duration, such that the full width at half maximum (FWHM) of the pulse can be expressed as follows [28]:
| (11) |
The corresponding spectral lineshape is
| (12) |
Two characteristic length can be deduced, which characterize the respective impacts of dispersion and nonlinearity:
Appendix D CW lasing at T=70 K
The competition between lasing modes at depends on the pump length. It is observed that the contrast between the first lasing mode and the next ones is stronger if the pump length is shorter. Figure 7(a) presents the spectra of the same cavity as in Figure 3, but pumped over a smaller pump length The laser emission remains monomode up to
Appendix E Multimode lasing at T=150 K
A Evolution of the FSR
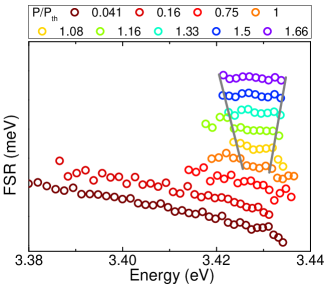
The figure 4(a) presents the evolution of the FSR over a subset of spectra vs the pump power The full series of data is presented in the figure 8. Each dataset is shifted by in a waterfall representation in order to emphasize the transition from a monotonic decrease of the FSR vs energy below threshold, to a more complex dependence with a flattened range (between the gray lines) above threshold.
B Quantify the weakening of the exciton-photon interaction below threshold
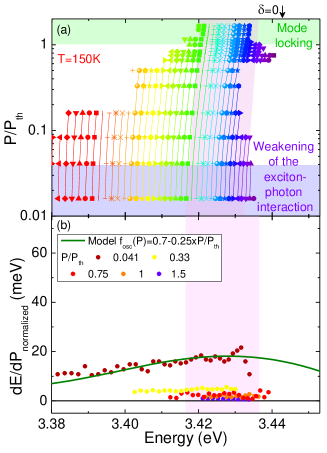
Figure 9(a) presents the measured shift of each individual cavity mode across the lasing threshold. Here we focus our analysis on the low power regime, for typically, and consider the assumption of a progressive screening of the exciton oscillator strength due to the increased density of excitons in the reservoir, leading to an overall blueshift of the LPB dispersion. This effect is well documented for microcavity polaritons [60, 61, 62, 63] and more recently for waveguide polaritons [jamadi_edge-emitting_2018, 64, 65, 66]. In such a case, this blueshift is not constant along the LPB branch: it reaches its maximum near zero exciton-photon detuning. Figure 9 presents (a) the energy of each Fabry-Perot mode (extracted from the spectra in Fig. 3(a)) and (b) its first derivative with respect to the normalized pump power . At the lowest investigated pump power, the blueshift strongly depends on the exciton-photon detuning. Let us compare this feature to a first order model of the weakening of the oscillator strength: we already know from our previous works that the oscillator strength of the GaN excitons is very close to its nominal value in the case of a planar waveguide (correction factor [34] whereas it is reduced by 30% in the case of the presently investigated etched GaN waveguides (correction factor , [25] and Fig. 4). If we assume a linear decrease of the correction factor of the oscillator strength with the density of the exciton reservoir, i.e. with the pump power density, then we can calculate the new LPB dispersion, the corresponding blueshift for the Fabry-Perot modes and its derivative vs pump power. We reach a quantitative agreement with the experimental values (brown points) at the lowest pump power for i.e. a correction factor (green plain line). When the pump power is further increased, we observe that the first derivative strongly deviates from this model, with a flat part close to zero around the lasing energy, and a steep change towards negative (resp. positive) values for the modes at energies below (resp above) the lasing spectral range. We can therefore conclude that a weakening of the oscillator strength contributes to the blueshift of the modes. It fully explains the blueshift measured at the lowest investigated pump power well below threshold (blue shaded pump range in Fig. 3(a)); but it cannot explain the flattening of the modes rapidly taking place at threshold and attributed to mode-locking (green-shaded pump range).
C Dependence on the pump length
At 150 K, the emission spectra of the 60-m-long cavity, using a 50-m-long pump spot are shown in figure 10(a) for a series of pumping powers. Far below threshold, the spectra are characterized by the presence of Fabry-Perot modes observed across a large energy range. Beyond threshold, a multimode emission resembling that in figure 3(b) is observed. The spectra above threshold can be effectively fitted using a secant hyperbolic squared function, as shown in figure 10(b). It is also important to note that the corresponding pulse duration, , remains unchanged regardless of the spot length (compare Fig. 10(b) and Fig. 3(b) in the main text).
References
- Saba et al. [2001] M. Saba, C. Ciuti, J. Bloch, V. Thierry-Mieg, R. André, L. S. Dang, S. Kundermann, A. Mura, G. Bongiovanni, J. L. Staehli, and B. Deveaud, High-temperature ultrafast polariton parametric amplification in semiconductor microcavities, Nature 414, 731 (2001).
- Savvidis et al. [2000a] P. G. Savvidis, J. J. Baumberg, R. M. Stevenson, M. S. Skolnick, D. M. Whittaker, and J. S. Roberts, Angle-Resonant Stimulated Polariton Amplifier, Phys. Rev. Lett. 84, 1547 (2000a).
- Baumberg et al. [2000] J. J. Baumberg, P. G. Savvidis, R. M. Stevenson, A. I. Tartakovskii, M. S. Skolnick, D. M. Whittaker, and J. S. Roberts, Parametric oscillation in a vertical microcavity: A polariton condensate or micro-optical parametric oscillation, Phys. Rev. B 62, R16247 (2000).
- Stevenson et al. [2000] R. M. Stevenson, V. N. Astratov, M. S. Skolnick, D. M. Whittaker, M. Emam-Ismail, A. I. Tartakovskii, P. G. Savvidis, J. J. Baumberg, and J. S. Roberts, Continuous Wave Observation of Massive Polariton Redistribution by Stimulated Scattering in Semiconductor Microcavities, Phys. Rev. Lett. 85, 3680 (2000).
- Whittaker [2001] D. M. Whittaker, Classical treatment of parametric processes in a strong-coupling planar microcavity, Phys. Rev. B 63, 193305 (2001).
- Baas et al. [2004a] A. Baas, J. P. Karr, H. Eleuch, and E. Giacobino, Optical bistability in semiconductor microcavities, Phys. Rev. A 69, 023809 (2004a).
- Baas et al. [2004b] A. Baas, J.-P. Karr, M. Romanelli, A. Bramati, and E. Giacobino, Optical bistability in semiconductor microcavities in the nondegenerate parametric oscillation regime: Analogy with the optical parametric oscillator, Phys. Rev. B 70, 161307(R) (2004b).
- Malpuech et al. [2002] G. Malpuech, A. Di Carlo, A. Kavokin, J. Baumberg, M. Zamfirescu, and P. Lugli, Room-temperature polariton lasers based on GaN microcavities, Appl. Phys. Lett. 81, 412 (2002).
- Zamfirescu et al. [2002] M. Zamfirescu, A. Kavokin, B. Gil, G. Malpuech, and M. Kaliteevski, ZnO as a material mostly adapted for the realization of room-temperature polariton lasers, Phys. Rev. B 65, 161205 (2002).
- Christopoulos et al. [2007] S. Christopoulos, G. B. H. von Högersthal, A. J. D. Grundy, P. G. Lagoudakis, A. V. Kavokin, J. J. Baumberg, G. Christmann, R. Butté, E. Feltin, J.-F. Carlin, and N. Grandjean, Room-Temperature Polariton Lasing in Semiconductor Microcavities, Phys. Rev. Lett. 98, 126405 (2007).
- Baumberg et al. [2008] J. J. Baumberg, A. V. Kavokin, S. Christopoulos, A. J. D. Grundy, R. Butté, G. Christmann, D. D. Solnyshkov, G. Malpuech, G. Baldassarri Höger von Högersthal, E. Feltin, J.-F. Carlin, and N. Grandjean, Spontaneous Polarization Buildup in a Room-Temperature Polariton Laser, Physical Review Letters 101, 10.1103/PhysRevLett.101.136409 (2008).
- Christmann et al. [2008] G. Christmann, R. Butté, E. Feltin, J.-F. Carlin, and N. Grandjean, Room temperature polariton lasing in a GaN/AlGaN multiple quantum well microcavity, Appl. Phys. Lett. 93, 051102 (2008).
- Li et al. [2013] F. Li, L. Orosz, O. Kamoun, S. Bouchoule, C. Brimont, P. Disseix, T. Guillet, X. Lafosse, M. Leroux, J. Leymarie, M. Mexis, M. Mihailovic, G. Patriarche, F. Réveret, D. Solnyshkov, J. Zúñiga Pérez, and G. Malpuech, From Excitonic to Photonic Polariton Condensate in a ZnO-Based Microcavity, Phys. Rev. Lett. 110, 196406 (2013).
- Kéna-Cohen and Forrest [2010] S. Kéna-Cohen and S. Forrest, Room-temperature polariton lasing in an organic single-crystal microcavity, Nat. Photon. 4, 371 (2010).
- Plumhof et al. [2013] J. D. Plumhof, T. Stöferle, L. Mai, U. Scherf, and R. F. Mahrt, Room-temperature Bose–Einstein condensation of cavity exciton–polaritons in a polymer, Nature Materials 13, 247 (2013).
- Su et al. [2018] R. Su, J. Wang, J. Zhao, J. Xing, W. Zhao, C. Diederichs, T. C. H. Liew, and Q. Xiong, Room temperature long-range coherent exciton polariton condensate flow in lead halide perovskites, Science Advances 4, eaau0244 (2018), https://www.science.org/doi/pdf/10.1126/sciadv.aau0244 .
- Su et al. [2020] R. Su, S. Ghosh, J. Wang, S. Liu, C. Diederichs, T. C. H. Liew, and Q. Xiong, Observation of exciton polariton condensation in a perovskite lattice at room temperature, Nature Physics 16, 301 (2020).
- Lu et al. [2020] L. Lu, Q. Le-Van, L. Ferrier, E. Drouard, C. Seassal, and H. S. Nguyen, Engineering a light-matter strong coupling regime in perovskite-based plasmonic metasurface: quasi-bound state in the continuum and exceptional points, Photon. Res. 8, A91 (2020).
- Zhao et al. [2021] J. Zhao, R. Su, A. Fieramosca, W. Zhao, W. Du, X. Liu, C. Diederichs, D. Sanvitto, T. C. H. Liew, and Q. Xiong, Ultralow threshold polariton condensate in a monolayer semiconductor microcavity at room temperature, Nano Letters 21, 3331 (2021).
- Bajoni et al. [2009] D. Bajoni, D. Gerace, M. Galli, J. Bloch, R. Braive, I. Sagnes, A. Miard, A. Lemaître, M. Patrini, and L. C. Andreani, Exciton polaritons in two-dimensional photonic crystals, Phys. Rev. B 80, 201308 (2009).
- Walker et al. [2013] P. M. Walker, L. Tinkler, M. Durska, D. M. Whittaker, I. J. Luxmoore, B. Royall, D. N. Krizhanovskii, M. S. Skolnick, I. Farrer, and D. A. Ritchie, Exciton polaritons in semiconductor waveguides, Applied Physics Letters 102, 012109 (2013).
- Walker et al. [2015] P. M. Walker, L. Tinkler, D. V. Skryabin, A. Yulin, B. Royall, I. Farrer, D. A. Ritchie, M. S. Skolnick, and D. N. Krizhanovskii, Ultra-low-power hybrid light–matter solitons, Nature Communications 6, 8317 (2015).
- Solnyshkov et al. [2014a] D. D. Solnyshkov, H. Terças, and G. Malpuech, Optical amplifier based on guided polaritons in GaN and ZnO, Applied Physics Letters 105, 231102 (2014a).
- Jamadi et al. [2018] O. Jamadi, F. Reveret, P. Disseix, F. Medard, J. Leymarie, A. Moreau, D. Solnyshkov, C. Deparis, M. Leroux, E. Cambril, S. Bouchoule, J. Zuniga-Perez, and G. Malpuech, Edge-emitting polariton laser and amplifier based on a zno waveguide, Light: Science & Applications 7, 82 (2018).
- Souissi et al. [2022] H. Souissi, M. Gromovyi, T. Gueye, C. Brimont, L. Doyennette, D. Solnyshkov, G. Malpuech, E. Cambril, S. Bouchoule, B. Alloing, S. Rennesson, F. Semond, J. Zúñiga Pérez, and T. Guillet, Ridge polariton laser: Different from a semiconductor edge-emitting laser, Phys. Rev. Applied 18, 044029 (2022).
- Ciers et al. [2020] J. Ciers, D. D. Solnyshkov, G. Callsen, Y. Kuang, J.-F. Carlin, G. Malpuech, R. Butté, and N. Grandjean, Polariton relaxation and polariton nonlinearities in nonresonantly cw-pumped iii-nitride slab waveguides, Phys. Rev. B 102, 155304 (2020).
- Agrawal and Olsson [1989] G. Agrawal and N. Olsson, Self-phase modulation and spectral broadening of optical pulses in semiconductor laser amplifiers, IEEE Journal of Quantum Electronics 25, 2297 (1989).
- Agrawal [2001] G. P. Agrawal, Nonlinear Fiber Optics (Academic Press, San Diego, 2001).
- Paola et al. [2021] D. Paola, M. D., P. M. Walker, R. P. A. Emmanuele, A. V. Yulin, J. Ciers, Z. Zaidi, J.-F. Carlin, N. Grandjean, I. Shelykh, M. S. Skolnick, R. Butté, and D. N. Krizhanovskii, Ultrafast-nonlinear ultraviolet pulse modulation in an alingan polariton waveguide operating up to room temperature, Nature Communications 12, 3504 (2021).
- Hofer et al. [1991] M. Hofer, M. Fermann, F. Haberl, M. Ober, and A. Schmidt, Mode-locking with cross-phase and self-phase modulation, Optics Letters 16, 502 (1991).
- Vasil’ev et al. [2000] P. Vasil’ev, I. White, and J. Gowar, Fast phenomena in semiconductor lasers, Reports on Progress in Physics 63, 1997 (2000).
- Keller [2010] U. Keller, Ultrafast solid-state laser oscillators: a success story for the last 20 years with no end in sight, Applied Physics B-Lasers and Optics 100, 15 (2010).
- Egorov and Skryabin [2018] O. A. Egorov and D. V. Skryabin, Frequency comb generation in a resonantly pumped exciton-polariton microring resonator, Optics Express 26, 24003 (2018).
- Brimont et al. [2020] C. Brimont, L. Doyennette, G. Kreyder, F. Réveret, P. Disseix, F. Médard, J. Leymarie, E. Cambril, S. Bouchoule, M. Gromovyi, B. Alloing, S. Rennesson, F. Semond, J. Zúñiga Pérez, and T. Guillet, Strong coupling of exciton-polaritons in a bulk planar waveguide: Quantifying the coupling strength, Phys. Rev. Applied 14, 054060 (2020).
- Savvidis et al. [2000b] P. G. Savvidis, J. J. Baumberg, R. M. Stevenson, M. S. Skolnick, D. M. Whittaker, and J. S. Roberts, Asymmetric angular emission in semiconductor microcavities, Phys. Rev. B 62, R13278 (2000b).
- Utsunomiya et al. [2008] S. Utsunomiya, L. Tian, G. Roumpos, C. W. Lai, N. Kumada, T. Fujisawa, M. Kuwata-Gonokami, A. Löffler, S. Höfling, A. Forchel, and Y. Yamamoto, Observation of bogoliubov excitations in exciton-polariton condensates, Nat. Phys. 4, 700 (2008).
- Amo et al. [2011] A. Amo, S. Pigeon, D. Sanvitto, V. G. Sala, R. Hivet, I. Carusotto, F. Pisanello, G. Leménager, R. Houdré, E. Giacobino, C. Ciuti, and A. Bramati, Polariton Superfluids Reveal Quantum Hydrodynamic Solitons, Science 332, 1167 (2011).
- Wertz et al. [2012] E. Wertz, A. Amo, D. D. Solnyshkov, L. Ferrier, T. C. H. Liew, D. Sanvitto, P. Senellart, I. Sagnes, A. Lemaître, A. V. Kavokin, G. Malpuech, and J. Bloch, Propagation and Amplification Dynamics of 1d Polariton Condensates, Phys. Rev. Lett. 109, 216404 (2012).
- Solnyshkov et al. [2014b] D. D. Solnyshkov, H. Terças, K. Dini, and G. Malpuech, Hybrid Boltzmann–Gross-Pitaevskii theory of bose-Einstein condensation and superfluidity in open driven-dissipative systems, Physical Review A 89, 033626 (2014b).
- Haug and Koch [1977] H. Haug and S. Koch, On the theory of laser action in dense exciton systems, physica status solidi (b) 82, 531 (1977).
- Delphan et al. [2023] A. Delphan, M. N. Makhonin, T. Isoniemi, P. M. Walker, M. S. Skolnick, D. N. Krizhanovskii, D. V. Skryabin, J.-F. Carlin, N. Grandjean, and R. Butté, Polariton lasing in AlGaN microring with GaN/AlGaN quantum wells, APL Photonics 8, 021302 (2023).
- Dudley et al. [2006] J. M. Dudley, G. Genty, and S. Coen, Supercontinuum generation in photonic crystal fiber, Rev. Mod. Phys. 78, 1135 (2006).
- Bélanger et al. [1997] N. Bélanger, A. Villeneuve, and J. S. Aitchison, Solitonlike pulses in self-defocusing AlGaAs waveguides, Journal of the Optical Society of America B 14, 3003 (1997).
- Haus [1975] H. A. Haus, Theory of mode locking with a slow saturable absorber, IEEE J. Quantum Electron. 11, 736 (1975).
- Jung et al. [1995] I. D. Jung, F. X. Kärtner, L. R. Brovelli, M. Kamp, and U. Keller, Experimental verification of soliton mode locking using only a slow saturable absorber, Opt. Lett. 20, 1892 (1995).
- Paschotta et al. [2002] R. Paschotta, R. Häring, A. Garnache, S. Hoogland, A. C. Tropper, and U. Keller, Soliton-like pulse-shaping mechanism in passively mode-locked surface-emitting semiconductor lasers, Appl. Phys. B 75, 445 (2002).
- Spence et al. [1991] D. E. Spence, P. N. Kean, and W. Sibbett, 60-fsec pulse generation from a self-mode locked Ti-sapphire laser, Opt. Lett. 16, 42 (1991).
- Kornaszewski et al. [2012] L. Kornaszewski, G. Maker, G. P. A. Malcolm, M. Butkus, E. U. Rafailov, and C. J. Hamilton, Sesam-free mode-locked semiconductor disk laser, Laser Photonics Rev. 6, L20–L23 (2012).
- Albrecht et al. [2013] A. R. Albrecht, Y. Wang, M. Ghasemkhani, D. V. Seletskiy, J. G. Cederberg, and M. Sheik-Bahae, Exploring ultrafast negative kerr effect for mode-locking vertical external-cavity surface-emitting lasers, Opt. Exp. 21, 28801 (2013).
- Matsas et al. [1992] V. J. Matsas, T. P. Newson, D. J. Richardson, and D. N. Payne, Selfstarting passivley mode-locked fibre ring soliton laser exploiting nonlinear polarisation rotation, Electron. Lett. 28, 1391 (1992).
- Marsh [2017] J. H. Marsh, Mode-locked laser diodes and their monolithic integration, IEEE J. Sel. Top. Quantum Electron. 23, 1100611 (2017).
- Wei et al. [2022] W. Wei, J. Chen, J. Huang, Z. Wang, J. Zhang, and T. Wang, Advances of semiconductor mode-locked laser for optical frequency comb generation, National Science Open 1, 20220026 (2022).
- Yadav et al. [2023] A. Yadav, N. B. Chichkov, E. A. Avrutin, A. Gorodetsky, and E. U. Rafailov, Edge emitting mode-locked quantum dot lasers, Prog. Quantum Electron. 87, 100451 (2023).
- Renaudier et al. [2005] J. Renaudier, R. Brenot, B. Dagens, F. Lelarge, B. Rousseau, F. Poingt, O. Legouezigou, F. Pommereau, A. Accard, P. Gallion, and G.-H. Duan, 45 GHz self-pulsation with narrow linewidth in quantum dot Fabry-Perot semiconductor lasers at 1.5 m, Electron. Lett. 41, 1007 (2005).
- Gosset et al. [2006] C. Gosset, K. Merghem, A. Martinez, G. Moreau, G. Patriarche, G. Aubin, and A. Ramdane, Subpicosecond pulse generation at 134 GHz using a quantum-dash-based Fabry-Perot laser emitting at 1.56 m, Appl. Phys. Lett. 88, 241105 (2006).
- Rosales et al. [2012] R. Rosales, K. Merghem, C. Calo, G. Bouwmans, I. Krestnikov, A. Martinez, and A. Ramdane, Optical pulse generation in single section InAs/GaAs quantum dot edge emitting lasers under continuous wave operation, Appl. Phys. Lett. 101, 221113 (2012).
- Liu et al. [2018] S. Liu, J. C. Norman, D. Jung, M. J. Kennedy, A. C. Gossard, and J. E. Bowers, Monolithic 9 GHz passively mode locked quantum dot lasers directly grown on on-axis (001) Si, Appl. Phys. Lett. 113, 113, 041108 (2018).
- Chow et al. [2020] W. W. Chow, S. Liu, Z. Zhang, J. E. Bowers, and M. Sargent III, Multimode description of self-mode locking in a single-section quantum-dot laser, Opt. Exp. 28, 5317 (2020).
- Grillot et al. [2022] F. Grillot, W. W. Chow, B. Dong, S. Ding, H. Huang, and J. E. Bowers, Multimode physics in the mode locking of semiconductor quantum dot lasers, Appl. Sci. 12, 3504 (2022).
- Bajoni et al. [2007] D. Bajoni, P. Senellart, A. Lemaitre, and J. Bloch, Photon lasing in GaAs microcavity: Similarities with a polariton condensate, Phys. Rev. B 76, 201305 (2007).
- Vladimirova et al. [2009] M. Vladimirova, S. Cronenberger, D. Scalbert, M. Nawrocki, A. V. Kavokin, A. Miard, A. Lemaître, and J. Bloch, Polarization controlled nonlinear transmission of light through semiconductor microcavities, Phys. Rev. B 79, 115325 (2009).
- Vladimirova et al. [2010] M. Vladimirova, S. Cronenberger, D. Scalbert, K. V. Kavokin, A. Miard, A. Lemaitre, J. Bloch, D. Solnyshkov, G. Malpuech, and A. V. Kavokin, Polariton-polariton interaction constants in microcavities, Physical Review B 82, 075301 (2010).
- Bajoni [2012] D. Bajoni, Polariton lasers. Hybrid light-matter lasers without inversion, Journal of Physics D: Applied Physics 45, 313001 (2012).
- Walker et al. [2019] P. M. Walker, C. E. Whittaker, D. V. Skryabin, E. Cancellieri, B. Royall, M. Sich, I. Farrer, D. A. Ritchie, M. S. Skolnick, and D. N. Krizhanovskii, Spatiotemporal continuum generation in polariton waveguides, Light: Science & Applications 8, 6 (2019).
- Mallet-Dida et al. [2022] L. Mallet-Dida, P. Disseix, F. Réveret, F. Médard, B. Alloing, J. Zúñiga-Pérez, and J. Leymarie, The low temperature limit of the excitonic mott density in GaN: an experimental reassessment, New Journal of Physics 24, 033031 (2022).
- Kreyder et al. [2022] G. Kreyder, L. Hermet, P. Disseix, F. Médard, M. Mihailovic, F. Réveret, S. Bouchoule, C. Deparis, J. Zuñiga-Pérez, and J. Leymarie, Lasing in a zno waveguide: unambiguous demonstration of polaritonic gain by monitoring the continuous exciton screening (2022).