Hasan ]Maulana Azad National Urdu University, Hyderabad, India 500032 \correspondancepriya.hasan@gmail.com
Gaps in the Main-Sequence of Star Cluster Hertzsprung Russell Diagrams
Abstract
The presence of gaps or regions of small numbers of stars in the main sequence of the Hertzsprung Russell Diagram (HRD) of star clusters has been reported in literature. This is interesting and significant as it could be related to star formation and/or rapid evolution or instabilities. In this paper, using Gaia DR3 photometry and confirmed membership data, we explore the HRD of nine open clusters with reported gaps, identify them and assess their importance and spectral types.
keywords:
HRD, star clusters, Gaia DR3, stellar evolution1 Introduction
The Hertzsprung Russell Diagram (HRD) of star clusters is the holy grail to understanding stellar evolution and populations. It is a snapshot of stellar lives as a plot of color (temperature) versus magnitude (luminosity). The precise position of a star can be used to find various parameters of a star including its size, metallicity, and evolutionary state. The HRD traces stars at various phases of evolution along the main sequence and as they turn off to the giant branch and beyond. The HRD has been used to find the distances, ages and reddening of star clusters.
The European Space Agency Gaia mission has provided unprecedented sub-milliarcsecond parallax precision for over a billion stars (Prusti, 2016; Gaia Collaboration et al., 2021) that can be utilized to study the precise locations of individual stars on the HRD as well as populations of stars. The accurate, all-sky data produces an HRD that shows previously unknown features.
Gaps or regions of low density of stars in the HRD have been reported by various authors (Hawarden, 1971; Bohm-Vitense and Canterna, 1974; Kjeldsen and Frandsen, 1991; Rachford and Canterna, 2000) and could be important milestones of stellar evolution. In this paper, we present a detailed study of main sequence gaps in the HRD of a sample of nine clusters of ages ranging from log and at distances pc using Gaia DR3 data. We use membership data and parameters from Cantat-Gaudin et al. (2020). We identify the gaps, assess their statistical significance using the test and identify their spectral types.
2 Reported Gaps in Literature
Main sequence gaps in HRD were reported in literature (Kjeldsen and Frandsen, 1991; Sagar and Joshi, 1978; Bohm-Vitense and Canterna, 1974; Rachford and Canterna, 2000) and are listed in Table 1. A gap was also found by Jao et al. (2018) in Gaia DR2 data at . The gap is very narrow ( 0.05 mag) and is near the region in the HRD where M dwarf stars transition from partially to fully convective, near spectral type M3.0V.
| Structure | Sp Type | Temperature (K) | ||||
|---|---|---|---|---|---|---|
| Mermilloid | 0.0 | -0.12 | 0.25 | B8V | 12300 | |
| Canterna Gap | 1.0 | -0.05 | 0.20 | A1V | 9330 | |
| A-bend | 1.3 | -0.02 | 0.7 | 0.05 | A2V | 9040 |
| A-group | 1.5 | 0.00 | 0.7 | 0.05 | A3V | 8750 |
| M11 gap | 1.7 | 0.05 | 0.5 | 0.5 | A4V | 8480 |
| Bohm-Vitense Gap | 2.8 | 0.25 | 0.3 | 0.05 | F0V | 7350 |
| NGC 6134-IC4651 gap | 4.5 | 0.5 | 1.0 | 0.15 | G2V | 5800 |
3 Cluster Sample
We selected a sample of nine clusters as clusters with confirmed gaps from literature. These are NGC 2169, NGC 2360, NGC 1778, NGC 6939, NGC 3680, NGC 2682, Trumpler 1, NGC 2420 and NGC 6134. We used the following cluster parameters Cantat-Gaudin et al. (2020) shown in Table 2 to convert magnitudes to absolute scale. The table shows the coordinates of these clusters (RA and Dec), the angular diameter () which is the radius that contains half the number of members from the same reference, the logarithm of age , the extinction , distance modulus and the distance to the cluster in parsecs.
| Cluster | RA | Dec | Ang.Dia | log | DM | Distance | |
|---|---|---|---|---|---|---|---|
| (deg) | (deg) | (deg) | (mag) | (mag) | (pc) | ||
| NGC 2169 | 92.13 | 13.95 | 0.076 | 7.09 | 0.85 | 10.15 | 1072 |
| NGC 2360 | 109.44 | -15.63 | 0.154 | 9.01 | 0.39 | 10.25 | 1122 |
| NGC 1778 | 77.03 | 37.02 | 0.112 | 8.25 | 0.87 | 11.11 | 1663 |
| NGC 6939 | 307.9 | 60.65 | 0.123 | 9.23 | 0.85 | 11.3 | 1815 |
| NGC 3680 | 171.39 | -43.24 | 0.149 | 9.34 | 0.1 | 10.15 | 1072 |
| NGC 2682 | 132.85 | 11.81 | 0.167 | 9.63 | 0.07 | 9.75 | 889 |
| Trumpler 1 | 23.92 | 61.28 | 0.031 | 7.46 | 1.63 | 12.22 | 2773 |
| NGC 2420 | 114.6 | 21.58 | 0.053 | 9.24 | 0.04 | 12.06 | 2587 |
| NGC 6134 | 246.95 | -49.16 | 0.156 | 8.99 | 0.87 | 10.36 | 1182 |
4 Analysis
We use membership data from Cantat-Gaudin et al. (2020) for our sample of nine clusters. As described in Donada et al. (2023), we find the absolute magnitude and color:
. We plot the color magnitude diagrams (Fig. LABEL:cmd) and the luminosity functions (Fig. LABEL:lf) to identify possible gaps in the HRD listed in Table 3.
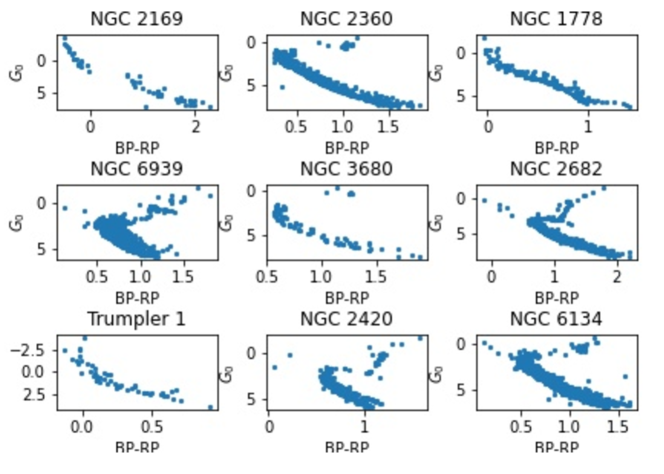
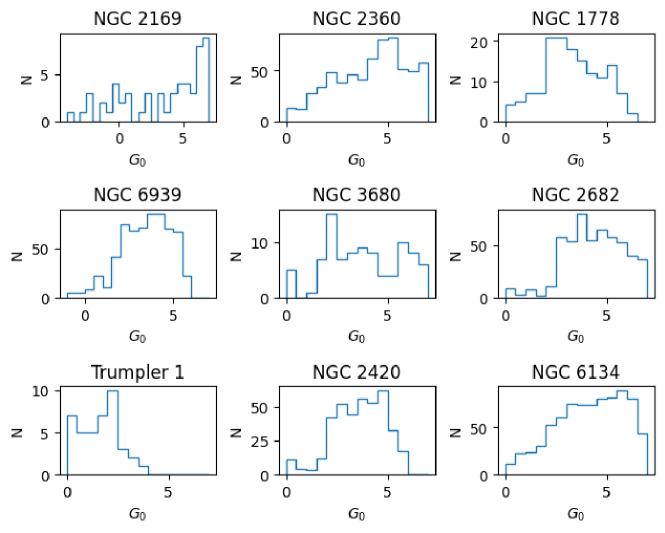
The likelihood that the observed gap represents a chance variation can be estimated as follows. For the identified gaps, we calculate , where is the expected number of stars and is the observed number of stars as described in Hawarden (1971). We find the expected number as the average of the numbers before and after the gap. is related to that is the probability that the gap is an chance event. For a =4.0, with one degree of freedom, the value is 0.05. This means that the probability of the gap being significant is 1-0.05 = 0.95, that is 95 %. This implies that a smaller value implies a higher chance of the gap being significant. Table 3 lists the gaps found in our sample with their spectral Types and significance. We notice the gaps we found are of similar spectral types as described in Table 1.
| Cluster | p | T(K) | Sp Type | |||||
| NGC 2169 | 2.2 | 0.3 | 4 | 0 | 4.0 | 0.05 | 6852 | F8V |
| 5.6 | 1.45 | 7.5 | 3 | 2.7 | 0.1 | 3631 | K1V | |
| NGC 2360 | 0.8 | 0.12 | 17.4 | 12 | 1.67 | 0.196 | 8550 | A3V |
| 1.7 | 0.3 | 21.6 | 17.8 | 0.67 | 0.41 | 7500 | A8V | |
| 2.8 | 0.45 | 24.3 | 18.5 | 1.38 | 0.24 | 7030 | F1V | |
| NGC 1778 | -1.11 | -0.03 | 3 | 0 | 3 | 0.08 | 9700 | A0V |
| 1.5 | 0.14 | 14 | 7 | 7 | 0.008 | 8550 | A3V | |
| NGC 6939 | 3.0 | 0.5 | 80 | 70 | 1.25 | 0.26 | 6720 | F3V |
| NGC 3680 | 5 | 0.95 | 8.5 | 4 | 2.38 | 0.1229 | 5280 | K0V |
| NGC 2682 | 3.07 | 0.7 | 67.5 | 54.5 | 2.5 | 0.1138 | 6040 | F9V |
| 4.2 | 0.77 | 80 | 55.6 | 7.44 | 0.0064 | 5880 | G1V | |
| Trumpler 1 | -2.0 | -0.08 | 2.5 | 1 | 0.9 | 0.34 | 10400 | B9.5V |
| -0.25 | 0.018 | 5 | 2 | 1.8 | 0.18 | 9200 | A1V | |
| 1 | 0.121 | 6 | 5 | 0.16 | 0.69 | 8550 | A3V | |
| 1.75 | 0.25 | 4.7 | 3 | 0.617 | 0.43 | 7800 | A7V | |
| NGC 2420 | 3.25 | 0.55 | 54 | 44 | 1.85 | 0.17 | 6640 | F4V |
| 4.25 | 0.8 | 59 | 53 | 0.61 | 0.43 | 5770 | G2V | |
| NGC 6134 | 2.5 | 0.5 | 30.6 | 27 | 0.42 | 0.62 | 6720 | F2V |
| 3.15 | 0.6 | 37.4 | 31 | 1.09 | 0.29 | 6400 | F5V | |
| 3.6 | 0.675 | 39 | 34.4 | 1.09 | 0.29 | 6150 | F8V | |
| 4.09 | 0.748 | 39.5 | 33.5 | 0.91 | 0.34 | 5920 | G0V | |
| 4.62 | 0.83 | 44.6 | 28 | 6.17 | 0.012 | 5660 | G5V |
5 Conclusions
In this paper, we use Gaia DR3 data and membership data of Cantat-Gaudin et al. (2020) to study gaps in the main sequence of the HRD of star clusters. We use the test to find the significance of the gaps. We compare the spectral types of earlier detections and find that they agree with our present results. Gaps were reported by Jao et al. (2018) in Gaia DR2 data for M dwarfs. In our sample, the membership data used is available only till apparent magnitude 18 and does not include M dwarfs, we go to a spectral type of upto G, therefore we don’t find that in our data. A more detailed study of HRD of star clusters is necessary to characterise these gaps and study them in more detail.
Acknowledgements.
This work has made use of data from the European Space Agency (ESA) mission Gaia (https://www.cosmos.esa.int/gaia), processed by the Gaia Data Processing and Analysis Consortium (DPAC, https://www.cosmos.esa.int/web/gaia/dpac/consortium). Funding for the DPAC has been provided by national institutions, in particular the institutions participating in the Gaia Multilateral Agreement.0000-0002-8156-6940PriyaHasan
The authors declare no conflict of interest.
References
- Bohm-Vitense and Canterna (1974) Bohm-Vitense, E. and Canterna, R. (1974) The Gap in the Two-Color Diagram of Main-Sequence Stars. AJ, 194, 629–636. https://doi.org/10.1086/153283.
- Cantat-Gaudin et al. (2020) Cantat-Gaudin, T., Anders, F., Castro-Ginard, A., Jordi, C., Romero-Gómez, M., Soubiran, C., Casamiquela, L., Tarricq, Y., Moitinho, A., Vallenari, A., Bragaglia, A., Krone-Martins, A. and Kounkel, M. (2020) Painting a portrait of the Galactic disc with its stellar clusters. A&A, 640, A1. https://doi.org/10.1051/0004-6361/202038192.
- Donada et al. (2023) Donada, J., Anders, F., Jordi, C., Masana, E., Gieles, M., Perren, G. I., Balaguer-Nú ñez, L., Castro-Ginard, A., Cantat-Gaudin, T. and Casamiquela, L. (2023) The multiplicity fraction in 202 open clusters from gaia. A&A, 675, A89. https://doi.org/10.1051/0004-6361/202245219.
- Gaia Collaboration et al. (2021) Gaia Collaboration, Brown, A. G. A., Vallenari, A. and et al, P. (2021) Gaia Early Data Release 3. Summary of the contents and survey properties. A&A, 649, A1. https://doi.org/10.1051/0004-6361/202039657.
- Hawarden (1971) Hawarden, T. G. (1971) Main sequence gaps and giant branch clumps. Obs, 91, 78–85.
- Jao et al. (2018) Jao, W.-C., Henry, T. J., Gies, D. R. and Hambly, N. C. (2018) A gap in the lower main sequence revealed by gaia data release 2. ApJ, 861(1), L11. https://doi.org/10.3847/2041-8213/aacdf6.
- Kjeldsen and Frandsen (1991) Kjeldsen, H. and Frandsen, S. (1991) Stellar photometric stability. II. Ages and distances for 13 open clusters with time series observations. A&AS, 87, 119.
- Prusti (2016) Prusti, e. a. (2016) The Gaia Mission. A&A, 595, A1. https://doi.org/10.1051/0004-6361/201629272.
- Rachford and Canterna (2000) Rachford, B. L. and Canterna, R. (2000) The relationship between the bohm-vitense gap and stellar activity in open clusters. AJ, 119(3), 1296. https://doi.org/10.1086/301242.
- Sagar and Joshi (1978) Sagar, R. and Joshi, U. C. (1978) The Gap in the H-R diagram of Open Clusters with Special Reference to NGC 2169, NGC 1778 and TR 1. BASI, 6, 37.