11email: tommaso.marchetti.astro@gmail.com 22institutetext: Konkoly Observatory, Research Centre for Astronomy and Earth Sciences, H-1121 Budapest Konkoly Th. M. út 15-17., Hungary 33institutetext: CSFK, MTA Centre of Excellence, Budapest, Konkoly Thege Miklós út 15-17., H-1121, Hungary 44institutetext: Space Telescope Science Institute, 3700 San Martin Drive, Baltimore, MD 21218, USA 55institutetext: Department of Physics and Astronomy, University of California Los Angeles, 430 Portola Plaza, Box 951547, Los Angeles, CA 90095-1547, USA 66institutetext: Department of Natural Sciences, University of Michigan-Dearborn, 4901 Evergreen Rd., Dearborn, MI 48128, USA 77institutetext: Saint Martin’s University, 5000 Abbey Way SE, Lacey, WA 98503, USA 88institutetext: Shanghai Key Lab for Astrophysics, Shanghai Normal University, 100 Guilin Road, Shanghai 200234, PR China 99institutetext: Indiana University Department of Astronomy, SW319, 727 E 3rd Street, Bloomington, IN 47405, USA
The Blanco DECam Bulge Survey (BDBS)
Abstract
Context. The inner Galaxy is a complex environment, and the relative contributions of different formation scenarios to its observed morphology and stellar properties are still debated. The different components are expected to have different spatial, kinematic, and metallicity distributions, and a combination of photometric, spectroscopic, and astrometric large-scale surveys is needed to study the formation and evolution of the Galactic bulge.
Aims. The Blanco DECam Bulge Survey (BDBS) provides near-ultraviolet to near-infrared photometry for million unique stars over 200 square degrees of the southern Galactic bulge. By combining BDBS photometry with the latest Gaia astrometry, we aim to characterize the chemo-dynamics of red clump stars across the BDBS footprint, using an unprecedented sample size and sky coverage.
Methods. Our field of regard is , . We construct a sample of million red clump giants in the bulge with photometric metallicities, BDBS photometric distances, and proper motions. Photometric metallicities are derived from a relation; astrometry including precise proper motions is from the third data release (DR3) of the ESA satellite Gaia. We study the kinematics of the red clump stars as a function of sky position and metallicity, by investigating proper motion rotation curves, velocity dispersions, and proper motion correlations across the southern Galactic bulge.
Results. By binning our sample into 8 metallicity bins from dex dex, we find that metal-poor red clump stars exhibit lower rotation amplitudes, at km s-1 kpc-1. The peak of the angular velocity is km s-1 kpc-1 for dex, exhibiting declining rotation at higher [Fe/H]. The velocity dispersion is higher for metal-poor stars, while metal-rich stars show a steeper gradient with Galactic latitude, with a maximum dispersion at low latitudes along the bulge minor axis. Only metal-rich stars ( dex) show clear signatures of the bar in their kinematics, while the metal-poor population exhibits isotropic motions with an axisymmetric pattern around Galactic longitude .
Conclusions. This work reports the largest sample of bulge stars with distance, metallicity, and astrometry and shows clear kinematic differences with metallicity. The global kinematics over the bulge agrees with earlier studies. However, we see striking changes with increasing metallicity and for the first time, see kinematic differences for stars with , suggesting that the bar itself may have kinematics that depends on metallicity.
Key Words.:
Galactic bulge, Red Clump Stars, Milky Way, astrometry1 Introduction
The last decades of observations of the central region of our Galaxy have pictured a highly complex environment, with several distinct and interacting stellar populations coexisting along the same line of sight. Studying the formation, history, and evolution of the Galactic bulge is essential to improve our knowledge of the Milky Way, which is a benchmark for understanding the evolution of disk galaxies in the Universe (e.g. Bland-Hawthorn & Gerhard, 2016). The reconstruction of its evolutionary history requires precise photometric (e.g. Minniti et al., 2010; Udalski et al., 2015; Rich et al., 2020), spectroscopic (e.g. Rich et al., 2007; Kunder et al., 2012; Freeman et al., 2013; Zoccali et al., 2014; Majewski et al., 2017), and astrometric (e.g. Kuijken & Rich, 2002; Clarkson et al., 2008, 2018; Gezari et al., 2022) measurements for statistically large samples of stars covering the whole Galactic bulge. Because of our location in the Milky Way plane, several studies have focused on the removal of the foreground disk population, whose presence contaminates studies of the Galactic bulge, using a mix of photometric and astrometric techniques (e.g., Kuijken & Rich, 2002; Zoccali et al., 2003; Clarkson et al., 2008, 2011; Valenti et al., 2013; Calamida et al., 2014; Clarkson et al., 2018; Surot et al., 2019a; Queiroz et al., 2021; Marchetti et al., 2022).
While the recent data releases of the European Space Agency satellite Gaia (Gaia Collaboration et al., 2016, 2018, 2021, 2023) provide geometric parallaxes for billion stars in the Milky Way, large uncertainties and systematics prevent the precise localization of stars beyond a few kiloparsec from the Sun. The identification of stellar standard candles, whose distance can be derived using photometry, is, therefore, an important tool to map the three-dimensional structure of the Galaxy. In particular, Red Clump (RC) stars have long been used to study and constrain the morphology of the inner part of the Milky Way (e.g. Stanek et al., 1994, 1997; Rattenbury et al., 2007; McWilliam & Zoccali, 2010; Saito et al., 2011; Wegg & Gerhard, 2013; Simion et al., 2017; Paterson et al., 2020; Johnson et al., 2022), and they have been critical to discovering details about the Galactic bulge’s rotating bar (Binney et al., 1991; Stanek et al., 1994; Wegg & Gerhard, 2013) along with its X-shaped morphology (Weiland et al., 1994; Nataf et al., 2010; McWilliam & Zoccali, 2010; Wegg & Gerhard, 2013).
As the nearest example of a spheroidal/bar population, and near enough to resolve individual stars, the Galactic bulge offers the possibility to explore the structure and formation history by an analysis of the spatial variation of abundances and kinematics, often called ”chemodynamics”. This effort has historically required the correlation of spectroscopically derived metallicities and radial velocities, beginning with Rich (1990) and Minniti et al. (2010), early works that showed a trend of declining velocity dispersion with increasing metallicity. Spectroscopic surveys have grown in size from 10,000 stars in the Bulge Radial Velocity Assay (Rich et al., 2007; Kunder et al., 2012, BRAVA) to tens of thousands of stars with abundances and kinematics in projects such as the Abundances and Radial velocity Galactic Origins Survey (Freeman et al., 2013, ARGOS), the GIRAFFE Inner Bulge Survey (Zoccali et al., 2014, GIBS), and the Apache Point Observatory Galactic Evolution Experiment (Majewski et al., 2017, APOGEE).
However, even sample sizes of or greater can be insufficient when binned by spatial location, kinematics, and abundance. Two revolutionary developments- wide field imagers like the Dark Energy Camera on the Blanco 4m telescope (Flaugher et al., 2015) and the Gaia astrometric survey (Gaia Collaboration et al., 2023) have combined to expand sample sizes into the millions. A significant recent breakthrough has been the development of a robust photometric metallicity scale, versus for bulge red clump (RC) giants (Johnson et al., 2020), by correlating the photometry with [Fe/H] from GIBS survey spectroscopy (Zoccali et al., 2017). Combining photometric metallicities and distances for the RC with Gaia kinematics potentially unlocks the exploration of chemodynamics for millions of stars, albeit with only [Fe/H] to 0.2 dex precision, and no detailed abundances (e.g., alpha elements). Here we exploit the large numbers possible by combining the two datasets, reaching numerical sizes that are of the same order of those of the two planned major bulge surveys by 4MOST and MOONS (Bensby et al., 2019; Gonzalez et al., 2020a).
Many investigations have pointed toward a significant break in kinematics at [Fe/H] , beginning with Zhao et al. (1994) and continuing with Soto et al. (2007), Zoccali et al. (2008), and Ness et al. (2013b). The break at dex is clearly seen when the vertex deviation is derived (this requires the construction of the velocity ellipsoid from radial velocities and longitudinal proper motions, and is interpreted as due to the metal-rich population being in the bar). Babusiaux et al. (2010) explored Baade’s window and two other fields on the bulge minor axis, combining proper motions from OGLE-II (Sumi et al., 2004) with radial velocities and metallicities from FLAMES/GIRAFFE at the VLT. They identified two distinct populations: metal-rich stars have bar-like kinematics, while the metal-poor ones are consistent with an old spheroid (or thick disk). This supported the co-existence of both a classical and a pseudo-bulge in the central region of our Galaxy (see Kormendy & Kennicutt, 2004). Subsequent studies have confirmed the different behavior of metal-poor and metal-rich stars in the inner Milky Way (see e.g. Hill et al., 2011; Dékány et al., 2013; Ness et al., 2013a; Rojas-Arriagada et al., 2014; Babusiaux, 2016; Kunder et al., 2016; Athanassoula et al., 2017; Rojas-Arriagada et al., 2017; Zoccali et al., 2017; Clarkson et al., 2018; Zoccali et al., 2018; Arentsen et al., 2020; Du et al., 2020; Rojas-Arriagada et al., 2020; Simion et al., 2021; Wylie et al., 2021; Rix et al., 2022). Stellar populations with different chemical compositions will also show different kinematics due to the presence of the bar, a process called kinematic fractionation (Debattista et al., 2017). Our investigation lacks radial velocities, but we are able to explore proper motions and proper motion dispersion versus [Fe/H] over an unprecedented scale, allowing us to study the dependence of kinematics on the metallicity across the spatial extent of the Southern Galactic bulge. Future investigations will benefit from large numbers of stars with spectroscopic abundances and radial velocities, but our work aims to offer some insight into what we can expect from these surveys.
There is good reason to suspect that strong chemodynamic correlations exist in our bulge dataset. Johnson et al. (2022) shows a striking trend in which RC giants of increasing metallicity are more concentrated to the Galactic plane; there is no such trend in the radial direction. This striking vertical abundance gradient that steepens at [Fe/H] is consistent with a complex bar with properties that depend on metallicity.
The age of the bulge, especially of the metal-rich population, has also been called into question. Early HST-based investigations used proper motion cleaning to find a compact old main sequence turnoff (Ortolani et al., 1993; Kuijken & Rich, 2002; Clarkson et al., 2008, 2011); these studies have been segregated by metallicity (Renzini et al., 2018). The apparently old age was confirmed over the wider bulge field population (e.g., Zoccali et al., 2003; Valenti et al., 2013; Surot et al., 2019b). While Haywood et al. (2016) have proposed that a bulge population with a complex age distribution might fit a more vertical turnoff, the bulge turnoff morphology has been investigated in multiple fields (e.g., Valenti et al., 2013) and does not exhibit the vertical structure required in this study.
A more significant case for young populations is raised by Bensby et al. (2017), who derive spectroscopic ages for microlensed dwarfs in the bulge, finding a large fraction of the suprasolar metallicity stars in the bulge to be 5 Gyr in age. A new analysis using MIST isochrones by Joyce et al. (2023) suggests the presence of a significantly smaller, but not absent, population of metal-rich stars with ages Gyr, but largely supports a bulge age more tightly clustered around 10-11 Gyr. Though this latter analysis, based on the same sample of microlensed dwarfs presented in Bensby et al. (2017), is in better agreement with HST-based ages, the tension between the microlening-derived ages and the HST-/main sequence turnoff-derived ages is not fully resolved.
If a substantial fraction of the bar is 10 Gyr (younger than the thick disk) then one might expect the younger ages to be associated with the formation in the disk and to present a chemodynamic correlation that arises from age as well as metallicity. At present, we lack age constraints for individual RC stars, though a rough mapping between [Fe/H] and age can be constructed from the works of Bensby et al. (2017) and Joyce et al. (2023), but our study provides metallicities that can be correlated with kinematics.
We can now build on this legacy to investigate the detailed relationship between stellar metallicity and kinematics by constructing a comprehensive sample of RC stars residing within the Milky Way bulge that combines the photometric metallicities and distances for 2.6 million RC stars from Johnson et al. (2022) with the high-quality proper motions from the third data release of Gaia (DR3, Gaia Collaboration et al., 2023; Lindegren et al., 2021b). The paper is organized as follows. In Section 2 we introduce the sample of RC stars with BDBS photometry, distances, and metallicities and describe the process of assigning Gaia DR3 proper motions and projected velocities, that will be used in this work. In Section 3 we investigate the kinematics of RC stars as a function of metallicity, presenting our results, and highlighting the difference between the motion of the metal-poor and metal-rich components. Finally, in Section 4 we discuss our findings, and in we summarize our results.
2 The Red Clump Star Sample
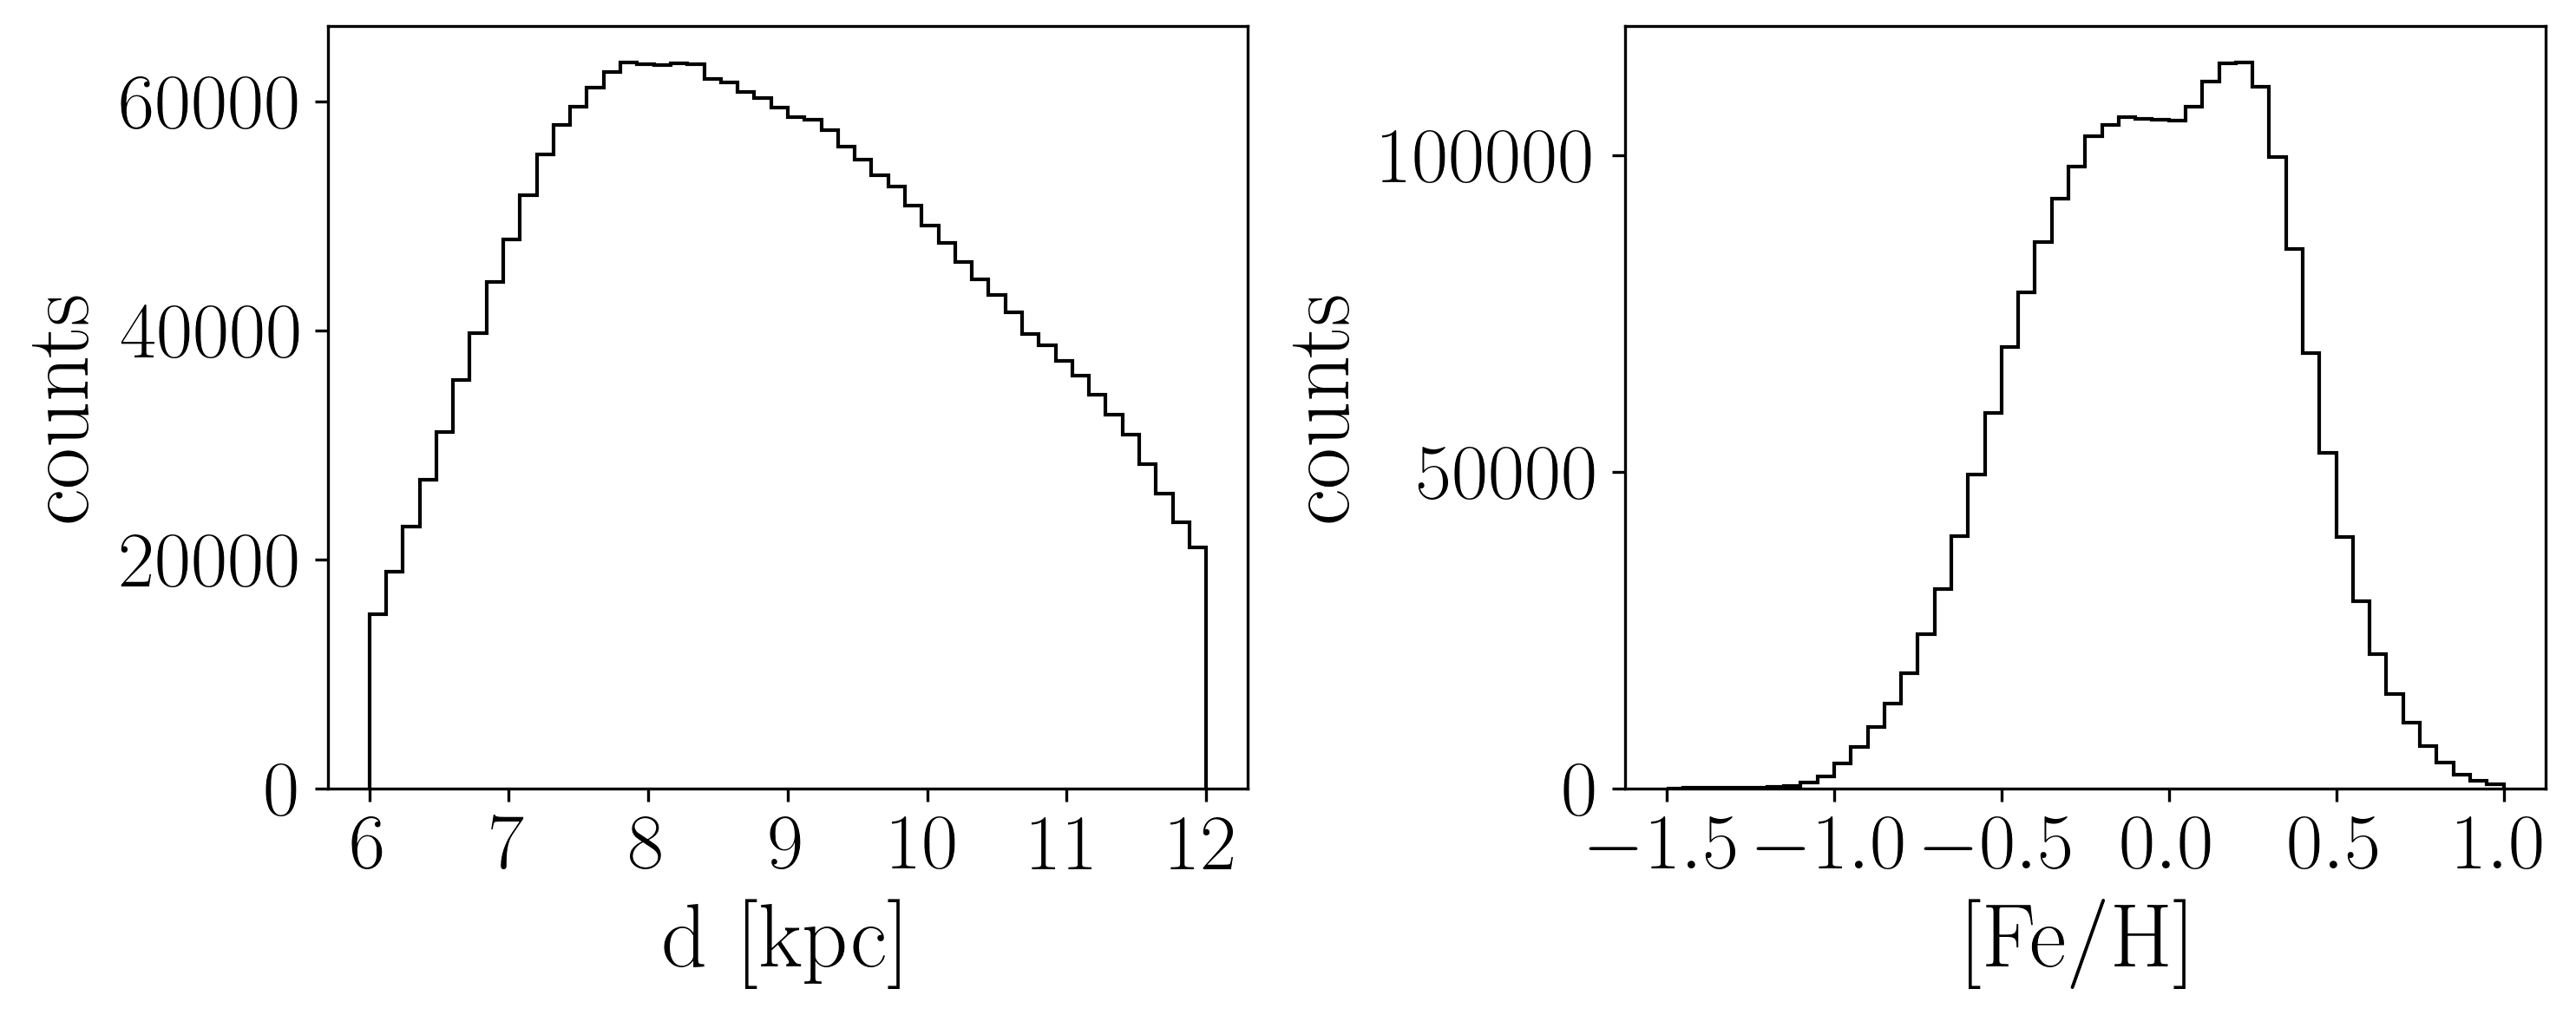
In this work, we start with the sample of million RC stars extracted from BDBS data in Johnson et al. (2020, 2022), spanning the region in Galactic coordinates , of the southern Galactic bulge111An electronic table containing the positions, -band photometry, extinction, distance, and [Fe/H] values for all stars used here is provided in Table 1 of Johnson et al. (2022).. Thanks to the sensitivity of the near-ultraviolet band to the metallicity of the RC stars, Johnson et al. (2020, 2022) derived photometric metallicities for the whole sample, with a typical dispersion of dex, employing the dust map constructed in Simion et al. (2017) using infrared VVV data. The distance distribution of the RC sample, derived using BDBS photometry (Johnson et al., 2020, 2022), is shown in the left panel of Fig. 1. RC distances span a range of kpc, with a median value of kpc. The metallicity of the sample, shown in the right panel of Fig. 1, covers a range going from to dex, with a median value of dex. The two peaks of the metallicity distribution are at dex and dex. More information on the metallicity distribution function and on the spatial distribution of the RC stars is provided in Johnson et al. (2022), including a description of the red clump color and magnitude selection functions (see their Section 2).
We cross-match this dataset to Gaia DR3 data, back-propagating Gaia coordinates to the mean BDBS epoch through Gaia proper motions, using a tolerance radius of 1 arcsec (see Marchetti et al., 2022, for further details on the cross-matching procedure). This results in a sample of RC stars with BDBS photometry (and therefore photometric distances and metallicities), and Gaia DR3 astrometry (parallaxes and proper motions). We further select sources with a value of the Gaia DR3 Renormalised Unit Weight Error (RUWE) , to avoid contamination from spurious astrometric solutions (Lindegren et al., 2021b; Belokurov et al., 2020; Penoyre et al., 2020). After this selection cut, we are left with a sample of RC stars, which will be the main focus of this paper. Thanks to the homogeneous Gaia DR3 proper motions and BDBS metallicities over the large BDBS instrumental footprint, this is an ideal dataset to study the chemo-kinematics of RC stars across the whole southern Galactic bulge.
While random and systematic uncertainties in Gaia parallaxes are too large to provide reliable distances for individual stars in the Galactic bulge (e.g. Lindegren et al., 2021a), we rely on photometric distances and Gaia DR3 proper motions to investigate the kinematics of the RC sample. We convert Galactic proper motions to Galactocentric velocities along longitude and latitude by subtracting the contribution given by the motion of the Sun:
| (1) |
| (2) |
where for , and is the heliocentric distance of the star, derived with BDBS photometry (Johnson et al., 2020). We assume a three-dimensional Cartesian velocity of the Sun km s-1 (Reid & Brunthaler, 2004; Drimmel & Poggio, 2018; GRAVITY Collaboration et al., 2018).
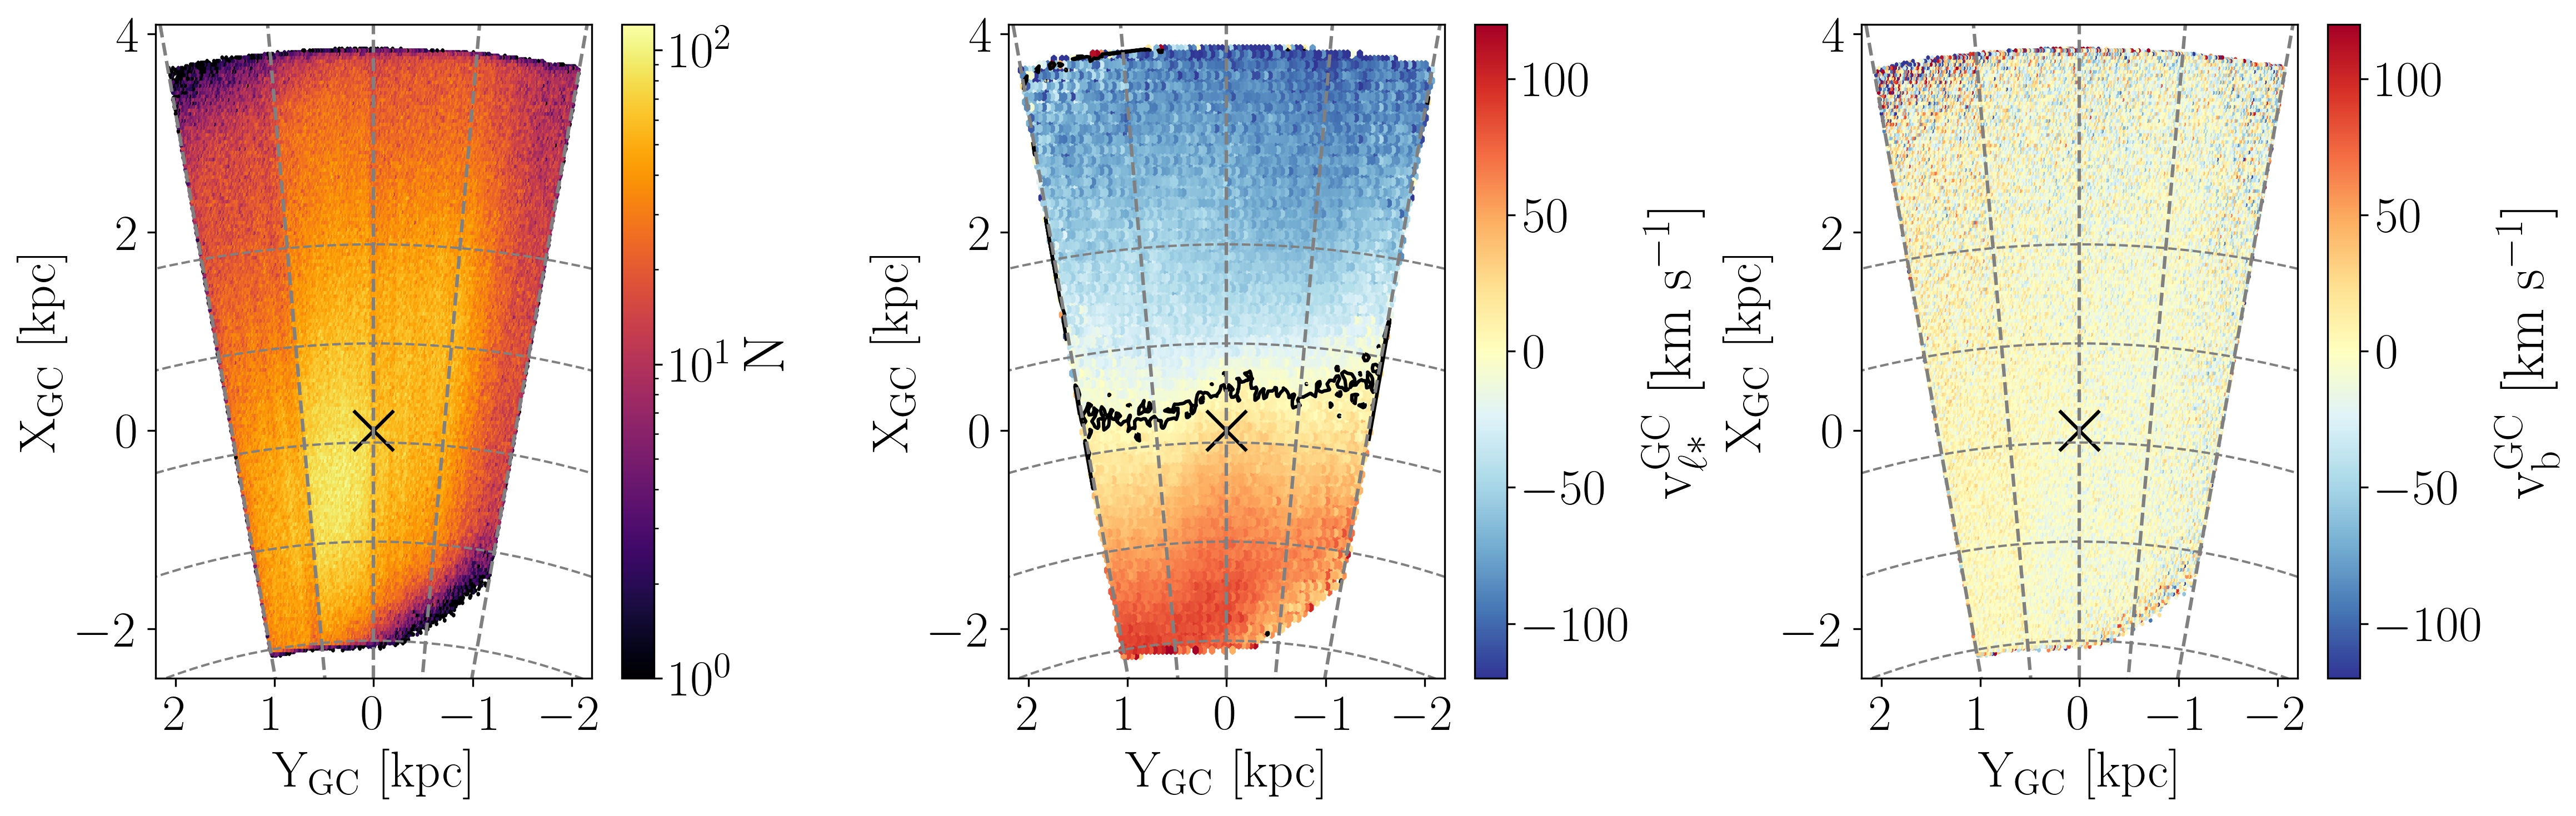
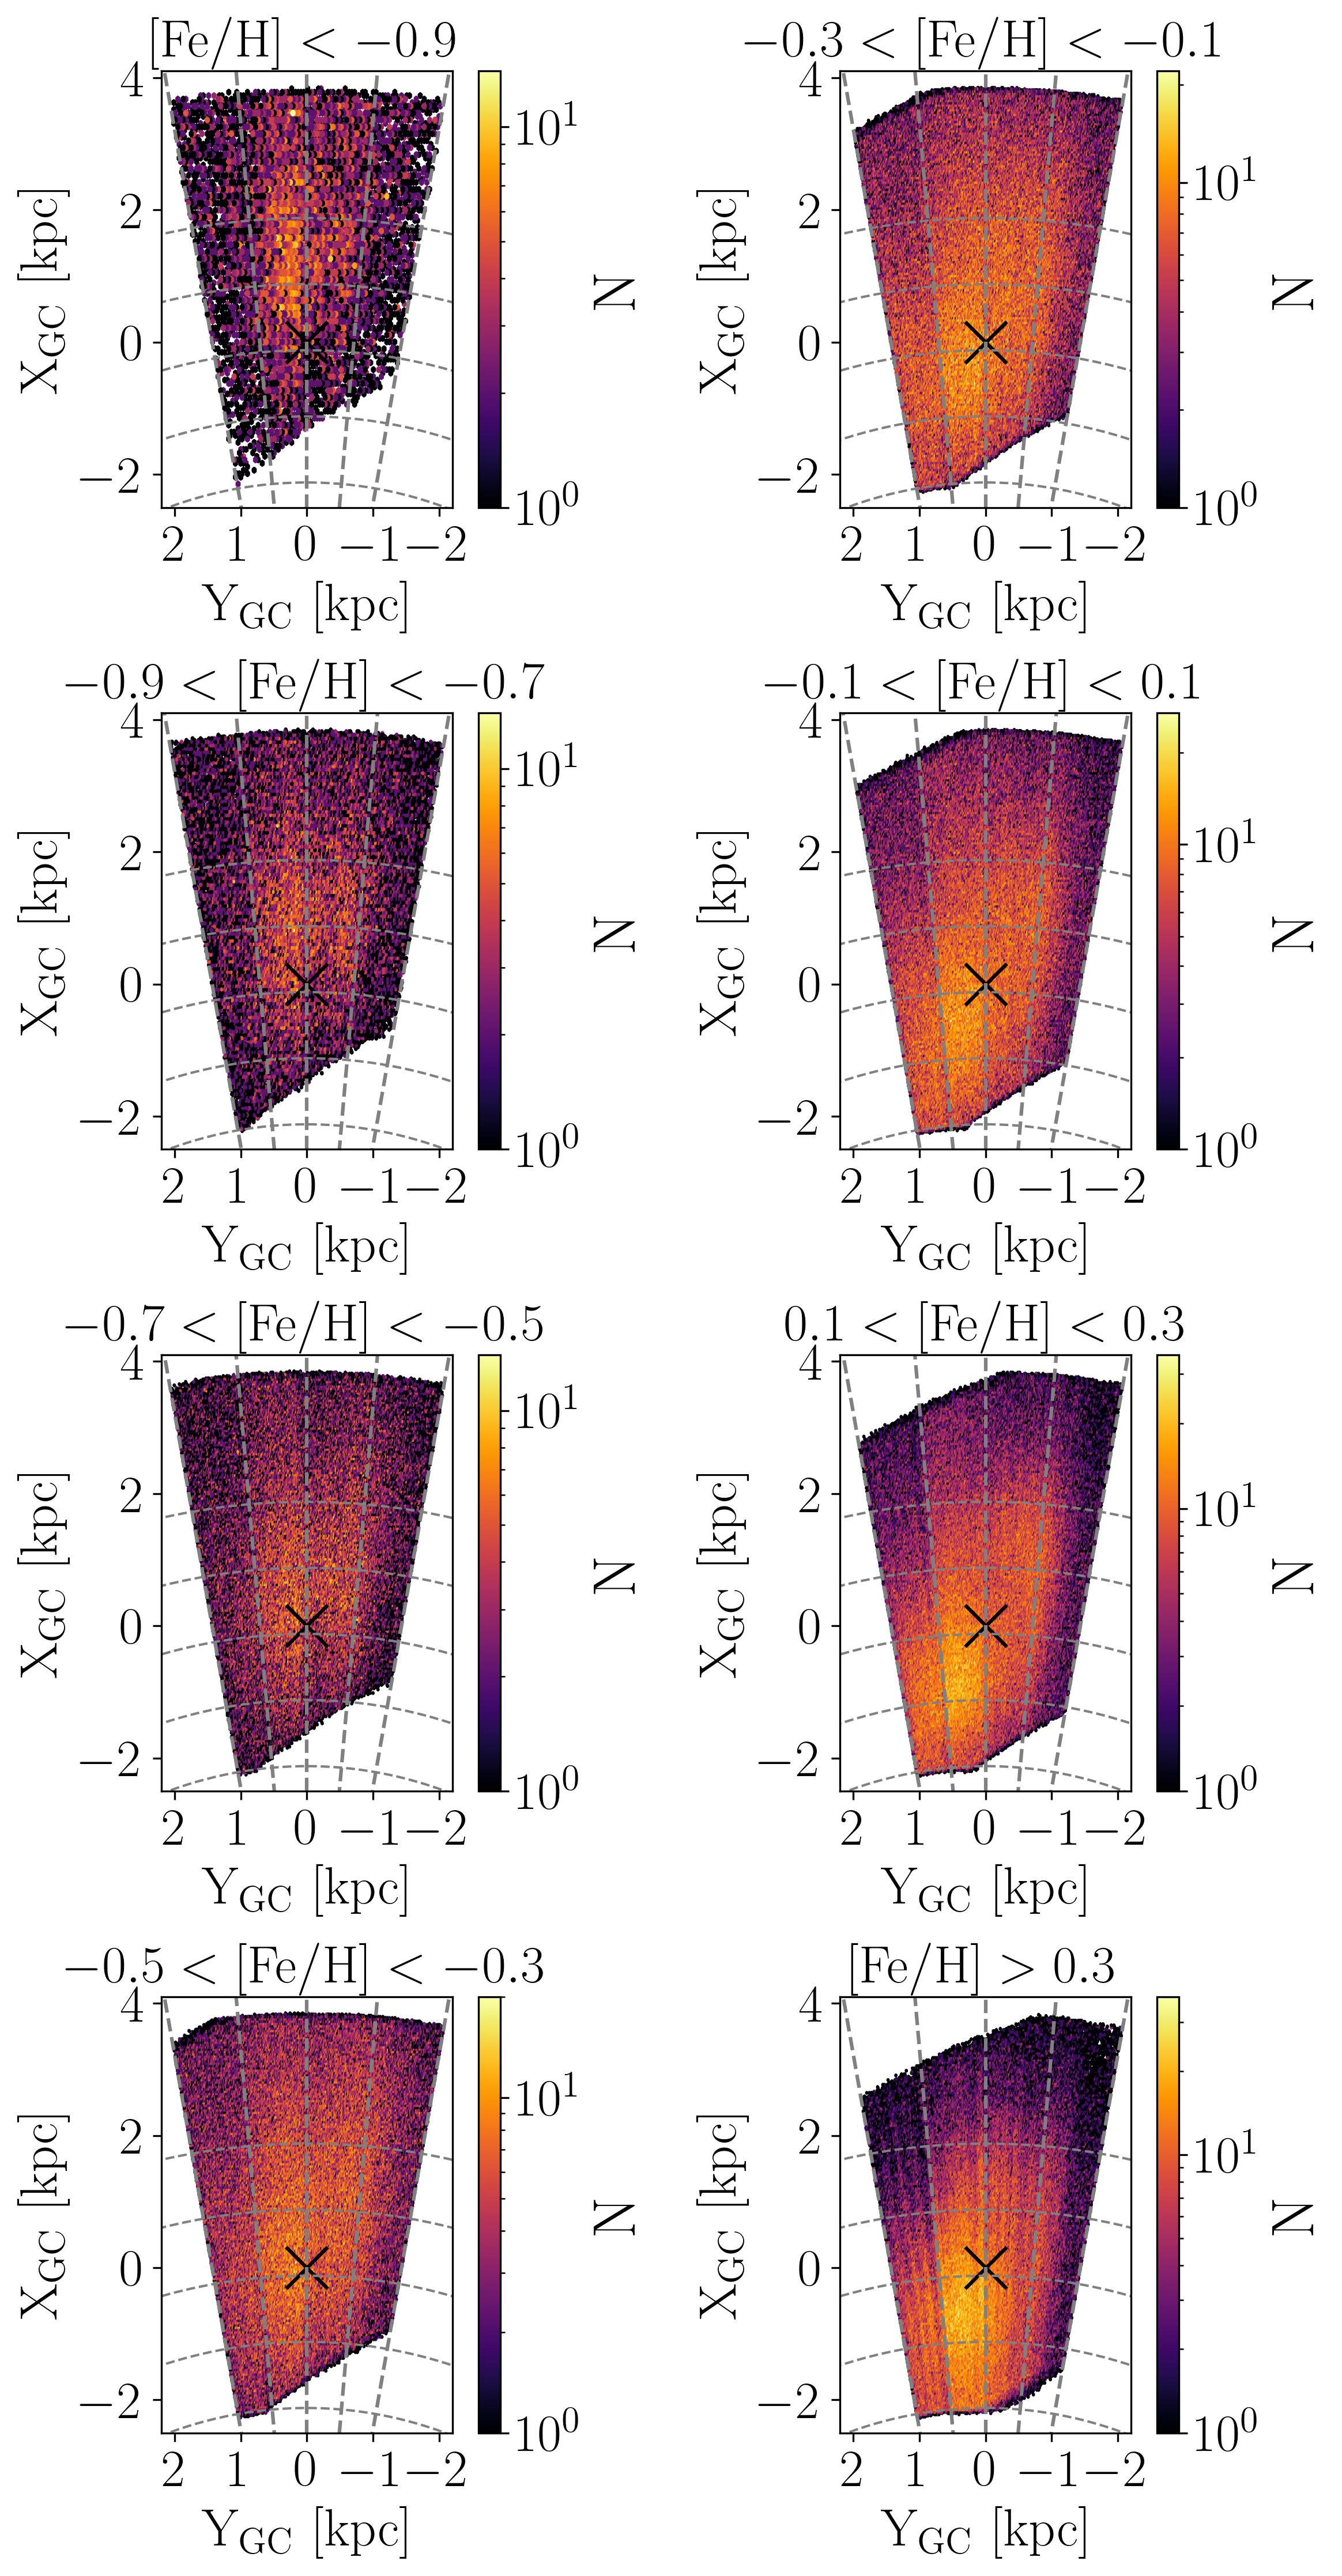
In the left panel of Fig. 2, we show the distribution of the sample of RC stars in Cartesian Galactocentric coordinates , where the black cross marks the position of the Galactic Centre, assuming a distance of kpc (GRAVITY Collaboration et al., 2018). The coordinate is aligned to the Sun-Galactic Centre direction, and is positive in the direction of the Galactic Centre, while the coordinate is positive along the direction of the Sun circular rotation in the disk. As already shown by previous works (e.g. Wegg & Gerhard, 2013; Johnson et al., 2022), the over-density at , is due to the orientation of the near side of the bar, forming an angle of with the line of sight at (Wegg & Gerhard, 2013). If we split our sample in metallicity, using the same bins in [Fe/H] adopted by Johnson et al. (2022), Fig.3 shows that the distribution of the stars is heavily dependent on their chemical composition. Metal-poor stars ([Fe/H] dex) are more centrally distributed around the Galactic Centre, while the morphology of more metal-rich stars ([Fe/H] dex) shows the typical asymmetry with Galactic longitude caused by the orientation of the bar.
3 Chemo-kinematics of the Red Clump Stars
In this Section, we inspect the projected kinematics of the RC stars, as a function of position and metallicity, in the southern Galactic bulge. However, we caution that the spatial distributions presented here are heavily affected by our 10-20 distance uncertainties. As Figure 8 of Hey et al. (2023) shows, distance uncertainties of this magnitude distort two and three dimensional projections, particularly on the near side of the Galactic Center, and can smear out otherwise well-defined features.
In the central and right panel of Fig. 2, we plot the distribution of RC stars color-coded by Galactocentric velocity along Galactic longitude and latitude, respectively (equations 1 and 2). The clear asymmetry in the velocity field along longitude with respect to is an indication of the presence of the bar, which breaks the axial symmetry of the potential in the inner Galaxy (see also Sanders et al., 2019). The orientation of the contour line is at , consistently with results from Sanders et al. (2019). As expected, the mean velocity along latitude is , indicating no clear streaming motion above/below the Galactic plane (e.g. Reid & Brunthaler, 2004; Du et al., 2020).
3.1 Proper motion rotation curves as a function of metallicity
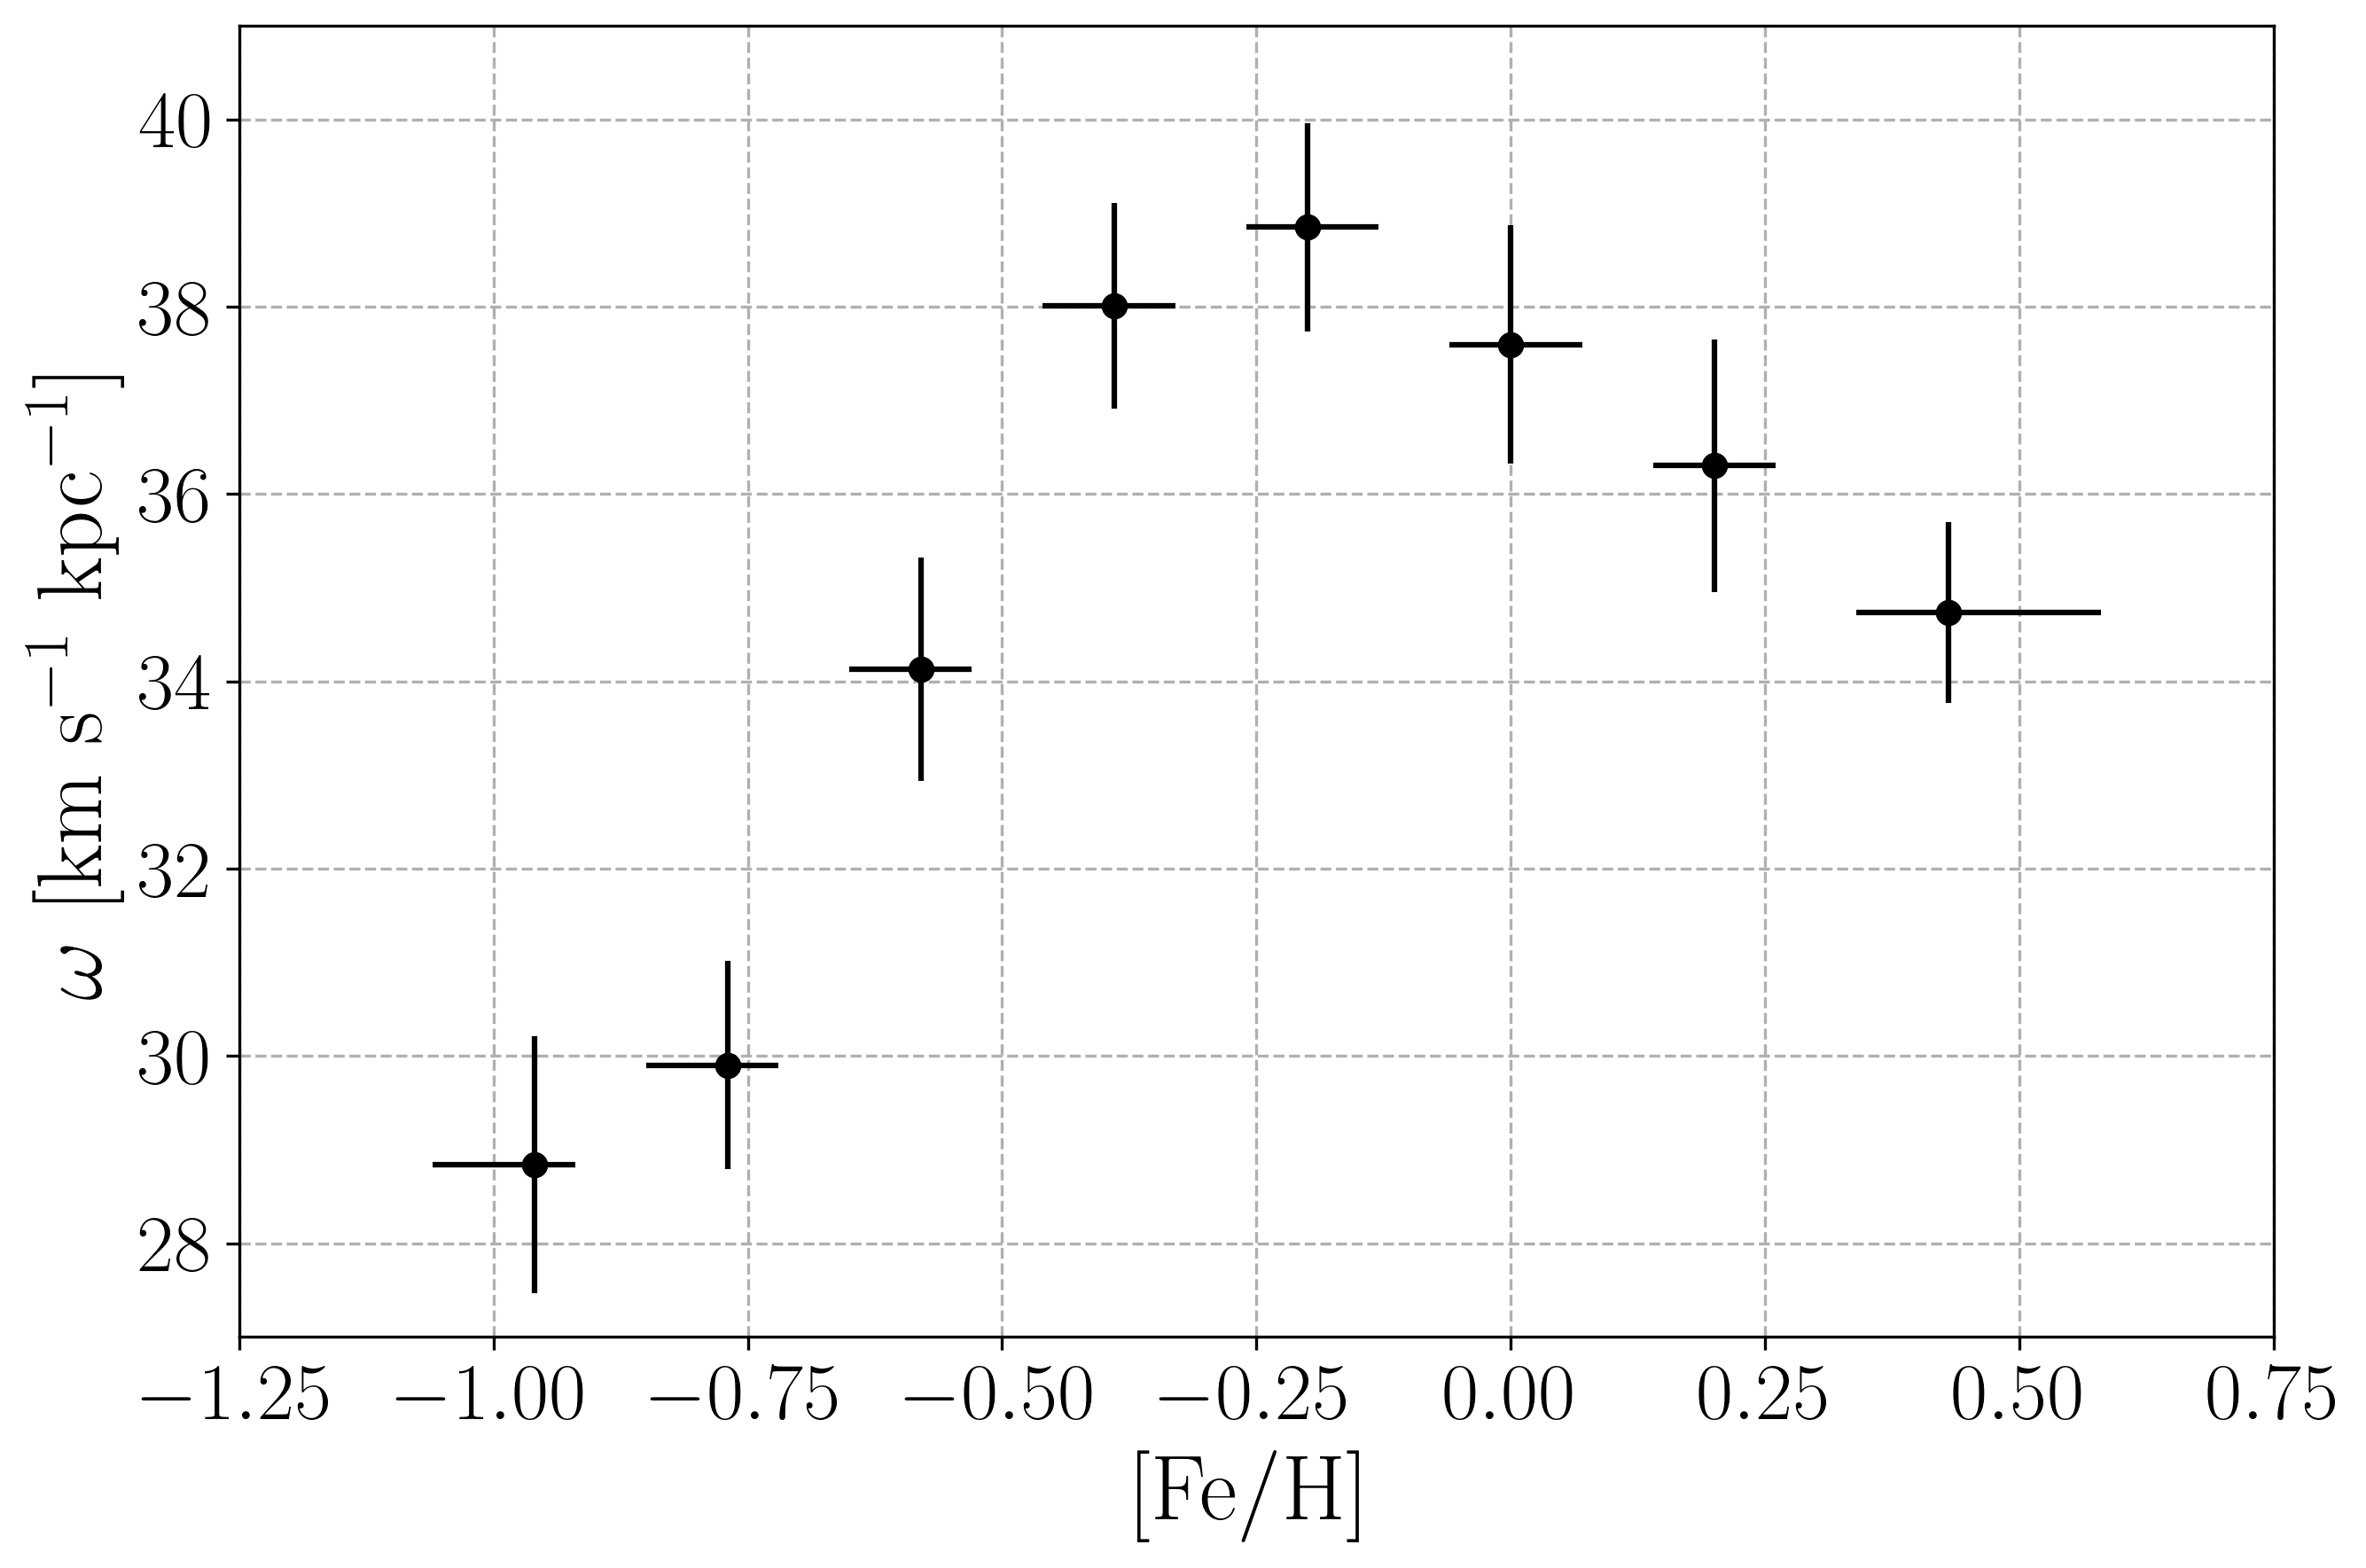
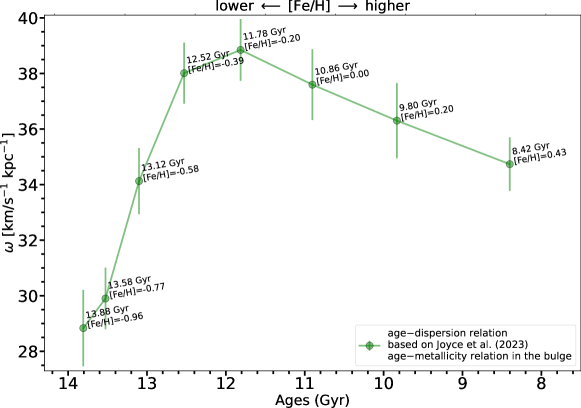
Gaia DR3 proper motions can be further used to construct proper motion rotation curves, as a function of heliocentric distance. Longitudinal Galactic proper motions provide similar results to line-of-sight velocities in the direction of the Galactic bulge (Du et al., 2020). By plotting the median of the Galactic longitudinal velocity (as given by Eq.(1)) as a function of distance , we can compute the angular velocity as the slope of the linear relation (e.g. Du et al., 2020), for different metallicity bins. By binning the stars in metallicity using the same intervals adopted by Johnson et al. (2022), in the upper panel of Fig. 4 we show the resulting as a function of (we report the median metallicity value in each bin) for our sample of RC stars. The uncertainty on is computed from the linear fit using the method of least-squares, taking into account the uncertainties on the velocity (computed by dividing the velocity dispersion by the square root of the number of stars in each metallicity bin). Metal-poor RC stars rotate slower: km s-1 kpc-1, and then the angular velocity increases significantly at dex, with a maximum value km s-1 kpc-1 for dex. The angular velocity starts decreasing again for dex, reaching a value of km s-1 kpc-1 in the most metal-rich bin at dex. The lower rotation of metal-poor stars is consistent with several studies of the Galactic bulge (e.g. Ness et al., 2013b; Ness & Lang, 2016; Zoccali et al., 2017; Clarkson et al., 2018).
We can now use the age–metallicity relation presented in Joyce et al. (2023) to roughly estimate the dependence of the angular velocity versus the age of the stars. This is shown in the lower panel of Fig.4 We do not attempt to compute proper age uncertainties for this analysis, so no horizontal error bars are given (conservatively, one expects uncertainties of roughly Gyr; Joyce et al. 2023). As expected by the monotonic behavior of the adopted relation, the shape of the curve reflects the chemical one. The peak of the angular velocity corresponds to a population with an age of Gyr. The oldest stars in our sample have ages comparable to the age of the Universe, while the metal-rich stars are older than 8 Gyr.
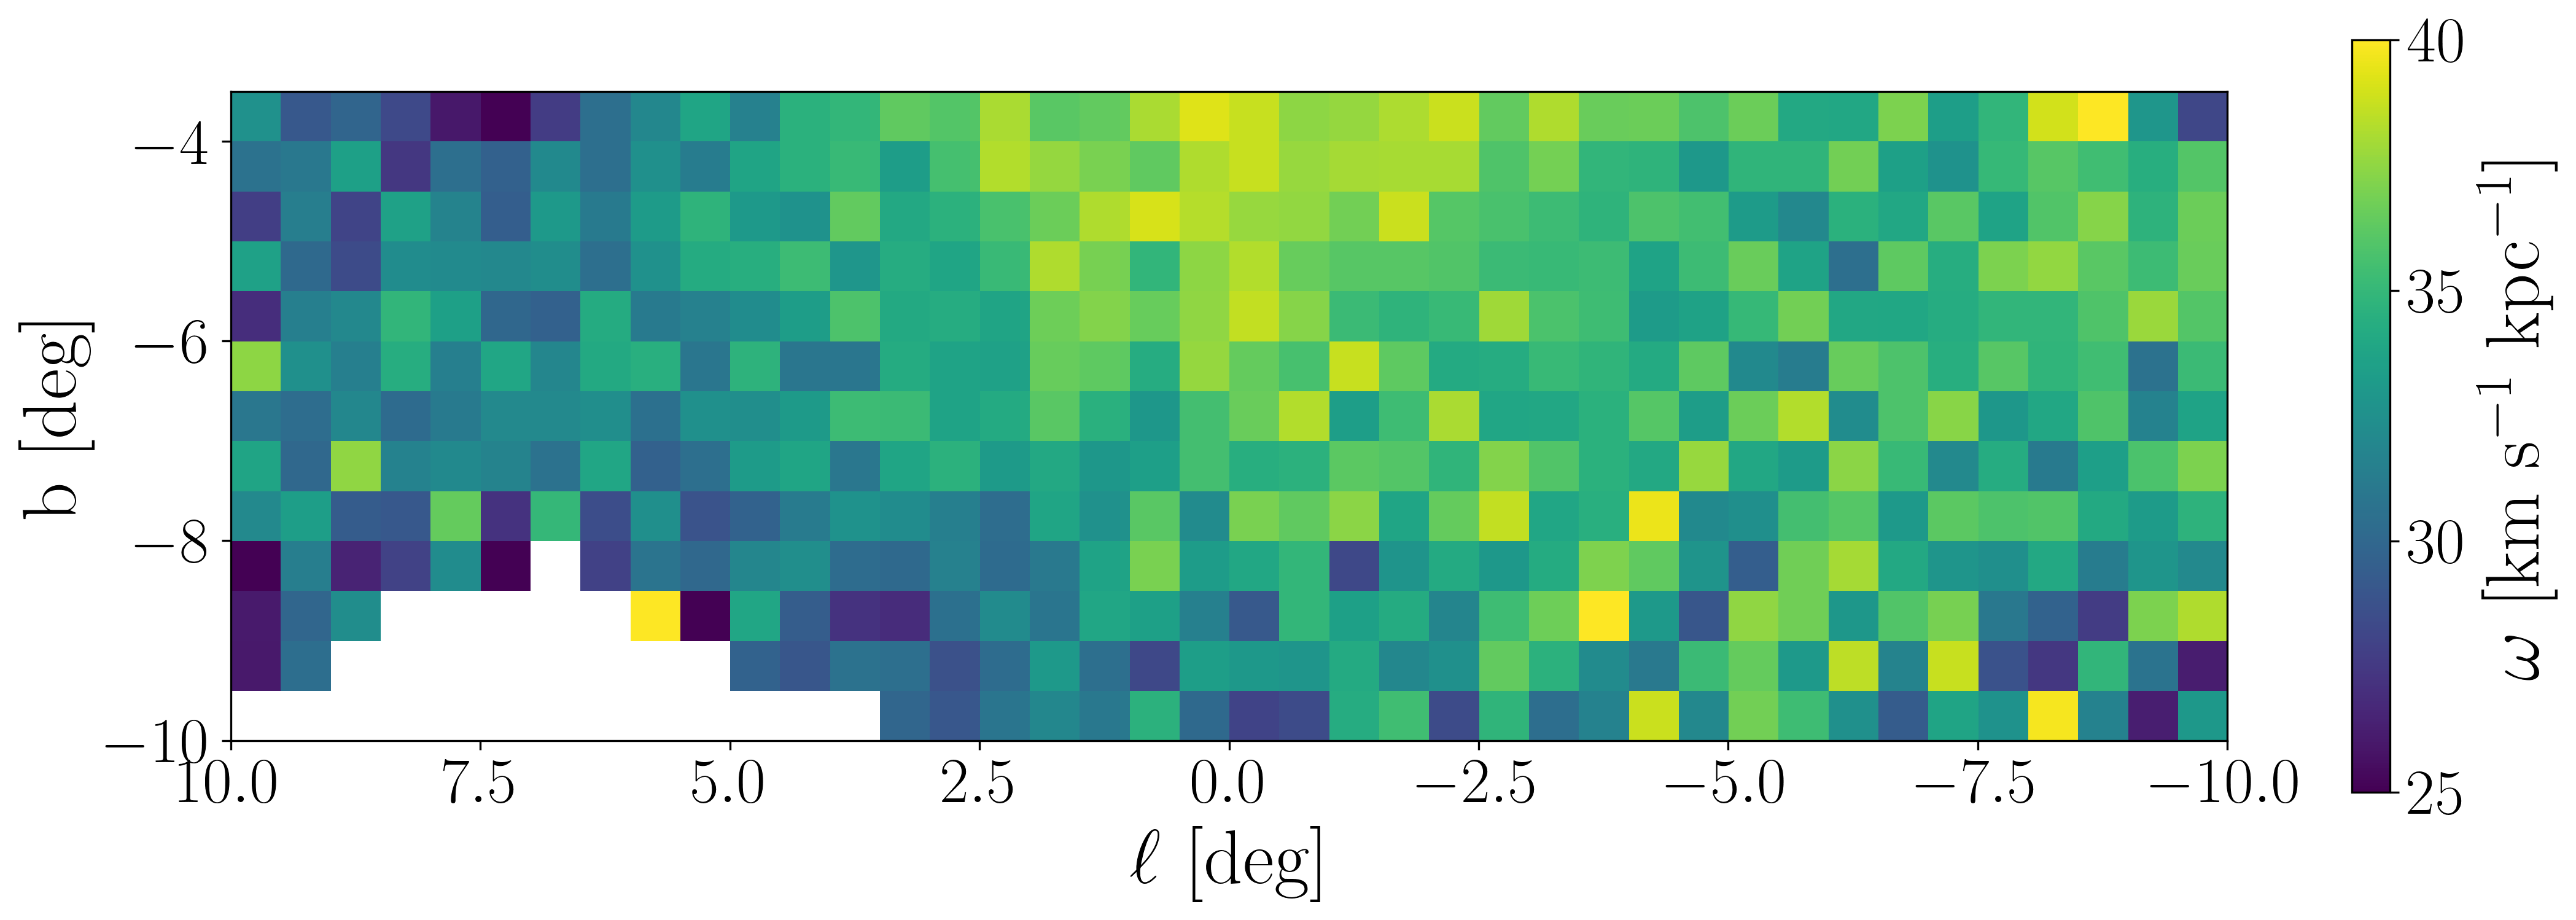
Thanks to the large spatial coverage of our sample in the southern Galactic bulge, and to the availability of homogeneous all-sky Gaia DR3 proper motions, in Fig. 5 we plot the sky distribution in Galactic coordinates of the angular velocity , for RC stars of all metallicities. We see that peaks at km s-1 kpc-1 at low latitudes along the bulge minor axis, and it decreases to a minimum of km s-1 kpc-1 for off-axis fields at higher latitudes. Typical uncertainties from the fitting procedures are km s-1 kpc-1, and they do not show any significative dependence on the sky location.
A comparison between Fig. 5 here and Fig. 16c in Johnson et al. (2022), which shows spatial distribution differences in [Fe/H] between the metal-rich peak and half-power position of the metal-rich tail, indicates that the sky patterns are highly correlated. Both distributions peak along the minor axis close to the plane, and show noticeable enhancements in both values within a region encompassing approximately 3∘ and 6∘. This observation provides one of the few clear connections between chemistry and kinematics for bulge formation and evolution as the regions showing the highest angular velocities are also those for which the broadest high metallicity tails formed.
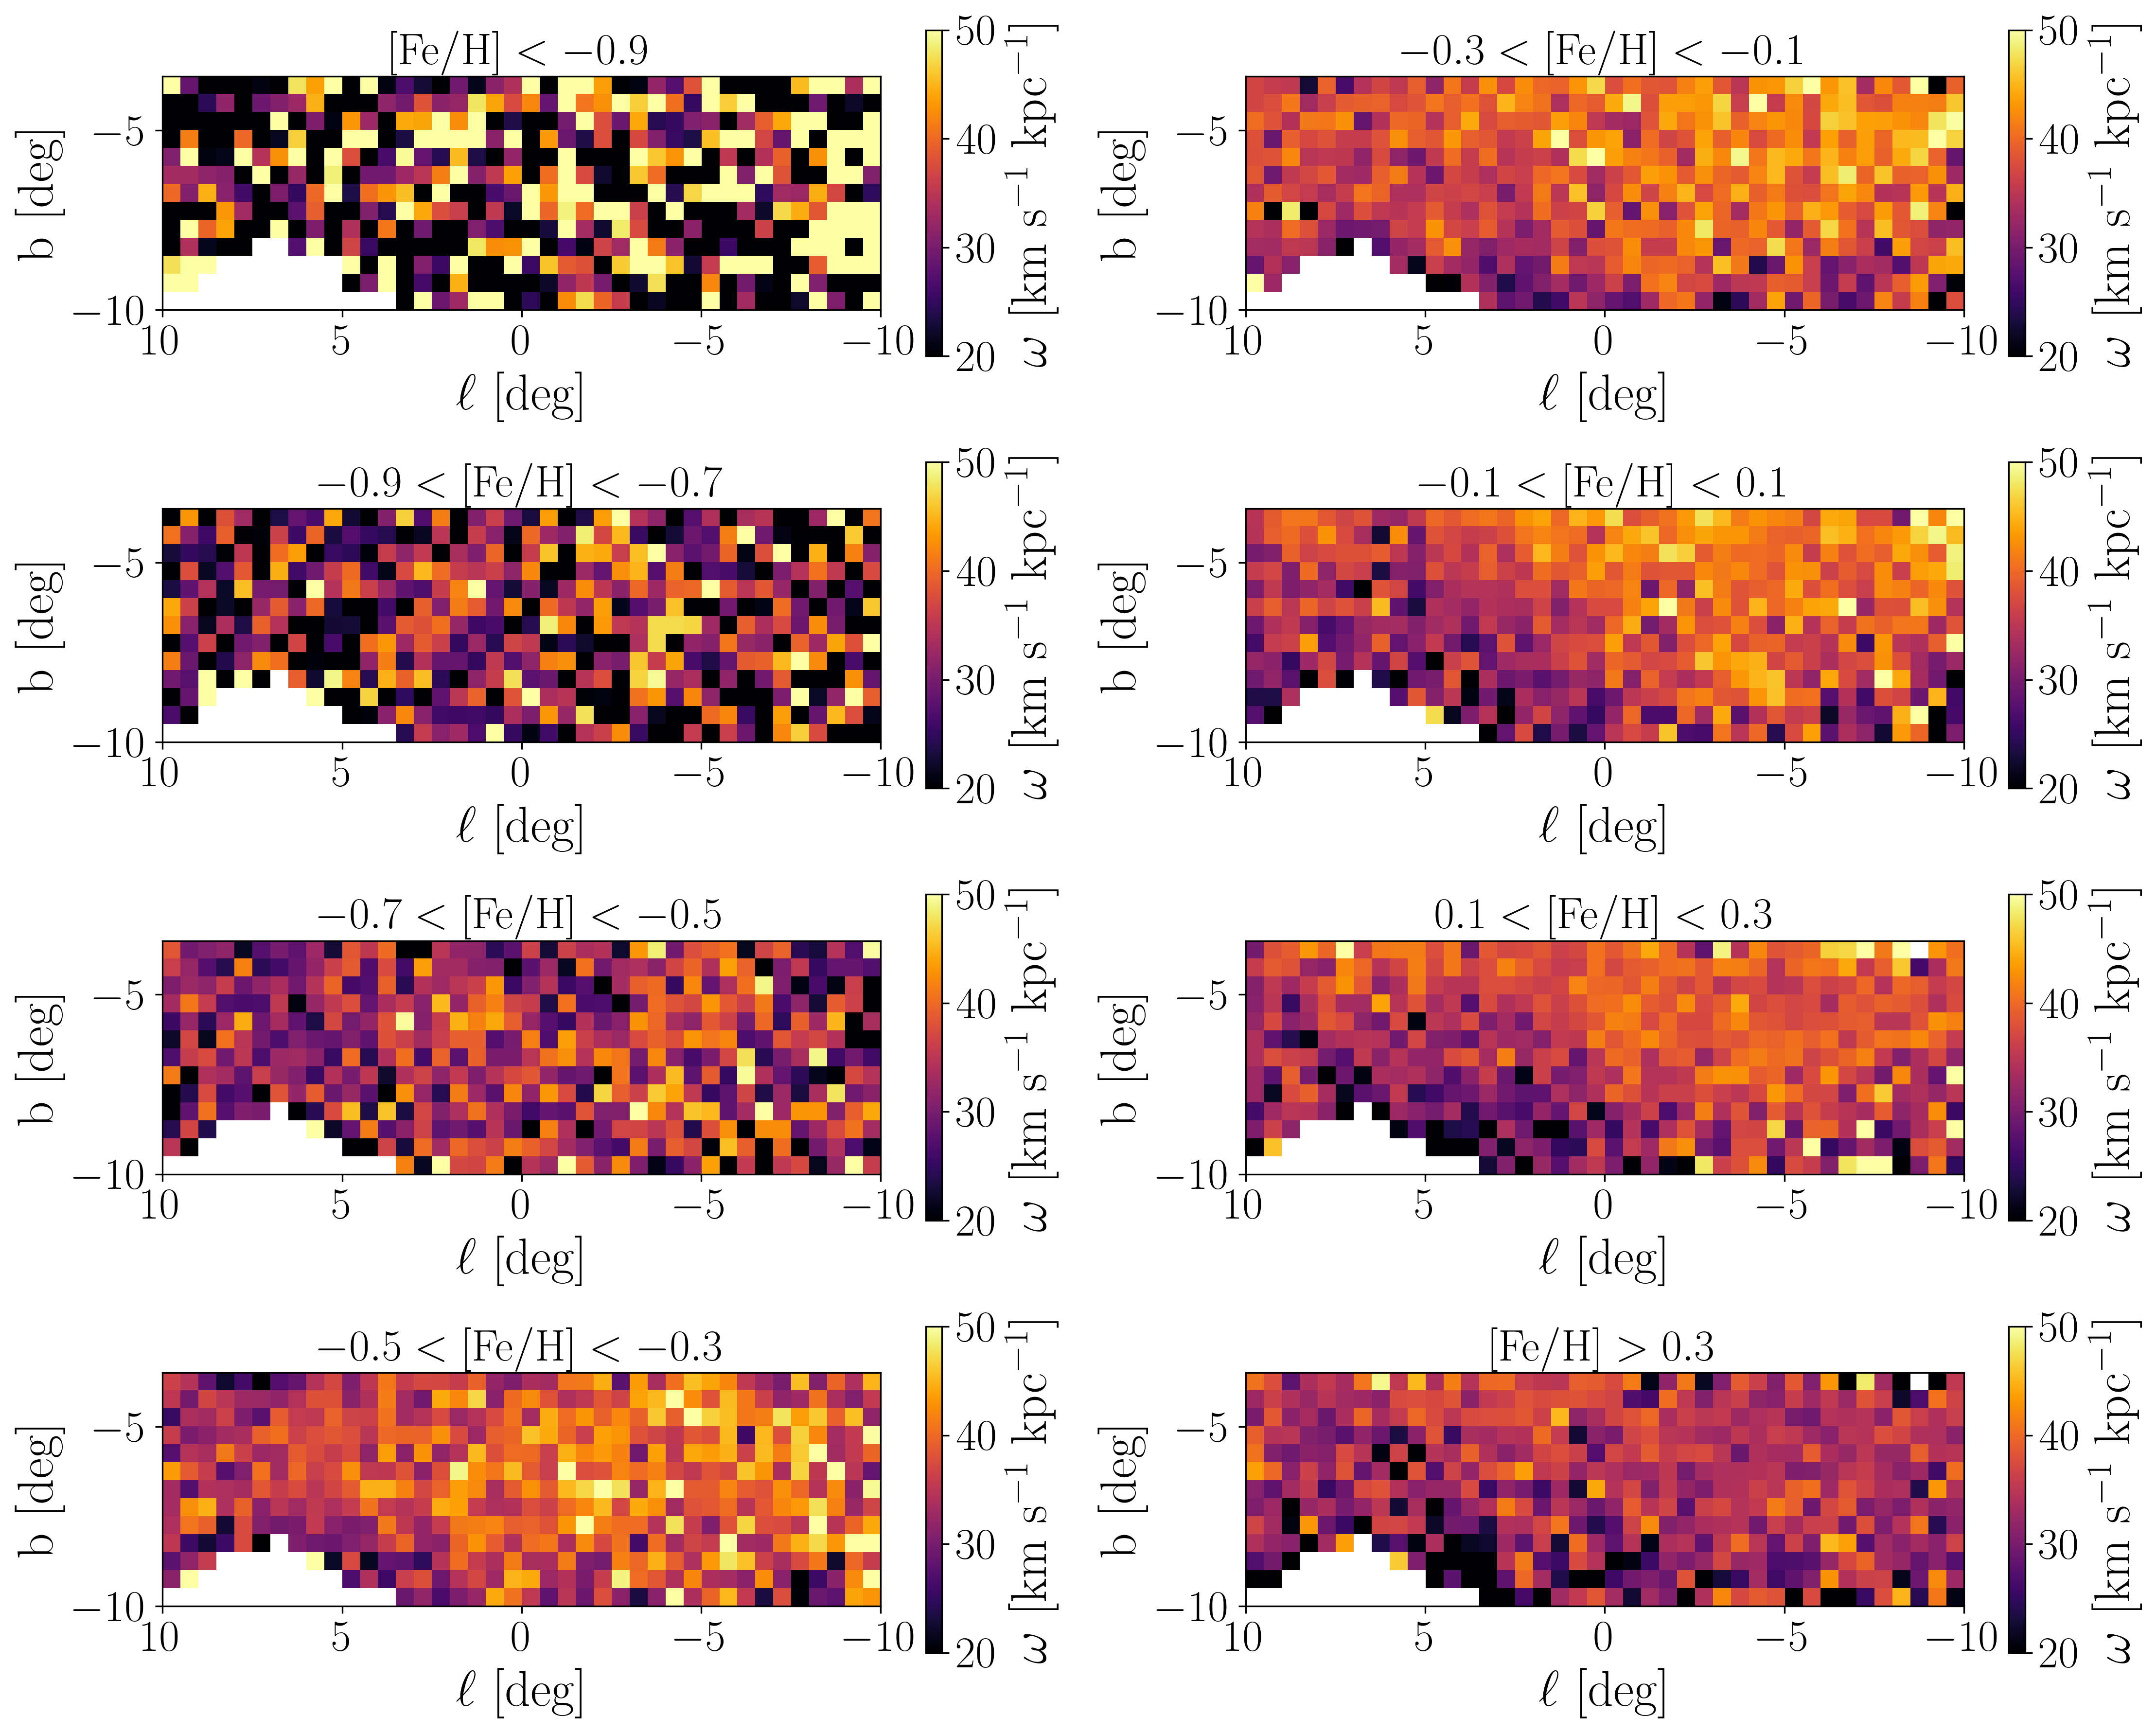
Fig. 6 incorporates the spatial and chemical dependence of the Galactic longitudinal proper motion rotation curves, by presenting the resulting angular velocity as a function of Galactic coordinates, for several metallicity bins, chosen to match those in Fig. 19 of Johnson et al. (2022). At the lowest metallicities ( dex), there is no evidence for a clear, coherent signal over the survey footprint, with a noisy distribution with values ranging from to km s-1 kpc-1. On the other hand, for dex, there is a clear continuous pattern over the sky, with a mean value km s-1 kpc-1. We observe a clear asymmetry with Galactic longitude, showing lower values of for positive . We suspect this to be a projection effect due to the orientation of the bar. We do not observe a strong gradient with Galactic latitude. As also evident from Fig. 4, the angular velocities across the sky decrease to km s-1 kpc-1 for , confirming the slower rotation of the most metal-rich population observed in Fig. 4.
3.2 Impact of the Galactic bar on the chemo-kinematics of red clump stars
Recent works, combining Gaia DR2 and VVV infrared data, showed the impact of the Galactic bar on the transverse kinematics of bulge stars (Clarke et al., 2019; Sanders et al., 2019). The authors quantified these aspects by investigating the proper motion dispersions, dispersion ratio, and correlation between Galactic proper motions as a function of Galactic coordinates across the bulge. They found higher dispersions at low latitudes, a characteristic X-shape structure in the dispersion ratio, and an approximate radial alignment in the proper motions with a clear asymmetry at positive , due to the orientation of the near-side of the bar.
We can now reproduce these transverse kinematic maps using more precise and accurate Gaia DR3 data, adding the further dimension provided by photometric metallicities. We bin the sample in metallicities using the same bins adopted by Johnson et al. (2022) and in Fig. 6, and in Galactic coordinates by adopting bin sizes of . In each bin, we then compute the Galactic longitudinal proper motion dispersion as:
| (3) |
and the correlation between the Galactic proper motions as:
| (4) |
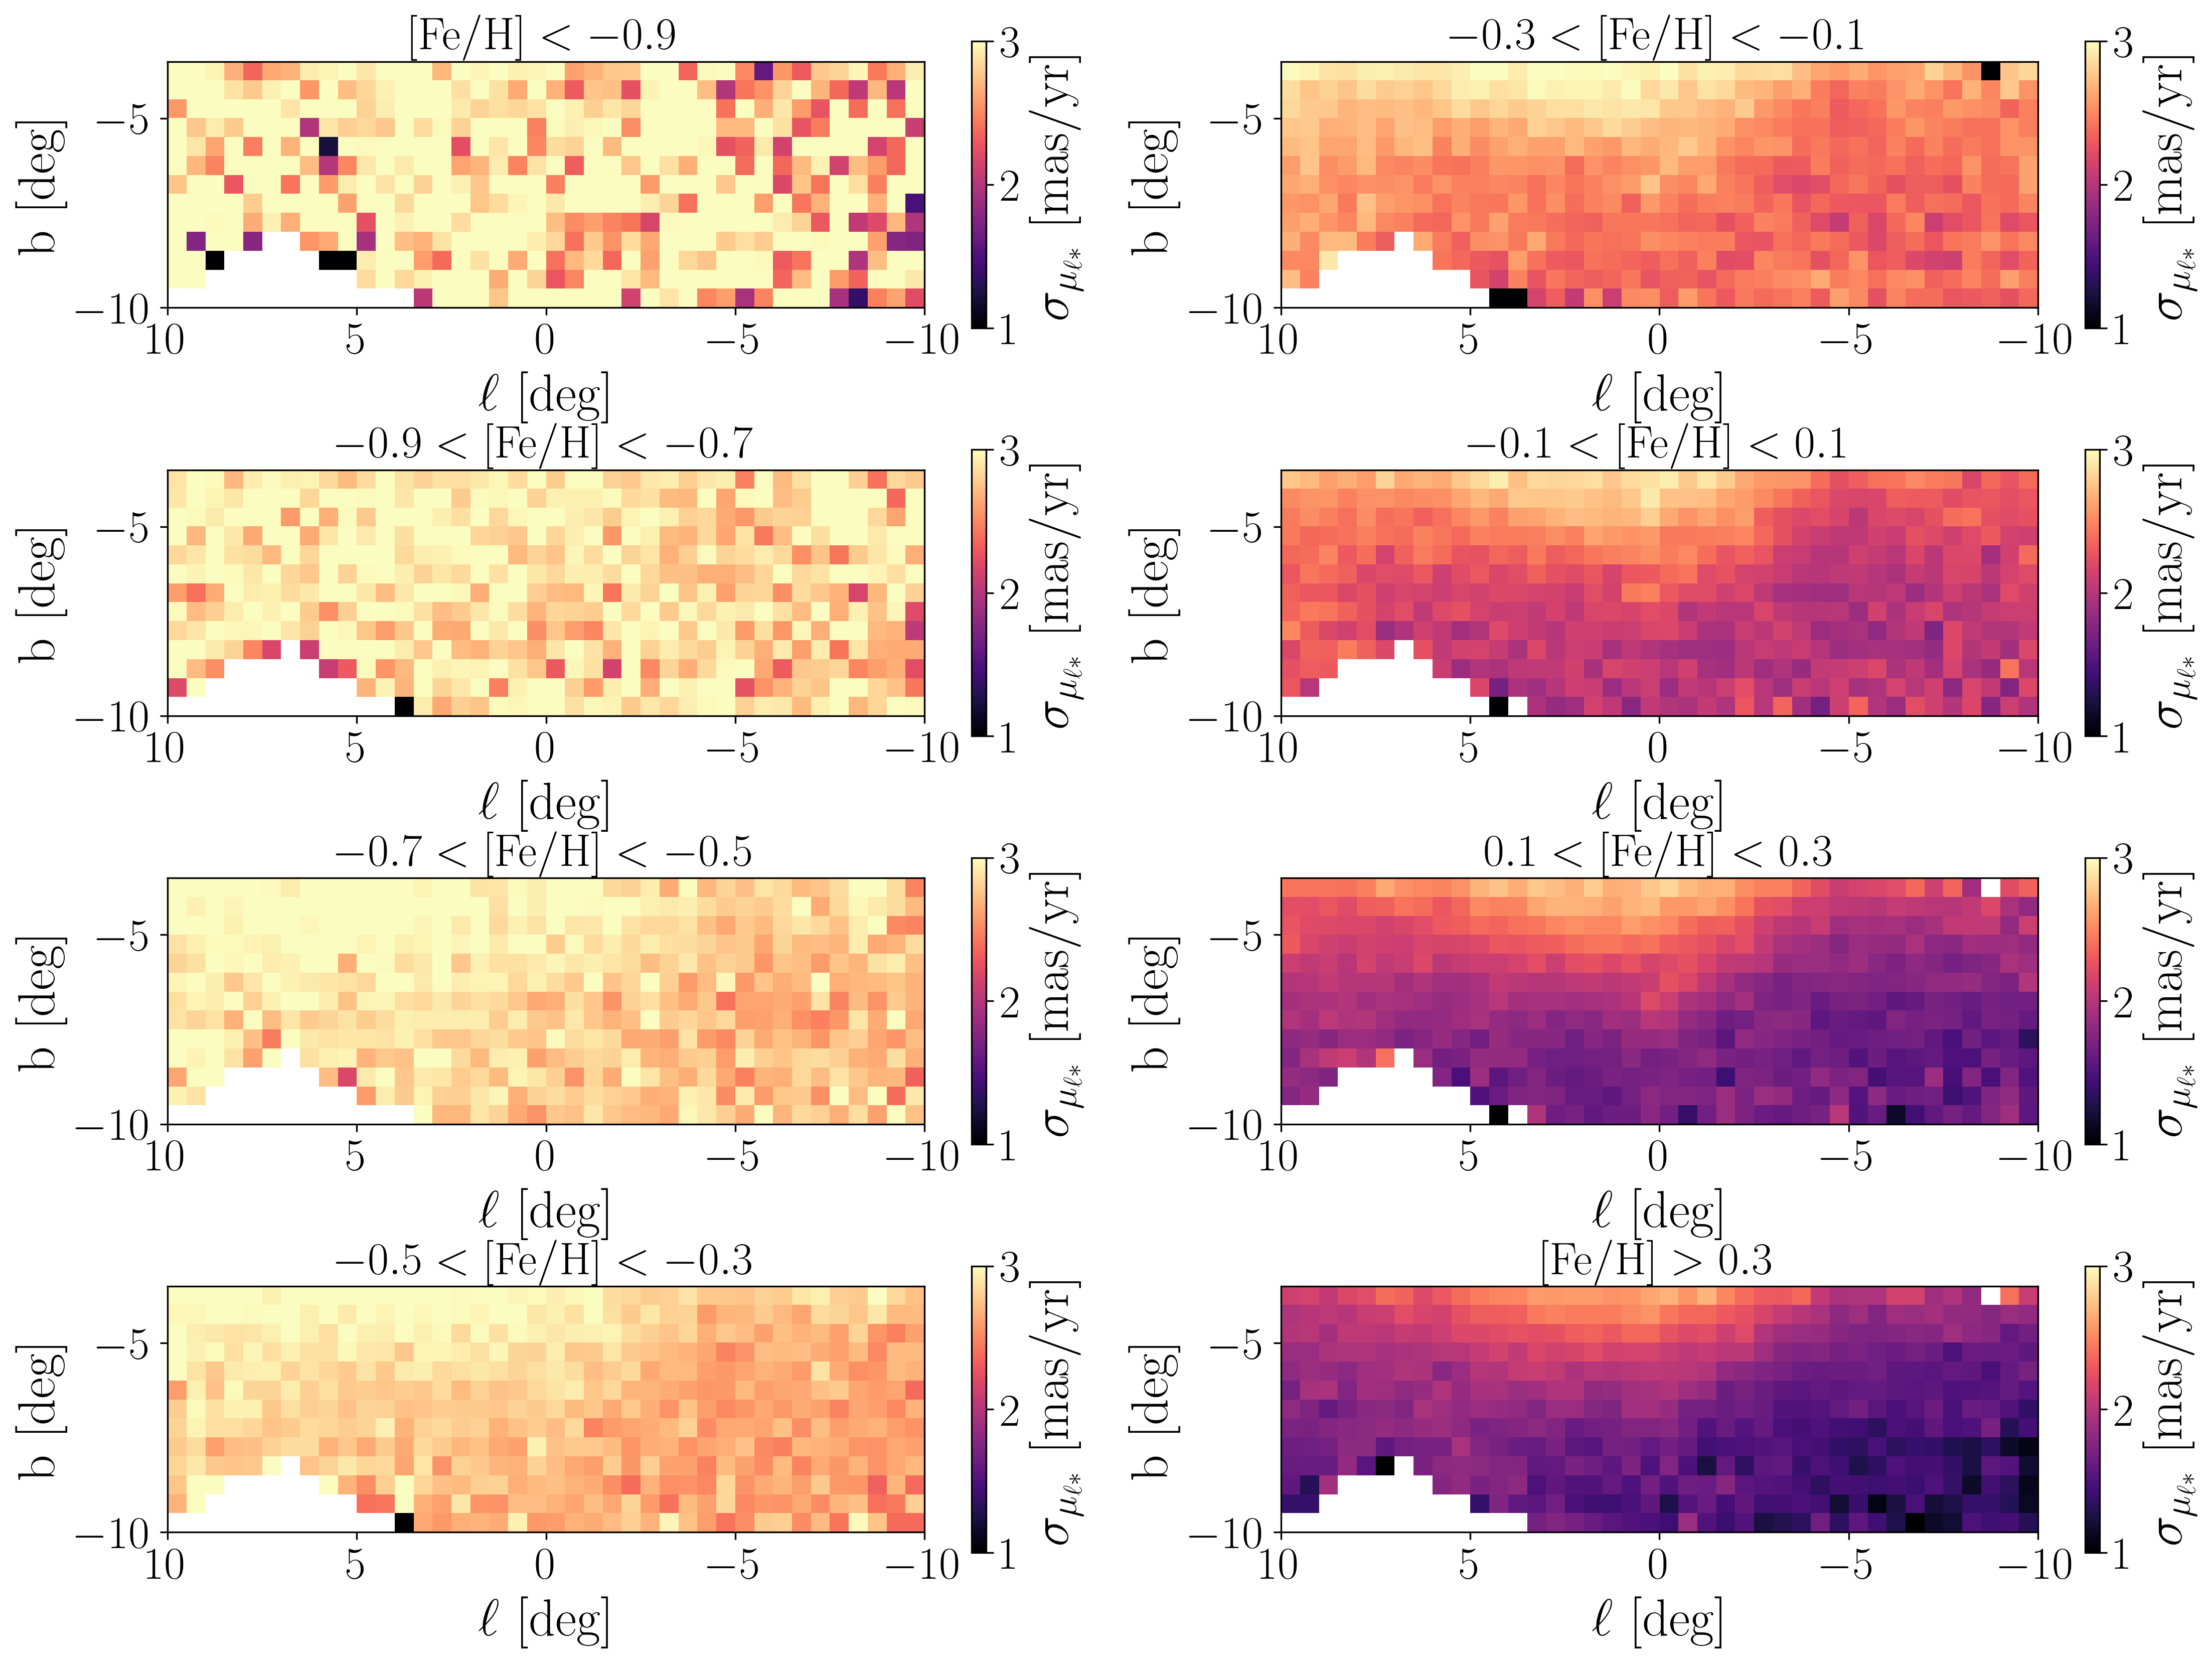
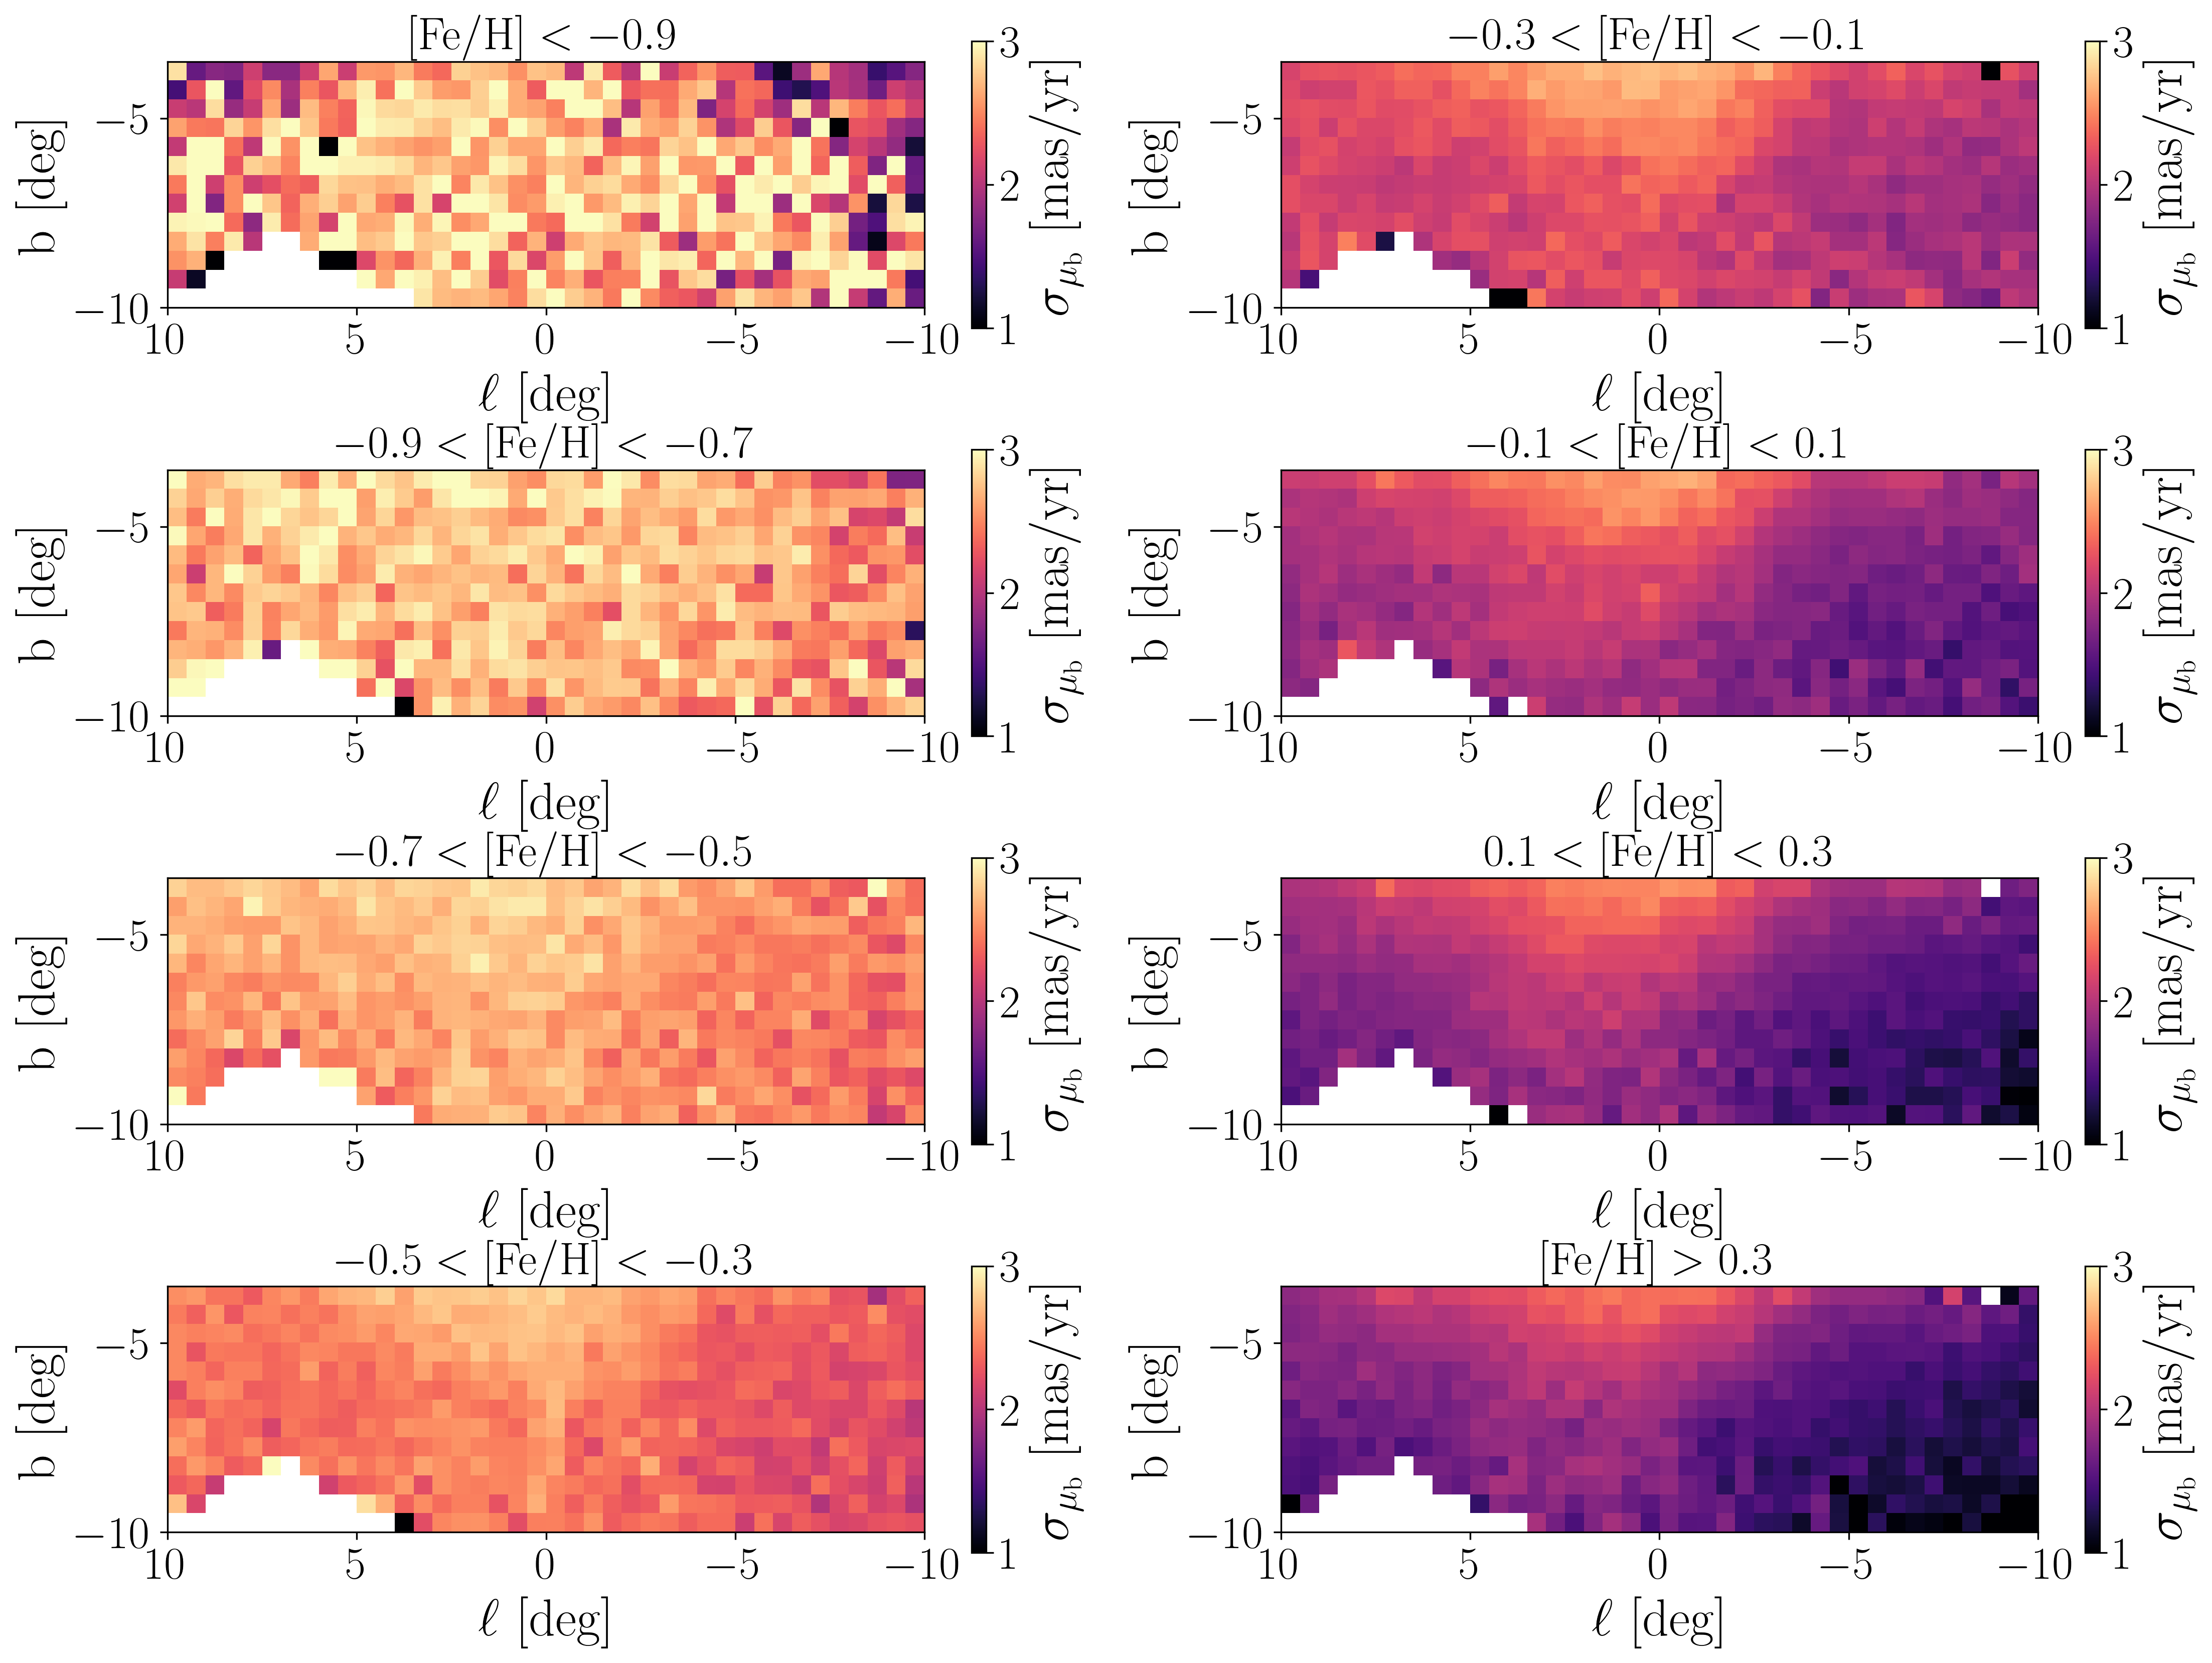
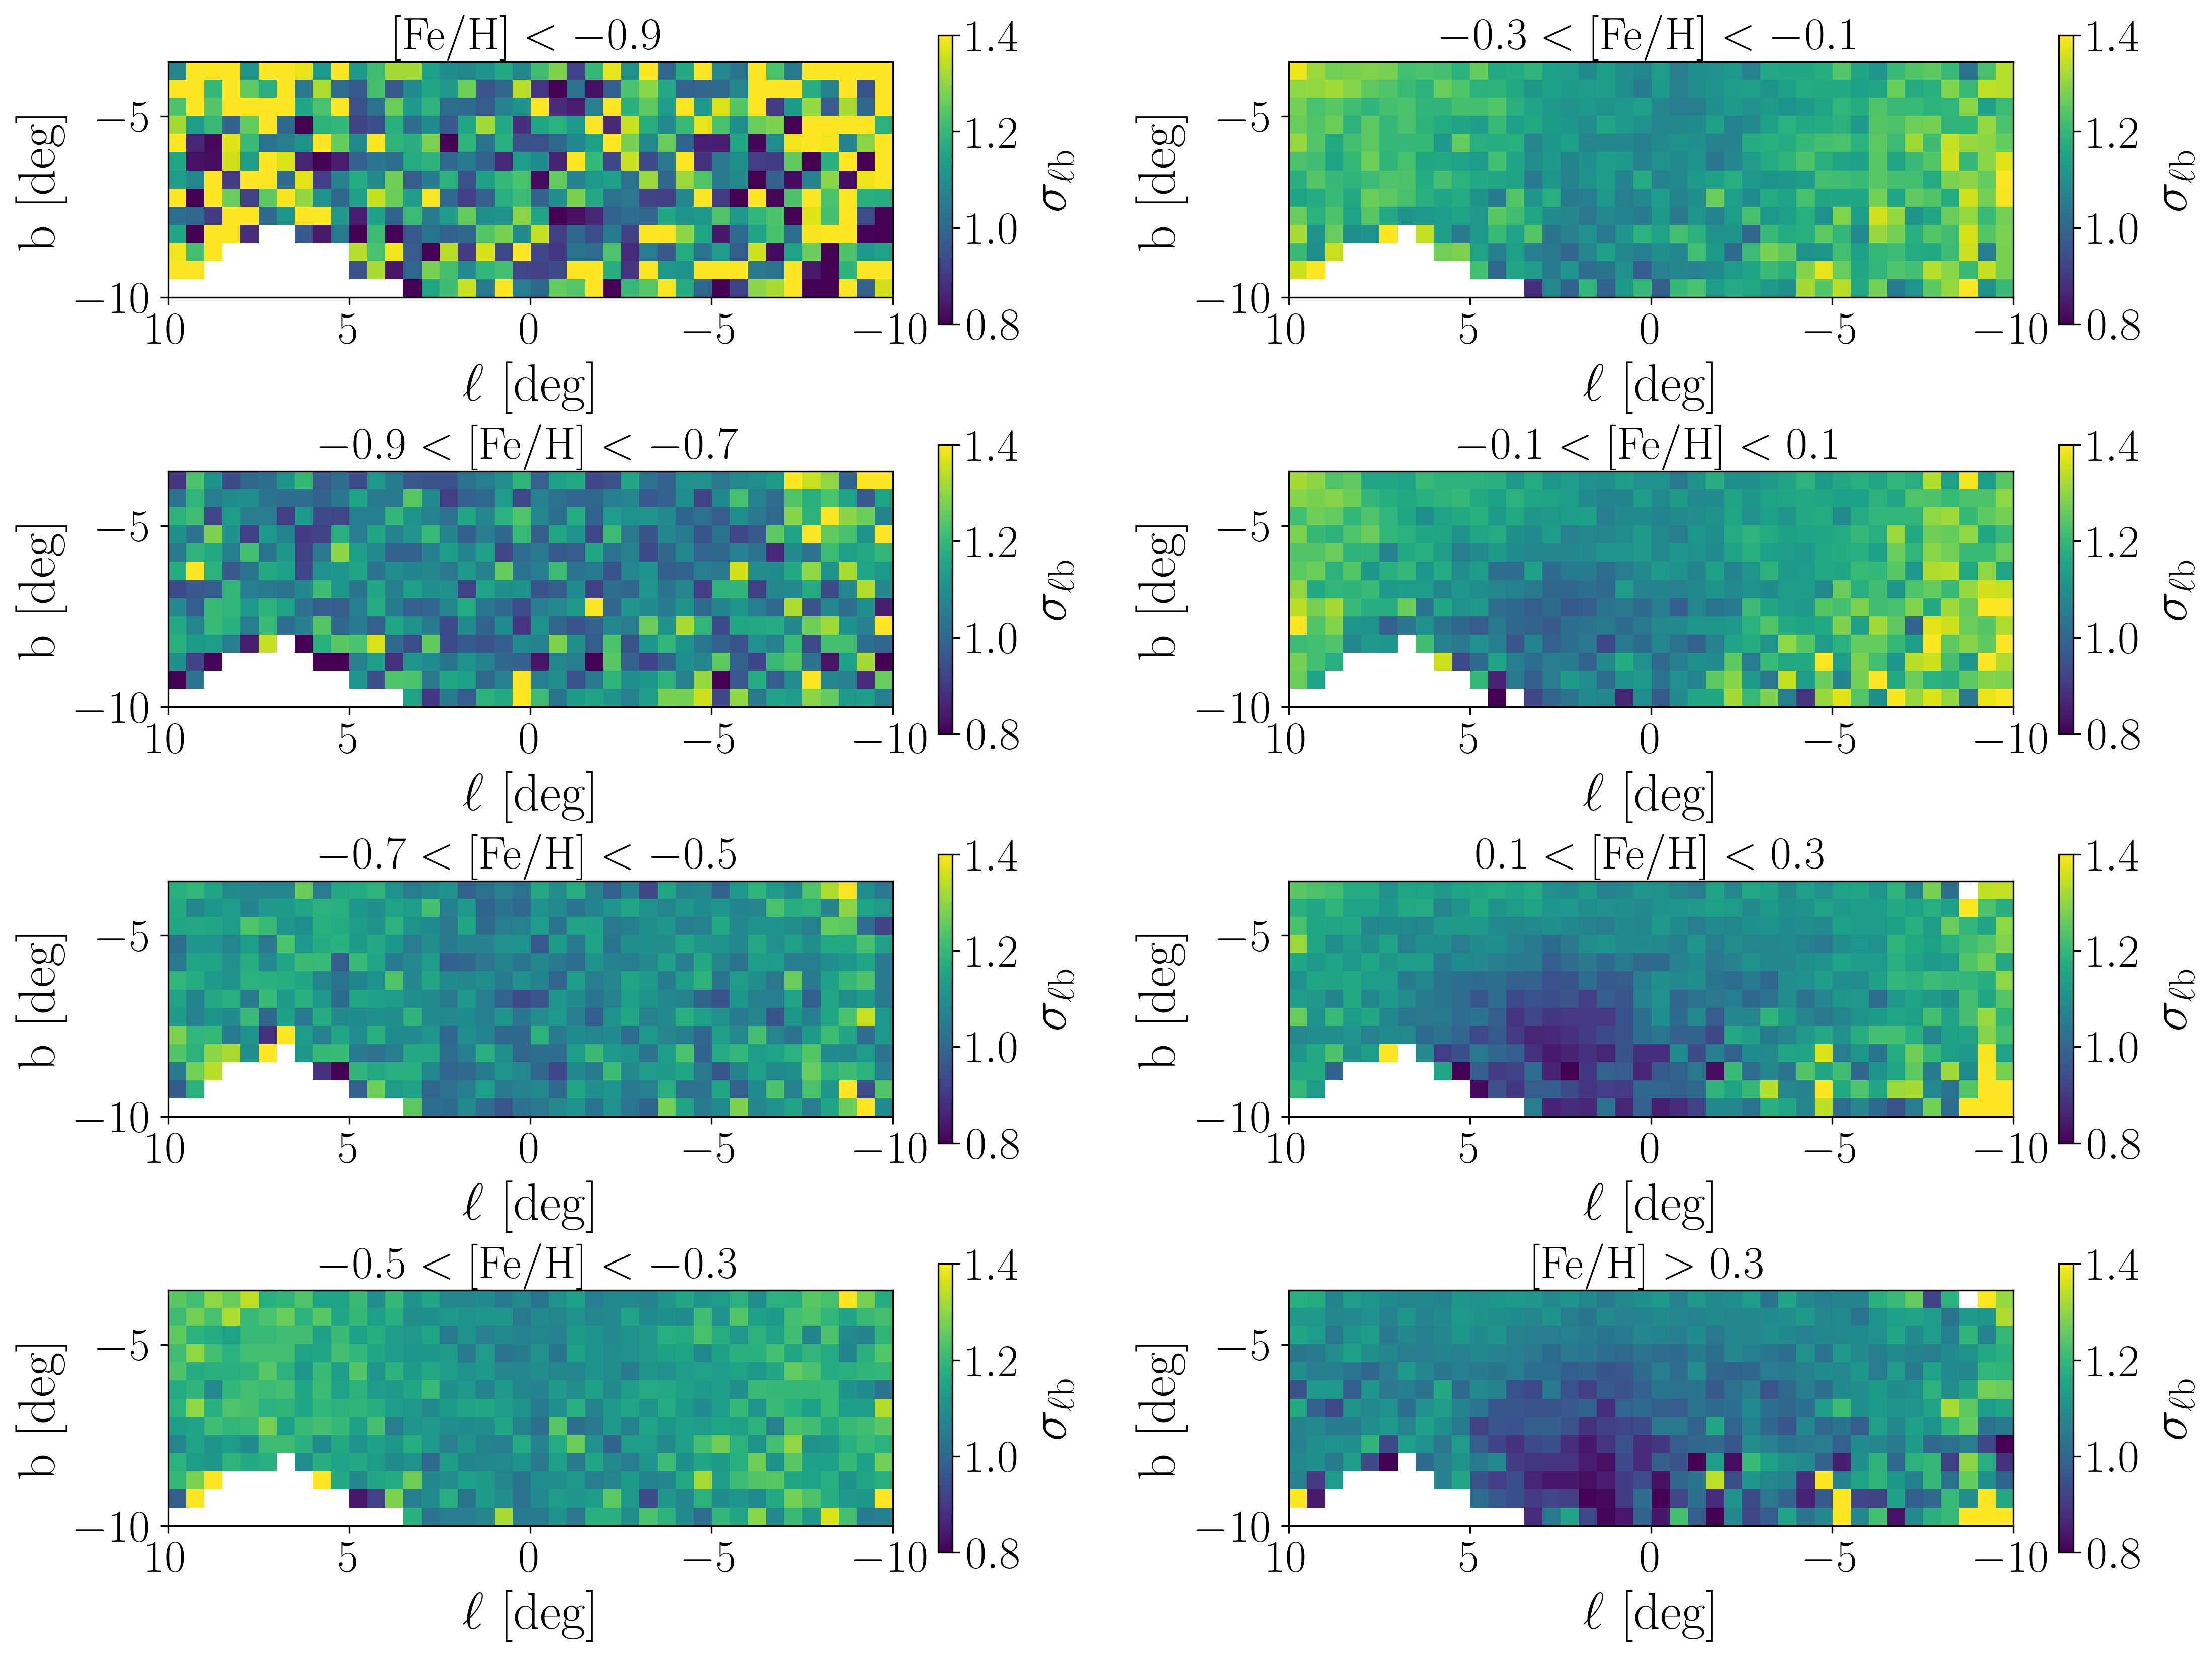
Fig. 7 shows the resulting proper motion dispersion along Galactic longitude, , as a function of sky positions, for the same metallicity bins adopted in Fig. 6. We can see how the metal-poor population is kinematically hotter, mas yr-1, which corresponds to km s-1 at a distance of kpc, while the metal-rich stars show a lower velocity dispersion (e.g. Ness et al., 2013b; Athanassoula et al., 2017; Zoccali et al., 2018). In addition, stars with dex exhibit a coherent pattern over the sky, reproducing results by Clarke et al. (2019); Sanders et al. (2019). This is particularly evident at , where the RC population is kinematically colder at higher latitudes, mas yr-1 km s-1, and the peak is observed on the minor axis towards the centre of the Galaxy because of the Galactic potential well (see also Rattenbury et al., 2007). We find that, for metal-rich stars, there is a strong gradient of the velocity dispersion with latitude, and on the minor axis at low latitudes it becomes higher than (or comparable to) the one of metal-poor stars (consistently with the findings of Zoccali et al., 2017, in the inner bulge). We also observe an asymmetry with respect to for metal-rich stars, with higher values of the dispersion at positive Galactic longitudes. Fig. 8 shows instead the velocity dispersion along Galactic latitude, . Once again, we note that metal-poor stars are kinematically hotter, and they do not exhibit a clear coherent pattern over the sky.
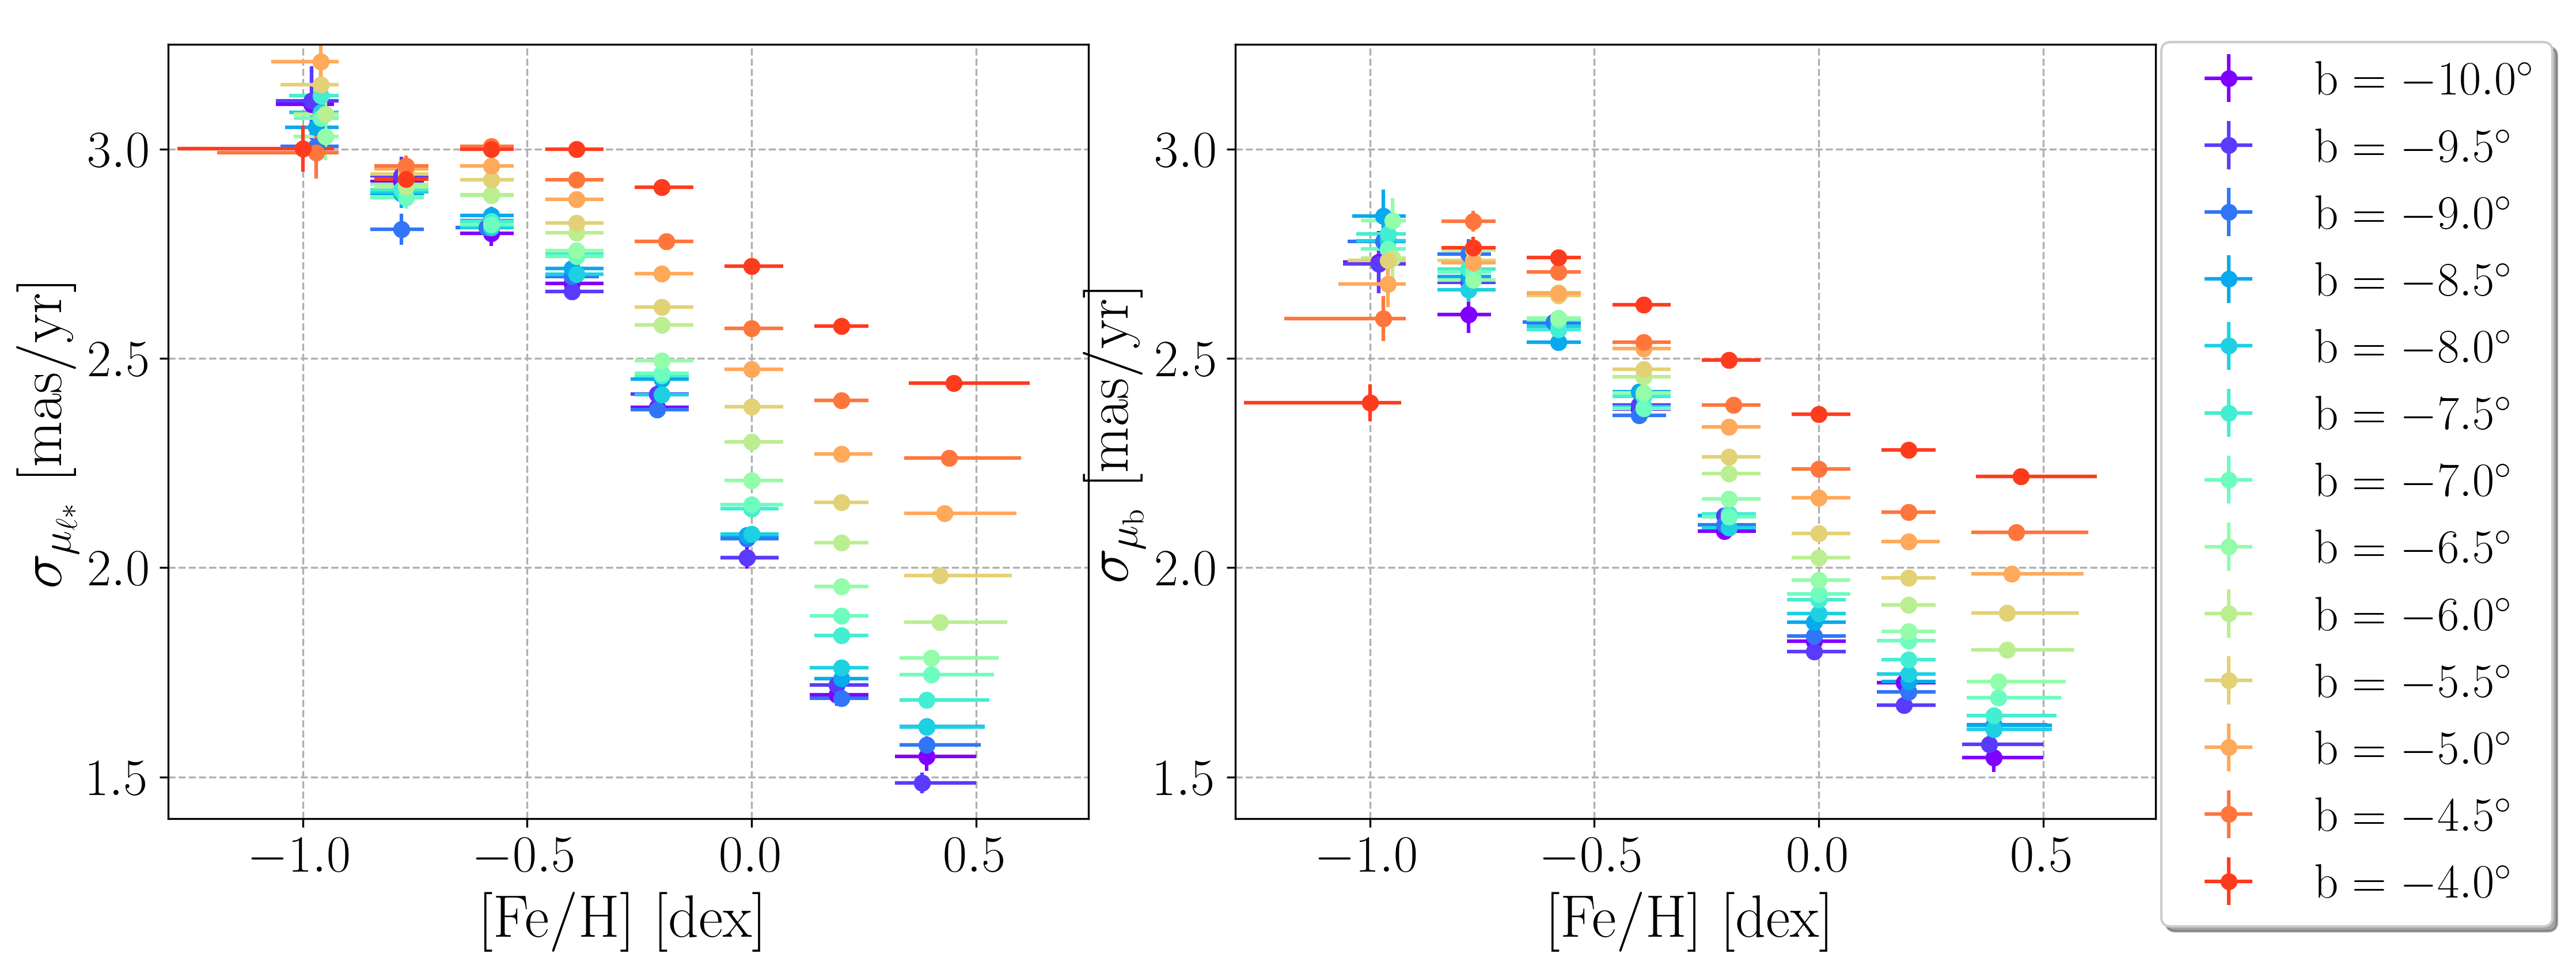
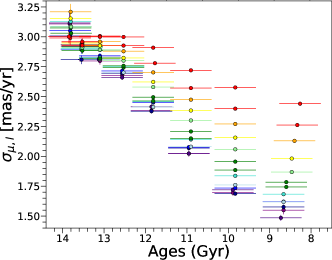
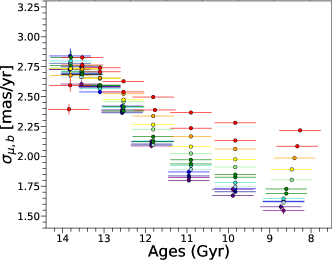
To better illustrate the different kinematics of stars with different chemistry, in the upper panel of Fig. 9 we plot the velocity dispersion along Galactic longitude (left panel) and Galactic latitude (right panel) as a function of metallicity, for different slices of Galactic latitude . In both cases, we clearly see that metal-rich stars are kinematically colder (see also Arentsen et al., 2020). For a given metallicity, stars closer to the Galactic plane show lower values of velocity dispersions (except for the most metal-poor star sample, which also has the largest uncertainties). Finally, we find that the difference in velocity dispersion between the stars at low Galactic latitude and high Galactic latitude increases with metallicity. Following the approach outlined in Section 3.1, we can estimate the dependence of the proper motion dispersions on the ages of the stars, as shown in the lower panel of Fig. 9. Younger stars are kinematically colder, and the highest values of the dispersions ( mas yr-1, mas yr-1) are obtained for stars older than 13 Gyr.
The results shown in Figures 7-9 closely mirror the metallicity dependent radial velocity dispersion variations noted by Wylie et al. (2021) in their Figure 26. Those authors found that stars with [Fe/H] 0.5 had strongly peaked radial velocity dispersions near = 0, but only for fields with 3 b 6. Additionally, Wylie et al. (2021) showed that the difference in radial velocity dispersion between low and high latitude fields increases strongly with increasing [Fe/H]. Therefore, we confirm their result that the more metal-poor stars have flatter velocity dispersion profiles as a function of latitude.
In Fig. 10 we plot the dispersion ratio as a function of metallicity and sky position, defined as the ratio between the velocity dispersion along longitude and along latitude. Similar to Figure 6 of Sanders et al. (2019), we find a significantly lower dispersion ratio for sight lines near 0∘ 5∘ and -6∘ compared to adjacent fields. This feature appears to be related to the influence of the X-shape structure in the bulge and is only prominent at [Fe/H] 0.
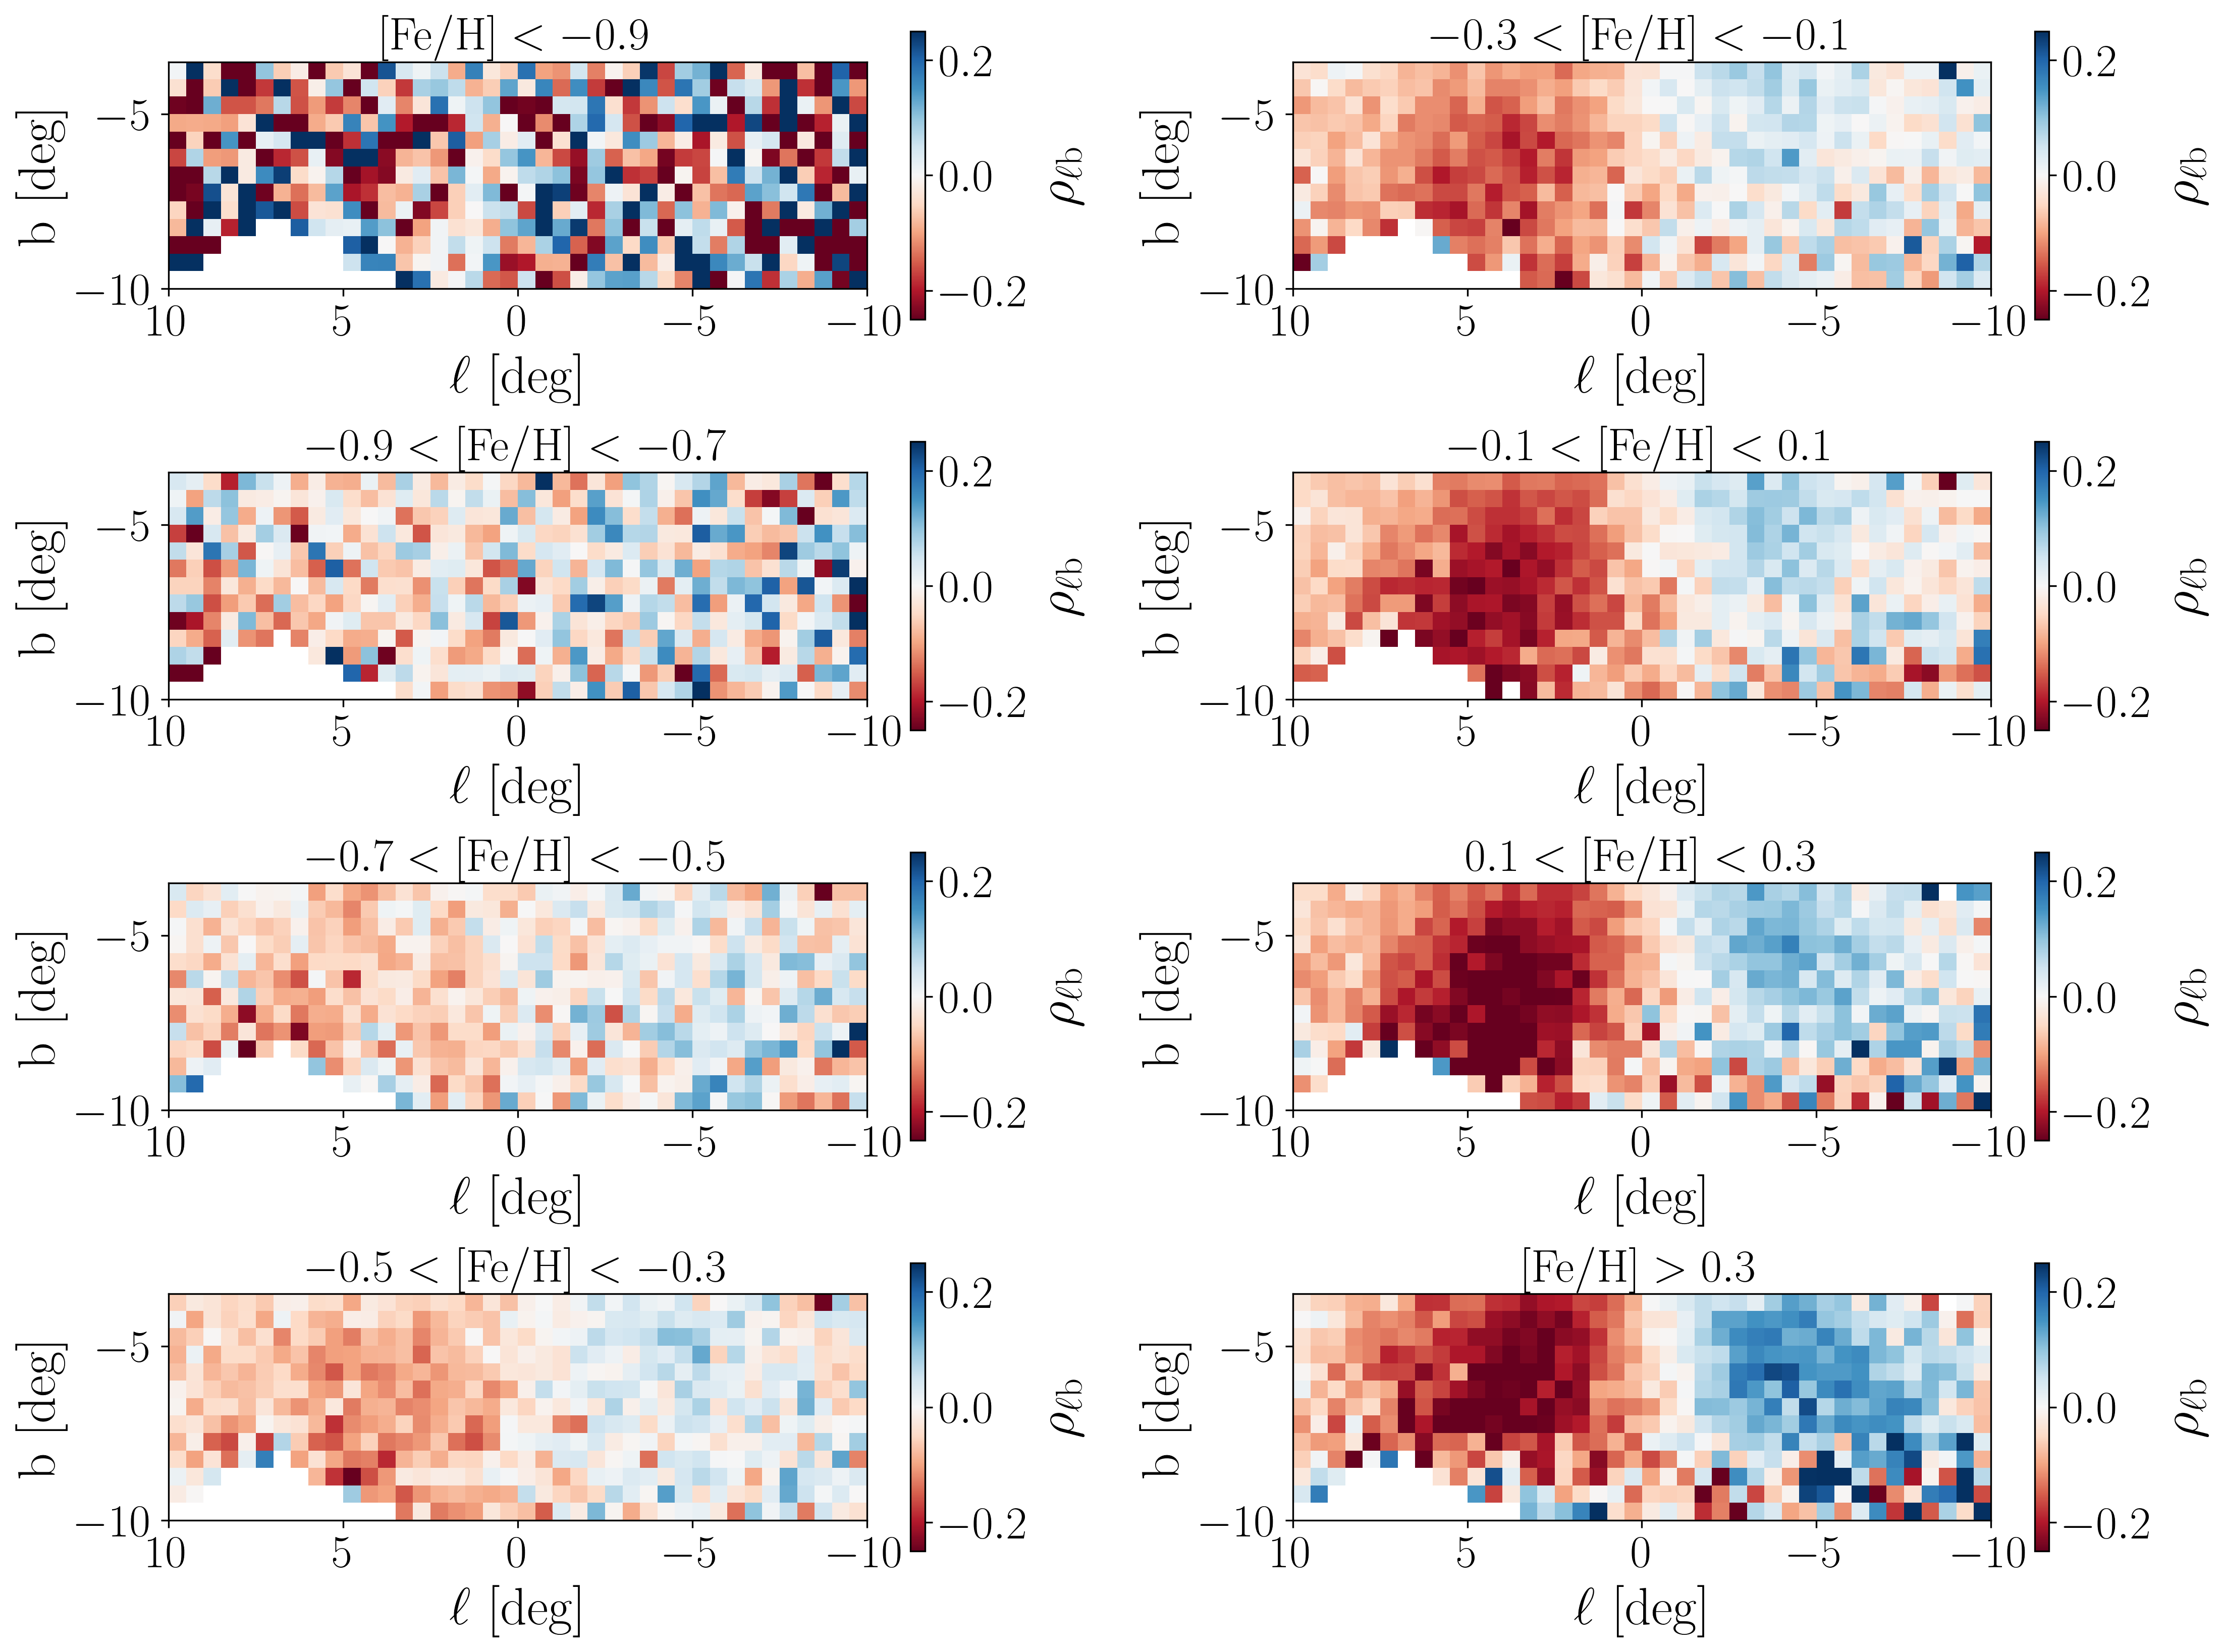
In Fig. 11, we plot the correlation coefficient between Galactic proper motions (Eq. 4), for the different spatial and metallicity bins. The dipole pattern (which becomes a quadrupole when having access also to the northern Galactic bulge) is a sign of radial alignment towards the Galactic Centre, with a stronger amplitude of the correlation at due to the orientation of the bar (see Clarke et al., 2019; Sanders et al., 2019). By looking at the different metallicity bins, we see how, similarly to Fig. 6 and Fig. 7, the dipole patterns start to become apparent for dex, with an amplitude . The maximum amplitude of is attained for dex. Interestingly, the asymmetry due to geometric effects at positive Galactic longitudes is most evident for the bin, but the absence of BDBS fields at , hampers the possibility to study this in more details.
3.3 Kinematic fractionation
In the previous sections, we noted that the most striking transition features due to the presence of the bar are most evident for [Fe/H] dex. In this section, we, therefore, decide to split the sample of RC stars into two large metallicity bins, defining metal-poor stars as RC stars with [Fe/H] dex, and metal-rich RC stars as those with [Fe/H] dex. We will now make a qualitative comparison between our results and the N-body + smoothed-hydrodynamics star-forming simulations of Debattista et al. (2017), following the approach outlined in Gough-Kelly et al. (2022). We note that the metrics introduced in Gough-Kelly et al. (2022) to investigate kinematic fractionation through proper motions in the bulge are defined not in terms of metallicity but of ages, for young ( Gyr) and old ( Gyr) stars, as ages are more natural units than [Fe/H] for their simulations, due to the lack of chemical mixing.
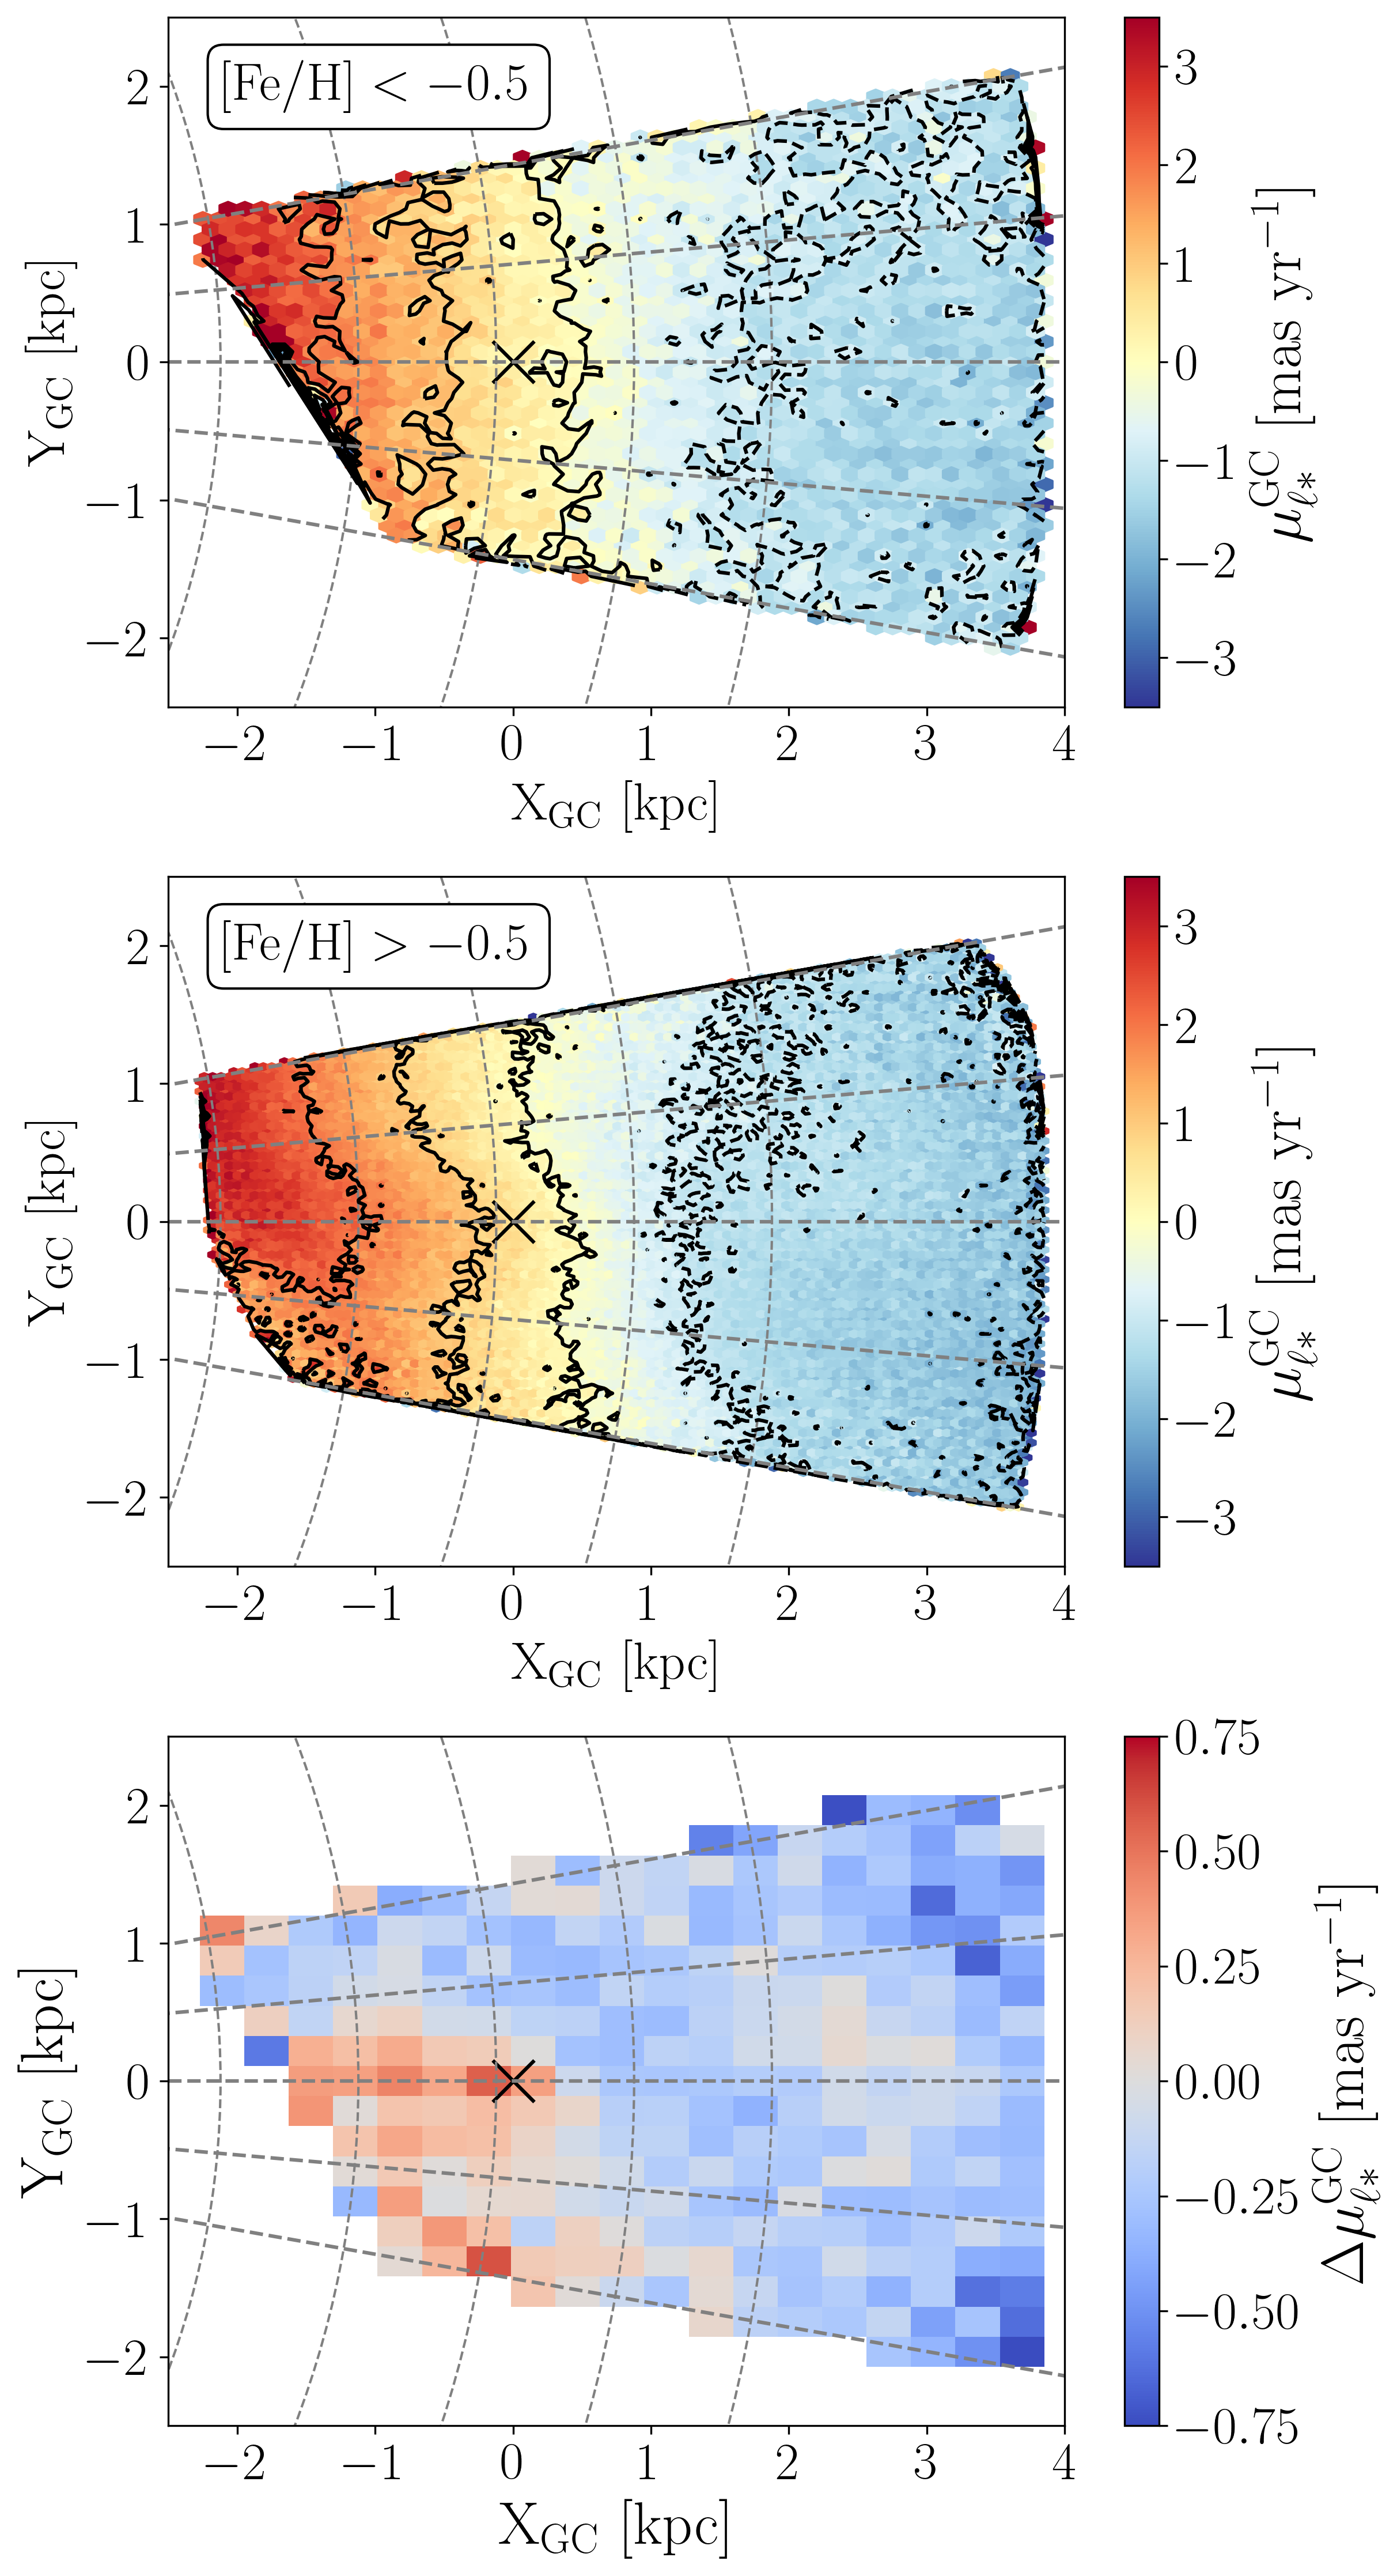
To further investigate the impact of the bar on the kinematics of stars with different metallicities, in Fig. 12 we plot the mean proper motion along longitude (corrected for the motion of the Sun) as a function of Galactocentric Cartesian coordinates for metal-poor ( dex, top panel) and metal-rich ( dex, middle panel) stars. Confirming the predictions of Gough-Kelly et al. (2022) when inspecting the kinematics of young and old stars in N-body+smoothed particle hydrodynamic simulations (see their figure 5), we find that the asymmetry in the velocity field around is clearly observed in the metal-rich sample, while metal-poor stars show an axisymmetric rotation field. The non-axisymmetric pattern observed for more metal-rich stars is a clear signature of the presence of the bar, as shown by the stronger longitudinal variation of the proper motions compared to the metal-poor stars.
To gain more insight into the kinematic differences between metal-rich and metal-poor stars, in the bottom panel of Fig. 12 we plot, in each bin of Galactocentric Cartesian coordinates, the quantity :
| (5) |
where and are, respectively, the mean value of the proper motions along Galactic longitude for metal-rich and metal-poor stars in each spatial bin. We observe a good qualitative agreement with the simulations from Gough-Kelly et al. (2022): the near positive peak in is at kpc with an extended tail towards negative values of Galactic longitude, while the negative peak around kpc extends to positive longitudes. We stress here that this is only a qualitative comparison between the observed and predicted trends, and we postpone to further work a more rigorous and careful interpretation of our data in light of realistic models of the Galactic bulge. The simple adopted definitions of metal-poor and metal-rich stars might result in overlapping age distributions, which might cause the differences in the spatial distribution between our data and the clear dipole pattern shown in Gough-Kelly et al. (2022). Finally, we note that Fig. 12 does not change significantly if we consider vertical slices in .
Following Gough-Kelly et al. (2022), we define the separation amplitude as the integral along the line of sight of the difference in mean proper motion between the metal-rich and metal-poor stars:
| (6) |
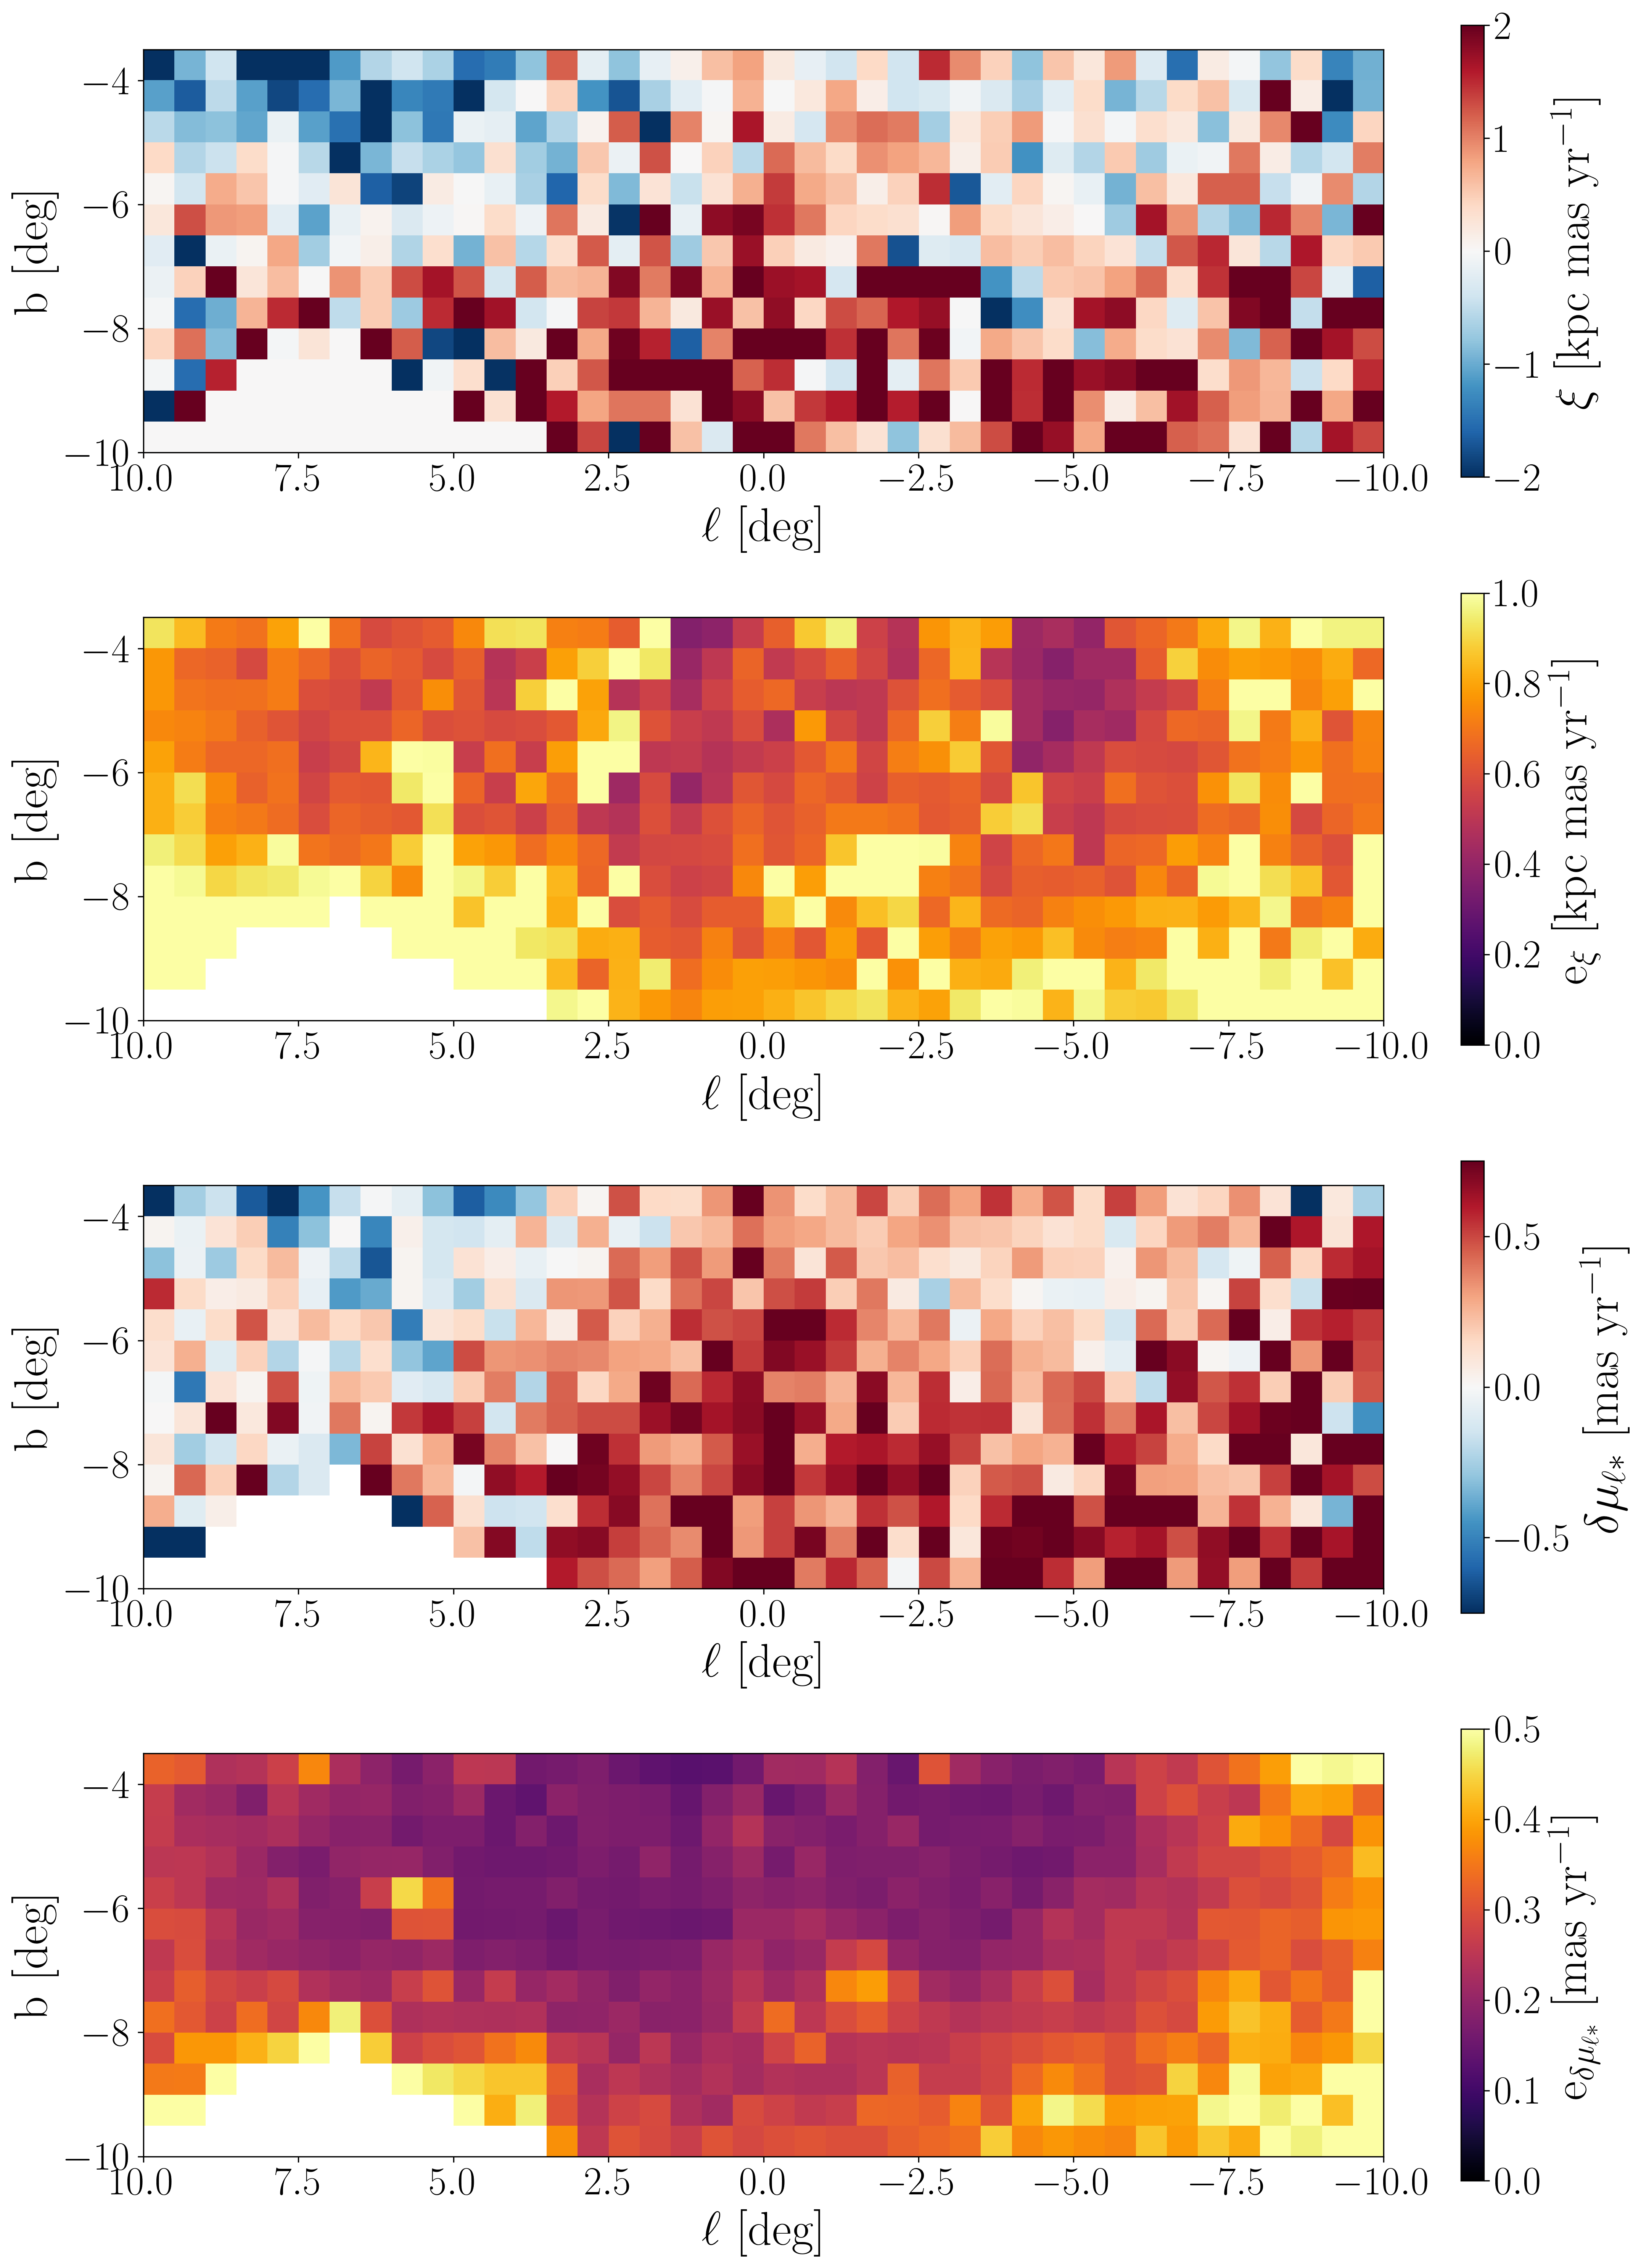
To facilitate the comparison with Gough-Kelly et al. (2022), we fix the parameters kpc, kpc, kpc, and we bin in distance using a fixed bin size of kpc. In the top panel of Fig. 13, we plot the separation amplitude as a function of Galactic coordinates, across the BDBS footprint. The observed projected pattern matches qualitatively the one inferred from simulations (see the middle panel in figure 4 of Gough-Kelly et al., 2022): the separation amplitude is negative for , and positive for the other line of sights. The variations of across the Galactic bulge are due to the difference in the intrinsic velocity distributions of the metal-poor and metal-rich populations, tracing different kinematic structures. The presence of negative values of in our data is likely to be due to the absence of metal-poor stars in the closest distance bins (see Fig. 12), due to the longitudinal dependence of the colour cuts implemented in Johnson et al. (2022) to minimize foreground contamination from the stellar disk.
We compute the error on the separation amplitude, , using equation 3 in Gough-Kelly et al. (2022). The second panel of Fig. 13 shows the separation amplitude as a function of Galactic coordinates. The values of are driven by the number of stars in each bin, and we find that the overall distribution loosely traces the underlying one for the metal-rich stars.
To quantify the effect of the kinematic fractionation in the southern Galactic bulge, we also define the metric , following Gough-Kelly et al. (2022):
| (7) |
where the mean of the proper motions is computed on a large distance bin along the line of sight, from kpc to kpc. In the third panel of Fig. 13 we plot as a function of Galactic coordinates. The large values of result from forbidden velocities in the rotation curves (negative longitudinal proper motions at , and positive values for ) and are deeply connected to the distribution of radial velocities of stars in the bar (Gough-Kelly et al., 2022). A purely axisymmetric distribution of velocities would not produce forbidden velocities, therefore their non-zero observed values are a strong signature of the presence of the bar (Gough-Kelly et al., 2022). The observed pattern in the third panel of Fig. 13 matches again qualitatively the results from Gough-Kelly et al. (2022). The uncertainty on , shown in the fourth panel of Fig. 13, follows , and it is again driven by the underlying number density of dex RC stars in our sample.
4 Discussion and Conclusions
In this work, we have combined Gaia DR3 proper motions with BDBS photometric distances and metallicities, to investigate the chemo-kinematics of a sample of 2.6 million RC stars in the southern Galactic bulge. Our main results can be summarised as follows:
-
•
We find that the angular velocity, defined as the slope of the longitudinal proper motion curve as a function of distance, is highest at km s-1 kpc-1 for stars with [Fe/H] dex (see Fig.4). Metal-poor RC stars exhibit the lowest rotation values ( km s-1 kpc-1). Surprisingly, the angular velocity is not a monotonic function of metallicity, but it decreases for RC stars with [Fe/H] dex, and it reaches km s-1 kpc-1 for [Fe/H] dex. When integrated over all metallicities, the angular velocity peaks on the minor axis closer to the plane (Fig. 5). When plotted as a function of both metallicity and sky position (Fig. 6), the angular velocity peaks at low latitudes for stars with [Fe/H] dex, with a clear asymmetry with Galactic longitude, possibly due to the orientation of the near side of the bar. Stars with lower metallicities do not exhibit a coherent angular velocity pattern on the sky.
-
•
Proper motion dispersions along Galactic longitude and latitude are maximum towards the Galactic Centre for stars with [Fe/H] dex, because of the Galactic potential well (Fig. 7 and 8, respectively). Metal-poor stars are kinematically hotter, with proper motion dispersions mas yr-1, while the mean dispersion for metal-rich stars is mas yr-1. If we plot the dispersions as a function of metallicity for different latitude bins (Fig. 9) we see that, for a given metallicity bin, RC stars are kinematically hotter closer to the plane. Also, the spread in dispersion between the stars at low latitudes and high latitudes increases with increasing metallicity.
-
•
The correlation between Galactic proper motions clearly shows a quadrupole pattern corresponding to radial alignment for stars with [Fe/H] dex (Fig. 11). The prominence of the correlation amplitude at is a consequence of the orientation of the bar.
-
•
Based on the striking difference in the sky plots, we split our sample of RC stars into metal-poor ([Fe/H] dex) and metal-rich ([Fe/H] dex) stars. We compare our results to the simulations presented in Gough-Kelly et al. (2022), which analyze the predicted proper motion trends for young and old stars in the Galactic bulge. We observe a non-axisymmetric pattern around the Galactic center in the proper motions along Galactic longitude only for the metal-rich sample, which is a clear sign of the bar. More generally, we find that the footprint of the bar is clearly present in the metal-rich sample, and totally absent in the metal-poor one.
Our results clearly demonstrate that RC stars with different metallicities have dramatically different kinematics. In particular, metal-rich stars are kinematically colder, and their orbits show a clear imprint of the Galactic bar. On the other hand, metal-poor RC stars have larger velocity dispersions, and exhibit random motions over the bulge, without showing any radial alignment towards the Galactic Centre, or clear asymmetries with Galactic longitude that could be due to the bar’s orientation. At the moment, we are not able to assess whether the more metal-poor stars trace a weaker bar, or if they constitute the so-called classical bulge, assembled over cosmic time by galaxy mergers. A more detailed comparison with cosmological simulations is needed to assess the contribution of the different formation scenarios to the observed kinematics of the stellar populations in the Galactic bulge, and we postpone this to a future dedicated study.
Our results also help us interpret age–metallicity relations in the Galactic bulge. Though others have proposed a flat age–metallicity relation in the bulge (e.g., Bensby et al. 2017), the present chemodynamical results support membership of the highest-metallicity star to the bar rather than bulge. This hypothesis is more broadly consistent with the results of Joyce et al. (2023), who found that, though a handful of the highest–metallicity, micro-lensed subdwarfs identified as belonging to the bulge region may be as young as 2 Gyr, the majority are not. These results, in combination with the kinematic–metallicity correlations presented here suggest that the most metal–rich stars belong to the bar rather than the bulge. Further, based on Figure 11, the bar orbits become visible for stars with [Fe/H] . According to Figure 4, stars in this metallicity range have ages less than 12 Gyr, with the youngest stars having ages around 8.4 Gyr. We note, however, that the bar structure itself may be younger than the stars comprising it.
The values of the angular velocity we determine for RC stars are in agreement with findings for RRL stars (Du et al., 2020), but considerably slower than what was previously found for younger bulge stars (e.g. Sanders et al., 2019; Du et al., 2020). In the upcoming years, new data releases by Gaia will provide more precise proper motions thanks to the improved observational baseline. In addition to that, a longer baseline will also improve the accuracy of the astrometric solution, especially in crowded fields, allowing a better call of proper motion systematics. The Vera C. Rubin Telescope will also monitor the Milky Way bulge, and derive proper motions down to the Main Sequence Turnoff (Gonzalez et al., 2018). In addition, large-scale multifiber spectroscopic facilities such as MOONS (Gonzalez et al., 2020b) and 4MOST (de Jong et al., 2012) will measure radial velocities for millions of giants in the bulge, allowing a full three-dimensional kinematic analysis when combined with photometric and spectroscopic metallicities.
Acknowledgements.
T.M. thanks F. Fragkoudi for interesting discussions. M.J. gratefully acknowledges funding of MATISSE: Measuring Ages Through Isochrones, Seismology, and Stellar Evolution, awarded through the European Commission’s Widening Fellowship. This project has received funding from the European Union’s Horizon 2020 research and innovation programme. Data used in this paper comes from the Blanco DECam Survey Collaboration. This project used data obtained with the Dark Energy Camera (DECam), which was constructed by the Dark Energy Survey (DES) collaboration. Funding for the DES Projects has been provided by the U.S. Department of Energy, the U.S. National Science Foundation, the Ministry of Science and Education of Spain, the Science and Technology Facilities Council of the United Kingdom, the Higher Education Funding Council for England, the National Center for Supercomputing Applications at the University of Illinois at Urbana-Champaign, the Kavli Institute of Cosmological Physics at the University of Chicago, the Center for Cosmology and Astro-Particle Physics at the Ohio State University, the Mitchell Institute for Fundamental Physics and Astronomy at Texas A&M University, Financiadora de Estudos e Projetos, Fundaçõ Carlos Chagas Filho de Amparo á Pesquisa do Estado do Rio de Janeiro, Conselho Nacional de Desenvolvimento Científico e Tecnológico and the Ministério da Ciência, Tecnologia e Inovacão, the Deutsche Forschungsgemeinschaft, and the Collaborating Institutions in the Dark Energy Survey. The Collaborating Institutions are Argonne National Laboratory, the University of California at Santa Cruz, the University of Cambridge, Centro de Investigaciones Enérgeticas, Medioambientales y Tecnológicas-Madrid, the University of Chicago, University College London, the DES-Brazil Consortium, the University of Edinburgh, the Eidgenössische Technische Hochschule (ETH) Zürich, Fermi National Accelerator Laboratory, the University of Illinois at Urbana-Champaign, the Institut de Cióncies de l’Espai (IEEC/CSIC), the Institut de Física d’Altes Energies, Lawrence Berkeley National Laboratory, the Ludwig-Maximilians Universität München and the associated Excellence Cluster Universe, the University of Michigan, the National Optical Astronomy Observatory, the University of Nottingham, the Ohio State University, the OzDES Membership Consortium the University of Pennsylvania, the University of Portsmouth, SLAC National Accelerator Laboratory, Stanford University, the University of Sussex, and Texas A&M University. Based on observations at Cerro Tololo Inter-American Observatory (2013A-0529; 2014A-0480; PI: Rich), National Optical Astronomy Observatory, which is operated by the Association of Universities for Research in Astronomy (AURA) under a cooperative agreement with the National Science Foundation. This work has made use of data from the European Space Agency (ESA) mission Gaia (https://www.cosmos.esa.int/gaia), processed by the Gaia Data Processing and Analysis Consortium (DPAC, https://www.cosmos.esa.int/web/gaia/dpac/consortium). Funding for the DPAC has been provided by national institutions, in particular the institutions participating in the Gaia Multilateral Agreement. Software used: numpy (Harris et al., 2020), matplotlib (Hunter, 2007), scipy (Virtanen et al., 2020), astropy (Astropy Collaboration et al., 2013, 2018), TOPCAT (Taylor, 2005, 2006)References
- Arentsen et al. (2020) Arentsen, A., Starkenburg, E., Martin, N. F., et al. 2020, MNRAS, 491, L11
- Astropy Collaboration et al. (2018) Astropy Collaboration, Price-Whelan, A. M., Sipőcz, B. M., et al. 2018, AJ, 156, 123
- Astropy Collaboration et al. (2013) Astropy Collaboration, Robitaille, T. P., Tollerud, E. J., et al. 2013, A&A, 558, A33
- Athanassoula et al. (2017) Athanassoula, E., Rodionov, S. A., & Prantzos, N. 2017, MNRAS, 467, L46
- Babusiaux (2016) Babusiaux, C. 2016, Publications of the Astronomical Society of Australia, 33, e026
- Babusiaux et al. (2010) Babusiaux, C., Gómez, A., Hill, V., et al. 2010, Astronomy and Astrophysics, 519, A77
- Belokurov et al. (2020) Belokurov, V., Penoyre, Z., Oh, S., et al. 2020, MNRAS, 496, 1922
- Bensby et al. (2019) Bensby, T., Bergemann, M., Rybizki, J., et al. 2019, The Messenger, 175, 35
- Bensby et al. (2017) Bensby, T., Feltzing, S., Gould, A., et al. 2017, A&A, 605, A89
- Binney et al. (1991) Binney, J., Gerhard, O. E., Stark, A. A., Bally, J., & Uchida, K. I. 1991, MNRAS, 252, 210
- Bland-Hawthorn & Gerhard (2016) Bland-Hawthorn, J. & Gerhard, O. 2016, ARA&A, 54, 529
- Calamida et al. (2014) Calamida, A., Sahu, K. C., Anderson, J., et al. 2014, ApJ, 790, 164
- Clarke et al. (2019) Clarke, J. P., Wegg, C., Gerhard, O., et al. 2019, MNRAS, 489, 3519
- Clarkson et al. (2008) Clarkson, W., Sahu, K., Anderson, J., et al. 2008, The Astrophysical Journal, 684, 1110
- Clarkson et al. (2018) Clarkson, W. I., Calamida, A., Sahu, K. C., et al. 2018, ApJ, 858, 46
- Clarkson et al. (2011) Clarkson, W. I., Sahu, K. C., Anderson, J., et al. 2011, ApJ, 735, 37
- de Jong et al. (2012) de Jong, R. S., Bellido-Tirado, O., Chiappini, C., et al. 2012, in Society of Photo-Optical Instrumentation Engineers (SPIE) Conference Series, Vol. 8446, Ground-based and Airborne Instrumentation for Astronomy IV, ed. I. S. McLean, S. K. Ramsay, & H. Takami, 84460T
- Debattista et al. (2017) Debattista, V. P., Ness, M., Gonzalez, O. A., et al. 2017, MNRAS, 469, 1587
- Dékány et al. (2013) Dékány, I., Minniti, D., Catelan, M., et al. 2013, The Astrophysical Journal, 776, L19
- Drimmel & Poggio (2018) Drimmel, R. & Poggio, E. 2018, Research Notes of the American Astronomical Society, 2, 210
- Du et al. (2020) Du, H., Mao, S., Athanassoula, E., Shen, J., & Pietrukowicz, P. 2020, MNRAS, 498, 5629
- Flaugher et al. (2015) Flaugher, B., Diehl, H. T., Honscheid, K., et al. 2015, AJ, 150, 150
- Freeman et al. (2013) Freeman, K., Ness, M., Wylie-de-Boer, E., et al. 2013, Monthly Notices of the Royal Astronomical Society, 428, 3660
- Gaia Collaboration et al. (2018) Gaia Collaboration, Brown, A. G. A., Vallenari, A., et al. 2018, A&A, 616, A1
- Gaia Collaboration et al. (2021) Gaia Collaboration, Brown, A. G. A., Vallenari, A., et al. 2021, A&A, 649, A1
- Gaia Collaboration et al. (2016) Gaia Collaboration, Prusti, T., de Bruijne, J. H. J., et al. 2016, A&A, 595, A1
- Gaia Collaboration et al. (2023) Gaia Collaboration, Vallenari, A., Brown, A. G. A., et al. 2023, A&A, 674, A1
- Gezari et al. (2022) Gezari, S., Bentz, M., De, K., et al. 2022, arXiv e-prints, arXiv:2202.12311
- Gonzalez et al. (2018) Gonzalez, O. A., Clarkson, W., Debattista, V. P., et al. 2018, arXiv e-prints, arXiv:1812.08670
- Gonzalez et al. (2020a) Gonzalez, O. A., Mucciarelli, A., Origlia, L., et al. 2020a, The Messenger, 180, 18
- Gonzalez et al. (2020b) Gonzalez, O. A., Mucciarelli, A., Origlia, L., et al. 2020b, The Messenger, 180, 18
- Gough-Kelly et al. (2022) Gough-Kelly, S., Debattista, V. P., Clarkson, W. I., et al. 2022, MNRAS, 509, 4829
- GRAVITY Collaboration et al. (2018) GRAVITY Collaboration, Abuter, R., Amorim, A., et al. 2018, A&A, 615, L15
- Harris et al. (2020) Harris, C. R., Millman, K. J., van der Walt, S. J., et al. 2020, Nature, 585, 357
- Haywood et al. (2016) Haywood, M., Di Matteo, P., Snaith, O., & Calamida, A. 2016, Astronomy and Astrophysics, 593, A82
- Hey et al. (2023) Hey, D. R., Huber, D., Shappee, B. J., et al. 2023, arXiv e-prints, arXiv:2305.19319
- Hill et al. (2011) Hill, V., Lecureur, A., Gómez, A., et al. 2011, Astronomy and Astrophysics, 534, A80
- Hunter (2007) Hunter, J. D. 2007, Computing in Science & Engineering, 9, 90
- Johnson et al. (2022) Johnson, C. I., Rich, R. M., Simion, I. T., et al. 2022, MNRAS, 515, 1469
- Johnson et al. (2020) Johnson, C. I., Rich, R. M., Young, M. D., et al. 2020, MNRAS, 499, 2357
- Joyce et al. (2023) Joyce, M., Johnson, C. I., Marchetti, T., et al. 2023, ApJ, 946, 28
- Kormendy & Kennicutt (2004) Kormendy, J. & Kennicutt, Robert C., J. 2004, Annual Review of Astronomy and Astrophysics, 42, 603
- Kuijken & Rich (2002) Kuijken, K. & Rich, R. M. 2002, AJ, 124, 2054
- Kunder et al. (2012) Kunder, A., Koch, A., Rich, R. M., et al. 2012, The Astronomical Journal, 143, 57
- Kunder et al. (2016) Kunder, A., Rich, R. M., Koch, A., et al. 2016, The Astrophysical Journal, 821, L25
- Lindegren et al. (2021a) Lindegren, L., Bastian, U., Biermann, M., et al. 2021a, A&A, 649, A4
- Lindegren et al. (2021b) Lindegren, L., Klioner, S. A., Hernández, J., et al. 2021b, A&A, 649, A2
- Majewski et al. (2017) Majewski, S. R., Schiavon, R. P., Frinchaboy, P. M., et al. 2017, The Astronomical Journal, 154, 94
- Marchetti et al. (2022) Marchetti, T., Johnson, C. I., Joyce, M., et al. 2022, A&A, 664, A124
- McWilliam & Zoccali (2010) McWilliam, A. & Zoccali, M. 2010, The Astrophysical Journal, 724, 1491
- Minniti et al. (2010) Minniti, D., Lucas, P. W., Emerson, J. P., et al. 2010, New Astronomy, 15, 433
- Nataf et al. (2010) Nataf, D. M., Udalski, A., Gould, A., Fouqué, P., & Stanek, K. Z. 2010, The Astrophysical Journal, 721, L28
- Ness et al. (2013a) Ness, M., Freeman, K., Athanassoula, E., et al. 2013a, Monthly Notices of the Royal Astronomical Society, 430, 836
- Ness et al. (2013b) Ness, M., Freeman, K., Athanassoula, E., et al. 2013b, Monthly Notices of the Royal Astronomical Society, 432, 2092
- Ness & Lang (2016) Ness, M. & Lang, D. 2016, The Astronomical Journal, 152, 14
- Ortolani et al. (1993) Ortolani, S., Bica, E., & Barbuy, B. 1993, ApJ, 408, L29
- Paterson et al. (2020) Paterson, D., Coleman, B., & Gordon, C. 2020, MNRAS, 499, 1937
- Penoyre et al. (2020) Penoyre, Z., Belokurov, V., Wyn Evans, N., Everall, A., & Koposov, S. E. 2020, MNRAS, 495, 321
- Queiroz et al. (2021) Queiroz, A. B. A., Chiappini, C., Perez-Villegas, A., et al. 2021, A&A, 656, A156
- Rattenbury et al. (2007) Rattenbury, N. J., Mao, S., Debattista, V. P., et al. 2007, MNRAS, 378, 1165
- Reid & Brunthaler (2004) Reid, M. J. & Brunthaler, A. 2004, ApJ, 616, 872
- Renzini et al. (2018) Renzini, A., Gennaro, M., Zoccali, M., et al. 2018, The Astrophysical Journal, 863, 16
- Rich (1990) Rich, R. M. 1990, ApJ, 362, 604
- Rich et al. (2020) Rich, R. M., Johnson, C. I., Young, M., et al. 2020, MNRAS, 499, 2340
- Rich et al. (2007) Rich, R. M., Reitzel, D. B., Howard, C. D., & Zhao, H. 2007, The Astrophysical Journal, 658, L29
- Rix et al. (2022) Rix, H.-W., Chandra, V., Andrae, R., et al. 2022, ApJ, 941, 45
- Rojas-Arriagada et al. (2017) Rojas-Arriagada, A., Recio-Blanco, A., de Laverny, P., et al. 2017, Astronomy and Astrophysics, 601, A140
- Rojas-Arriagada et al. (2014) Rojas-Arriagada, A., Recio-Blanco, A., Hill, V., et al. 2014, A&A, 569, A103
- Rojas-Arriagada et al. (2020) Rojas-Arriagada, A., Zasowski, G., Schultheis, M., et al. 2020, MNRAS, 499, 1037
- Saito et al. (2011) Saito, R. K., Zoccali, M., McWilliam, A., et al. 2011, The Astronomical Journal, 142, 76
- Sanders et al. (2019) Sanders, J. L., Smith, L., Evans, N. W., & Lucas, P. 2019, MNRAS, 487, 5188
- Simion et al. (2017) Simion, I. T., Belokurov, V., Irwin, M., et al. 2017, MNRAS, 471, 4323
- Simion et al. (2021) Simion, I. T., Shen, J., Koposov, S. E., et al. 2021, MNRAS, 502, 1740
- Soto et al. (2007) Soto, M., Rich, R. M., & Kuijken, K. 2007, The Astrophysical Journal, 665, L31
- Stanek et al. (1994) Stanek, K. Z., Mateo, M., Udalski, A., et al. 1994, ApJ, 429, L73
- Stanek et al. (1997) Stanek, K. Z., Udalski, A., Szymański, M., et al. 1997, The Astrophysical Journal, 477, 163
- Sumi et al. (2004) Sumi, T., Wu, X., Udalski, A., et al. 2004, MNRAS, 348, 1439
- Surot et al. (2019a) Surot, F., Valenti, E., Hidalgo, S. L., et al. 2019a, A&A, 629, A1
- Surot et al. (2019b) Surot, F., Valenti, E., Hidalgo, S. L., et al. 2019b, Astronomy and Astrophysics, 623, A168
- Taylor (2005) Taylor, M. B. 2005, in Astronomical Society of the Pacific Conference Series, Vol. 347, Astronomical Data Analysis Software and Systems XIV, ed. P. Shopbell, M. Britton, & R. Ebert, 29
- Taylor (2006) Taylor, M. B. 2006, in Astronomical Society of the Pacific Conference Series, Vol. 351, Astronomical Data Analysis Software and Systems XV, ed. C. Gabriel, C. Arviset, D. Ponz, & S. Enrique, 666
- Udalski et al. (2015) Udalski, A., Szymański, M. K., & Szymański, G. 2015, Acta Astronomica, 65, 1
- Valenti et al. (2013) Valenti, E., Zoccali, M., Renzini, A., et al. 2013, Astronomy and Astrophysics, 559, A98
- Virtanen et al. (2020) Virtanen, P., Gommers, R., Oliphant, T. E., et al. 2020, Nature Methods, 17, 261
- Wegg & Gerhard (2013) Wegg, C. & Gerhard, O. 2013, Monthly Notices of the Royal Astronomical Society, 435, 1874
- Weiland et al. (1994) Weiland, J. L., Arendt, R. G., Berriman, G. B., et al. 1994, ApJ, 425, L81
- Wylie et al. (2021) Wylie, S. M., Gerhard, O. E., Ness, M. K., et al. 2021, A&A, 653, A143
- Zhao et al. (1994) Zhao, H., Spergel, D. N., & Rich, R. M. 1994, AJ, 108, 2154
- Zoccali et al. (2014) Zoccali, M., Gonzalez, O. A., Vasquez, S., et al. 2014, Astronomy and Astrophysics, 562, A66
- Zoccali et al. (2008) Zoccali, M., Hill, V., Lecureur, A., et al. 2008, Astronomy and Astrophysics, 486, 177
- Zoccali et al. (2003) Zoccali, M., Renzini, A., Ortolani, S., et al. 2003, Astronomy and Astrophysics, 399, 931
- Zoccali et al. (2018) Zoccali, M., Valenti, E., & Gonzalez, O. A. 2018, A&A, 618, A147
- Zoccali et al. (2017) Zoccali, M., Vasquez, S., Gonzalez, O. A., et al. 2017, A&A, 599, A12