ZzzGPT: An Interactive GPT Approach to Enhance Sleep Quality
Abstract.
In today’s world, sleep quality is pivotal for overall well-being. While wearable sensors offer real-time monitoring, they often lack actionable insights, leading to user abandonment. This paper delves into the role of technology in understanding sleep patterns. We introduce a two-stage framework, utilizing Large Language Models (LLMs), aiming to provide accurate sleep predictions with actionable feedback. Leveraging the GLOBEM dataset and synthetic data from LLMs, we highlight enhanced results with models like XGBoost. Our approach merges advanced machine learning with user-centric design, blending scientific accuracy with practicality.
1. Introduction
In the modern age, the adage ”health is wealth” becomes increasingly apparent, not just in terms of physical but also mental. One critical but often overlooked aspect of overall health is the quality of sleep. Although sleep is seemingly physical, it could have far-reaching implications for mental health, productivity, and overall quality of life. Technologies such as wearable sensors have paved the way for real-time monitoring of sleep patterns, promising insights into this complicated and crucial behaviour.
However, while wearable sensors have provided a technological leap in self-quantification and health monitoring, they are not without their challenges. Research has shown that people often abandon these devices due to unsatisfactory results or a lack of actionable insights. However, these sensors have the potential for lifestyle and health improvement, as poor sleep is not just an isolated issue but often a symptom or cause of other health problems, such as depression. Therefore, we studied essential factors that impacted sleep quality and developed a graph-based interface and Large Language Models that guide users to gain valuable insights into their behaviour and detect ways of lifestyle improvement.
2. MOTIVATION
The intricate relationship between sleep and health attributes, such as mental health or physical activity, has garnered significant attention in scientific literature. These studies have delved into correlation analysis of such attributes and ushered in advanced medical research. Notably, they have provided insights into illness detection, ranging from depression and diabetes to Parkinson’s disease.
Another study (Chen et al., 2020) incorporated data from smartphones, Fitbit devices, weather conditions, and personal calendars to predict sleep duration. In this context, smartphone data gives information on proximity to other phone users, screen time, communication history, and geo-location. Fitbit data provided metrics like heart rate, physical activity, and sleep status. By leveraging the General Linear Model (GLM) and the General Linear Mixed Model (GLMM), they fine-tuned their input factors by eliminating multicollinearity and considering feature importance. Their findings underscored the high correlation between most studied factors and sleep duration, reporting a correlation coefficient of 0.745 between actual and estimated sleep duration. Although their primary focus was correlational analysis, the parallels between their chosen input features and ours set the groundwork for our research.
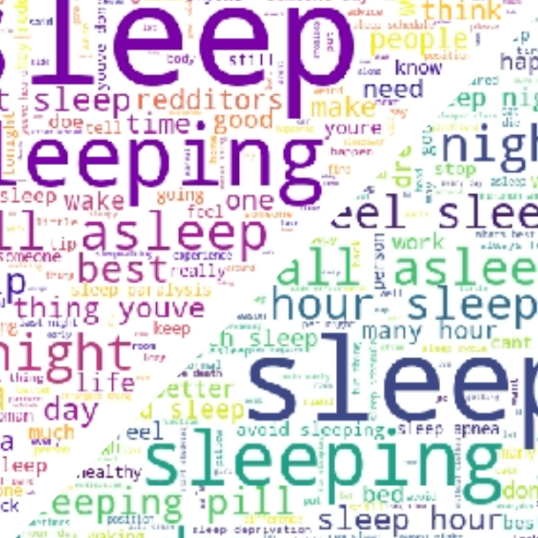
Building on the wearable devices narrative, Attig and Franke (2020) found that many individuals abandoned these gadgets due to unsatisfactory results. To better understand this phenomenon, we analyzed sleep-related questions on popular online platforms like Reddit (Fionn Delahunty, 2018) and Quora (DataCanary, hilfialkaff, Lili Jiang, Meg Risdal, Nikhil Dandekar, tomtung, 2017) (See Fig. 1). Common queries, such as ”How do I fix/change/maintain a sleep pattern?” and ”I need help to get me to sleep; I start University soon and can’t maintain a steady sleep pattern!” revealed a challenge. Such abstract questions suggest that users might lack a clear understanding of sleep, making it challenging to seek precise solutions. This knowledge gap could demotivate users from using wearable devices for sleep tracking.
Drawing from these studies, an evident gap emerges. While the correlation and prediction of sleep patterns have been substantially explored, there is a pressing need for an integrated solution that not only predicts but also offers actionable insights. Enter Large Language Models (LLMs). The advent of LLMs, especially models like GPT-3, has reshaped the landscape of natural language processing. These models enable intelligent interactions between humans and technology, ushering in possibilities for improved user experience and potential behavioral modifications. By addressing the limitations of wearables with the capacity for personalized communication, LLMs have the potential to re-engage users. Our research seeks to harness the capabilities of LLMs, aiming to revolutionize sleep monitoring by combining accurate predictions with actionable behavioral improvements.
3. Proposed framework
3.1. Overview
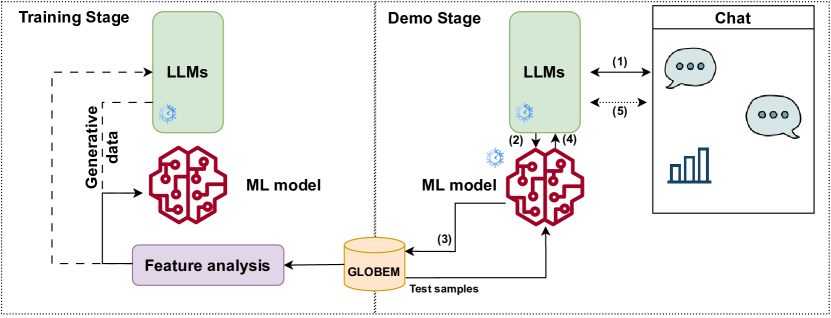
The primary focus of this project is to present a holistic, interactive model to help users better understand their sleep. We propose a detailed two-stage framework (Fig. 2). This framework consists of a Training Stage and a Demo Stage, which functions collaboratively to build a predictive model and an interactive user interface.
3.1.1. Training Stage
We used data and features from the GLOBEM dataset (Xu et al., 2022), which contains diverse user behavioural information, including location, phone usage, call logs, step count, Bluetooth, and Wi-Fi connection. We undertook statistical analysis to identify variables that strongly correlate with sleep quality and further filter features using feature importance ranking.
Subsequently, we ventured beyond conventional feature analysis. A hypothesis was proposed: Could synthetic data generated from state-of-the-art Large Language Models (LLMs) enhance the model’s predictive power? These LLMs are adept at replicating the natural variance of human behaviour and environmental interactions. Therefore, by introducing this method, we aimed to test whether such augmentation would bolster the model’s performance or inadvertently introduce noise and complexities.
3.1.2. Demo Stage
The second stage is designed to offer an interactive experience for end-users via a chat application111https://github.com/MarwahAlaofi/UbiComp23-student-challenge/. This stage is divided into five distinct parts, as elaborated below:
-
•
User Interaction via LLMs: The Demo Stage has been designed to simulate a real-world application of the trained model. A chat application, fortified by a Large Language Model (LLM) API, serves as the front-end interface. Users will see a range of suggested questions when they interact with the chatbot, including queries about their anticipated sleep quality for the night.
-
•
Sleep Quality Prediction: When a user opts to investigate their sleep quality, the system swiftly deploys the predictive model honed during the Training Stage. This model considers the top 20 important features ranked during analysis to generate a prediction.
-
•
Testing Sample Acquisition: To enact this demonstration, we assume the passive acquisition of relevant user data through the chatbot installed on their devices. A representative testing sample will be culled from the GLOBEM dataset, which comprises the features earmarked as important during the Training Stage.
-
•
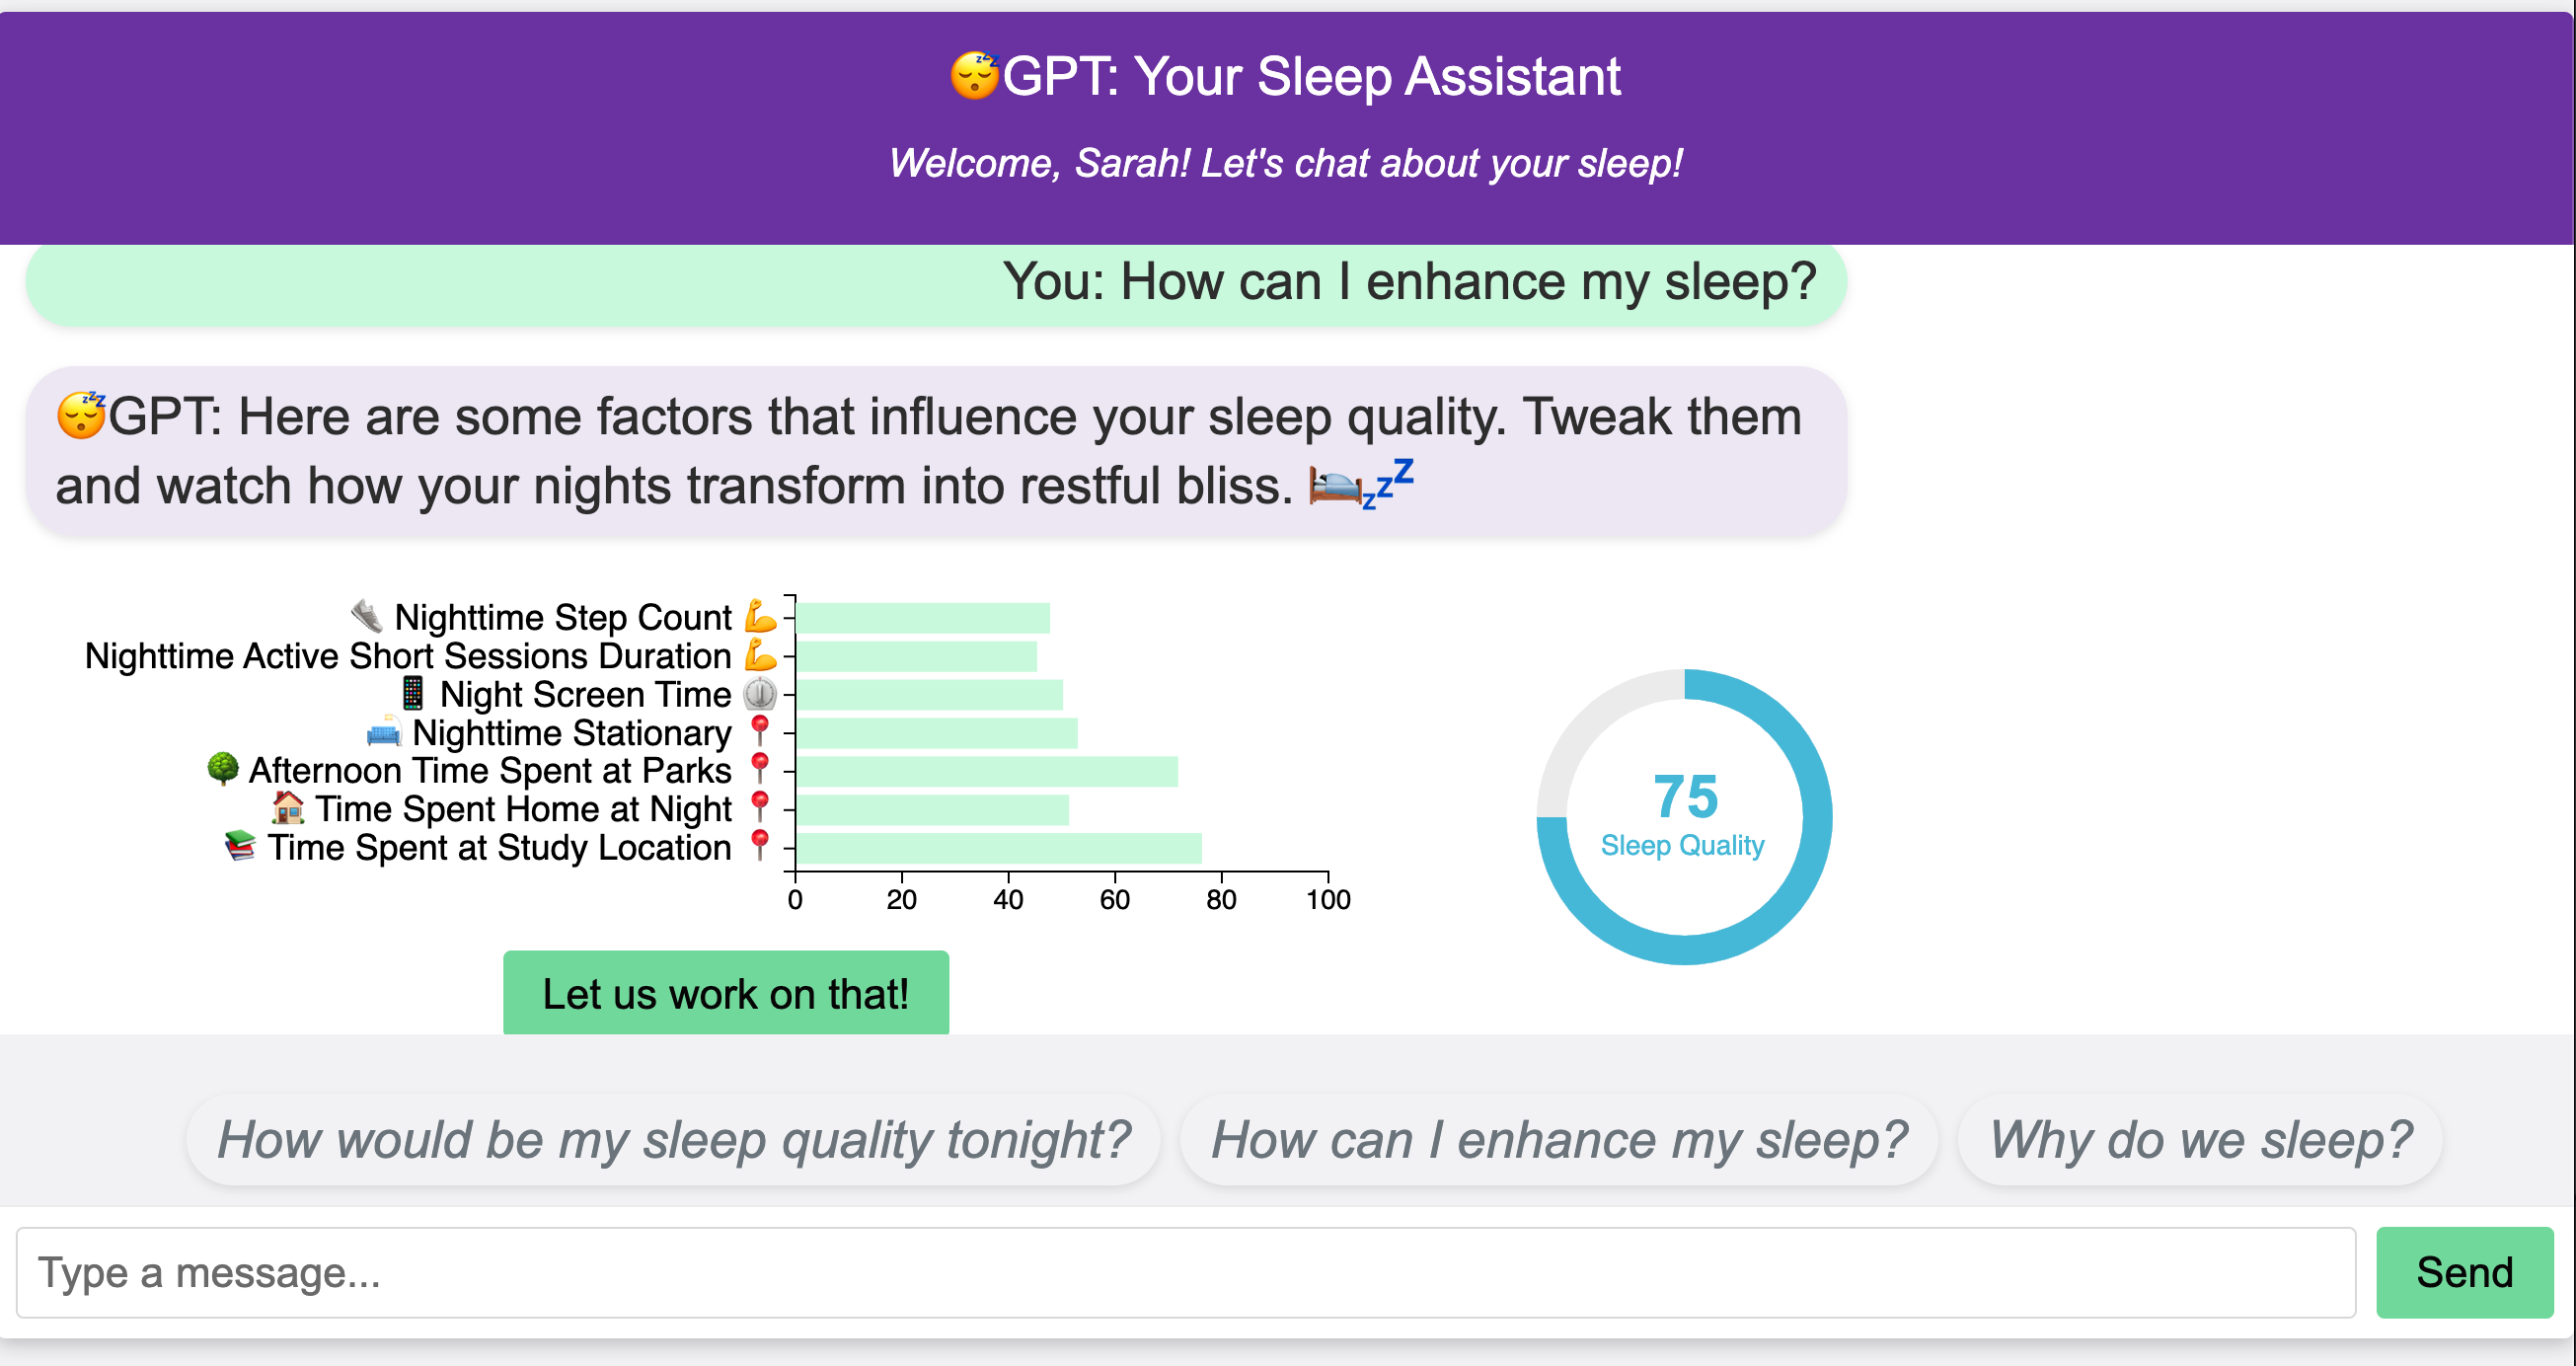
Predictive Responses and Interactive Graph: The system offers an interactive element beyond text-only. The LLM API generates textual advice or comments based on the predicted sleep quality. Furthermore, an interactive graphical interface allows users to modify key features to see their real-time impact on predicted sleep quality. (Fig. 3)
-
•
Personalized Recommendations: Finally, the application auto-generates pragmatic suggestions tailored to the user’s lifestyle and environment. By setting thresholds and manipulating feature values, the system explores how minor adjustments can lead to significant improvements in sleep quality
3.2. Dataset
The GLOBEM dataset (Xu et al., 2022) offers a multi-year mobile and wearable sensing data collection from 2018 to 2021. Over these four years, the dataset captures information from various cohorts: INS-W_1 (2018), INS-W_2 (2019), INS-W_3 (2020), and INS-W_4 (2021). This project exclusively uses the INS-W_1 set, which offers a glimpse into user behavior before the disruption of the COVID-19 pandemic.
The core objective of the dataset is to serve as a foundational platform for comparing behavior modeling algorithms, examining cross-dataset generalization tasks, and fostering the development of more comprehensive longitudinal behavior modelling algorithms by ML and UbiComp researchers.
The data was collected via a self-developed mobile app with the AWARE framework, which continuously gathers data such as location, screen status, Bluetooth scans, and call logs. The app is compatible with iOS and Android and seamlessly works in the background once installed on participants’ phones. Additionally, participants were equipped with Fitbits to record their physical activity and sleep patterns. This combination ensured a passive 24/7 data collection, with an average participation duration of 78 days per individual each year. Surveys regarding physical and mental health, social issues, and substance use were also administered during the study period.
3.3. Data Prepossessing
The dataset offers hundreds of features. To reduce feature dimensions, we conduct a comprehensive, selective framework to develop our predictive machine learning model. The task is to predict the ‘sleep efficiency’ on a coming day; hence, we select the ‘sleep summary average efficiency’ calculated by the Fitbit wearable as our target variable. The historical value for sleep efficiency is derived to derive meaningful insights by shifting the target variable by one row and eliminating the first index for every participant (pid). This is essential since the initial index for each participant lacks the preceding day’s data. Rows containing missing values for the target variable were excluded.
Pertinent features from Bluetooth, call, location, screen, and steps were incorporated to enrich our dataset. These features were meticulously chosen based on their relevance and prominence in current literature related to sleep patterns. Recognizing the potential of these features to provide a comprehensive insight into sleep quality, we conducted an exhaustive review of existing studies. The subsequent list details these features, supported by pertinent literature to bolster their credibility and relevance:
-
•
surrounding Bluetooth devices: the proximity and number of surrounding Bluetooth devices can offer insights into an individual’s social interactions and ambient environment, both of which have been linked to sleep quality (Xu et al., 2012).
- •
-
•
location: an individual’s location, particularly visits to green spaces, might suggest relaxation activities beneficial for sleep. Conversely, nighttime urban activity might disrupt sleep. Green spaces are linked with relaxation and potentially improved sleep quality (Feng et al., 2020; Yang et al., 2020).
- •
- •
Understanding the rationale behind the selection of these features, grounded in prior research, reinforces the robustness of our approach and provides a credible foundation for our sleep prediction endeavors. It also avoids overfitting issues by including a selective set of features.
Following this, we merged these datasets with the sleep dataset. Since the dataset spans 6177 rows, ensuring that each feature presents substantial information is imperative. As such, 49 columns inundated with ‘n/a’ values, specifically those with more than 30% (about 1853) such entries, were removed. We also removed the rows based on the outliers of some key features, such as screen time, sleep duration, and step count. We used the Tukey method to remove the outliers based on lower and upper fences. To deal with the missing values of each feature, we filled it with the mean values of each participant. Furthermore, columns with weak correlations () with the target variable were pruned.
3.4. Data Generation
In our next stage, we employed the predictive capabilities of Large Language Models (LLMs). Our primary goal was to emulate the intricate patterns seen in the actual participant data. Starting with sample selection, a subset comprising 20 samples, equivalent to roughly three weeks of data, was meticulously chosen for each participant. This duration was perceived as adequate for encapsulating the significant behavioral tendencies of an individual.
These chosen samples were methodically transformed into a table-format prompt to guide the LLM’s data generation task. This structured presentation offers clarity and ensures the LLM can seamlessly pick up on the dataset’s inherent temporal patterns and subtle nuances. With these prompts at the ready, our next course of action involved the OpenAI API, harnessing the power of LLMs to extrapolate from the given data. For each structured prompt based on one participant’s data, the model was asked to generate new data for five additional days, taking cues from the preceding week’s patterns. However, not all generated data met our rigorous standards. In situations where the generated data did not encompass all requisite features, we manually pruned such data to maintain the dataset’s integrity and coherence.
Once generated, this new set of data was integrated with the original training set. This augmented compilation provides a larger volume of data and potentially encompasses a more diverse set of behavioral variations. After the augmentation process, we conducted a rigorous evaluation to gauge the impact of the LLM-generated data on model performance, keenly observing if it played a role in enhancing the training outcomes. This endeavor aimed to shed light on the potential merits of using LLMs for data augmentation in behavioral predictive modeling.
4. Experiment and Result
4.1. Experiment Setting
For our experimental design, we partitioned the data into distinct sets: was allocated for training, for validation, and (last 14 days) for testing. Given the nature of our research objective, we approached this task as a regression problem. We evaluated various regression models, including Random Forest (RF) (Biau, 2012), CatBoost (CatB) (Prokhorenkova et al., 2018), and Gradient Boosting (XGB) (Chen and Guestrin, 2016). The target variable is not normally distributed (). Thus, we use Mean as the baseline; it is expected that the mean baseline achieves a comparable accuracy.
Two feature selection approaches were compared: manually curated features and the top- features. As our project aims to provide sleep insights, we carefully select features by considering whether the users can understand and adjust to improve their sleep. Then, the top- is chosen by comparing the influence on the performance with different and the best-perform model. Lastly, the top 20 features (from CatB) perform the best. We have also tried the permutation feature importance and attention-based feature importance from a Long short-term memory (LSTM) model (Sathyanarayana et al., 2016); however, the results are not better than the ML model-based approach. The inclusion of LLM-generated data in the training set was also investigated for its potential performance boost.
The evaluation metrics reported are Root Mean Square Error (RMSE), Mean Absolute Error (MAE), and score. These metrics collectively offer a comprehensive view of model accuracy, error magnitude, and the proportion of the variance for the dependent variable explained by independent variables.
4.2. Result & Discussion
| Features (N) | Hand-picked(66) | Top-k(20) | Top-k(20)+G | ||||||
|---|---|---|---|---|---|---|---|---|---|
| Model/Metric | RMSE | MAE | R2 | RMSE | MAE | R2 | RMSE | MAE | R2 |
| Mean Baseline | |||||||||
| Random Forest | |||||||||
| XGBoost | |||||||||
| Catboost | |||||||||
4.2.1. Performance of Different Features
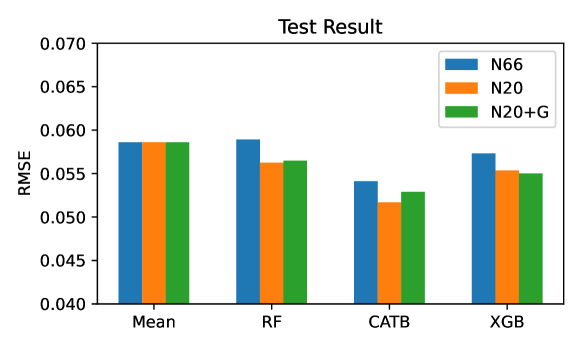
Overall, the CatB model achieves the best performance across all rounds. With the 66 hand-picked features, all the models achieved similar RMSE and higher than the baseline. We then select the top 20 features computed by the CatB model. With the top-20 features, all models have much lower RMSE, MAE, and higher . CatB is still the best model.
4.2.2. Performance of Specific Models
After integrating the generative data, particularly in the experiment with top- features, an intriguing pattern emerged in the performance metrics. XGB markedly improved, while CatB and RF exhibited slight performance degradation. This divergence necessitates a deeper examination into the inherent qualities of these models.
XGBoost, known for its paralleled gradient boosting mechanism, inherently benefits from larger datasets. The added generative data, which emulates diverse patterns from the original set, likely complemented XGB’s capability to train numerous models on diverse subsets and then amalgamate their performances. Furthermore, the regularization aspects intrinsic to XGB aid in generalizing the model, making it adept at handling the nuances the generative data introduces.
On the contrary, CatB is renowned for its symmetric tree building and ordered boosting. Although efficient and a guard against overfitting, the symmetric trees might not be as flexible as the more dynamic trees that XGB creates. While CatB’s ordered boosting often prevents target leakage and overfitting, it’s possible that the subtle intricacies of the generated data, which are designed to capture complex behavioral patterns, may not align perfectly with CatB’s strict ordering and thus lead to a slight performance dip.
Random Forest, an ensemble of decision trees, prioritizes diversity in its trees. While the generative data introduces diversity, it may also introduce noise or intricacies that Random Forest doesn’t capture as adeptly as gradient-boosted models like XGB.
In summary, while CatB displayed the best overall performance, the results hint at the potential of our framework to be particularly synergistic with specific models, like XGB, significantly when leveraging generative data. This underscores the significance of understanding model intricacies when augmenting datasets, highlighting the potential for future research in bespoke data augmentation tailored to specific model architectures.
5. Conclusion
To promote the usage of wearable devices by leveraging explainability and interactability, this project proposes a novel two-stage framework. The framework merges Machine Learning and Large Language Models with an engaging user interface. It includes rigorous data analysis and instant user feedback, producing promising results and practical accessibility. This framework pioneers a fresh approach to sleep research and personalized healthcare domains. We believe our exploration shed light on the impact of integrating synthetic data and offered valuable insights into its implications for predictive modelling in sleep quality.
ACKNOWLEDGMENTS
This research is partially supported by the Sponsor Australian Research Council Centre of Excellence for Automated Decision Making and Society https://www.arc.gov.au/ (Grant #CE200100005).
References
- (1)
- Attig and Franke (2020) Christiane Attig and Thomas Franke. 2020. Abandonment of personal quantification: A review and empirical study investigating reasons for wearable activity tracking attrition. Computers in Human Behavior 102 (2020), 223–237.
- Biau (2012) Gérard Biau. 2012. Analysis of a random forests model. The Journal of Machine Learning Research 13 (2012), 1063–1095.
- Bisson et al. (2019) Alycia N Sullivan Bisson, Stephanie A Robinson, and Margie E Lachman. 2019. Walk to a better night of sleep: testing the relationship between physical activity and sleep. Sleep health 5, 5 (2019), 487–494.
- Chen et al. (2020) Chih-You Chen, Sudip Vhaduri, and Christian Poellabauer. 2020. Estimating sleep duration from temporal factors, daily activities, and smartphone use. In 2020 IEEE 44th Annual Computers, Software, and Applications Conference (COMPSAC). IEEE, 545–554.
- Chen and Guestrin (2016) Tianqi Chen and Carlos Guestrin. 2016. Xgboost: A scalable tree boosting system. In Proceedings of the 22nd acm sigkdd international conference on knowledge discovery and data mining. 785–794.
- Christensen et al. (2016) Matthew A Christensen, Laura Bettencourt, Leanne Kaye, Sai T Moturu, Kaylin T Nguyen, Jeffrey E Olgin, Mark J Pletcher, and Gregory M Marcus. 2016. Direct measurements of smartphone screen-time: relationships with demographics and sleep. PloS one 11, 11 (2016), e0165331.
- DataCanary, hilfialkaff, Lili Jiang, Meg Risdal, Nikhil Dandekar, tomtung (2017) DataCanary, hilfialkaff, Lili Jiang, Meg Risdal, Nikhil Dandekar, tomtung. 2017. Quora Question Pairs. https://kaggle.com/competitions/quora-question-pairs
- Feng et al. (2020) Xiaoqi Feng, Claudia Flexeder, Iana Markevych, Marie Standl, Joachim Heinrich, Tamara Schikowski, Sibylle Koletzko, Gunda Herberth, Carl-Peter Bauer, Andrea von Berg, et al. 2020. Impact of residential green space on sleep quality and sufficiency in children and adolescents residing in Australia and Germany. International journal of environmental research and public health 17, 13 (2020), 4894.
- Fionn Delahunty (2018) Fionn Delahunty. 2018. Reddit QA Corpus. https://github.com/FionnD/Reddit-QA-Corpus. Online; accessed XXX.
- Prokhorenkova et al. (2018) Liudmila Prokhorenkova, Gleb Gusev, Aleksandr Vorobev, Anna Veronika Dorogush, and Andrey Gulin. 2018. CatBoost: unbiased boosting with categorical features. Advances in neural information processing systems 31 (2018).
- Sathyanarayana et al. (2016) Aarti Sathyanarayana, Shafiq Joty, Luis Fernandez-Luque, Ferda Ofli, Jaideep Srivastava, Ahmed Elmagarmid, Teresa Arora, Shahrad Taheri, et al. 2016. Sleep quality prediction from wearable data using deep learning. JMIR mHealth and uHealth 4, 4 (2016), e6562.
- Shin et al. (2017) Jong Cheol Shin, Julia Kim, and Diana Grigsby-Toussaint. 2017. Mobile phone interventions for sleep disorders and sleep quality: systematic review. JMIR mHealth and uHealth 5, 9 (2017), e7244.
- Stepnowsky et al. (2011) Carl J Stepnowsky, Joe J Palau, Tania Zamora, Sonia Ancoli-Israel, and Jose S Loredo. 2011. Fatigue in sleep apnea: The role of depressive symptoms and self-reported sleep quality. Sleep medicine 12, 9 (2011), 832–837.
- Tettamanti et al. (2020) Giorgio Tettamanti, Anssi Auvinen, Torbjörn Åkerstedt, Katja Kojo, Anders Ahlbom, Sirpa Heinävaara, Paul Elliott, Joachim Schüz, Isabelle Deltour, Hans Kromhout, et al. 2020. Long-term effect of mobile phone use on sleep quality: Results from the cohort study of mobile phone use and health (COSMOS). Environment international 140 (2020), 105687.
- Wu et al. (2015) Xiaoyan Wu, Shuman Tao, Yukun Zhang, Shichen Zhang, and Fangbiao Tao. 2015. Low physical activity and high screen time can increase the risks of mental health problems and poor sleep quality among Chinese college students. PloS one 10, 3 (2015), e0119607.
- Xu et al. (2012) Bin Xu, Yuanchao Ma, Guodong Sun, Yu Zhao, et al. 2012. Will you have a good sleep tonight? sleep quality prediction with mobile phone. In 7th International Conference on Body Area Networks.
- Xu et al. (2022) Xuhai Xu, Han Zhang, Yasaman Sefidgar, Yiyi Ren, Xin Liu, Woosuk Seo, Jennifer Brown, Kevin Kuehn, Mike Merrill, Paula Nurius, et al. 2022. GLOBEM Dataset: Multi-Year Datasets for Longitudinal Human Behavior Modeling Generalization. Advances in Neural Information Processing Systems 35 (2022), 24655–24692.
- Yang et al. (2020) Lin Yang, Janice YS Ho, Frances KY Wong, Katherine KP Chang, Ka Long Chan, Man Sing Wong, Hung Chak Ho, John WM Yuen, Jianxiang Huang, and Judy YM Siu. 2020. Neighbourhood green space, perceived stress and sleep quality in an urban population. Urban Forestry & Urban Greening 54 (2020), 126763.
Ethics Statement
We’re exploring the realms of sleep health by integrating Machine Learning and Large Language Models, utilizing data from the GLOBEM dataset. This technology unfolds a panorama where users and researchers can peek into the intricate world of sleep patterns, enabling them to draw profound insights and correlate sleep with various lifestyle aspects. The ultimate goal is to foster better-informed decisions about sleep health and overall wellness. Nonetheless, our journey through technology isn’t without hurdles. Ensuring the advice and insights offered by our system remain accurate and dependable is pivotal to upholding our initiative’s integrity and genuinely supporting health-related decision-making.
Addressing the aforementioned challenges is critical, and to do so, we stand firmly on two pillars: Ensuring Data Security and Maintaining Model Accuracy. Implementing and routinely auditing strong data security measures guard against potential data manipulation and upholding the reliability of our insights. Rather than implementing a live checking system, our approach involves employing more accurate predictive models when they become available, ensuring our technology remains state-of-the-art and offers the most reliable and accurate insights possible. Thus, we propel our initiative forward, prioritizing a solid, ethical foundation in all our technological and research endeavours. 0