Thermal Hall conductivity of electron-doped cuprates: Electrons and phonons
Abstract
It has recently become clear that phonons generate a sizable thermal Hall effect in cuprates, whether they are undoped, electron-doped or hole-doped (inside the pseudogap phase). At higher doping, where cuprates are reasonably good metals, mobile electrons also generate a thermal Hall effect, the thermal equivalent of the standard electrical Hall effect. Here we show that in the cleanest crystals of the electron-doped cuprate Nd2-xCexCuO4, at high doping, the phonon and electron contributions to the thermal Hall conductivity are of comparable magnitude, but of opposite sign. In samples of lower quality, phonons dominate , resulting in a negative at all temperatures. The fact that the negative phononic in the metallic state is similar in magnitude and temperature dependence to that found in the insulating state at lower doping rules out any mechanism based on skew scattering of phonons off charged impurities, since a local charge should be screened in the metallic regime. The phononic is found to persist over the entire doping range where antiferromagnetic correlations are known to be significant, suggesting that such correlations may play a role in generating the phonon thermal Hall effect in electron-doped cuprates. If the same mechanism is also at play in hole-doped cuprates, the presence of a phononic below (and only below) the critical doping would be evidence that spin correlations are a property of the pseudogap phase.
pacs:
Valid PACS appear hereI INTRODUCTION
The discovery of a large negative thermal Hall conductivity in hole-doped cuprates [1], persisting down to zero doping (), in the Mott insulating phase [2], revealed a new and fascinating facet of cuprate high- superconductors. This negative , now attributed to phonons [2; 3], is a new experimental signature of the enigmatic pseudogap phase of cuprates, as it disappears above the critical doping that marks the end of that phase. However, the microscopic mechanism that makes phonons in cuprates acquire a handedness in a magnetic field remains unknown. A number of theoretical proposals have recently been made, including a coupling of phonons to magnons [4] or spinons [5; 6], to collective fluctuations [7], and to a state of loop-current order with the appropriate symmetries [8], or the scattering of phonons by impurities or defects [9; 10; 11; 12]. It is still unclear which of these mechanisms, if any, is appropriate for cuprates.
A recent study of electron-doped cuprates [13] showed that the negative thermal Hall conductivity in cuprates is also present on the other side of the phase diagram. As a function of doping, the negative signal is observed from the insulating antiferromagnetic phase at all the way up to , in the metallic phase above optimal doping. And here also, this negative was shown to be carried by phonons.
Now, in the metallic phase, electrons are also expected to generate a thermal Hall signal, due to the Lorentz force. In this study, we show that in our cleanest crystals of the electron-doped cuprate Nd2-xCexCuO4 (NCCO), electrons and phonons make comparable contributions to the thermal Hall conductivity in the metallic state at high doping, but with opposite sign. The electronic contribution is large and positive, as expected from the Wiedemann-Franz law and the known electrical Hall conductivity . The negative phononic contribution is similar in magnitude and temperature dependence to that found at lower doping, including [13]. This shows that the phonon thermal Hall conductivity of cuprates is independent of whether the host material is an insulator or a metal. This rules out any mechanism based on the skew scattering of phonons off charged impurities, such as oxygen vacancies, as these local charges should be screened very effectively by mobile electrons in a highly conductive metallic state.
To further characterize our samples, we have looked for quantum oscillations. The presence of a low frequency in our cleanest sample with shows that the Fermi surface is reconstructed, clear evidence for the presence of significant antiferromagnetic correlations. We speculate that these correlations may play a role in generating the phonon thermal Hall signal in electron-doped cuprates, and possibly also in the pseudogap phase of hole-doped cuprates.
II METHODS
II.1 Samples
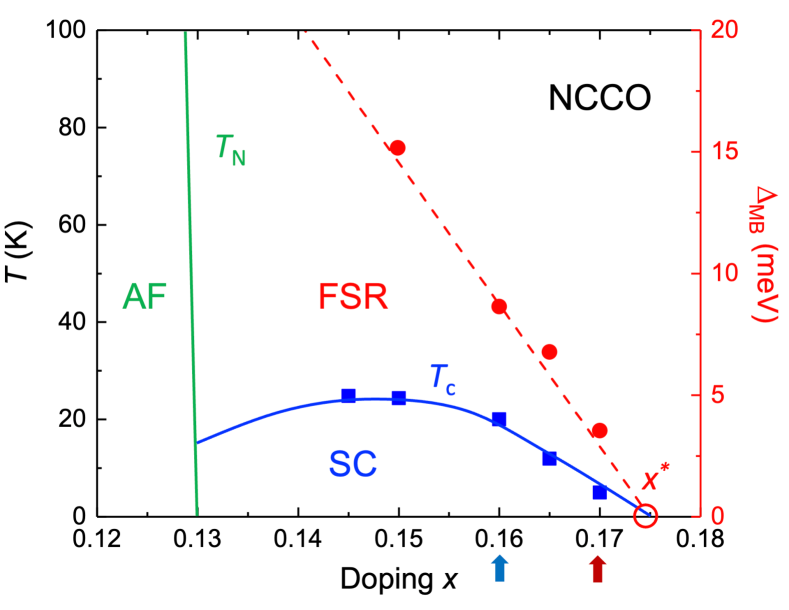
Single crystals of Nd2-xCexCuO4 with nominal concentrations and 0.17 were grown by the traveling-solvent floating-zone method in O2 and annealed in flowing argon for 48 hours at 900∘C. Both samples have a doping such that they lie in the superconducting / metallic regime of the phase diagram (Fig. 1). The superconducting transition temperature in zero field, defined by the onset of the drop in magnetization, is K and 20.0 K for = 0.16 and 0.17, respectively. For the transport measurements, crystals were cut into rectangular platelets with dimensions (length between contacts width thickness, in m) (, sample 1), (, sample 2) and (). Contacts were made using silver epoxy, diffused at 500 under oxygen for 1 . The magnetic field was applied perpendicular to the CuO2 planes. A field of T is large enough to suppress superconductivity down to in both samples [15]. From the same mother crystals, another pair of NCCO samples were prepared, with and , for the tunnel diode oscillator (TDO) measurements. The dimensions of these samples (in m) are () and ().
Note that it is difficult to achieve good enough electrical contacts on NCCO crystals to achieve a measurement of the in-plane electrical resistivity that is free of -axis current contamination in this highly 2D material. For this reason, we have turned to measurements of the thermal conductivity down to very low temperature to access the residual resistivity of our samples. Heat transport does not suffer from -axis contamination.
II.2 Thermal transport measurements
The thermal conductivity is measured by applying a heat current along the axis of the sample (longest direction), which generates a longitudinal temperature difference . The thermal conductivity is given by
| (1) |
where is the sample width, its thickness and the distance between and . When a magnetic field is applied perpendicular to the heat current () (i.e. parallel to ), a transverse temperature difference can develop along the axis. The thermal Hall conductivity is then given by
| (2) |
after antisymmetrization, i.e. . Since NCCO is a tetragonal system, we can take . The error bar on and is roughly for each, coming mostly from the uncertainty on sample dimensions and geometric factors.
We use a steady-state method to measure both thermal conductivity and thermal Hall conductivity . The data are taken while changing temperature in discrete steps at a fixed magnetic field. The thermal gradient along the sample is provided by a resistive heater connected to one end of the sample. The other end of the sample is glued to a copper block with silver paint which acts as a heat sink. Below 3 K, the longitudinal temperature difference is measured in a dilution refrigerator down to 50 mK, using two RuO2 thermometers calibrated in situ as a function of temperature and magnetic field. The transverse temperature difference is measured using two RuO2 thermometers connected to opposite sides of the sample. Above 3 K, and are measured in a standard variable temperature insert (VTI) system up to 100 K, using type-E thermocouples, known to have a weak magnetic field dependence. More details of the technique can be found in refs. 2; 16; 3.
II.3 TDO measurements
Quantum oscillations were detected using a tunnel diode oscillator method (TDO) in a magnetic field up to 85 T down to 1.8 K. The sample is placed on a compensated spiral coil of a self-resonating LC circuit operating around 20 MHz. The circuit is driven by a tunnel diode polarized in its negative resistance region of the current-voltage characteristic. The driving system (tunnel diode + capacitor) is separated from the TDO coil by a 1.25-meter-long coaxial cable and the magnetic field was applied perpendicular to the CuO2 planes.
In a TDO measurement, variations in the electrical resistance of the sample change the coil inductance through skin depth [17] resulting in a shift in the TDO resonance frequency. By measuring this shift, one can detect Shubnikov-de Haas (SdH) oscillations.
III RESULTS
III.1 Thermal transport
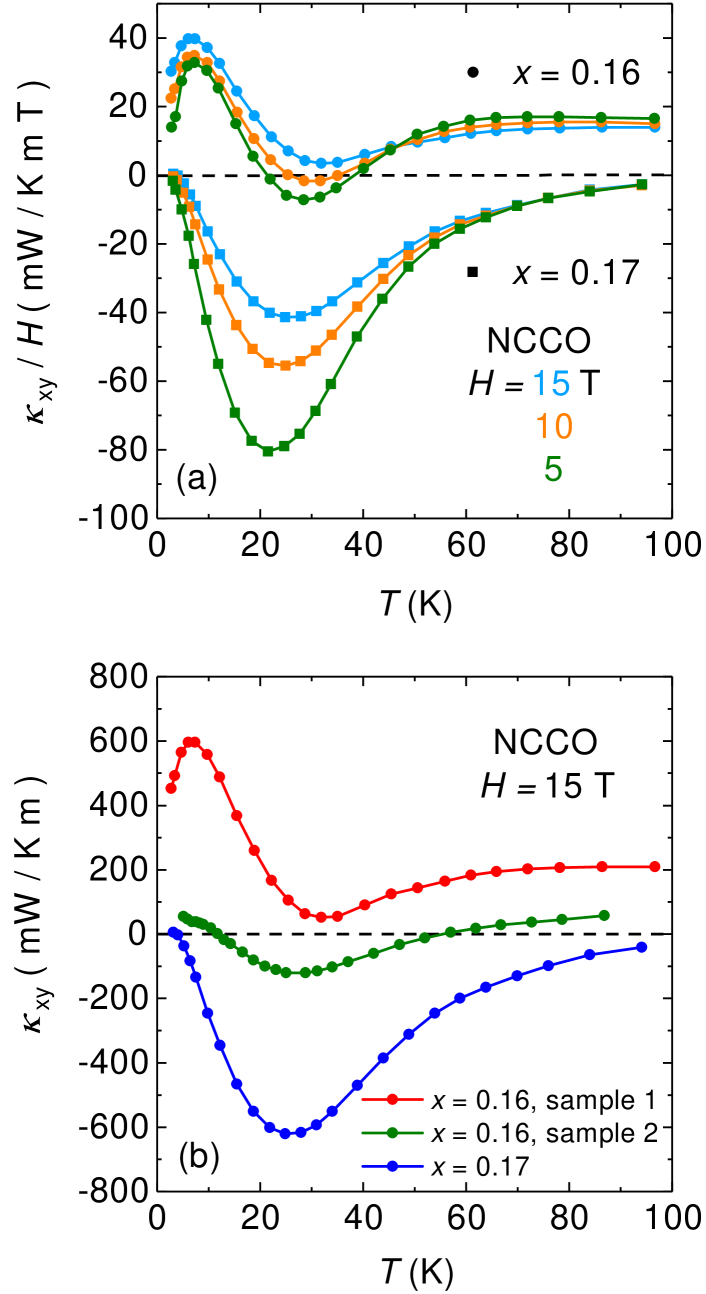
In Fig. 2(a), we display the thermal Hall conductivity of our two main samples, (sample 1) and , plotted as vs below 100 K (down to 3 K), for three different magnetic fields . At T, we find that is negative at all temperatures for the sample with (blue squares), whereas it is positive at all temperatures for the sample with . The negative is similar to that found at lower doping [13], down to , and it is due to phonons. The positive is due to electrons.
There is a contribution of phonons and electrons in both samples, but the electronic contribution is much larger in the sample with . This is confirmed by performing measurements down to very low temperature. In Fig. 3(b), we report our data at T taken below 4 K, plotted as . The fact that is constant below 4 K shows that it is entirely coming from transport by fermions, i.e. electrons. Indeed, the contribution of phonons to in cuprates is negligible below 4 K [2]. We see that this (positive) electronic contribution is 10 times larger in the sample with , as reflected in the residual linear term , obtained by extrapolating to (dashed lines), seen to equal to mW/K2m for and mW/K2m for .
As previously reported in NCCO samples with lower dopings [13], the temperature dependence of / vs in the sample shows different sign and temperature dependence. In sample, the thermal Hall conductivity is positive at T over all temperature range, being maximal around 10 K before aiming for a finite residual value as goes to 0. We attribute this positive signal to the electronic contribution which we believe is larger in the sample.
It is also worth to notice that while T is strong enough to fully suppress superconductivity in both samples, T is not. However, the fact that follows the same temperature dependence at both T and 5 T indicates that superconductivity has little to no effect on the thermal Hall response on both samples.
The thermal Hall conductivity is also measured in NCCO sample 2 which is dirtier than sample 1 (as shown in Fig. 2 (b)). We find that the overall signal is more negative in sample 2 compared to sample 1, which indicates that the positive electronic contribution is larger in a cleaner sample due to less scattering of electrons by impurities.
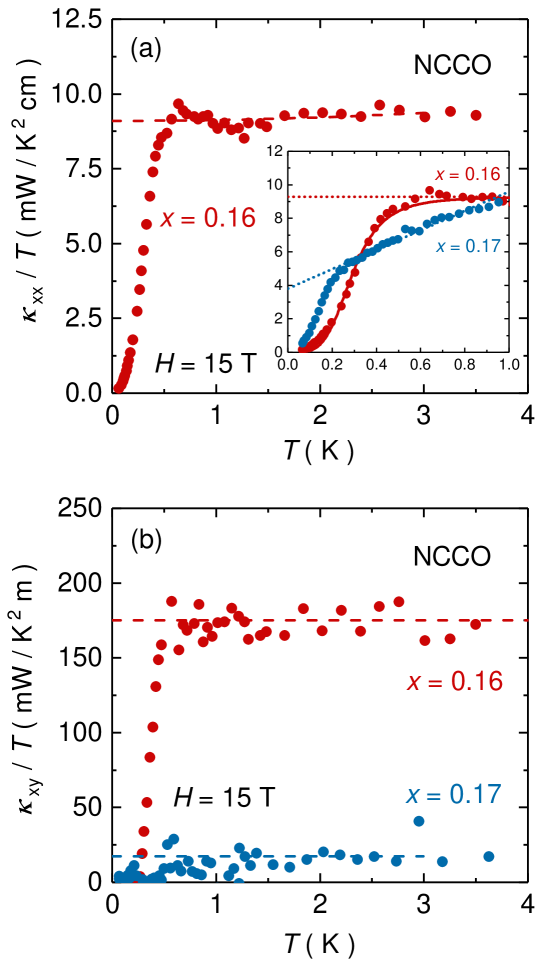
The positive electronic contribution of is larger in NCCO = 0.16 than = 0.17 is simply due to the fact that = 0.16 sample is cleaner. This can be verified by making a direct comparison on their thermal conductivity data at low temperature. Fig. 3 (a) shows the longitudinal thermal conductivity, plotted as / vs , at low temperature down to . Since both samples are in the metallic region of the phase diagram, a residual linear term is expected. By applying a linear fit (inset of Fig. 3 (a), dashed lines), we obtain mW/K2cm for and mW/K2cm for . Using the Wiedemann-Franz (WF) law, we can estimate a cm for the former and cm for the later. There’s roughly a factor of 2.25 between the two s, which clearly shows that the = 0.16 sample is cleaner than the = 0.17 sample.
As we can observe in Fig 3, there is a large downturn in both and below mK. A similar downturn has been observed in Pr2-xCexCuO4 (PCCO) at mK, which was attributed to the thermal decoupling between electrons and phonons at low temperature [18]. The decoupling temperature can be extracted by fitting the curve using the following formula:
| (3) |
in which , , , and are all fitting parameters [18]. In the inset of Fig. 3 (a), the red solid line denotes the thermal decoupling fit using eqn. (3), which gives a decoupling temperature of mK, This value is higher than mK obtained in PCCO [18].
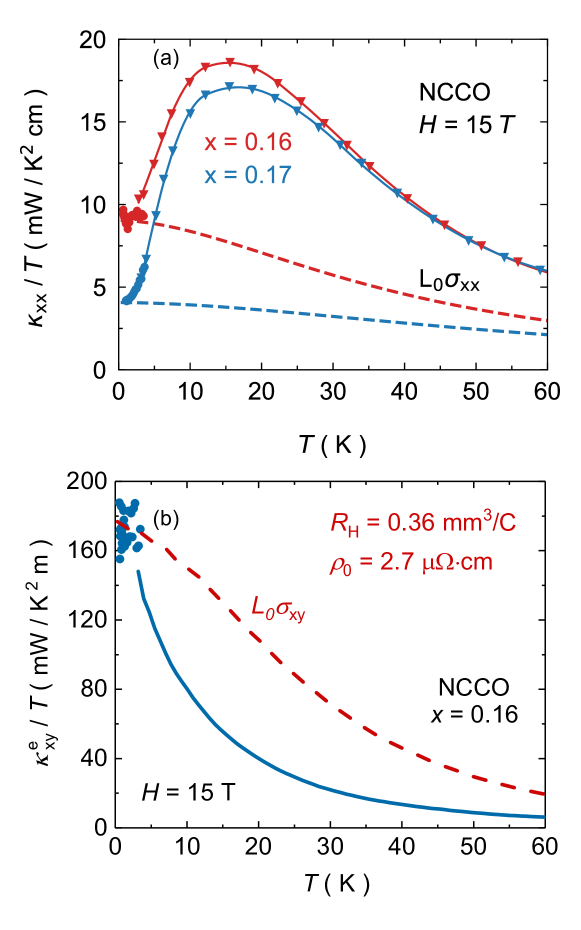
Fig. 4 (a) shows the thermal conductivity for NCCO (red) and (blue), plotted as vs , at T for the whole range. The data are a combination of the low temperature measurement (obtained in a dilution fridge, circles) and the high temperature measurement (obtained in a standard VTI, triangles). In the same figure, we also plot an estimate of the expected electronic contribution (dashed lines), calculated using the Wiedemann-Franz law: with . For those estimation, we use the published data of of PCCO at in ref. [15], but with the calculated value of obtained from thermal conductivity. For , we use the published data of PCCO at in ref. [19], with . From those estimation, we can already infer that, even though the phonons are the main heat carriers in thermal transport, the electronic contribution is larger in than in .
Fig. 4(b) shows the electronic thermal Hall conductivity / vs in NCCO (blue solid line) with the estimated thermal Hall conductivity of the electrons (red dashed line) obtained using the WF law. of NCCO is dominated by the negative phononic contribution. Thus, in NCCO can be obtained by subtracting the of from , assuming the phononic is similar in NCCO and . The red dashed line represents the upper limit of the estimated electronic contribution by WF law, with . is calculated by using a temperature independent Hall coefficient and a temperature dependent data of PCCO at [15], but adjusted with a cm. To match the value of mW/K2 at 0, we get a Hall coefficient of = 0.36 mm3/C, which is half of the expected value ( 0.7 mm3/C) in PCCO at [19]. Judging by the doping dependence of in PCCO , the estimated in NCCO confirms that the doping level is lower but close to the Fermi surface reconsutruction point .
III.2 Quantum oscillations
Another smoking gun evidence that the NCCO sample is cleaner than is from the quantum oscillation measurements. By performing the TDO measurements in both and samples up to 85 T, we are able to observe quantum oscillation signals in the sample but not in the sample, which indicates that the sample is indeed cleaner than the sample.
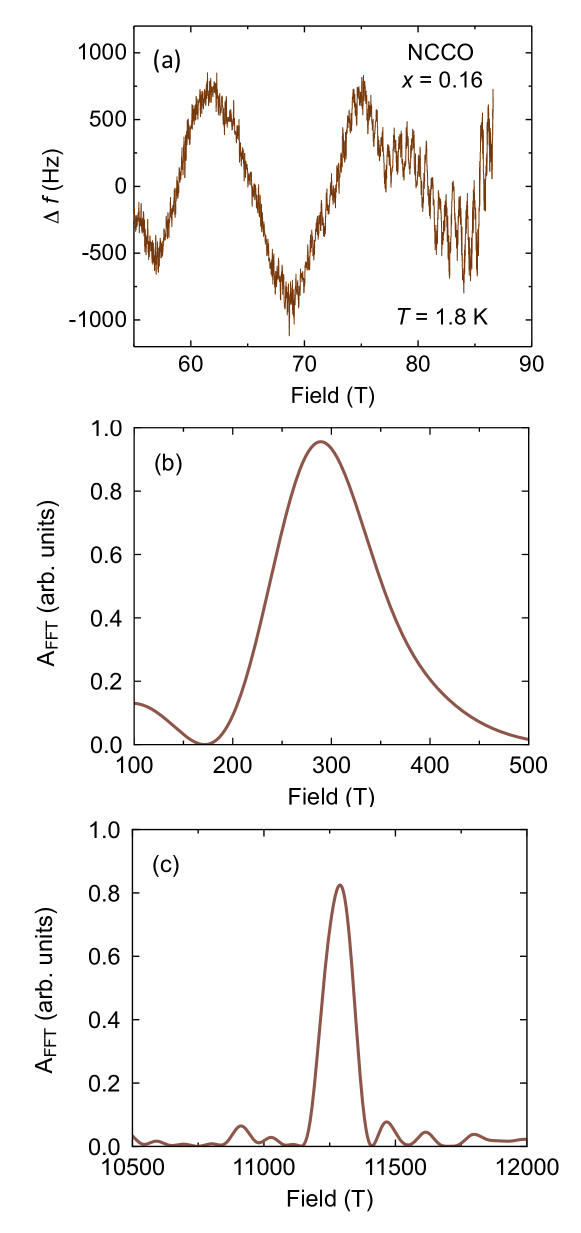
The quantum oscillation data after subtracting a smooth background taken in the sample are shown in Fig. 5 (a). After applying a discrete Fourier analysis, we can extract two frequencies T (Fig. 5 (b)) and T (Fig. 5 (c)). Close to , the FS undergoes a reconstruction due to the AF ordering, which results in electron-like and hole-like FSs. The low frequency oscillations come from the small hole pocket, while the emergence of the higher frequency can be explained by the magnetic breakdown between the hole- and electron-like FSs, which was previously reported in another study [14].
From the Lifshitz-Kosevich (LK) theory, the temperature and magnetic field dependence of the oscillation amplitude are determined by the product of the thermal damping factor and the Dingle damping factor , defined as
| (4) | ||||
| (5) |
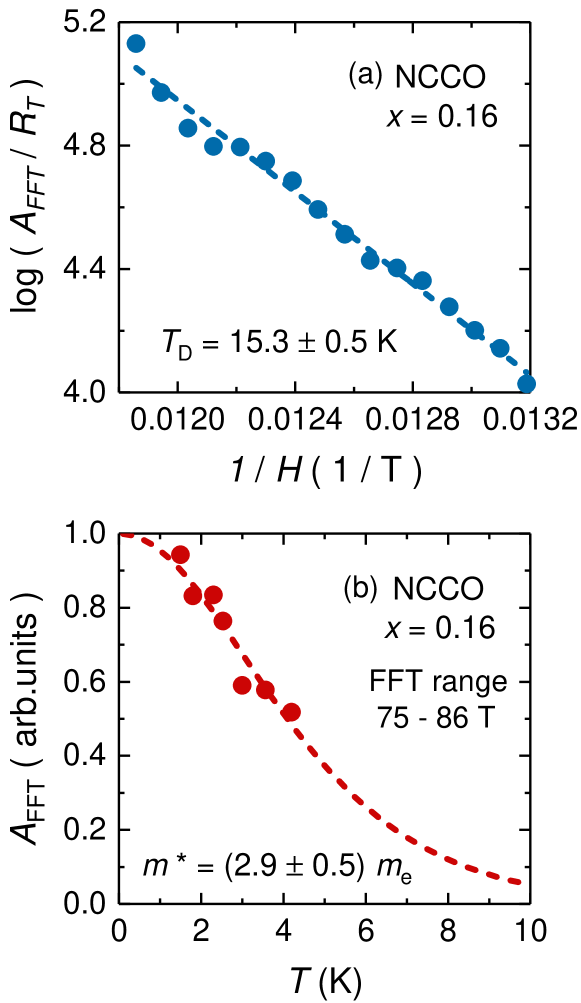
where the effective mass and the Dingle temperature . is the scattering rate, is the Boltzmann constant, is the bare electron mass and T/K. We can then fit the temperature dependence of the normalized damping factor (Fig. 6 (b)) to obtain an effective mass of for the high frequency. Fig. 6 (a) shows the field dependence of the oscillation amplitude. A linear fit yields a Dingle temperature of K. Both the extracted effective mass and Dingle temperature are consistent with previous results when comparing samples with similar (and not the nominal doping), which results in a doping level slightly lower than = 0.16 [20].
IV DISCUSSION
The main finding of this study is the positive thermal Hall conductivity for NCCO sample in the metallic state, compared to a large negative signal in the at T. Knowing, from a previous study [13], that the observed at is dominated by phonons, we can propose two distinct mechanisms for in NCCO . The positive contribution of comes from electrons, which is partially compensated by the negative contribution of phonons. The electronic is larger in sample is simply due to the fact that sample is cleaner than , which can be verified by a smaller residual resistivity in and the absence of QOs in . In the same doping level of = 0.16, the electronic contribution is also larger in a cleaner sample (as shown in Fig. 2(b)), due to the fact of less scattering of electrons by impurites.
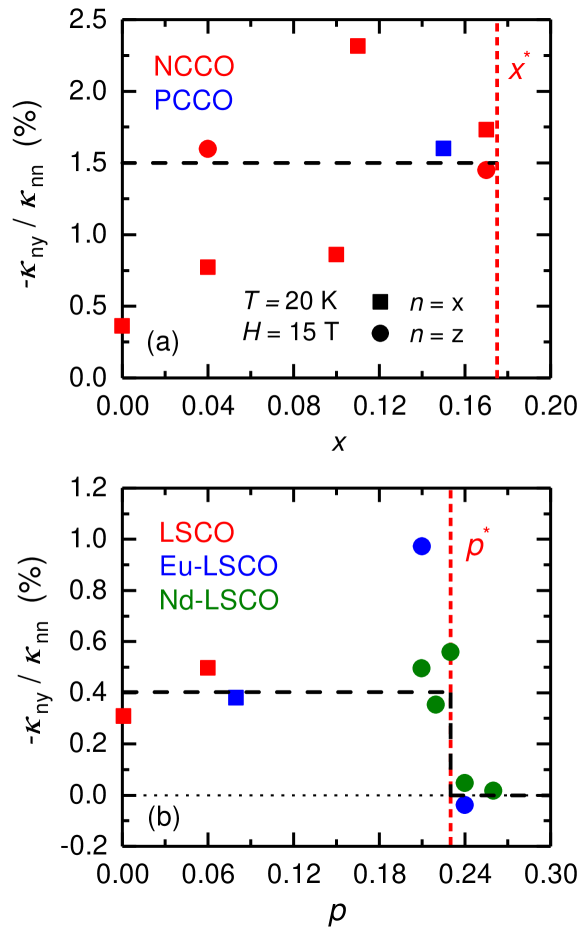
Combining these results with a previous study [13], we find that the large negative electron contribution have similar magnitude and temperature dependence at all doping levels in electron-doped cuprates NCCO (as shown in Fig. 7(a)). This observation indicates that the mechanism behind the phonon thermal Hall effect in e-doped cuprates is similar among all doping levels, regardless of whether the system is an insulator or metal. What is intriguing here is, electrons and phonons make comparable contributions to the thermal Hall conductivity in the metallic state at , but with opposite sign. This puts strong limits on possible mechanisms behind the phonon thermal Hall effect and rules out any mechanism based on the skew scattering of phonons off charged impurities [10], such as oxygen vacancies, as these local charges should be screened very effectively by mobile electrons in a highly conductive metallic state.
So what makes phonons chiral in cuprates? One possible explanation is the skew scattering of phonons by impurities imbedded within an AF environment [12]. Both the extracted Hall coefficient and QOs measurements in NCCO sample confirms its proximity to the FS reconstruction point, where short-range AF correlations are still prominent. A large negative phonon contribution, similar in magnitude and temperature dependence, persists from the AF ordered Mott insulating state all the way up to the metallic state close to , is consistent with a scenario of AF ordering playing a key role in the phonon thermal Hall effect.
It is worth to be noted that a similar consists of both negative phononic contribution and positive electronic contribution has also been observed in the hole-doped cuprate = 0.20 La1.6-xNd0.4SrxCuO4 sample [1], like in the case of NCCO. As can be seen in Fig.7 (b), a negative phonon contribution, also similar in magnitude and temperature dependence, persists from the Mott insulating state all the way up to the pseudogap phase below . This similar behavior of the phonon thermal Hall effect in hole-doped cuprates and electron-doped cuprates indicates that the same mechanism involving AF correlations could potentially also explain the phonon in hole doped cuprates, as has been suggested by a very recent study of impurity-induced phonon thermal Hall effect in the AF phase of Sr2IrO4[22].
V SUMMARY
We have measured the thermal conductivity and the thermal Hall conductivity of the electron-doped cuprate NCCO at dopings and . In the = 0.16 sample, we observe two distinct but comparable channels for thermal Hall conductivity in the metallic state. The positive channel is contributed by electrons and the sign is consistent with the prediction from the electrical Hall conductivity . The negative channel is contributed by phonons and it persists up to with a similar magnitude and temperature dependence to that found at lower doping. The fact that the negative phononic contribution is comparable regardless of the system being an insulator or a metal indicates that its origin is unlikely to come from skew scattering of phonons off charged impurities, since such a mechanism should depend strongly on the screening from mobile electrons. The fact that the negative phonon thermal Hall effect persists from the AF ordered phase all the way up to , where short-range AF correlations are still present, is consistent with spin texture playing a role in the underlying mechanism for the phonon thermal Hall effect. This type of mechanism, whereby phonons are scattered by spin texture or defects embedded in a magnetic order, could also apply to hole-doped cuprates inside their pseudogap phase (below the critical doping ).
VI ACKNOWLEDGMENTS
We thank S. Fortier for his assistance with the experiments. L.T. acknowledges support from the Canadian Institute for Advanced Research and funding from the Institut Quantique, the Natural Sciences and Engineering Research Council of Canada (Grant No, PIN:123817), the Fonds de Recherche du Québec - Nature et Technologies, the Canada Foundation for Innovation, and a Canada Research Chair. This research was undertaken thanks in part to funding from the Canada First Research Excellence Fund. Z-X.S. acknowledges the support of the U.S. Department of Energy, Office of Science, Office of Basic Energy Sciences, Division of Material Sciences and Engineering, under contract DE-AC02-76SF00515.
References
- Grissonnanche et al. [2019] G. Grissonnanche, A. Legros, S. Badoux, E. Lefrançois, M. L. V. Zatko, F. Laliberté, A. Gourgout, J.-S. Zhou, S. Pyon, T. Takayama, et al., Nature 571, 376–380 (2019).
- Boulanger et al. [2020] M.-E. Boulanger, G. Grissonnanche, S. Badoux, A. Allaire, E. Lefrançois, A. Legros, A. Gourgout, M. Dion, C. H. Wang, X. H. Chen, et al., Nat. Commun 11, 5325 (2020).
- Grissonnanche et al. [2020] G. Grissonnanche, S. Thériault, A. Gourgout, M.-E. Boulanger, E. Lefrançois, A. Ataei, F. Laliberté, M. Dion, J.-S. Zhou, S. Pyon, et al., Nat. Phys. 16, 1108 (2020).
- Ye et al. [2021] M. Ye, L. Savary, and L. Balents, arXiv:2103.04223 (2021).
- Samajdar et al. [2019] R. Samajdar, S. Chatterjee, S. Sachdev, and M. S. Scheurer, Phys. Rev. B 99, 165126 (2019).
- Zhang et al. [2021] Y. Zhang, Y. Teng, R. Samajdar, S. Sachdev, and M. S. Scheurer, Phys. Rev. B. 104, 035103 (2021).
- Mangeolle et al. [2022] L. Mangeolle, L. Balents, and L. Savary, Phys. Rev. B 106, 245139 (2022).
- Varma [2020] C. M. Varma, Phys. Rev. B 102, 075113 (2020).
- Guo and Sachdev [2021] H. Guo and S. Sachdev, Phys. Rev. B 103, 205115 (2021).
- Flebus and MacDonald [2022] B. Flebus and A. H. MacDonald, Phys. Rev. B 105, L220301 (2022).
- Sun et al. [2022] X.-Q. Sun, J.-Y. Chen, and S. A. Kivelson, Phys. Rev. B 106, 144111 (2022).
- Guo et al. [2022] H. Guo, D. G. Joshi, and S. Sachdev, Proc. Natl. Acad. Sci. U.S.A. 119, (46) e2215141119 (2022).
- Boulanger et al. [2022] M.-E. Boulanger, G. Grissonnanche, E. Lefrançois, A. Gourgout, K.-J. Xu, Z.-X. Shen, R. L. Greene, and L. Taillefer, Phys. Rev. B 105, 115101 (2022).
- Helm et al. [2010] T. Helm, M. V. Kartsovnik, I. Sheikin, M. Bartkowiak, F. Wolff-Fabris, N. Bittner, W. Biberacher, M. Lambacher, A. Erb, J. Wosnitza, et al., Phys. Rev. Lett. 105, 247002 (2010).
- Tafti et al. [2014] F. F. Tafti, F. Laliberté, M. Dion, J. Gaudet, P. Fournier, and L. Taillefer, Phys. Rev. B 90, 024519 (2014).
- Grissonnanche et al. [2016] G. Grissonnanche, F. Laliberté, S. Dufour-Beauséjour, M. Matusiak, S. Badoux, F. F. Tafti, B. Michon, A. Riopel, O. Cyr-Choinière, J. C. Baglo, et al., Phys. Rev. B 93, 064513 (2016).
- Coffey et al. [2000] T. Coffey, Z. Bayindir, J. F. DeCarolis, M. Bennett, G. Esper, and C. C. Agosta, Rev Sci Instrum. 71, 4600 (2000).
- Smith et al. [2005] M. F. Smith, J. Paglione, M. B. Walker, and L. Taillefer, Phys. Rev. B 71, 014506 (2005).
- Charpentier et al. [2010] S. Charpentier, G. Roberge, S. Godin-Proulx, X. Béchamp-Laganière, K. D. Truong, P. Fournier, and P. Rauwel, Phys. Rev. B 81, 104509 (2010).
- Helm [2013] T. Helm, Ph.D. thesis, Technische Universität München, Munich (2013).
- Thériault [2022] S. Thériault, Ph.D. thesis, Université de Sherbrooke, Sherbrooke (2022).
- Ataei et al. [2023] A. Ataei, G. Grissonnanche, M.-E. Boulanger, L. Chen, E. Lefraçcois, V. Brouet, and L. Taillefer, arXiv:2302.03796 (2023).