Characterisation of ferroelectric domains in magnetite (Fe3O4)
Abstract
Magnetite has long been investigated across many disciplines due to the interplay between its ferroic order parameters, namely its ferrimagnetism, ferroelasticity and ferroelectricty. Despite this, the experimental difficulty in measuring low temperature real space images of the ferroelectric domains has meant that the local behaviour of ferroelectric domains emergent below the phase transition have yet to be realised. This work presents real space images of the ferroelectric domains, and uses piezo force microscopy to as a function of temperature to probe the onset of piezoelectricty and ferroelectricity across the 38 K transition.
Magnetite, Fe3O4, is one of mankinds oldest functional materials, going through its first ferroic ordering temperature at 860 K where it becomes ferrimagnetic Alexe et al. (2009); Ziese et al. (2012). It is of distinct interest to the paleomagnetic community, principly whilst studying the magnetisation of the ocean floor. Magnetic stripes emerging in magnetite on the Earth’s crust caused by the Earth’s magnetic pole reversal led to a resurgence and eventual acceptance of the theory of continental drift Vine and Matthews (1963). Beyond terrestial applications, magnetite has also been shown to possibly hold the secrets to life on Mars, due to its presence in martian meteorites McKay et al. (1996).
Magnetite also has significant spintronics applications due to its low temperature electronic phase transition, at 120 K, identified by Verwey in 1941 Verwey and Haayman (1941). Across this Verwey transition there is not only a large change in the electrical resistivity and magnetic moment of magnetite, but there is also the onset of ferroelasticity. There is a corresponding change in crystal structure Chen et al. (2008); Wright, Attfield, and Radaelli (2002); Rozenberg et al. (2006) as the crystal structure changes from an inverse spinnel/ cubic symmetry to the monoclinic, Cc space group Novák et al. (2000); Zuo, Spence, and Petuskey (1990); Joly et al. (2008); Angst et al. (2019); de la Figuera and Marco (2019). The exact nature of this phase transition has been hotly debated, however the charge ordering was finally described in 2012 by Senn, Wright, and Attfield (2012).
At 38 K there is a further phase transition with the introduction of ferroelectricity. Initially shown with macroscopic DC applied field hysteresis loops Rado and Ferrari (1975); Kato and Iida (1982); Miyamoto and Chikazumi (1988); Miyamoto et al. (1994); Kato et al. (1983), it was later verified by Alexe et al. (2009) who used a positive up negative down (PUND) measurement regime to determine the onset of polarisation as a function of temperature, on thin film \ceFe3O4. Following this, Ziese et al. (2012) showed that the behaviour of magnetite below 38 K was similar to that of a relaxor ferroelectric, by exploring the frequency dependence of electrical permittivity in thin films. Identical behaviour was also found in single crystals Kobayashi, Akishige, and Sawaguchi (1986); Schrettle et al. (2011), where a frequency dependence of the permittivity equally confirmed relaxor behaviour.
The crystal symmetry in the low temperature phase (38 K) is triclinic Medrano et al. (1999); Miyamoto and Chikazumi (1988). This non-centrosymmetric symmetry fulfils the structure requirements for the measured ferroelectricity mechanisms under pinning the ferroelectricity, which have been ascribed to small alterations in charge density and bond lengths caused by further charge ordering Ziese et al. (2012); Brink and Khomskii (2008); Yamauchi, Fukushima, and Picozzi (2009).
This work uses low temperature piezo force microscopy (PFM) on a single crystal of Fe3O4(001) to explore the nature of the ferroelectricity around and below the ferroelectric phase transition at 38 K. The first real space images of the ferroelectric domains are presented, as well as local investigations of the ferroelectric phase transition, and explorations of potential multiferroic couplings.
Magnetite single crystals were grown by the optical floating zone method using Fe2O3 (Acros Organics, 99.999 % purity) as the starting material. Further details can be found in the suplemntary information. Piezo force microscopy (PFM) images were acquired on a low temperature AFM (Attocube attoLiquid 2000) provided with interferrometric detection system. Nanosenors PPP-EFM tips, 80 KHz resonance, were used.
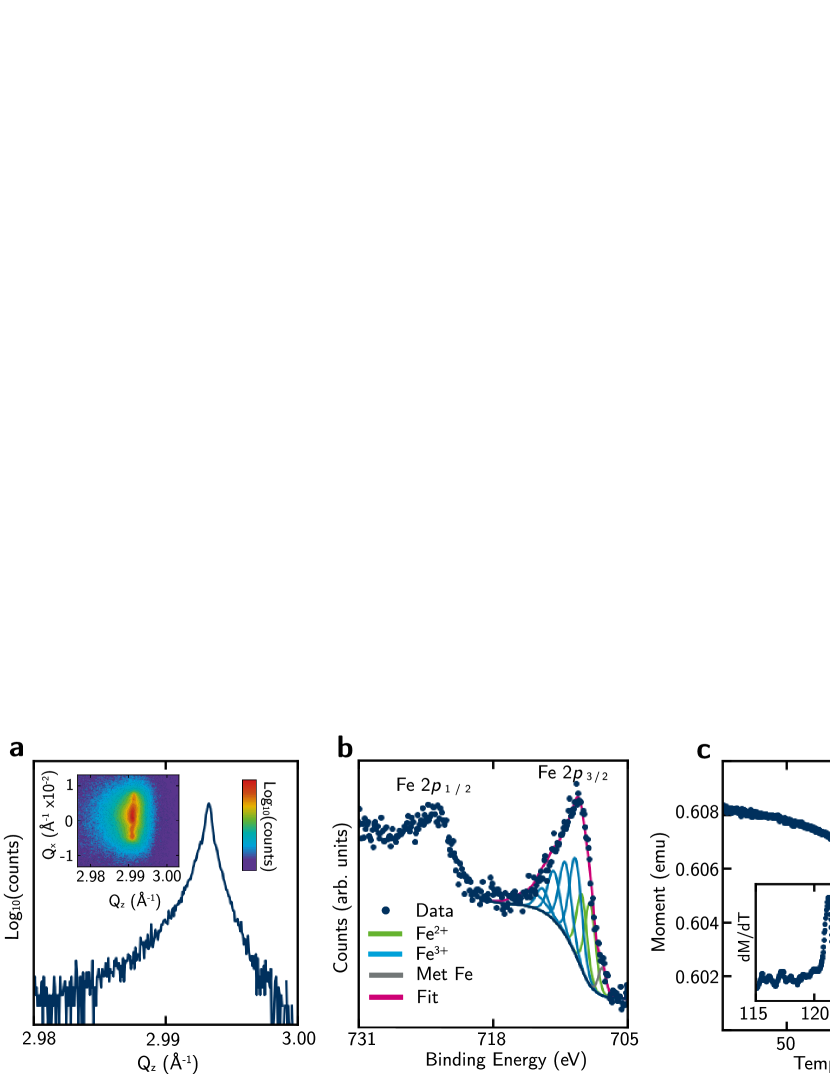
In order to verify the quality of the crystal we performed a series of sample characterisation measurements. Figure 1a shows a surface normal X-ray trunction rod of the 004 specular peak, indicating a surface normal along the 001 cubic direction. The peak position is at Å-1 which corresponds to a d spacing of Å as expected at room temperature. Some asymmetry can be seen in the peak shape, likely introduced from the repeated thermal cycling from magnetometry measurements completed in advance. A reciprocal space map (RSM) (in the inset of Figure 1(a)) of the same peak was acquired, where this asymmetry is more apparent. A considerable broadening in is seen relative to , a mosaic broadening typical of polished samples. Given that this broadening occurs along , i.e. the in plane direction, it does not itself affect the determination of the out of plane normal. In both cases, the peak corresponds to a crystal a-axis of Å, which is a strong indicator of the purity and crystallininity of the sample (the reported lattice parameter of magnetite is Å Fonseca et al. (2016)).
Identifying the oxidation state of iron is key to confirming the stoichiometry, especially due to the high sensitivity to oxygen whilst growing magnetite Gilks et al. (2016); Zhang et al. (2017). Other stoichiometries frequently appear as parasitic phases, notably Fe2O3 and FeO. As seen in figure 1b, the highly constrained component peaks fit wellBiesinger et al. (2011) to Fe 2p3/2 data indicating that the sample is Fe3O4 with no apparent parasitic phases. The presence of a metallic Fe component is most likely caused by the presence of surface defects. Such defects are unavoidable and common even in mass produced commercially available Si or GaAs wafers Seddon et al. (2018).
Identification of the Verwey transition by or resistivity measurements is a common approach to confirm sample purity. A very low remenance and magnetic coersivity was found when probing the magnetic field dependence. To check the expected magnetic properties in the sample, magnetisation as a function of temperature () measurements were conducted using a Quantum Design MPMS3 SQUID magnetometer, seen in figure 1c. A magnetic field of 3 T was applied along the axial surface normal ([001]) and the magnetisation was measured as a function of temperature, starting at 200 K down to 2 K. As can be seen in Figure 1(c) a sharp drop in the magnetisation is seen at around 120 K, consistent with the Verwey transition, even under field cooling. The inset displays the differential of magnetisation with respect to temperature, clearly showing a sharp spike at 121 K.
No magnetic field dependence on ferroelectricity was found later in the study, however to further confirm the magnetic domain behaviour on the nanoscale, magnetic force microscopy (MFM) data were recorded and presented in Figure 1(d). Expected phase shift values for magnetic domains in this material were established across various temperatures, and are the subject of a later work. However, in the data at 10 K, very low phase shifts were seen, indicating magnetic domains lie almost entirely in the same direction, which is likely in-plane. Application of a magnetic field revealed magnetic domain switching on a hierarchy far above the ferroelectic domains reported below, and no correlation between the two was eventually found.
Despite ferroelectricty already being confirmed in magnetite samples from bulk measurements, there currently exists no local measurements of ferroelectric domain patterns or local confirmations of ferroelectricity in the literature. Futhermore, due to the complexity of the crystal symmetry (triclinic), any new real space images of how ferroelectric domains manifest in these systems would be a step towards begining to understand the complex expression of ferroelectricty in such low symmetry systems. Piezo force microscopy (PFM) is a well established surface analysis technique that measures not only the amplitude of oscillating piezoelectric domains but also the phase of the oscillating domains. Shifts in phase are indicative of different underlying ferroelectric domains. Here, measurements acquired at 10 K are presented in Figure 2. In order to preserve the quality of the tip prior to scanning a flat region was identified with non-contact topographic AFM measurements.
Due to the low amplitude signal of the ferroelectric response from the magnetite surface, the PFM signal was recorded in resonance mode.Harnagea et al. (2003) The amplitude signal acquired can be seen in Figure 2a, where contrary to the traditional expression of ferroelectric domains imaged by PFM measurements quite the opposite is seen. The initial impression is a distribution of narrow, randomly distributed and somewhat circular domains. Differences in individual domains is most apparent in the PFM phase images in figure 2b where two distinct PFM phases are identified, approximately 180o apart. The PFM amplitude on the domains themselves is low, but relatively constant, the domain walls are highlighted by an increased PFM amplitude response which can be observed in the line scan in figure 2c.
This behaviour in the PFM amplitude in magnetite is atypical of traditional measurements. Instead of a constant amplitude on the domains, with a dip in amplitude as the tip crosses the domain wall, here amplitude signal is constant, with the occasional spikes outlining small, closed domains. These spikes in amplitude is highlighted by the linescan in 2c where the enhancement can be seen as 5-6 times larger than the normal response.
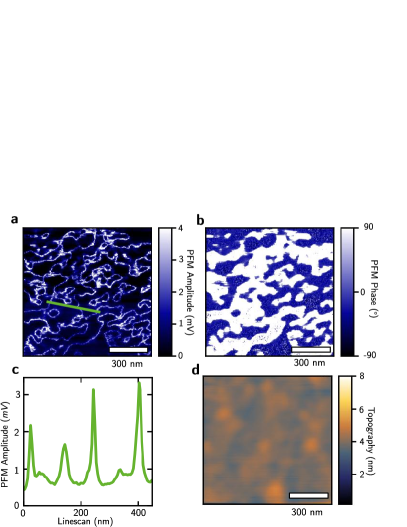
Interpretation of the amplitude signals alone may indicate that the ferroelectricity in the material is somehow constrained to the domain walls. However, analysis of the phase images indicates otherwise. The phase image of the PFM measurements describes a more traditional behaviour as can be seen in Figure 2b. Two distinct domains are resolved, corresponding to the regions outline by amplitude measurements. The PFM phase image, combined with amplitude measurements indicate that different domains present on the magnetite surface have a similar, indistinguishable amplitude but different phase, implying that the ferroelectric polarisations consistently possess an out of plane component in different directions, switching the phase. The small size of the domains relative to most ferroelectrics is consistent with the relaxor nature of magnetiteMiao et al. (2016); Belhadi et al. (2021)
The spiking in amplitude at domains walls needs careful treatment as there is some evidence it could arise from a scanning artefact. For example, there have been reports that the positioning of the detection laser on the back of the cantilever can directly affect the contrast seen on ferroelectric domains. Indeed there is one position on the cantilever that causes a similar domain wall response, spiking as opposed to dropping to nearly zero amplitude Kim et al. (2017).
Another cause for enhanced amplitude could be a mechanical softening of the material occurring at the domain walls. This is a phenomenon is well documented in ferroelectric materials by Stefani et al. (2020), with the mechanical softening causing a shift in the resonant frequency of the tip-sample system Stefani et al. (2021). When resonating at a fixed frequency, a shift in the resonance of the system could result in a sharp change in the amplitude over the region softened. Contrary arguments to this are that if the shift of the resonance causes a spike in recorded amplitude, in principle choosing sequential measurement frequencies through the resonance should cause the opposite effect, with enhanced amplitude occurring at the domains, and a reduced amplitude signal occurring at the domain walls. Despite this, the effect was shown to be frequency independent. Similarly dual resonance frequency tracked PFM (DFRT) was also employed in order to attempt to minimise this spiking of amplitude to no success, with images showing no difference in contrast. As such, the amplitude spikes likely not caused interctions with the topography (an effect DFRT is designed to mitigate) but instead arise due to a real effect of the system itself.
Seeminly not a measurement artefact, we attribute the enhanced amplitudes at domain walls seen as instead be a real effect, caused by a shear movement of the ferroelectric domains at the domain wall. Unlike (near) uniaxial ferroelectics such as LiNiO3 Godau et al. (2017); Zhao et al. (2020) or \ceBiFeO3 Folkman et al. (2009); Nelson et al. (2011), the crystal symmetry of Fe3O4 is triclinic. When considering a cubic system, the piezoelectric tensor is diagonal. As crystal symmetry is reduced, the number of non-zero terms in this tensor increase. Due to the complexity of the unknown piezoelectric tensor, correlation with a direct piezoelectric response is extremely challenging.
Whilst ferroelectricty across the 38 K phase transition has been established macroscopically, so far this was not established locally. The most typical example of local determination of ferroelectricity is to measure the effect on PFM amplitude and phase when DC electric field is applied to the sample, creating a ferroelectric hystersis loop. The result of applied electric field on the cantilever phase is presented in Figure 3a where a hysteresis loop was applied first up to 4 V, then down through 0 V to -4 V before finally returning to 0 V.
The main loop in Figure 3a acquired at 24 K, well below the ferroelectric phase transition show a clear opening in the loop, indicating the presence of a coersive electric field arising from the switching of a ferroelectric polarisation in the material. Contrary to this, as can be seen in the 40 K inset, above the phase transition a typical paraelectric closed hysteresis loop where there exists. The centre of the hysteresis is shifted by approximately -1.5 V from the centre of the applied field/ Such an effect is not uncommon, with the direct interpretation being surface induced anisotropy, implying it would rather lie in one particular direction. This kind of imprinting has been seen beforeAlexe et al. (2001). Data were fitted with a modified Langevin function, commonly used to fit magnetic hysteresis data (Figure 3 a) Procter et al. (2015); Thórarinsdóttir et al. (2021) of the form
| (1) |
where is the phase as a function of applied electric field, is the saturation value of , is the applied field, is the coercive field and is a shape parameter of the loop, from which no physical properties will be determined. The temperature dependence of is presented in Figure 3b. Above the bulk-identified phase transition temperature the coersive field of the system is zero within error bars (determined from sensitivity of the measurement apparatus), however as the temperature is reduced past 38 K, a rise in the coersive field is sharp but continuous as expected of a second order phase transition, and consistent with previous measurements Alexe et al. (2009). This coersive field increases sharply with decreasing temperature, before settling to a relatively stable value of around 0.2 V. Due to the fiberoptic attocube system being sensitive to the out of plane tip vibrations only, the measurement is only sensitive to the out-of-plane piezoelectric oscillations (effectively the dzz or out-of-plane piezoelectric coefficient). Lack of in-plane resolution prevents further quantification of the polarisation on a local scale however the general behaviour is in agreement with macroscopic measurements.
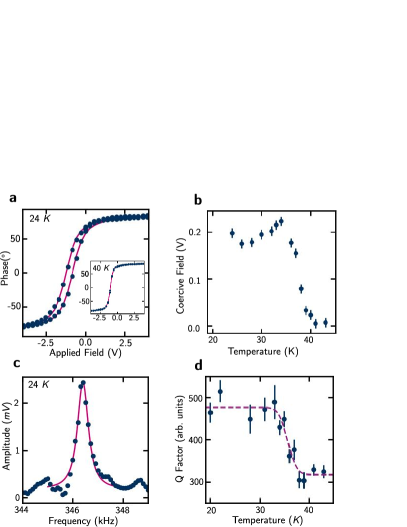
Modification of the elastic properties of the sample surface (such as the onest of piezoelectricity) shall induce a change in the tip-surface resonance. As shown by Salje, Hayward, and Lee (2005), most ferroelastic materials soften as the system undergo a structural phase transition. Therefore, in the case of magnetite undergoing the 38 K ferroelectric transition, the Q-factor of the tip sample resonance is expected to increase as the temperature decreases across the phase transition region. An example of a typical contact resonance can be found in Figure 3c, where data has been fitted with a Pearson VII function to determine exact parameters such as peak width and position. Whilst small features either side of the central peak greatly affect the fit at the fringes of the peak function, the model clearly captures well the upper parts of the central resonance peak , as well as the full width half maximum, . With these two parameters a Q factor can determined as and allow the interaction to be compared as a function of temperature.
The temperature dependence of the Q-factor is seen in Figure 3d, with individual Q factors and their errors determined from fitting. As in the coersive field data, an initially stable Q factor is shown to stiffen as the temperature of the system is reduced past the 38 K ferroelectric phase transition, before reaching a stable value below 34 K, suggesting not just a structural phase transition but also the onset of piezoelectricity.
The ferroelectric properties of magnetite \ceFe3O4 were probed across its ferroelectric phase transition at 38 K. The first PFM images of the ferroelectric domains reveal unusual spiking behaviour of the PFM amplitude at domain walls. Different domains themselves are revealed by the PFM phase recorded however the amplitude at these domains themselves is relatively low. The unusual behaviour is ascribed to shear domain wall motion caused by the triclinic crystal symmetry. The opening of locally acquired hysterisis loops was probed locally by PFM and shown to open at 38 K, settling to a value of approximately 0.2 V coersive field below 30 K. A stiffening between the tip-sample system was also found after observation of the contact resonance of the tip, indicating the onset of piezoelectricty upon the cooling of the system through the ferroelectric phase transition.
Data Availability Statement The data that support the findings of this study are available from the corresponding author upon reasonable request.
Conflicts of Interest The authors declare no conflicts of interest.
Acknowledgements WJAB thanks the European Research Council (ERC-2019-STG-851504) - PI: Nicholas. F Chilton, The University of Manchester, for funding. MW acknowledges financial support from the EPSRC-funded Warwick Analytical Science Centre (EP/V007688/1). We acknowledge the EPSRC UK National Electron Paramagnetic Resonance Service for access to the SQuID magnetometer (EP/S033181/1). We thank Adam Brookfield and Dr Jordan Thompson for technical assistance. The financial support by EPSRC through grants EP/M022706/1 and EP/T027207/1 is gratefully acknowledged. M.A. acknowledges also the Alexander von Humboldt Research Award.
References
- Alexe et al. (2009) M. Alexe, M. Ziese, D. Hesse, P. Esquinazi, K. Yamauchi, T. Fukushima, S. Picozzi, and U. Gösele, “Ferroelectric Switching in Multiferroic Magnetite (Fe3O4) Thin Films,” Advanced Materials 21, 4452–4455 (2009).
- Ziese et al. (2012) M. Ziese, P. D. Esquinazi, D. Pantel, M. Alexe, N. M. Nemes, and M. Garcia-Hernández, “Magnetite (fe3o4): a new variant of relaxor multiferroic?” Journal of Physics: Condensed Matter 24, 086007 (2012).
- Vine and Matthews (1963) F. J. Vine and D. H. Matthews, “Magnetic Anomalies Over Oceanic Ridges,” Nature 199, 947–949 (1963), number: 4897 Publisher: Nature Publishing Group.
- McKay et al. (1996) D. S. McKay, E. K. Gibson, K. L. Thomas-Keprta, H. Vali, C. S. Romanek, S. J. Clemett, X. D. F. Chillier, C. R. Maechling, and R. N. Zare, “Search for Past Life on Mars: Possible Relic Biogenic Activity in Martian Meteorite ALH84001,” Science 273, 924–930 (1996).
- Verwey and Haayman (1941) E. J. W. Verwey and P. W. Haayman, “Electronic conductivity and transition point of magnetite (“fe3o4”),” Physica 8, 979–987 (1941).
- Chen et al. (2008) Y. Z. Chen, J. R. Sun, Y. N. Han, X. Y. Xie, J. Shen, C. B. Rong, S. L. He, and B. G. Shen, “Microstructure and magnetic properties of strained Fe3O4 films,” Journal of Applied Physics 103, 07D703 (2008).
- Wright, Attfield, and Radaelli (2002) J. P. Wright, J. P. Attfield, and P. G. Radaelli, “Charge ordered structure of magnetite fe3o4 below the Verwey transition,” Physical Review B 66, 214422 (2002).
- Rozenberg et al. (2006) G. K. Rozenberg, M. P. Pasternak, W. M. Xu, Y. Amiel, M. Hanfland, M. Amboage, R. D. Taylor, and R. Jeanloz, “Origin of the Verwey Transition in Magnetite,” Physical Review Letters 96, 045705 (2006).
- Novák et al. (2000) P. Novák, H. Štěpánková, J. Englich, J. Kohout, and V. A. M. Brabers, “NMR in magnetite below and around the Verwey transition,” Physical Review B 61, 1256–1260 (2000), publisher: American Physical Society.
- Zuo, Spence, and Petuskey (1990) J. M. Zuo, J. C. H. Spence, and W. Petuskey, “Charge ordering in magnetite at low temperatures,” Physical Review B 42, 8451–8464 (1990), publisher: American Physical Society.
- Joly et al. (2008) Y. Joly, J. E. Lorenzo, E. Nazarenko, J.-L. Hodeau, D. Mannix, and C. Marin, “Low-temperature structure of magnetite studied using resonant x-ray scattering,” Physical Review B 78, 134110 (2008).
- Angst et al. (2019) M. Angst, S. Adiga, S. Gorfman, M. Ziolkowski, J. Strempfer, C. Grams, M. Pietsch, and J. Hemberger, “Intrinsic Ferroelectricity in Charge-Ordered Magnetite,” Crystals 9, 546 (2019).
- de la Figuera and Marco (2019) J. de la Figuera and J. F. Marco, “Magnetite and the Verwey transition, from gamma-rays to low-energy electrons,” Hyperfine Interactions 240, 44 (2019).
- Senn, Wright, and Attfield (2012) M. S. Senn, J. P. Wright, and J. P. Attfield, “Charge order and three-site distortions in the Verwey structure of magnetite,” Nature 481, 173–176 (2012).
- Rado and Ferrari (1975) G. T. Rado and J. M. Ferrari, “Electric field dependence of the magnetic anisotropy energy in magnetite (fe3o4),” Physical Review B 12, 5166–5174 (1975).
- Kato and Iida (1982) K. Kato and S. Iida, “Observation of Ferroelectric Hysteresis Loop of Fe3O4 at 4.2 K,” Journal of the Physical Society of Japan 51, 1335–1336 (1982), publisher: The Physical Society of Japan.
- Miyamoto and Chikazumi (1988) Y. Miyamoto and S. Chikazumi, “Crystal Symmetry of Magnetite in Low Temperature Phase Deduced from Magnetoelectric Measurements,” Journal of the Physical Society of Japan 57, 2040–2050 (1988), publisher: The Physical Society of Japan.
- Miyamoto et al. (1994) Y. Miyamoto, S. Ishihara, T. Hirano, M. Takada, and N. Suzuki, “Ferroelectricity of magnetite (Fe3O4) observed by means of magnetoelectric effect,” Solid State Communications 89, 51–54 (1994).
- Kato et al. (1983) K. Kato, S. Iida, K. Yanai, and K. Mizushima, “Ferrimagnetic ferroelectricity of Fe3O4,” Journal of Magnetism and Magnetic Materials 31-34, 783–784 (1983).
- Kobayashi, Akishige, and Sawaguchi (1986) M. Kobayashi, Y. Akishige, and E. Sawaguchi, “Dielectric and Conducting Properties of Single Crystal of Magnetite below the Verwey Point,” Journal of the Physical Society of Japan 55, 4044–4052 (1986), publisher: The Physical Society of Japan.
- Schrettle et al. (2011) F. Schrettle, S. Krohns, P. Lunkenheimer, V. A. M. Brabers, and A. Loidl, “Relaxor ferroelectricity and the freezing of short-range polar order in magnetite,” Physical Review B 83, 195109 (2011).
- Medrano et al. (1999) C. Medrano, M. Schlenker, J. Baruchel, J. Espeso, and Y. Miyamoto, “Domains in the low-temperature phase of magnetite from synchrotron-radiation x-ray topographs,” Physical Review B 59, 1185–1195 (1999).
- Brink and Khomskii (2008) J. v. d. Brink and D. I. Khomskii, “Multiferroicity due to charge ordering,” Journal of Physics: Condensed Matter 20, 434217 (2008), publisher: IOP Publishing.
- Yamauchi, Fukushima, and Picozzi (2009) K. Yamauchi, T. Fukushima, and S. Picozzi, “Ferroelectricity in multiferroic magnetite driven by noncentrosymmetric Fe 2 + / Fe 3 + charge-ordering: First-principles study,” Physical Review B 79, 212404 (2009).
- Fonseca et al. (2016) H. A. Fonseca, E. Gonzalez, J. Restrepo, C. A. Parra, and C. Ortiz, “Magnetic effect in viscosity of magnetorheological fluids,” Journal of Physics: Conference Series 687, 012102 (2016).
- Gilks et al. (2016) D. Gilks, K. P. McKenna, Z. Nedelkoski, B. Kuerbanjiang, K. Matsuzaki, T. Susaki, L. Lari, D. Kepaptsoglou, Q. Ramasse, S. Tear, and V. K. Lazarov, “Polar Spinel-Perovskite Interfaces: an atomistic study of Fe3O4(111) / SrTiO3(111) structure and functionality,” Scientific Reports 6, 29724 (2016).
- Zhang et al. (2017) J. Zhang, W. Liu, M. Zhang, X. Zhang, W. Niu, M. Gao, X. Wang, J. Du, R. Zhang, and Y. Xu, “Oxygen pressure-tuned epitaxy and magnetic properties of magnetite thin films,” Journal of Magnetism and Magnetic Materials 432, 472–476 (2017).
- Biesinger et al. (2011) M. C. Biesinger, B. P. Payne, A. P. Grosvenor, L. W. Lau, A. R. Gerson, and R. S. Smart, “Resolving surface chemical states in XPS analysis of first row transition metals, oxides and hydroxides: Cr, Mn, Fe, Co and Ni,” Applied Surface Science 257, 2717–2730 (2011).
- Seddon et al. (2018) S. D. Seddon, C. Benjamin, J. I. Bryant, C. W. Burrows, M. Walker, G. Matheson, J. Herranz, L. Geelhaar, and G. R. Bell, “Work function of GaAs(hkl) and its modification using PEI: mechanisms and substrate dependence,” Physical Chemistry Chemical Physics 21, 24666–24673 (2018), publisher: The Royal Society of Chemistry.
- Harnagea et al. (2003) C. Harnagea, M. Alexe, D. Hesse, and A. Pignolet, “Contact resonances in voltage-modulated force microscopy,” Applied Physics Letters 83, 338–340 (2003), https://pubs.aip.org/aip/apl/article-pdf/83/2/338/10199597/338_1_online.pdf .
- Miao et al. (2016) P. Miao, Y. Zhao, N. Luo, D. Zhao, A. Chen, Z. Sun, M. Guo, M. Zhu, H. Zhang, and Q. Li, “Ferroelectricity and self-polarization in ultrathin relaxor ferroelectric films,” Scientific Reports 6, 19965 (2016), number: 1 Publisher: Nature Publishing Group.
- Belhadi et al. (2021) J. Belhadi, U. Gabor, H. Uršič, N. Daneu, J. Kim, Z. Tian, G. Koster, L. W. Martin, and M. Spreitzer, “Growth mode and strain effect on relaxor ferroelectric domains in epitaxial 0.67pb(mg1/3nb2/3)o3–0.33pbtio3/srruo3 heterostructures,” RSC Adv. 11, 1222–1232 (2021).
- Kim et al. (2017) S. Kim, D. Seol, X. Lu, M. Alexe, and Y. Kim, “Electrostatic-free piezoresponse force microscopy,” Scientific Reports 7, 41657 (2017), number: 1 Publisher: Nature Publishing Group.
- Stefani et al. (2020) C. Stefani, L. Ponet, K. Shapovalov, P. Chen, E. Langenberg, D. G. Schlom, S. Artyukhin, M. Stengel, N. Domingo, and G. Catalan, “Mechanical Softness of Ferroelectric 180 ° Domain Walls,” Physical Review X 10, 041001 (2020).
- Stefani et al. (2021) C. Stefani, E. Langenberg, K. Cordero-Edwards, D. G. Schlom, G. Catalan, and N. Domingo, “Mechanical reading of ferroelectric polarization,” Journal of Applied Physics 130, 074103 (2021).
- Godau et al. (2017) C. Godau, T. Kämpfe, A. Thiessen, L. M. Eng, and A. Haußmann, “Enhancing the Domain Wall Conductivity in Lithium Niobate Single Crystals,” ACS Nano 11, 4816–4824 (2017), publisher: American Chemical Society.
- Zhao et al. (2020) J. Zhao, C. Ma, M. Rüsing, and S. Mookherjea, “High Quality Entangled Photon Pair Generation in Periodically Poled Thin-Film Lithium Niobate Waveguides,” Physical Review Letters 124, 163603 (2020).
- Folkman et al. (2009) C. M. Folkman, S. H. Baek, H. W. Jang, C. B. Eom, C. T. Nelson, X. Q. Pan, Y. L. Li, L. Q. Chen, A. Kumar, V. Gopalan, and S. K. Streiffer, “Stripe domain structure in epitaxial (001) BiFeO3 thin films on orthorhombic TbScO3 substrate,” Applied Physics Letters 94, 251911 (2009), publisher: American Institute of Physics.
- Nelson et al. (2011) C. T. Nelson, B. Winchester, Y. Zhang, S.-J. Kim, A. Melville, C. Adamo, C. M. Folkman, S.-H. Baek, C.-B. Eom, D. G. Schlom, L.-Q. Chen, and X. Pan, “Spontaneous Vortex Nanodomain Arrays at Ferroelectric Heterointerfaces,” Nano Letters 11, 828–834 (2011), publisher: American Chemical Society.
- Alexe et al. (2001) M. Alexe, C. Harnagea, D. Hesse, and U. Gösele, “Polarization imprint and size effects in mesoscopic ferroelectric structures,” Applied Physics Letters 79, 242–244 (2001).
- Procter et al. (2015) R. A. Procter, F. Magnus, G. Andersson, C. Sánchez-Hanke, B. Hjörvarsson, and T. P. A. Hase, “Magnetic leverage effects in amorphous SmCo/CoAlZr heterostructures,” Applied Physics Letters 107, 062403 (2015).
- Thórarinsdóttir et al. (2021) K. A. Thórarinsdóttir, T. Hase, B. Hjörvarsson, and F. Magnus, “Amorphous exchange-spring magnets with crossed perpendicular and in-plane anisotropies,” Physical Review B 103, 014440 (2021).
- Salje, Hayward, and Lee (2005) E. K. H. Salje, S. A. Hayward, and W. T. Lee, “Ferroelastic phase transitions: structure and microstructure,” Acta Crystallographica Section A 61, 3–18 (2005).