MuLMS: A Multi-Layer Annotated Text Corpus
for Information Extraction in the Materials Science Domain
Abstract
Keeping track of all relevant recent publications and experimental results for a research area is a challenging task. Prior work has demonstrated the efficacy of information extraction models in various scientific areas. Recently, several datasets have been released for the yet understudied materials science domain. However, these datasets focus on sub-problems such as parsing synthesis procedures or on sub-domains, e.g., solid oxide fuel cells.
In this resource paper, we present MuLMS, a new dataset of 50 open-access articles, spanning seven sub-domains of materials science. The corpus has been annotated by domain experts with several layers ranging from named entities over relations to frame structures. We present competitive neural models for all tasks and demonstrate that multi-task training with existing related resources leads to benefits.
1 Introduction
Designing meaningful experiments in empirical sciences requires maintaining a detailed overview of the huge amounts of literature published every year. Applying natural language processing (NLP) in this context has risen to be an active research area (Chandrasekaran et al., 2020; Beltagy et al., 2021; Cohan et al., 2022). Besides the biomedical field, which has been studied extensively in the past decades (e.g., Collier et al., 2004; Cohen et al., 2012; Demner-Fushman et al., 2022), the less-studied materials science domain has recently received more attention (Mysore et al., 2019; Friedrich et al., 2020; O’Gorman et al., 2021).
Materials science research aims to design and discover new materials. Part of the papers is hence often dedicated to the synthesis procedures, the “recipe” for creating a material. Their extraction from papers has been covered by Mysore et al. (2019) and O’Gorman et al. (2021). Much materials science research develops materials in the context of creating a particular device, e.g., batteries or photovoltaic panels. The device is tested in various conditions and the literature needs to be analysed for identifying promising set-ups. Friedrich et al. (2020) address this for solid oxide fuel cells.
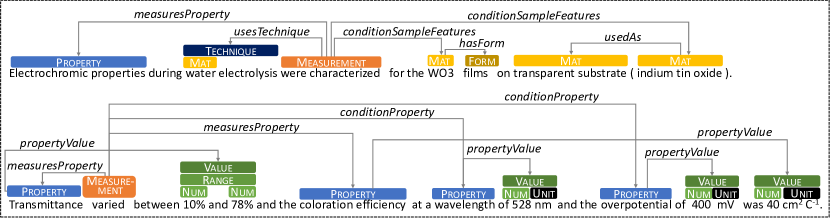
In this paper, we introduce MuLMS (the Multi-Layer Materials Science corpus), a new dataset of scientific publications annotated by domain experts with named entity (NE) mentions, relations, and frame structures corresponding to a broad notion of measurements (see Figure 1). In contrast to prior works, we include papers from a variety of materials science sub-domains. To the best of our knowledge, the existing datasets only annotate particular paragraphs or subsets of the sentences with NE mentions. Our dataset is the first to exhaustively annotate a large-scale collection of materials science articles with NEs and facilitates novel semantic search applications, e.g., answering search queries such as “find a passage within a paper reporting a measurement using material X, condition Y, and obtaining a value of at least Z.”
The design of MuLMS’ annotation scheme results from a collaboration of NLP and materials science experts. Our inter-annotator agreement study shows good agreement for most categories and decisions. We propose several machine learning tasks on the annotated data and present strong neural baselines for all tasks, which signals a high level of consistency across the annotations in our dataset. We cast detecting sentences describing measurements as a sentence classification task and provide a robust tagger for recognizing NEs. We propose to treat relation and semantic role extraction on MuLMS in a single step using a dependency parser that predicts relations between the NEs in a sentence. According to our multi-task experiments with related datasets, training jointly with MuLMS is beneficial for performance on those datasets.
Our contributions are as follows. (1) We publicly release a dataset of 50 open-access scientific publications exhaustively annotated by a domain expert with NE mentions, relations, and measurement frames.111https://github.com/boschresearch/mulms-wiesp2023 (2) We define a set of NLP tasks on MuLMS and provide strong transformer-based baselines. Our code will be published. (3) We formulate the relation and frame-argument extraction as a single dependency parsing task, which extracts all relations in a sentence in one processing step. (4) We perform an extensive set of multi-task learning experiments with related corpora, showing that MuLMS is a useful auxiliary task for two other materials science NLP datasets.
2 Related Work
Several materials science NLP datasets have recently been released, e.g., targeting NE recognition (Yamaguchi et al., 2020; O’Gorman et al., 2021). The Materials Science Procedural Text (MSPT) corpus (Mysore et al., 2019) consists of paragraphs describing synthesis procedures annotated with graph structures capturing relations and typed arguments. SOFC-Exp (Friedrich et al., 2020) marks similar graph structures describing experiments.
In this paper, we compare two state-of-the-art approaches to Named Entity Recognition (NER). Huang et al. (2015) use a CRF layer (Lafferty et al., 2001) on top of a neural language model (in their case a BiLSTM) for sequence-tagging related tasks. Yu et al. (2020) treat NER as a graph-based dependency parsing task by representing NEs as spans between the first and last token of an entity. In the materials science domain, Friedrich et al. (2020) test a variety of embedding combinations in a CRF-based tagger. O’Gorman et al. (2021) compare different pre-trained transformers for token classification. Both studies find SciBERT (Beltagy et al., 2019), a BERT-style model pre-trained on scientific documents, to be very effective.
Relation and Event Extraction. Friedrich et al. (2020) treat their slot filling task in the SOFC sub-domain as a sequence tagging task, assuming that each sentence represents at most one experiment. To predict a possible relation between two entities, Swarup et al. (2020) retrieve a set of sentences similar to the input sentence, and learn to copy relations from these sentences. Mysore et al. (2017) experiment with unsupervised methods for extracting action graphs for synthesis procedures.
An exhaustive overview of the literature on biomedical relation extraction is out of the scope of this paper. Recent works have used graph-neural networks (Huang et al., 2020), or convolutional neural networks (Ramponi et al., 2020). Sarrouti et al. (2022) compare various pre-trained transformer models. Semantic parsing of frame structures (Fillmore and Baker, 2001) has been addressed using graph-convolutional networks (Marcheggiani and Titov, 2020), BiLSTMs (He et al., 2018), and recently by generating structured output using encoder-decoder models (Hsu et al., 2022; Lu et al., 2021). Tackling semantic dependency parsing with a biaffine classifier architecture was first proposed by Dozat and Manning (2018).
3 MuLMS Corpus
In this section, we present our new corpus.
3.1 Source of Texts and Preprocessing
We select 50 scientific articles licensed under CC BY from seven popular sub-areas of materials science: electrolysis, graphene, polymer electrolyte fuel cell (PEMFC), solid oxide fuel cell (SOFC), polymers, semiconductors, and steel. The four SOFC papers were selected from the SOFC-Exp corpus Friedrich et al. (2020). 11 papers were selected from the OA-STM corpus222https://github.com/elsevierlabs/OA-STM-Corpus and classified into the above subject areas by a domain expert. The majority of the papers were found via PubMed333https://pubmed.ncbi.nlm.nih.gov and DOAJ444https://doaj.org using queries prepared by a domain expert. For the OA-STM data, we use the sentence segmentation provided with the corpus, which has been created using GENIA tools (Tsuruoka and Tsujii, 2005). For the remaining texts, we rely on the sentence segmentation provided by INCEpTION (Klie et al., 2018) with some manual fixes. As shown in Table 1, documents are rather long with a tendency to long sentences (but with high variation due to, i.a., short headings).
3.2 Annotation Scheme
We annotate various layers: NEs, relations, and frame structures representing measurements.
3.2.1 Named Entities
We annotate the following materials-science specific NE mentions and assign the following NE types to these mentions:
- Mat:
-
mentions of materials described by their chemical formula (WO3) or its chemical name (indium tin oxide).
- Form:
-
mentions of the form or morphology of the material, e.g., thin film, gas, liquid, cubic.
- Instrument:
-
mentions of devices used to perform a materials-science-related measurement, e.g., Olympus BX52 microscope.
- Device:
-
mentions of devices (target products) whose construction or improvement is the aim of the research (e.g., photodetector, transistor, supercapacitor). Device is not used for instrumentation devices that are only used as a tool.
- Num:
-
mentions of numbers such as 0.46.
- Unit:
-
mentions of units such as nm or V.
- Range:
-
mentions of numeric expressions indicating ranges, e.g., 0.46.11
- Value:
-
nested type capturing expressions of values usually composed of a Num, Range and a Unit, e.g., ~5 x 3mm2
- Cite:
-
citations, e.g., Setman et al. or [13].
- Property:
-
expressions referring to properties of materials or conditions in experiments, e.g., stress rate or electron conductivity.
- Technique:
-
mentions of experimental techniques used in the characterization steps, e.g., Scanning electron microscopy (SEM).
- Sample:
-
mention of the material or a component made of materials studied in a measurement, either referred to by a particular name or its composition, its batch name (Aq-825) or by referring to the whole component (MEA-Pt/C) or to part of the material’s structure (ionomer patches). In simulation papers, the Sample may also be the computational model under study (RBF-ANN).
| #Documents | 50 |
|---|---|
| #Documents train / dev / test | 36 / 7 / 7 |
| #Sentences | 10186 |
| #Sentences/Document | 203.773.2 |
| #Tokens/Sentence | 28.717.9 |
3.2.2 Relations and Measurement Frame
We treat measurement annotation in a frame-like (Fillmore and Baker, 2001) fashion, using the span type Measurement to mark the triggers (e.g., was measured, is plotted) that introduce the Measurement frame to the discourse. About 88% of the triggers are verbs. The remaining 12% occur in figure captions without verb phrases and are annotated either on nouns (Comparison) or, in absence of more suitable phrases, on figure labels such as Figure 17. The trigger annotations of these sentences serve as the root of the tree/graph annotations as illustrated in Figure 1.
There are also cases in which the Measurement frame is evoked, but there are no technical details or results that we can extract about the measurement. We mark the triggers of these sentences with the tag Qual_Meas (qualitative mention of a measurement). An example of such a sentence is “We compare a critical volume to be detached from the different nanostructures.”
Measurement-related Relations. We annotate several relations that start at a Measurement tag and that end at the annotations of the corresponding slot fillers within the sentence. Consider the following sentence: “To characterize the ORR activity of the catalyst, linear scan voltammetry (LSV) was tested from 0 to 1.2 V on an RDE with a scan rate of 50 mV/s in O2-saturated HClO4 solution.”
- measuresProperty:
-
indicates the Property (e.g., ORR activity) that is measured.
- conditionSampleFeatures:
-
indicates the Sample or Material whose property is measured. In the above example, the sample is the catalyst.
- usesTechnique:
-
relates to the Technique (e.g., linear scan voltammetry) used in a measurement.
- conditionInstrument:
-
refers to the Instrument used to make a measurement, e.g., RDE/rotating disk electrode.
- conditionProperty:
-
a property that is a condition in the experiment, e.g., scan rate (which in turn has the propertyValue of 50 mv/s).
- propertyValue:
-
connects the mention of a Property and that of its corresponding Value. This relation may also occur if a mention of a Property occurs independently of a measurement.
- conditionEnvironment:
-
identifies the Materials (e.g., O2 and HClO4) and Values (e.g., an operating temperature of 30°C) that provide the environment of the measurement.
- takenFrom:
-
connects the Measurement with the bibliographic reference Cite from which the setup has been inspired or taken over.
In most cases, a conditionProperty or a measuresProperty connects the Measurement annotation to a Property node, at which a propertyValue relation starts that ends at the respective Value. However, in some cases, the condition or measured property is not mentioned explicitly. In this case, we link the Value directly to the Measurement node via a conditionPropertyValue or a measuresPropertyValue link. For consistency reasons, we also add these links in cases that mention the property explicitly, turning the trees into graph structures. Out of the added conditionPropertyValue links, 967 are for such explicit cases, while the other 206 describe implicit cases. In the case of measuresPropertyValue, 722 links are for explicit cases and 36 for implicit cases.
| Relation | Example |
|---|---|
| hasForm | siliconMat–hasForm hexagonalForm |
| usedIn | SicMat –usedIn MOSFETDevice |
| usedAs | PtNi3MMat –usedAs catalysts |
| dopedBy | chlorinatedMaterial–dopedBySiCMat |
| Label | Count | % | Label | Count | % |
|---|---|---|---|---|---|
| Mat | 15596 | 33.6 | Cite | 1709 | 3.7 |
| Num | 6081 | 13.1 | Sample | 1461 | 3.2 |
| Value | 4852 | 10.5 | Technique | 1036 | 2.2 |
| Unit | 4330 | 9.3 | Dev | 808 | 1.7 |
| Property | 3925 | 8.5 | Range | 736 | 1.6 |
| Form | 3568 | 7.7 | Instrument | 378 | 0.8 |
| Measurement | 2171 | 4.7 | total | 46,351 | - |
Further Relations.
In the following, we explain relations that can appear independently of measurements. Examples are shown in Table 2.
- hasForm:
-
connects mention of Material and the corresponding Form annotation.
- usedIn:
-
connects Material and the Device it is used in. In Table 2, MOSFET stands for Metal Oxide Semiconductor Field-Effect Transistors.
- usedAs:
-
links a specific Material mention with a more generic one such as catalyst, a material class defined by its function.
- dopedBy:
-
indicates dopants (e.g., chlorine), i.e., impurities added to a main material (e.g., SiC).
- usedTogether:
-
connects two Materials if they are used together in an experiment, i.e., if the materials are part of an assembly or a mixture.
3.3 Corpus Statistics
We now analyze our corpus and provide detailed corpus statistics. In total, there are 46,351 NE annotations. Table 3 shows the counts by NE label. There are roughly 1.5 MAT annotations per sentence as these are nested and occurrences of composite materials often result in many combined MAT tags. Table 4 reports the counts of annotated relations (16,794 in total), with hasForm as the most frequent relation with 2910 instances and dopedBy the least frequent with only 65 instances.
| Label | Count | % | Label | Count | % |
|---|---|---|---|---|---|
| hasForm | 2910 | 17.3 | meas.Prop.Val. | 751 | 4.5 |
| measuresProperty | 2080 | 12.4 | usedTogether | 672 | 4.0 |
| usedAs | 1839 | 11.0 | conditionEnv. | 549 | 3.3 |
| propertyValue | 1794 | 10.7 | usedIn | 434 | 2.6 |
| conditionProperty | 1648 | 9.8 | conditionInstr. | 357 | 2.2 |
| conditionSample | 1434 | 8.5 | takenFrom | 118 | 0.7 |
| cond.Prop.Value | 1158 | 6.9 | dopedBy | 65 | 0.4 |
| usesTechnique | 985 | 5.9 | total | 16,794 | |
| MEAS | QUAL_MEAS | OTHER | |
|---|---|---|---|
| MEAS | 48 | 6 | 6 |
| QUAL_MEAS | 12 | 37 | 11 |
| OTHER | 10 | 17 | 92 |
Out of all 10186 sentences, 2111 (20.7%) describe a measurement (i.e., they contain at least one Measurement annotation). On average, each document contains 43.4 Measurement annotations. In addition, there are 1476 sentences (14.5%) marked as containing a Qual_Meas, with 40 sentences of these also containing a Measurement annotation.
3.4 Inter-Annotator Agreement (IAA)
Our entire dataset has been annotated by a graduate student of materials science, who was also involved in the design of the annotation scheme. We perform two agreement studies, comparing to the annotations of a second annotator with a PhD degree in environment engineering and several years of experience in materials science research.
Agreement on identifying Measurement sentences. In this agreement study, we estimate the degree of agreement whether a sentence expresses a Measurement, a Qual_Meas, or whether it does not express a measurement at all. We sample 60 sentences marked with Measurement, 60 sentences marked with Qual_Meas, and 120 sentences not marked as either by the first annotator. Table 5 shows the confusion matrix for the 239 sentences for which both annotators provided a label. One automatically selected sentence was not labeled by one of the annotators due to incomprehensibility. In terms of Cohen’s (Cohen, 1960), agreement amounts to 59.2, indicating moderate to substantial agreement (Landis and Koch, 1977). When collapsing Measurement and Qual_Meas, is 63.4 (substantial).
| Label | P | R | F1 | Label | P | R | F1 |
|---|---|---|---|---|---|---|---|
| Mat | 96.7 | 91.2 | 93.9 | Cite | 97.4 | 97.4 | 97.4 |
| Num | 98.9 | 100.0 | 99.4 | Sample | 3.1 | 12.5 | 4.7 |
| Value | 100 | 100 | 100.0 | Techn. | 77.5 | 59.6 | 67.4 |
| Unit | 97.9 | 100.0 | 98.9 | Device | 96.0 | 82.8 | 88.9 |
| Property | 42.6 | 37.7 | 40.0 | Range | 100.0 | 100.0 | 100.0 |
| Form | 95.7 | 86.3 | 90.8 | Instr. | 80.0 | 76.9 | 78.4 |
| Meas. | 44.6 | 51.0 | 47.6 | average | 79.3 | 76.6 | 77.9 |
Agreement on named entities. We next compute agreement for NE and relation annotations. IAA on “easy” types such as Mat, Num, Unit, Value and Range has been shown to be very high in prior work (Friedrich et al., 2020). Hence, as our resources are limited, we provide annotations of these types for correction to the second annotator. We sample 134 sentences such that each entity type occurs at least 25 times in the annotations of the first annotator and have the second annotator correct or add entity annotations. We then compare the annotated sets of NE mentions using precision and recall (for a justification of this choice of agreement metrics, see Appendix C). Results using relaxed matching (containment) are shown in Table 6 (detailed counts in Appendix C). For most types, scores are in the expected range of difficult semantic annotation tasks. Agreement on identifying Measurement sentences is good; the decision of where exactly to place the Measurement annotation differs between annotators.
| Label | P | R | F1 | matches | |
|---|---|---|---|---|---|
| propertyValue | 81.2 | 81.2 | 81.2 | 0.88 | 26 |
| condSampleFeat. | 43.1 | 40.0 | 41.5 | 0.23 | 22 |
| usedIn | 40.0 | 52.2 | 45.3 | 0.55 | 12 |
| usesTechnique | 72.9 | 67.3 | 70.0 | 0.86 | 35 |
| hasForm | 54.7 | 71.4 | 61.9 | 0.64 | 35 |
| takenFrom | 33.3 | 63.6 | 43.7 | 0.57 | 7 |
| measuresProp. | 80.5 | 72.9 | 76.5 | 0.80 | 70 |
| dopedBy | 35.3 | 50.0 | 41.4 | 0.25 | 6 |
| conditionProp. | 27.7 | 59.1 | 37.7 | 0.31 | 13 |
| conditionInstr. | 24.0 | 60.0 | 34.3 | 0.44 | 6 |
| conditionEnv. | 0.0 | 0.0 | 0.0 | 0.00 | 0 |
| usedAs | 23.5 | 85.7 | 36.9 | 0.37 | 12 |
| usedTogether | 13.8 | 28.6 | 18.6 | 0.20 | 4 |
Agreement on relations. We sample 178 sentences in which each relation occurs at least 25 times according to the first annotator. We keep NE annotations and ask the second annotator to add relations. Table 7 shows the results in terms of precision, recall, and per relation type. The latter has been computed by treating all pairs of NE annotations as potential relations, using if no relation has been annotated. Overall on relations is 0.61 (substantial). For each relation label, we can map all other relation types to and compute agreement for the binary decision whether the label is present or not (analysis suggested by Krippendorff (1989)). aims to quantify the degree of agreement above chance. Interpreting our scores according to the scale of Landis and Koch (1977), we reach at fair agreement for conditionPropertyValue, usedTogether, conditionSampleFeatures, dopedBy, and usedAs. We reach moderate agreement for usedIn, takenFrom, and conditionInstrument. For the practically important relations propertyValue, measuresProperty, and usesTechnique, we even reach almost perfect agreement.
For the non-easily identifiable types, post-hoc discussion with the second annotator (who did not receive an extensive training on the task) concluded it was not always clear to them when using related labels (e.g., conditionProperty and conditionEnvironment). Yet, these labels can be learned with good or acceptable accuracy (see Appendix E), indicating that the primary annotator has used the labels consistently.
4 Task Definitions and Modeling
In this section, we define several NLP tasks for MuLMS and describe our computational models.
4.1 Pre-trained Models
We use BERT (Devlin et al., 2019) as the underlying text encoder for all of our models. We also use variants of BERT, namely SciBERT (Beltagy et al., 2019), which has been pre-trained on articles in the scientific domain, and MatSciBERT (Gupta et al., 2022), a version of SciBERT further pre-trained on materials science articles. We use the uncased, 768-dimensional variant of each model, which we fine-tune.
4.2 Detecting Measurements
We model the task of classifying whether a sentence contains a Measurement or a Qual_Meas annotation as a ternary sentence classification task, i.e., it is also possible that a sentence does not refer to any measurement. As we are primarily interested in detecting Measurement, we map the few multi-label cases carrying both positive labels to Measurement. We use a linear layer plus softmax with the CLS token embedding as input. For training, we downsample the amount of non-measurement sentences.
4.3 Named Entity Recognition (NER)
We compare two state-of-the-art models for NER, (a) a sequence tagger and (b) a dependency parser. For the sequence tagger, we encode the NE labels using the nested BILOU scheme (Alex et al., 2007), which leverages a label set of combined types constructed from the training set for nested NEs. As there are only very few cases (about 0.65% of all NE annotations) where a token receives more than three stacked NE labels, in order to avoid sparsity issues, we consider only the “bottom” three layers of stacked entities. We feed the contextualized embeddings of the last transformer layer of the respective first wordpiece token of each “real” token into a linear layer and then use a CRF (Lafferty et al., 2001) to optimize predictions for the entire sequence.
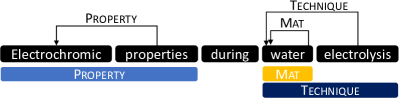
Modeling NER as a dependency parsing task (Yu et al., 2020) can easily account for nested NEs. The main idea is to predict edges reaching from the end token of an NE to its start token as depicted in Figure 2. We adapt the STEPS parsing pipeline (Grünewald et al., 2021a) to the task. There are three combinations of tags in our dataset that occasionally cover the exact same span and that occur more than 20 times: Value+Num, Value+Range and Mat+Form. We hence introduce the above combined labels. For any other infrequent conflicting labels, we do not add extra tags, i.e., the model can never catch these cases. We decide on this slight restriction of the model capabilities in order to avoid sparsity issues. In the evaluation, we do not filter for these cases but of course use all nested NEs as annotated.
4.4 Relation Extraction
Given an input sentence along with all named entities within it, as well as their types (either gold or predicted depending on the experimental setting), we predict which (if any) relation is present between them. We treat all relations in a single model and predict all relations of a sentence simultaneously by modeling relation extraction as a graph parsing task. Following Toshniwal et al. (2020), we first create an embedding for the th NE in the sentence by concatenating the token embeddings of its first and last token (, ). We also concatenate a learned embedding for the NE’s label ():
Considering NEs as nodes in a graph, we use a biaffine classifier architecture (Dozat and Manning, 2017) using the implementation of Grünewald et al. (2021a, b) to predict the relation between each pair. The non-existence of a relation is encoded as simply another label (). For details on the parser architecture, see Appendix B.
5 Experiments
We now detail our experimental results.
Experimental Settings. We split our corpus into train, dev, and test sets on a per-document basis. Within the train set, we provide five distinct tune splits (train1 to train5). For all experiments and for hyperparameter tuning, we always train five models. Similar to cross-validation, we train on four folds and use the fifth “training fold” for model selection (cf. van der Goot (2021) for details). Hyperparameters are chosen based on the best dev results, and we finally report results for the test set. The splits are the same across all tasks. Because the training data varies across the five runs for which we report results, standard deviations are usually larger than when using the same training data. For hyperparameter settings, see Appendix A.
5.1 Identifying Measurement Sentences
Table 8 reports the results for identifying sentences that contain a Measurement or a Qual_Meas annotation. In each experiment, we tune the downsampling rate for the majority class Other and the learning rate (using grid search from 1e-4 to 1e-7). The random baseline assigns labels according to the percentage of instances in the (full) training set carrying a particular label. The average overall accuracy of the MatSciBERT classifier is . SciBERT and MatSciBERT perform similarly, with MatSciBERT having a small edge. Identification of Measurement is comparable to our estimate of human agreement. For identifying Qual_Meas, there is headroom.
| Measurement | Qual_Meas | |||||
| LM (sampling) | P | R | F1 | P | R | F1 |
| Random baseline | 24.7 | 19.7 | 21.9±2.4 | 15.1 | 14.4 | 14.7±1.5 |
| BERT(0.7) | 74.1 | 71.4 | 72.5±2.1 | 49.9 | 51.6 | 50.6±0.7 |
| SciBERT(0.7) | 71.1 | 79.5 | 75.0±0.7 | 52.7 | 52.8 | 52.7±1.4 |
| MatSciBERT(0.85) | 70.6 | 80.1 | 74.9±1.3 | 52.8 | 56.9 | 54.7±1.0 |
| human agreement* | 68.6 | 80.9 | 73.8 | 61.7 | 61.7 | 61.7 |
*estimated on subset of data.
| Model | LM | Micro F1 | Macro F1 |
|---|---|---|---|
| Dependency | BERT | 73.0±0.7 | 61.7±2.3 |
| Parser | SciBERT | 76.5±0.3 | 65.8±0.9 |
| MatSciBERT | 77.3±0.3 | 67.6±1.4 | |
| CRF Tagger | BERT | 75.3±0.6 | 63.2±0.7 |
| SciBERT | 78.7±0.4 | 69.3±1.0 | |
| MatSciBERT | 79.6±0.4 | 70.7±0.7 |
5.2 Named Entity Recognition Results
Table 9 shows the results for named entity recognition. Again, MatSciBERT performs best with Micro F1 scores approaching 80, which indicates that NE mentions are consistently annotated in MuLMS. The CRF-based tagger outperforms the dependency-parser-based NER model by a considerable margin. For detailed per-label statistics, see Appendix E. Precision and recall are approximately balanced for all labels. An exception is Sample, which is both infrequent in the dataset and hard to identify for humans. Both models suffer from low recall for this tag.
| dev | test | |||
| LM | Micro F1 | Macro F1 | Micro F1 | Macro F1 |
| Maj. basel. | 38.3±0.0 | 29.4±0.0 | 37.2±0.0 | 27.4±0.0 |
| BERT | 69.5±0.5 | 63.4±1.0 | 63.5±0.6 | 57.7±1.1 |
| SciBERT | 72.5±0.8 | 65.7±0.6 | 67.5±0.9 | 62.0±2.2 |
| MatSciBERT | 73.2±1.0 | 66.5±1.1 | 67.6±1.0 | 62.0±1.0 |
5.3 Relation Extraction Results
Table 10 shows the results for relation extraction on gold entities. A predicted relation is counted as correct if and only if there is a relation with the same start span, end span, and relation label in the set of gold relations for the sentence. The majority baseline assigns to each pair of entities the relation that is most common in the training set for the respective entity types of the governing and dependent spans (see Appendix E).
The results demonstrate that a biaffine dependency parsing approach achieves robust performance overall and outperforms the baseline by a substantial margin. The two models trained on scientific text outperform BERT. Their results are similar, with MatSciBERT having a slight edge.
Analysis of per-label scores (see Appendix E) for MatSciBERT) shows that the highest scores are achieved for conditionInstrument (92.2 F1), usesTechnique (91.0 F1), and takenFrom (84.7). This is somewhat surprising especially for conditionInstrument and takenFrom, as these are among the rarest relation types in the corpus (see Table 4). However, our majority baseline achieves high accuracies on these relation types as well (>90 F1 for conditionInstrument and usesTechnique), i.e., they are easily inferable from entity types. The worst performance is observed on the relation types usedTogether (4.0 F1), dopedBy (22.7 F1), and usedIn (37.9 F1). These relations occur relatively rarely and also cannot be inferred from entity types.
Relation extraction on predicted entities. Finally, we also run our relation extraction module on predicted named entities using the respective best-performing models (both based on MatSciBERT). Models are evaluated as above, with the additional requirement that the boundaries of start/end spans of a predicted relation must also exactly match those of the respective gold spans. Prediction accuracy drops substantially: to micro-F1 scores of 42.5 and 36.5 on dev and test, respectively, corresponding to macro-F1 scores of 37.9 and 32.8. The reason for this is error propagation as relations can only be retrieved if the entities are predicted correctly, and as incorrectly labeled entities can mislead the relation classifier.
| Dataset | LR | Micro F1 | Macro F1 |
|---|---|---|---|
| MuLMS | 1e-4/7e-3 | 79.6±0.4 | 70.7±0.7 |
| SOFC-Exp | 79.5±0.4 | 70.4±1.3 | |
| MSPT | 79.2±0.6 | 69.9±0.8 | |
| SOFC-Exp | 3e-4/7e-3 | 83.4±0.9 | 81.0±1.0 |
| MuLMS | 81.9±1.7 | 79.6±1.7 | |
| MSPT | 5e-5/9e-3 | 81.6±0.4 | 57.8±0.6 |
| MuLMS | 80.4±0.4 | 56.4±0.8 |
5.4 Multi-Task Learning Across Datasets
To find out whether information extraction accuracy can be increased by employing multi-task learning (MTL), we perform a series of experiments in which we combine MuLMS training data with NE and relation data from other materials science datasets, namely the SOFC-Exp and MSPT corpora (see Sec. 2).555We removed one document from the test split of the SOFC-Exp corpus that is also part of the train set of MuLMS. In all experiments, we use a shared MatSciBERT and one classification head for each task (dataset). When reporting results on MuLMS, we use the same setup as before, but add the complete training sets of SOFC-Exp or MSPT during training. When reporting results on SOFC and MSPT, we train on all of their training data and the complete training data of MuLMS and perform early stopping on dev. For these experiments, reported scores are averages over 5 runs with different random seeds.
For NER (Table 11), we do not observe overall improvements. We hypothesize that this is because in SOFC-Exp, NE types are much coarser-grained, and in MSPT, NE annotations are focused on synthesis procedure paragraphs only. Nevertheless, as can be seen by the per-label scores in Appendix E, average scores on MuLMS are mainly hurt by decreases on Sample, while scores for Range increase considerably by up to 3.9%.
| dev | test | |||
| Dataset | Micro F1 | Macro F1 | Micro F1 | Macro F1 |
| MuLMS | 73.2±1.0 | 66.5±1.1 | 67.6±1.0 | 62.0±1.0 |
| + SOFC | 72.5±0.9 | 65.8±0.7 | 68.1±0.7 | 61.1±0.7 |
| + MSPT | 73.9±0.4 | 67.4±0.4 | 68.7±0.7 | 63.7±0.7 |
| SOFC-Exp | 71.3±0.6 | 62.8±2.1 | 66.9±1.6 | 59.8±1.5 |
| + MuLMS | 72.3±0.5 | 64.3±3.7 | 68.7±1.5 | 60.9±3.6 |
| + MSPT | 72.3±0.9 | 63.1±2.6 | 67.6±2.0 | 60.8±4.3 |
| MSPT | 84.2±0.6 | 82.5±0.7 | 84.6±0.8 | 83.0±0.8 |
| + MuLMS | 85.3±0.2 | 83.4±0.8 | 85.6±0.4 | 84.1±0.6 |
| + SOFC | 83.7±1.4 | 81.8±1.4 | 84.7±1.1 | 83.2±1.4 |
Results for MTL for relations are shown in Table 12. We observe that adding MuLMS to the training data of both SOFC-Exp and MSPT results in improvements. Incorporating SOFC-Exp instances in the training does not meaningfully increase prediction accuracy on MuLMS, whereas incorporating instances from MSPT leads to modest improvements. Intuitively, this makes sense: relations in SOFC-Exp focus on a specific type of experiment, while MuLMS covers a broader range of measurements. Similarly, some MuLMS relations bear resemblance to MSPT relations (e.g., those dealing with instruments or apparatus), which explains why training jointly is beneficial.
6 Conclusion and Outlook
In this resource paper, we have presented a new large-scale dataset of 50 scientific articles in the domain of materials science exhaustively annotated with named entity mentions, relations, and measurement-related frames. Our inter-annotator agreement study shows good agreement for most decisions. Our experiments with state-of-the-art neural models highlight that most distinctions can be learned with good accuracy, and that synergies can be achieved by training jointly with existing more specific materials-science NLP datasets.
Future work is needed to improve on end-to-end or joint models of NER and relation extraction as our experiments showed that a pipeline-based setting suffers from error propagation. A potential next step is to adapt sequence-to-sequence models to the structure induction tasks of MuLMS, following ideas of (Hsu et al., 2022; Lu et al., 2021). Finally, employing data augmentation techniques in particular for the less frequent relation types is a viable path for future work.
Limitations
As discussed in Sec. 3.4, we expect our inter-annotator agreement scores to underestimate the reproducibility of the task. It is, unfortunately, not trivial to find annotators with the required background knowledge. Hence, scores reflect agreement after only an initial very brief training phase, but nevertheless (in our opinion) give useful insights on the relative difficulty of the labeling decisions.
In our relation extraction experiments, we use label embeddings based on either gold or predicted entity labels (depending on the experimental setup) as an input to our system. Providing gold entity label information in particular constitutes a setting that is considerably easier for a relation classifier than providing no label information. Using predicted entity mention and labels showed to suffer from error propagation. In future work, it may be interesting to evaluate the performance of a relation extraction system that is not given label information, or that predicts entity labels jointly with relations.
Ethical Considerations
The annotators participating in our project were completely aware of the goal of the annotations and even helped designing the annotation scheme. They gave explicit consent to the publication of their annotations. The main annotator was paid considerably above our country’s minimum wage.
References
- Alex et al. (2007) Beatrice Alex, Barry Haddow, and Claire Grover. 2007. Recognising nested named entities in biomedical text. In Biological, translational, and clinical language processing, pages 65–72, Prague, Czech Republic. Association for Computational Linguistics.
- Beltagy et al. (2021) Iz Beltagy, Arman Cohan, Guy Feigenblat, Dayne Freitag, Tirthankar Ghosal, Keith Hall, Drahomira Herrmannova, Petr Knoth, Kyle Lo, Philipp Mayr, Robert M. Patton, Michal Shmueli-Scheuer, Anita de Waard, Kuansan Wang, and Lucy Lu Wang, editors. 2021. Proceedings of the Second Workshop on Scholarly Document Processing. Association for Computational Linguistics, Online.
- Beltagy et al. (2019) Iz Beltagy, Kyle Lo, and Arman Cohan. 2019. SciBERT: A pretrained language model for scientific text. In Proceedings of the 2019 Conference on Empirical Methods in Natural Language Processing and the 9th International Joint Conference on Natural Language Processing (EMNLP-IJCNLP), pages 3615–3620, Hong Kong, China. Association for Computational Linguistics.
- Brandsen et al. (2020) Alex Brandsen, Suzan Verberne, Milco Wansleeben, and Karsten Lambers. 2020. Creating a dataset for named entity recognition in the archaeology domain. In Proceedings of the Twelfth Language Resources and Evaluation Conference, pages 4573–4577, Marseille, France. European Language Resources Association.
- Chandrasekaran et al. (2020) Muthu Kumar Chandrasekaran, Anita de Waard, Guy Feigenblat, Dayne Freitag, Tirthankar Ghosal, Eduard Hovy, Petr Knoth, David Konopnicki, Philipp Mayr, Robert M. Patton, and Michal Shmueli-Scheuer, editors. 2020. Proceedings of the First Workshop on Scholarly Document Processing. Association for Computational Linguistics, Online.
- Cohan et al. (2022) Arman Cohan, Guy Feigenblat, Dayne Freitag, Tirthankar Ghosal, Drahomira Herrmannova, Petr Knoth, Kyle Lo, Philipp Mayr, Michal Shmueli-Scheuer, Anita de Waard, and Lucy Lu Wang, editors. 2022. Proceedings of the Third Workshop on Scholarly Document Processing. Association for Computational Linguistics, Gyeongju, Republic of Korea.
- Cohen (1960) Jacob Cohen. 1960. A coefficient of agreement for nominal scales. Educational and Psychological Measurement, 20(1):37–46.
- Cohen et al. (2012) Kevin B. Cohen, Dina Demner-Fushman, Sophia Ananiadou, Bonnie Webber, Jun’ichi Tsujii, and John Pestian, editors. 2012. BioNLP: Proceedings of the 2012 Workshop on Biomedical Natural Language Processing. Association for Computational Linguistics, Montréal, Canada.
- Collier et al. (2004) Nigel Collier, Patrick Ruch, and Adeline Nazarenko, editors. 2004. Proceedings of the International Joint Workshop on Natural Language Processing in Biomedicine and its Applications, NLPBA/BioNLP 2004, Geneva, Switzerland, August 28-29, 2004.
- Demner-Fushman et al. (2022) Dina Demner-Fushman, Kevin Bretonnel Cohen, Sophia Ananiadou, and Junichi Tsujii, editors. 2022. Proceedings of the 21st Workshop on Biomedical Language Processing. Association for Computational Linguistics, Dublin, Ireland.
- Devlin et al. (2019) Jacob Devlin, Ming-Wei Chang, Kenton Lee, and Kristina Toutanova. 2019. BERT: Pre-training of deep bidirectional transformers for language understanding. In Proceedings of the 2019 Conference of the North American Chapter of the Association for Computational Linguistics: Human Language Technologies, Volume 1 (Long and Short Papers), pages 4171–4186, Minneapolis, Minnesota. Association for Computational Linguistics.
- Dozat and Manning (2017) Timothy Dozat and Christopher D. Manning. 2017. Deep biaffine attention for neural dependency parsing. In International Conference on Learning Representations.
- Dozat and Manning (2018) Timothy Dozat and Christopher D. Manning. 2018. Simpler but more accurate semantic dependency parsing. In Proceedings of the 56th Annual Meeting of the Association for Computational Linguistics (Volume 2: Short Papers), pages 484–490, Melbourne, Australia. Association for Computational Linguistics.
- Fillmore and Baker (2001) Charles J Fillmore and Collin F Baker. 2001. Frame semantics for text understanding. In Proceedings of WordNet and Other Lexical Resources Workshop, NAACL, volume 6.
- Friedrich et al. (2020) Annemarie Friedrich, Heike Adel, Federico Tomazic, Johannes Hingerl, Renou Benteau, Anika Marusczyk, and Lukas Lange. 2020. The SOFC-exp corpus and neural approaches to information extraction in the materials science domain. In Proceedings of the 58th Annual Meeting of the Association for Computational Linguistics, pages 1255–1268, Online. Association for Computational Linguistics.
- Grünewald et al. (2021a) Stefan Grünewald, Annemarie Friedrich, and Jonas Kuhn. 2021a. Applying occam’s razor to transformer-based dependency parsing: What works, what doesn’t, and what is really necessary. In Proceedings of the 17th International Conference on Parsing Technologies and the IWPT 2021 Shared Task on Parsing into Enhanced Universal Dependencies (IWPT 2021), pages 131–144, Online. Association for Computational Linguistics.
- Grünewald et al. (2021b) Stefan Grünewald, Frederik Tobias Oertel, and Annemarie Friedrich. 2021b. RobertNLP at the IWPT 2021 shared task: Simple enhanced UD parsing for 17 languages. In Proceedings of the 17th International Conference on Parsing Technologies and the IWPT 2021 Shared Task on Parsing into Enhanced Universal Dependencies (IWPT 2021), pages 196–203, Online. Association for Computational Linguistics.
- Gupta et al. (2022) Tanishq Gupta, Mohd Zaki, N. M. Anoop Krishnan, and Mausam. 2022. MatSciBERT: A materials domain language model for text mining and information extraction. npj Computational Materials, 8(1):102.
- He et al. (2018) Luheng He, Kenton Lee, Omer Levy, and Luke Zettlemoyer. 2018. Jointly predicting predicates and arguments in neural semantic role labeling. In Proceedings of the 56th Annual Meeting of the Association for Computational Linguistics (Volume 2: Short Papers), pages 364–369, Melbourne, Australia. Association for Computational Linguistics.
- Hripcsak and Rothschild (2005) George Hripcsak and Adam S Rothschild. 2005. Agreement, the f-measure, and reliability in information retrieval. Journal of the American medical informatics association, 12(3):296–298.
- Hsu et al. (2022) I-Hung Hsu, Kuan-Hao Huang, Elizabeth Boschee, Scott Miller, Prem Natarajan, Kai-Wei Chang, and Nanyun Peng. 2022. DEGREE: A data-efficient generation-based event extraction model. In Proceedings of the 2022 Conference of the North American Chapter of the Association for Computational Linguistics: Human Language Technologies, pages 1890–1908, Seattle, United States. Association for Computational Linguistics.
- Huang et al. (2020) Kung-Hsiang Huang, Mu Yang, and Nanyun Peng. 2020. Biomedical event extraction with hierarchical knowledge graphs. In Findings of the Association for Computational Linguistics: EMNLP 2020, pages 1277–1285, Online. Association for Computational Linguistics.
- Huang et al. (2015) Zhiheng Huang, Wei Xu, and Kai Yu. 2015. Bidirectional LSTM-CRF models for sequence tagging. In CorRR, volume abs/1508.01991.
- Klie et al. (2018) Jan-Christoph Klie, Michael Bugert, Beto Boullosa, Richard Eckart de Castilho, and Iryna Gurevych. 2018. The INCEpTION platform: Machine-assisted and knowledge-oriented interactive annotation. In Proceedings of the 27th International Conference on Computational Linguistics: System Demonstrations, pages 5–9, Santa Fe, New Mexico. Association for Computational Linguistics.
- Kondratyuk and Straka (2019) Dan Kondratyuk and Milan Straka. 2019. 75 languages, 1 model: Parsing Universal Dependencies universally. In Proceedings of the 2019 Conference on Empirical Methods in Natural Language Processing and the 9th International Joint Conference on Natural Language Processing (EMNLP-IJCNLP), pages 2779–2795, Hong Kong, China. Association for Computational Linguistics.
- Krippendorff (1989) Klaus Krippendorff. 1989. Content analysis.
- Lafferty et al. (2001) John D. Lafferty, Andrew McCallum, and Fernando C. N. Pereira. 2001. Conditional random fields: Probabilistic models for segmenting and labeling sequence data. In Proceedings of the Eighteenth International Conference on Machine Learning (ICML 2001), Williams College, Williamstown, MA, USA, June 28 - July 1, 2001, pages 282–289. Morgan Kaufmann.
- Landis and Koch (1977) J Richard Landis and Gary G Koch. 1977. An application of hierarchical kappa-type statistics in the assessment of majority agreement among multiple observers. Biometrics, pages 363–374.
- Loshchilov and Hutter (2019) Ilya Loshchilov and Frank Hutter. 2019. Decoupled weight decay regularization.
- Lu et al. (2021) Yaojie Lu, Hongyu Lin, Jin Xu, Xianpei Han, Jialong Tang, Annan Li, Le Sun, Meng Liao, and Shaoyi Chen. 2021. Text2Event: Controllable sequence-to-structure generation for end-to-end event extraction. In Proceedings of the 59th Annual Meeting of the Association for Computational Linguistics and the 11th International Joint Conference on Natural Language Processing (Volume 1: Long Papers), pages 2795–2806, Online. Association for Computational Linguistics.
- Marcheggiani and Titov (2020) Diego Marcheggiani and Ivan Titov. 2020. Graph convolutions over constituent trees for syntax-aware semantic role labeling. In Proceedings of the 2020 Conference on Empirical Methods in Natural Language Processing (EMNLP), pages 3915–3928, Online. Association for Computational Linguistics.
- Mysore et al. (2019) Sheshera Mysore, Zachary Jensen, Edward Kim, Kevin Huang, Haw-Shiuan Chang, Emma Strubell, Jeffrey Flanigan, Andrew McCallum, and Elsa Olivetti. 2019. The materials science procedural text corpus: Annotating materials synthesis procedures with shallow semantic structures. In Proceedings of the 13th Linguistic Annotation Workshop, pages 56–64, Florence, Italy. Association for Computational Linguistics.
- Mysore et al. (2017) Sheshera Mysore, Edward Kim, Emma Strubell, Ao Liu, Haw-Shiuan Chang, Srikrishna Kompella, Kevin Huang, Andrew McCallum, and Elsa Olivetti. 2017. Automatically extracting action graphs from materials science synthesis procedures. NIPS Workshop on Machine Learning for Molecules and Materials.
- O’Gorman et al. (2021) Tim O’Gorman, Zach Jensen, Sheshera Mysore, Kevin Huang, Rubayyat Mahbub, Elsa Olivetti, and Andrew McCallum. 2021. MS-mentions: Consistently annotating entity mentions in materials science procedural text. In Proceedings of the 2021 Conference on Empirical Methods in Natural Language Processing, pages 1337–1352, Online and Punta Cana, Dominican Republic. Association for Computational Linguistics.
- Ramponi et al. (2020) Alan Ramponi, Barbara Plank, and Rosario Lombardo. 2020. Cross-domain evaluation of edge detection for biomedical event extraction. In Proceedings of the Twelfth Language Resources and Evaluation Conference, pages 1982–1989, Marseille, France. European Language Resources Association.
- Sarrouti et al. (2022) Mourad Sarrouti, Carson Tao, and Yoann Mamy Randriamihaja. 2022. Comparing encoder-only and encoder-decoder transformers for relation extraction from biomedical texts: An empirical study on ten benchmark datasets. In Proceedings of the 21st Workshop on Biomedical Language Processing, pages 376–382, Dublin, Ireland. Association for Computational Linguistics.
- Swarup et al. (2020) Daivik Swarup, Ahsaas Bajaj, Sheshera Mysore, Tim O’Gorman, Rajarshi Das, and Andrew McCallum. 2020. An Instance Level Approach for Shallow Semantic Parsing in Scientific Procedural Text. In Findings of the Association for Computational Linguistics: EMNLP 2020, pages 3010–3017, Online. Association for Computational Linguistics.
- Toshniwal et al. (2020) Shubham Toshniwal, Haoyue Shi, Bowen Shi, Lingyu Gao, Karen Livescu, and Kevin Gimpel. 2020. A cross-task analysis of text span representations. In Proceedings of the 5th Workshop on Representation Learning for NLP, pages 166–176, Online. Association for Computational Linguistics.
- Tsuruoka and Tsujii (2005) Yoshimasa Tsuruoka and Jun’ichi Tsujii. 2005. Bidirectional inference with the easiest-first strategy for tagging sequence data. In Proceedings of Human Language Technology Conference and Conference on Empirical Methods in Natural Language Processing, pages 467–474, Vancouver, British Columbia, Canada. Association for Computational Linguistics.
- van der Goot (2021) Rob van der Goot. 2021. We need to talk about train-dev-test splits. In Proceedings of the 2021 Conference on Empirical Methods in Natural Language Processing, pages 4485–4494, Online and Punta Cana, Dominican Republic. Association for Computational Linguistics.
- Vaswani et al. (2017) Ashish Vaswani, Noam Shazeer, Niki Parmar, Jakob Uszkoreit, Llion Jones, Aidan N. Gomez, Lukasz Kaiser, and Illia Polosukhin. 2017. Attention is all you need.
- Yamaguchi et al. (2020) Kyosuke Yamaguchi, Ryoji Asahi, and Yutaka Sasaki. 2020. SC-CoMIcs: A superconductivity corpus for materials informatics. In Proceedings of the Twelfth Language Resources and Evaluation Conference, pages 6753–6760, Marseille, France. European Language Resources Association.
- Yu et al. (2020) Juntao Yu, Bernd Bohnet, and Massimo Poesio. 2020. Named entity recognition as dependency parsing. In Proceedings of the 58th Annual Meeting of the Association for Computational Linguistics, pages 6470–6476, Online. Association for Computational Linguistics.
Appendix
Appendix A Hyperparameters
We use AdamW (Loshchilov and Hutter, 2019) as optimizer for all our models. We use an inverse square-root learning rate scheduler similar to the one used by Vaswani et al. (2017) where refers to the number of warmup steps:
For our measurement identification experiments, we downsample the amount of non-measurement sentences since they represent the majority in the training data. We tune this downsampling rate per model since each BERT variant has been shown to prefer a slightly different one. We apply early stopping after 3 epochs without improvement in terms of F1.
Our NER sequence tagging models are trained with two separate learning rates; one for BERT + linear output layer and another one for the CRF output layer. Both learning rates are reported in the respective column of Table 13. We train for 60-100 epochs, depending on the size of the combined dataset, and take the model with the best evaluation score during this period.
| Model | LM | LR |
|---|---|---|
| CRF | BERT | 1e-4/7e-3 |
| SciBERT | 5e-5/7e-3 | |
| MatSciBERT | 1e-4/7e-3 | |
| Dep. Pars. | BERT | 2e-4 |
| SciBERT | 9e-5 | |
| MatSciBERT | 3e-4 |
For relation extraction, we use a base learning rate of 4e-5 for all experiments, which we found to perform best in preliminary experiments. We employ early stopping with a patience of 15 epochs for all experiments.
Our models are trained with Nvidia A100 and V100 GPUs using the PyTorch framework.
Appendix B Details on Biaffine Parser Architecture
We here describe the biaffine parser architecture used to predict relations between named entities. Taking as input the NE embeddings described in Sec. 4.4, head and dependent representations for the ’th NE are computed via two single-layer feedforward neural networks:
These representations are then fed to a biaffine classifier that maps head–dependent pairs onto logit vectors whose dimensionality corresponds to the inventory of relation labels. Using the softmax operation, these scores are transformed into probability distributions over relation labels:
The predicted relation for a pair of named entities is the one receiving the highest probability (which may be , i.e., no relation).
Token embeddings.
The token embeddings and , which form part of the NE embeddings , are computed as a learned scalar mixture of BERT layers as described by Kondratyuk and Straka (2019).
Appendix C Detailed Corpus Statistics
Table 14 shows the NE counts in MuLMS by datasplit.
Choice of agreement metrics for evaluating agreement on named entity annotations. The task of identifying and labeling NE mentions is a sequence labeling task, hence, is not applicable. Brandsen et al. (2020) provide a good explanation of why this is the case in their section 5.1. Using unitizing is an option, but there is no standard implementation or interpretation for NE annotations in the NLP community, and it does not work for overlapping annotations (which we have in our dataset). We opted for using precision and recall, which are intuitively interpretable (How many of the instances of one type marked by one annotator have also been marked by the respective other annotator?). Hripcsak and Rothschild (2005) convincingly argue (with a very simple proof) that for sequence labeling tasks such as NEs, F1 actually approaches .
| Label | total | train | dev | test |
|---|---|---|---|---|
| Mat | 15596 | 10875 | 2318 | 2403 |
| Num | 6081 | 4142 | 1077 | 862 |
| Value | 4852 | 3266 | 895 | 691 |
| Unit | 4330 | 2880 | 789 | 661 |
| Property | 3925 | 2867 | 598 | 460 |
| Form | 3568 | 2716 | 345 | 507 |
| Measurement | 2171 | 1531 | 345 | 295 |
| Cite | 1709 | 1280 | 274 | 155 |
| Sample | 1461 | 1031 | 249 | 181 |
| Technique | 1036 | 755 | 146 | 135 |
| Dev | 808 | 459 | 235 | 114 |
| Range | 736 | 546 | 105 | 85 |
| Instrument | 378 | 278 | 50 | 50 |
| Label | P | R | matches | matches | # A1 | # A2 |
|---|---|---|---|---|---|---|
| exact | relaxed | |||||
| MAT | 96.7 | 91.2 | 144 | 145 | 150 | 159 |
| NUM | 98.9 | 100.0 | 86 | 86 | 87 | 86 |
| VALUE | 100.0 | 100.0 | 53 | 54 | 54 | 54 |
| UNIT | 97.9 | 100.0 | 47 | 47 | 48 | 47 |
| PROPERTY | 42.6 | 37.7 | 21 | 29 | 68 | 77 |
| FORM | 95.7 | 86.3 | 44 | 44 | 46 | 51 |
| Meas. | 44.6 | 51.0 | 17 | 25 | 56 | 49 |
| CITE | 97.4 | 97.4 | 38 | 38 | 39 | 39 |
| SAMPLE | 3.1 | 12.5 | 1 | 1 | 32 | 8 |
| TECHNIQUE | 77.5 | 59.6 | 25 | 31 | 40 | 52 |
| DEV | 96.0 | 82.8 | 18 | 24 | 25 | 29 |
| RANGE | 100.0 | 100.0 | 24 | 25 | 25 | 25 |
| INSTRUMENT | 80.0 | 76.9 | 18 | 20 | 25 | 26 |
| Label | P | R | matches | # A1 | # A2 |
|---|---|---|---|---|---|
| propertyValue | 81.2 | 81.2 | 26 | 32 | 32 |
| usedIn | 40.0 | 52.2 | 12 | 30 | 23 |
| hasForm | 54.7 | 71.4 | 35 | 64 | 49 |
| measuresProperty | 80.5 | 72.9 | 70 | 87 | 96 |
| conditionProperty | 27.7 | 59.1 | 13 | 47 | 22 |
| conditionEnvironment | 0.0 | 0.0 | 0 | 19 | 4 |
| usedTogether | 13.8 | 28.6 | 4 | 29 | 14 |
| conditionSampleFeatures | 43.1 | 40.0 | 22 | 51 | 55 |
| usesTechnique | 72.9 | 67.3 | 35 | 48 | 52 |
| takenFrom | 33.3 | 63.6 | 7 | 21 | 11 |
| dopedBy | 35.3 | 50.0 | 6 | 17 | 12 |
| conditionInstrument | 24.0 | 60.0 | 6 | 25 | 10 |
| usedAs | 23.5 | 85.7 | 12 | 51 | 14 |
Appendix D SOFC-Exp and MSPT Corpora
In Sec. 5.4, we perform several multi-task learning (MTL) experiments with MuLMS and two additional NLP datasets in the materials science domain, SOFC-Exp (Friedrich et al., 2020) and MSTP (Mysore et al., 2019). We here describe them briefly.
There are 4 named entities in the SOFC-Exp corpus: Material, which refers to mentions of materials or chemical formulas, Value, which denotes numerical values and their corresponding physical unit, Device, which marks device types used in an experiment, and Experiment, which indicates frame evoking words. Furthermore, there are 16 distinct slots that are modeled as relations between experiment frame evoking word and corresponding entity. Table 17 shows the counts for these relations. These counts are not equal to the ones reported by Friedrich et al. (2020) since we have to remove relations that span across multiple sentences as this case cannot be handled by our relation extraction pipeline.
| Label | train | dev | test |
|---|---|---|---|
| AnodeMaterial | 220 | 32 | 26 |
| CathodeMaterial | 173 | 71 | 37 |
| Conductivity | 36 | 19 | 23 |
| CurrentDensity | 59 | 6 | 17 |
| DegradationRate | 15 | 4 | 1 |
| Device | 311 | 59 | 109 |
| ElectrolyteMaterial | 187 | 22 | 120 |
| FuelUsed | 124 | 28 | 40 |
| InterlayerMaterial | 34 | 17 | 6 |
| OpenCircuitVoltage | 41 | 3 | 25 |
| PowerDensity | 138 | 24 | 70 |
| Resistance | 118 | 15 | 57 |
| SupportMaterial | 88 | 13 | 2 |
| TimeOfOperation | 42 | 3 | 12 |
| Voltage | 30 | 3 | 14 |
| WorkingTemperature | 330 | 63 | 138 |
The MSPT corpus introduces additional the 21 entities:
-
•
Property-Misc
-
•
Property-Unit
-
•
Number
-
•
Characterization-Apparatus
-
•
Apparatus-Unit
-
•
Condition-Misc
-
•
Meta
-
•
Synthesis-Apparatus
-
•
Operation
-
•
Amount-Misc
-
•
Amount-Unit
-
•
Reference
-
•
Property-Type
-
•
Material
-
•
Material-Descriptor
-
•
Apparatus-Descriptor
-
•
Apparatus-Property-Type
-
•
Condition-Unit
-
•
Nonrecipe-Material
-
•
Condition-Type
-
•
Brand
Table 18 lists the counts of the 14 relations of the MSPT dataset that we use in our MTL experiments.
| Label | train | dev | test |
|---|---|---|---|
| Recipe-target | 270 | 53 | 92 |
| Solvent-material | 352 | 61 | 107 |
| Atmospheric-material | 144 | 25 | 35 |
| Recipe-precursor | 654 | 152 | 199 |
| Participant-material | 1315 | 236 | 400 |
| Apparatus-of | 358 | 56 | 93 |
| Condition-of | 1378 | 232 | 415 |
| Descriptor-of | 1157 | 193 | 333 |
| Number-of | 2114 | 422 | 663 |
| Amount-of | 1099 | 244 | 376 |
| Apparatus-attr-of | 66 | 56 | 24 |
| Brand-of | 326 | 83 | 91 |
| Core-of | 177 | 23 | 89 |
| Next-operation | 1311 | 233 | 391 |
Appendix E Detailed Experimental Results
This appendix provides further details on our experimental results. Table 26 depicts the results for identifying sentences containing Measurement or Qual_Meas annotations.
NER. Table 19 and Table 20 report F1 for NER on MuLMS per label. Table 21 gives per-label scores for NER in our MTL experiments. Table 22 and Table 23 provide per-label scores for the SOFC-Exp corpus and MSPT corpus in a single-task setting as well as in a multi-task setting with MuLMS added to the training.
Relation extraction. Table 27 lists per-relation scores when using gold NEs or when using predicted NEs for relation extraction, as well as per-relation scores for the majority baseline. Table 25 shows relation extraction scores per label for both dev and test. Table 24 shows overall results for predicted entities on dev and test.
| Label | P | R | F1 |
|---|---|---|---|
| Mat | 83.6 | 82.2 | 82.8 |
| Num | 94.9 | 94.8 | 94.9 |
| Value | 89.4 | 87.0 | 88.2 |
| Unit | 94.2 | 90.4 | 92.3 |
| Property | 49.8 | 53.0 | 51.1 |
| Cite | 88.6 | 87.7 | 88.2 |
| Technique | 49.6 | 51.1 | 50.1 |
| Range | 70.3 | 74.8 | 72.3 |
| Instrument | 46.7 | 44.8 | 45.6 |
| Sample | 72.5 | 36.7 | 47.9 |
| Form | 66.5 | 71.4 | 68.9 |
| Device | 82.6 | 74.9 | 78.6 |
| Measurement | 61.6 | 55.3 | 58.2 |
| Label | CRF-Tagger | Dep. Parser |
|---|---|---|
| Mat | 82.8±0.8 | 80.0±0.4 |
| Num | 94.9±0.7 | 94.2±0.4 |
| Value | 88.2±0.9 | 82.7±1.1 |
| Unit | 92.3±0.6 | 90.8±0.7 |
| Property | 51.1±1.4 | 51.7±2.0 |
| Cite | 88.2±1.3 | 85.7±1.5 |
| Technique | 50.1±2.9 | 51.4±2.4 |
| Range | 72.3±3.0 | 66.4±4.0 |
| Instrument | 45.6±2.0 | 44.1±3.3 |
| Sample | 47.9±4.1 | 29.4±18.1 |
| Form | 68.9±2.5 | 67.6±1.1 |
| Device | 78.6±1.9 | 76.4±2.2 |
| Measurement | 58.2±0.8 | 58.7±0.7 |
| Label | Single-Task | + SOFC | + MSPT |
|---|---|---|---|
| Mat | 82.8 | 82.3 | 82.3 |
| Num | 94.9 | 95.6 | 95.6 |
| Value | 88.2 | 88.1 | 88.2 |
| Unit | 92.3 | 92.1 | 92.6 |
| Property | 51.1 | 49.4 | 50.8 |
| Cite | 88.2 | 88.1 | 87.8 |
| Technique | 50.1 | 52.9 | 50.0 |
| Range | 72.3 | 76.2 | 75.2 |
| Instrument | 45.6 | 45.9 | 42.8 |
| Sample | 47.9 | 38.3 | 45.8 |
| Form | 68.9 | 69.9 | 64.9 |
| Device | 78.6 | 77.9 | 76.3 |
| Measurement | 58.2 | 57.8 | 56.9 |
| Label | Single-Task | + MuLMS |
|---|---|---|
| Material | 75.8 | 73.2 |
| Experiment | 81.7 | 81.2 |
| Value | 93.9 | 92.0 |
| Device | 72.6 | 72.0 |
| Label | ST | + MuLMS |
|---|---|---|
| Meta | 47.5 | 46.3 |
| Property-Misc | 32.8 | 34.7 |
| Synthesis-Apparatus | 68.7 | 66.7 |
| Operation | 85.0 | 84.9 |
| Property-Unit | 42.3 | 44.5 |
| Amount-Misc | 41.4 | 26.0 |
| Number | 94.8 | 95.5 |
| Amount-Unit | 95.5 | 95.0 |
| Reference | 70.9 | 67.7 |
| Property-Type | 24.6 | 19.0 |
| Material | 84.1 | 81.6 |
| Material-Descriptor | 67.8 | 63.7 |
| Characterization-Apparatus | 16.2 | 28.8 |
| Apparatus-Unit | 57.8 | 61.5 |
| Apparatus-Descriptor | 67.0 | 65.1 |
| Apparatus-Property-Type | 0.0 | 0.0 |
| Condition-Misc | 72.3 | 73.5 |
| Condition-Unit | 95.2 | 94.3 |
| Nonrecipe-Material | 62.3 | 59.6 |
| Condition-Type | 15.7 | 12.8 |
| Brand | 71.1 | 64.0 |
| micro F1 | macro F1 | |
|---|---|---|
| dev | 42.5±1.0 | 37.9±1.7 |
| test | 36.5±0.9 | 32.8±1.2 |
| Label | dev | test |
|---|---|---|
| hasForm | 71.3±0.8 | 76.1±0.5 |
| measuresProperty | 88.0±1.0 | 83.1±0.8 |
| measuresPropertyValue | 84.1±2.2 | 73.8±1.0 |
| usedAs | 50.2±2.3 | 41.8±1.9 |
| conditionProperty | 83.0±1.3 | 72.3±1.0 |
| conditionPropertyValue | 74.7±2.5 | 63.2±2.5 |
| conditionSampleFeatures | 67.6±0.9 | 66.0±2.1 |
| usesTechnique | 94.6±0.6 | 91.0±0.9 |
| conditionEnvironment | 57.1±6.2 | 39.0±3.0 |
| propertyValue | 86.7±1.3 | 82.5±2.1 |
| usedIn | 49.3±5.6 | 37.9±3.7 |
| conditionInstrument | 98.2±0.8 | 92.2±0.9 |
| dopedBy | 00.0±0.0 | 22.7±18.7 |
| takenFrom | 85.5±3.7 | 84.7±3.6 |
| usedTogether | 07.5±2.0 | 04.0±1.7 |
| Macro-avg. | 66.5±1.1 | 62.0±1.0 |
| Micro-avg. | 73.2±1.0 | 67.6±1.0 |
| dev | test | |||||||||||||||||||||||||||
| LM | Label | P | R | F1 | P | R | F1 | |||||||||||||||||||||
| BERT |
|
|
|
|
|
|
|
|||||||||||||||||||||
| SciBERT |
|
|
|
|
|
|
|
|||||||||||||||||||||
| MatSciBERT |
|
|
|
|
|
|
|
|||||||||||||||||||||
| human | Measurement | 74.2 | 74.2 | |||||||||||||||||||||||||
| agreement | Qual_Meas | 61.7 | 61.7 | |||||||||||||||||||||||||
| Gold Entities | Predicted Entities | Majority Baseline | |||||||
| Label | P | R | F1 | P | R | F1 | P | R | F1 |
| hasForm | 74.0 | 78.5 | 76.1 | 54.2 | 55.5 | 54.8 | 0.0 | 0.0 | 0.0 |
| measuresProperty | 80.2 | 86.3 | 83.1 | 39.3 | 36.6 | 37.8 | 50.5 | 99.6 | 67.0 |
| measuresPropertyValue | 68.6 | 80.0 | 73.8 | 41.5 | 38.3 | 39.7 | 0.0 | 0.0 | 0.0 |
| usedAs | 49.2 | 36.5 | 41.8 | 30.1 | 19.1 | 23.2 | 0.0 | 0.0 | 0.0 |
| conditionProperty | 65.3 | 81.2 | 72.3 | 29.0 | 27.4 | 27.9 | 0.0 | 0.0 | 0.0 |
| conditionPropertyValue | 51.3 | 82.4 | 63.2 | 26.7 | 42.5 | 32.7 | 27.2 | 100.0 | 42.7 |
| conditionSampleFeatures | 60.7 | 72.3 | 66.0 | 34.4 | 28.4 | 31.0 | 70.4 | 42.8 | 53.2 |
| usesTechnique | 87.1 | 95.2 | 91.0 | 44.7 | 37.9 | 41.0 | 81.8 | 100.0 | 90.0 |
| conditionEnvironment | 40.4 | 37.9 | 39.0 | 32.2 | 27.0 | 29.2 | 0.0 | 0.0 | 0.0 |
| propertyValue | 78.7 | 86.8 | 82.5 | 40.9 | 46.7 | 43.4 | 0.0 | 0.0 | 0.0 |
| usedIn | 42.5 | 35.6 | 37.9 | 18.6 | 14.2 | 15.9 | 0.0 | 0.0 | 0.0 |
| conditionInstrument | 93.4 | 91.1 | 92.2 | 38.6 | 36.6 | 37.5 | 90.4 | 100.0 | 94.9 |
| dopedBy | 26.7 | 20.0 | 22.7 | 20.0 | 6.7 | 10.0 | 0.0 | 0.0 | 0.0 |
| takenFrom | 75.3 | 96.9 | 84.7 | 67.8 | 61.5 | 64.0 | 46.4 | 100.0 | 63.4 |
| usedTogether | 9.6 | 2.5 | 4.0 | 9.6 | 2.4 | 3.8 | 0.0 | 0.0 | 0.0 |
| Macro-avg. | 60.2 | 65.5 | 62.0 | 35.2 | 32.0 | 32.8 | 24.4 | 36.1 | 27.4 |
| Micro-avg. | 66.8 | 68.4 | 67.6 | 38.6 | 34.7 | 36.5 | 50.5 | 29.5 | 37.2 |
| MuLMS only | MuLMS + SOFC-Exp | MuLMS + MSPT | |||||||
| Label | P | R | F1 | P | R | F1 | P | R | F1 |
| hasForm | 74.0 | 78.5 | 76.1 | 78.0 | 78.8 | 78.3 | 74.2 | 79.6 | 76.8 |
| measuresProperty | 80.2 | 86.3 | 83.1 | 79.0 | 87.1 | 82.8 | 78.8 | 86.6 | 82.5 |
| measuresPropertyValue | 68.6 | 80.0 | 73.8 | 68.9 | 82.7 | 75.1 | 70.3 | 82.1 | 75.7 |
| usedAs | 49.2 | 36.5 | 41.8 | 47.9 | 35.7 | 40.8 | 51.9 | 37.5 | 43.5 |
| conditionProperty | 65.3 | 81.2 | 72.3 | 67.4 | 82.1 | 73.9 | 66.1 | 80.3 | 72.5 |
| conditionPropertyValue | 51.3 | 82.4 | 63.2 | 53.7 | 77.8 | 63.3 | 51.1 | 78.5 | 61.8 |
| conditionSampleFeatures | 60.7 | 72.3 | 66.0 | 61.1 | 71.4 | 65.7 | 62.8 | 72.2 | 67.1 |
| usesTechnique | 87.1 | 95.2 | 91.0 | 85.6 | 97.1 | 91.0 | 87.2 | 95.7 | 91.2 |
| conditionEnvironment | 40.4 | 37.9 | 39.0 | 46.3 | 46.2 | 46.0 | 47.2 | 49.8 | 48.3 |
| propertyValue | 78.7 | 86.8 | 82.5 | 76.2 | 85.5 | 80.5 | 81.4 | 88.7 | 84.8 |
| usedIn | 42.5 | 35.6 | 37.9 | 45.5 | 47.6 | 45.9 | 41.8 | 40.4 | 40.5 |
| conditionInstrument | 93.4 | 91.1 | 92.2 | 93.6 | 93.2 | 93.4 | 93.5 | 91.9 | 92.7 |
| dopedBy | 26.7 | 20.0 | 22.7 | 0.0 | 0.0 | 0.0 | 28.3 | 26.7 | 27.0 |
| takenFrom | 75.3 | 96.9 | 84.7 | 61.7 | 98.5 | 75.6 | 77.0 | 98.5 | 86.2 |
| usedTogether | 9.6 | 2.5 | 4.0 | 8.8 | 2.2 | 3.5 | 12.0 | 3.6 | 5.4 |
| Macro-avg. | 60.2 | 65.5 | 62.0 | 58.2 | 65.7 | 61.1 | 61.6 | 67.5 | 63.7 |
| Micro-avg. | 66.8 | 68.4 | 67.6 | 67.4 | 68.9 | 68.1 | 68.0 | 69.5 | 68.7 |