Ph.D. Program in Biochemistry, The Graduate Center of the City University of New York, New York, NY \alsoaffiliationPh.D. Program in Chemistry, The Graduate Center of the City University of New York, New York, NY \alsoaffiliationPh.D. Program in Biochemistry, The Graduate Center of the City University of New York, New York, NY
What to Make of Zero: Resolving the Statistical Noise from Conformational Reorganization in Alchemical Binding Free Energy Estimates with Metadynamics Sampling
Abstract
We introduce the self-Relative Binding Free Energy (self-RBFE) approach to evaluate the intrinsic statistical variance of dual-topology alchemical binding free energy estimators. The self-RBFE is the relative binding free energy between a ligand and a copy of the same ligand, and its true value is zero. Nevertheless, because the two copies of the ligand move independently, the self-RBFE value produced by a finite-length simulation fluctuates and can be used to measure the variance of the model. The results of this validation provide evidence that a significant fraction of the errors observed in benchmark studies reflect the statistical fluctuations of unconverged estimates rather than the models’ accuracy. Furthermore, we find that ligand reorganization is a significant contributing factor to the statistical variance of binding free energy estimates and that metadynamics-accelerated conformational sampling of torsional degrees of freedom of the ligand can drastically reduce the time to convergence.
1 Introduction
Advances in computational models and computer hardware are revolutionizing the role of molecular simulations in chemical research, opening new avenues for exploring molecular interactions at an unprecedented level of detail. Atomistic simulations of molecular binding, in particular, are playing a pivotal role in understanding fundamental biological regulatory processes and in assisting in the rational design of drugs 1, 2, 3, 4, 5, 6. The accurate estimation of protein-ligand binding-free energies by computer simulations, which is the subject of this study, is becoming an important ingredient in elucidating molecular recognition mechanisms, identifying potential drug candidates, and developing novel therapeutics.
However, the accurate determination of binding-free energies by physics-based atomistic computer simulations remains a formidable challenge due to the size and complexity nature of biological systems, the dynamical nature of molecular recognition mechanisms, and the high dimensionality of the conformational space to explore. The presence of many energy basins separated by high energy barriers is a serious obstacle for traditional molecular dynamics (MD) conformational sampling algorithms, which are limited to the narrow band of thermal energies. The negative impact of conformational trapping due to limited MD conformational sampling is further exacerbated in simulations of molecular association processes where the populations of conformational states of the receptor and ligand often shift as they form interactions 7, 8. Poor equilibration between stable configurations of the system and failure to capture the free energy of conformational reorganization upon the formation of receptor-ligand interactions causes biased and noisy free energy estimates that do not reflect the actual binding affinity trends, leading to incorrect predictions about the relative potency of drug candidates.
Alchemical models of the Relative Binding Free Energies (RBFE) of protein-ligand complexes have emerged as the leading computational methods for lead optimization in industrial and academic pharmaceutical research 9, 10, 11, 12, 13, 14, 15, 16, 17, 18, 19, 20. RBFE models estimate the ratio of the dissociation constants, , of a pair of ligands to the same protein receptor, or, equivalently, their relative standard binding free energies, by considering a non-physical path that progressively modifies the potential energy function of the system in such a way that at the beginning it describes the receptor bound to the first ligand and at the end it describes the receptor bound to the other ligand. The relative binding free energy is then the reversible work along the alchemical path 21, 20, 22, 23.
While increasingly popular, as evidenced by extensive large-scale benchmarking validation studies against experimental data10, 12, 15, 17, 19, RBFE models do not always yield correct predictions. The causes of mispredictions are often unclear; primarily because the ground truth value of the models is not known, and the relative contributions of model accuracy and statistical fluctuations on the prediction accuracy are uncertain. Are prediction errors caused by inaccuracies in the models or our inability to calculate the models’ predictions with sufficient precision? In this work, we investigate the causes of slow convergence and large statistical fluctuations of relative binding free energy estimates on a large and challenging library of protein-ligand complexes. We do so by investigating calculations that connect chemically identical complexes and should then yield zero. We can then explore the models’ bias and variance independently. We find that the conformational reorganization of the ligand is a leading cause of poor convergence and that an accelerated conformational sampling approach based on metadynamics can significantly reduce statistical fluctuations.
Alchemical RBFE models are still a work in progress as structure-based drug discovery aids in many respects. RBFE tools tend to be very complex, require extensive expertise, and display inconsistent performance if not deployed correctly.12 Probably some fraction of the RBFE prediction errors that are observed in applications are caused by erroneous chemical representations, such as the incorrect assignment of protonation, tautomerization, and chirality. Inaccuracies of molecular mechanics potential energy functions are also likely a significant source of errors 24, 22. Technical difficulties exist in many alchemical RBFE implementations with charge-changing and scaffold-hopping transformations, and in modeling variations of hydration patterns. However, as discussed above, limited conformational sampling likely remains one of the primary sources of mis-predictions. The system often stays trapped near the initial conformation, and alternative poses of the receptor and the ligands, including the conformational reorganization processes occurring upon binding, are not fully captured during the relatively short molecular dynamics runs.25, 26
There are many alchemical RBFE implementations in current use. The Double Decoupling Method (DDM) 27, which is probably the most popular, does not connect the end states directly. Rather it relies on an indirect route involving multiple simulations that morph the electrostatic and non-electrostatic interaction of one ligand into the other in the solution and receptor environments separately 28. The implementation of DDM typically requires customized MD energy routines that allow the tuning of the parameters of the potential energy function as the alchemical transformation takes place and incorporate modified soft-core interaction pair-potentials to reduce numerical instabilities near the endpoints.
The treatment of the transformation of the chemical topology of one ligand into the other is an important differentiating factor of alchemical RBFE implementations. In a single-topology implementation, the system holds a single representation of the ligands’ atoms and their assigned force field parameters in such a way that the atoms of the initial molecule are converted into those of the final molecule during the alchemical transformation. Dummy atoms are used to treat atoms that are not present at either end state 29, 11, 30, 31. Conversely, in a dual-topology RBFE implementation, the two ligands are represented by distinct non-interacting standard chemical topologies whose interactions with the environment are turned off and on during the alchemical process 23. Hybrid topologies, where the constant parts of the ligands are treated within the single-topology formalism and the variable parts are described by dual-topology, are also in use. Single- and dual-topology approaches are more or less suitable depending on the circumstances. Generally, single-topology RBFE is more efficient, especially when the difference between the two ligands is small, and dual-topology RBFE formulations are more versatile and easier to implement.
We recently introduced the Alchemical Transfer Method (ATM) to address some of the complexities and limitations of traditional alchemical methods. ATM is a dual-topology RBFE implementation based on a coordinate rather than a potential energy function perturbation. ATM is free of the complexities of traditional alchemical methods. It supports absolute and relative binding free energy calculations in a unified way, it computes free energies directly employing a single simulation box with standard chemical topologies, and it natively supports standard as well as charge-changing and scaffold-hopping transformations without correction factors and ancillary calculations. Furthermore, since it does not use parameter interpolation or custom soft-core pair potentials, ATM is more easily implemented and transferable across MD engines because it uses the unmodified energy routines of the underlying molecular dynamics engine. For the same reason, it applies to any molecular energy function, including the next generation of more accurate polarizable,32, 33, 34, 35 quantum-mechanical,36, 37, 38, 39 and machine-learning potentials40, 41, 42 that are just starting to be employed in alchemical macromolecular simulations. The current fully open-source software release of ATM employs the OpenMM molecular dynamics engine and has been successfully tested on a series of medicinal targets by us and academic and industrial partners.19, 43
In this work, we study the bias and variance of ATM by estimating the binding free energies of a series of complexes from the benchmark set of Schindler et al.12 relative to themselves (self-RBFEs). A self-RBFE is obtained when the two ligands considered in an ATM RBFE calculation are the same ligand. Obviously, in this case, the true value of the RBFE is zero. Nevertheless, because the dual-topology copies of the ligand act independently, the free energy value produced by a finite-length ATM simulation fluctuates and is not guaranteed to be zero. The advantage of investigating self-RBFEs is that their true value (zero) is known, allowing the bias and variance of the model to be investigated independently. We measure the bias by asking how much the average of a sequence of the ATM self-RBFE replicates differs from zero. The variance is then measured from the distribution of the replicate’s estimates. While a large and consistent bias reflects an implementation error that should be corrected, a level of variance is unavoidable and reflects the minimum amount of statistical noise that would affect actual ATM’s RBFE predictions between pairs of different ligands.
We observe that ATM’s self-RBFE variance is a significant fraction of the mean squared error of ATM RBFE estimates relative to experimental free energies in recent large-scale validation studies,19, 43 suggesting that, to some degree, those errors reflect statistical noise rather than model’s defects that can be addressed by improving the chemical realism of the model by, for example, adopting a potential energy model at a higher level of theory. Rather, improved predictions could be achieved by reducing statistical noise by more extensive conformational sampling. This conclusion is supported by the observation that the self-RBFE’s variance is strongly correlated to the reorganization free energy of the ligand; the induced-fit free energy cost for the ligand to reorganize into the binding-competent conformational state from the range of conformations it occupies in solution. A link between these two quantities suggests that ligand conformational reorganization contributes significantly to the errors observed in validation studies and that errors can be reduced by improving the sampling of the ligands’ intramolecular degrees of freedom.
In this work, we employ metadynamics-based sampling44 to speed up the sampling of slow torsional degrees of freedom during ATM RBFE calculations. Metadynamics is an algorithm that adaptively builds up a biasing potential function that disfavors conformations that have already been visited. By doing so, it tends to equalize the populations of conformational states along a chosen coordinate and lower energy barriers that hamper rapid interconversions. In keeping with the philosophy of simplicity and transferability of ATM, we employ the metadynamics implementation in OpenMM by Peter Eastman42 that, unlike other conformational acceleration algorithms such as replica exchange with solute tempering (REST),45 apply to arbitrary many-body potential and does not require modifications to the core energy routines of the MD engine.
The work is organized as follows, we first review ATM, then introduce the concepts of self-RBFE and reorganization free energies, and describe the metadynamics algorithm as used in this study. We then present the analysis of the self-RBFE and reorganization free energy values we obtain on the benchmark sets. We conclude with a discussion of the implications of the findings of this study for the future directions of alchemical binding free energy models in structure-based drug discovery.
2 Theory and Methods
2.1 The Alchemical Transfer Method for Relative Binding Free Energy Estimation
The Alchemical Transfer Method (ATM, for short) estimates the binding free energies of molecular complexes by relating the bound and unbound states by a coordinate displacement transformation that brings the ligand from the solution environment to the binding site of the receptor. Alternatively, it estimates the relative binding free energy (RBFE) of two complexes of the same receptor with two different ligands by translating one ligand into the binding site while another is simultaneously translated from the binding site to the solution. In this sense, ATM is a dual-topology free energy method because it employs distinct topologies for each ligand rather than modifying one topology as in single-topology formulations.22 ATM and its applications are described in detail in published works.46, 23 Only a brief account is provided here to introduce the notation and the essential features relevant to the present work.
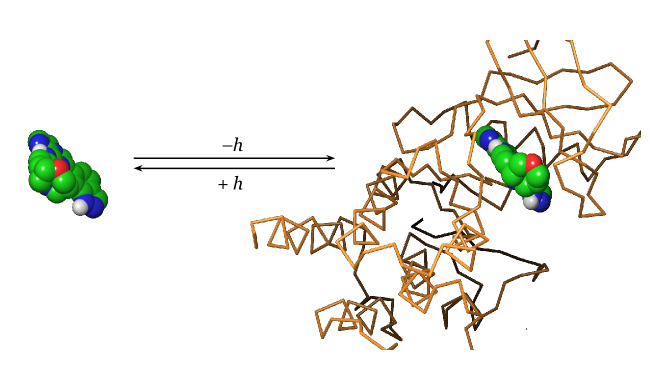
A typical system for an ATM RBFE calculation consists of a protein receptor bound to a ligand and a second ligand placed in the solvent displaced from ligand by a displacement vector , such that it is at a sufficient distance from the receptor to be considered not bound to it (Figure 1). ATM computes the potential energy functions of the system and their gradients before and after translating by a vector ligand from the binding site to the solvent while simultaneously translating ligand by the opposite displacement. The first potential energy function, called , describes the system when ligand is bound to the receptor, and the second, called , corresponds to the state in which the ligand is bound. Here, represents collectively the coordinates of the receptor, the ligands, the solvent, and whatever other chemical species is present in the system. The free energy difference between the states and is the RBFE between ligands and to receptor .
To calculate the RBFE, the potential energy function is progressively morphed from to by defining an alchemical potential energy function that goes from to as the alchemical progress parameter goes from to . As an example, the linear alchemical potential energy function
| (1) |
where
| (2) |
is the perturbation energy function, is one such interpolating function. However, as thoroughly discussed in published works,47, 48 non-linear alchemical potential energy functions are vastly more efficient than linear interpolating functions. ATM adopts the expression
| (3) |
where is the soft-core softplus alchemical perturbation function
| (4) |
the parameters , , , , and are functions of (see Computational Details), the function
| (5) |
with
| (6) |
and
| (7) |
is the soft-core perturbation energy function designed to avoid singularities near the initial state of the alchemical transformation.47, 48 The parameters , , and are set to cap the perturbation energy to a maximum positive value without affecting it away from the singularity. The specific values of , , and of the scaling parameter used in this work are listed in the Computational Details.
For efficiency reasons elaborated elsewhere,46, 23 Eq. (3) is not employed to span the entire alchemical pathway from to . Rather, the process is divided into two legs: one starting at using the alchemical potential in Eq. (3), and a second leg starting from the bound state morphing in the other direction towards the unbound state using the alchemical potential . Both legs terminate at at the ATM symmetric alchemical intermediate with the potential energy function that is an equally weighted average of the endstates. The relative binding free energy is then given by the differences of the free energies corresponding to the two legs
| (8) |
2.2 Self-Relative Binding Free Energy Calculations
In this work, we investigate self-RBFE ATM estimates; that is the outcomes of RBFE calculations when the ligands and are the same ligand. The true value of the binding free energy of a ligand relative to itself is obviously zero. However, because of statistical fluctuations, the self-RBFE obtained from a finite-length ATM calculation will not be exactly zero. Below we will employ the statistical fluctuations of self-RBFE estimates to understand the statistical fluctuations of RBFEs between unlike ligands.
It should be recognized that the concept of a self-RBFE applies only to dual-topology binding free energy formulations such as ATM. The single-topology process of morphing a ligand to the same ligand is inherently a null transformation with necessarily zero free energy. In ATM theory, the true value of a self-RBFE is zero because the two legs of the ATM alchemical process have the same initial and final states and thus have the same free energy. The initial state of either leg is the state in which one copy of the ligand is bound to the receptor, and the other copy is in solution. The final state is the symmetric alchemical intermediate, which is again shared by the two legs. However, the free energy of each leg is not zero, and random differences between the estimates of the two legs cause the self-RBFE estimate to differ from zero.
We measure the statistical fluctuations of self-RBFEs for a set simulation length by running replicates of the simulations of the same length. The standard deviation of the distribution of self-RBFEs is a measure of the statistical fluctuation of the self-RBFE of a ligand. The deviation of the mean of the self-RBFE of the distribution of self-RBFEs from zero is a measure of the bias of the ATM estimate.
2.3 Estimation of the Ligand Binding Reorganization Free Energy
The ligand reorganization free energy for binding measures the free energy cost for the ligand in solution to assume the binding-competent conformation.49 This quantity, also known in the literature as the conformational free energy penalty or strain energy,50, 51 is an important element considered in lead optimization because a molecule predisposed for binding with small reorganization free energy is more likely to bind strongly to the receptor. Conversely, reorganization opposes the binding of flexible molecules that spend most of their time in solution in conformations away from the bioactive conformation. Even though drug development typically focuses on strengthening receptor-ligand interactions, the ligand reorganization element can be crucial in determining binding specificity,52 especially when binding energy variations are minimal. In such cases, optimizing binding affinity can be achieved by strategies that focus on preorganizing the ligand for binding, thereby reducing unfavorable reorganization.
Computer models are uniquely positioned to probe ligand reorganization free energies. While experimental structures of protein-ligand complexes often yield the bound structure of ligands, they do not provide information about their distribution of conformations in solution. The ligand component of the reorganization free energy for binding of ligand , , is formally related to the population of the ligand’s bioactive conformation in solution
| (9) |
Hence, the binding affinity of a ligand could be significantly overestimated if the reorganization free energy is not taken into account, especially if is small and is large and positive.
It is challenging to obtain a good estimate of the reorganization free energy of a ligand by unbiased molecular simulations if the bioactive conformation is rarely visited in solution or it is separated by the other solution conformations by large energy barriers that are rarely crossed. For example, if the ligand remains trapped in the initial bound conformation because transitions to more stable conformations in solution are rare, one would incorrectly deduce that the ligand reorganization free energy is small. The equilibration between conformational states separated by free energy barriers greater than 5 kcal/mol is generally considered difficult within routine MD simulation timescales. Conversely, the reorganization free energy could be grossly overestimated if the population of the bioactive conformation is so small that is almost never visited when the ligand is in solution. The reorganization of the receptor can also be a major contributing factor for binding that is equally or harder to model than ligand reorganization. In this work, we focus on the ligand reorganization under the assumption that the receptor does not reorganize or it does not reorganize differently depending on the bound ligand.
Taken together, conformational reorganization processes that accompany binding can be a major convergence bottleneck for binding free energy calculations. One way to probe their effect is to see whether ligands with self-RBFEs with large statistical fluctuations are predominantly those that reorganize upon binding. This would be the case because ligand molecules that suffer large reorganization in solution and rarely interconvert between the bound and unbound conformations in solution are more likely to display random fluctuations in one alchemical leg than the other, causing self-RBFEs to deviate from zero.
In this work, we estimate the reorganization free energy of a ligand by measuring the RBFE between the ligand and a version of the same ligand restrained within the state corresponding to the bioactive conformation . The bound state is identified by means of ranges of torsional angles of the ligand. According to the two-step process
| (10) | |||||
where is the restrained ligand pre-reorganized for binding, is the reorganization free energy, is the binding free energy of the reorganized ligand, and assuming that the complexes and with and without the ligand restrained are thermodynamically equivalent, the overall binding free energy for the process is written as49
| (11) |
Thus, according to this model, the reorganization free energy is given by the relative binding free energy between and for receptor .
2.4 Metadynamics Conformational Sampling
In this study, we employ well-tempered metadynamics44 to accelerate the sampling of the internal torsional degrees of freedom of the ligands. Similar to earlier local elevation53 and conformational flooding methods,54 metadynamics constructs a flattening biasing potential that reduces free energy barriers along chosen collective variables (CVs) by disfavoring values of the CVs that are frequently visited.55, 56 At the limit at which free energy barriers are completely removed, well-tempered metadynamics biasing potential yields the potential of mean force of the system along the selected CVs.44 The results reported here were obtained with the implementation of well-tempered metadynamics by Peter Eastman packaged with the OpenMM library.57, 58
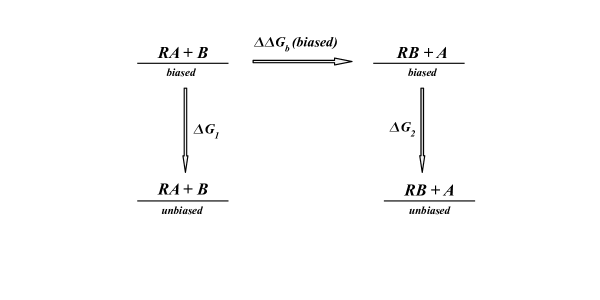
As described in detail in Computational Details, our approach involves first obtaining the torsional flattening biasing potentials by running well-tempered metadynamics on the free ligands in water. We then perform the ATM alchemical calculation with the biasing potentials added to the intramolecular potential energy functions of the ligands. The resulting biased free energy is unbiased using a book-ending approach38, 26 by computing the free energy differences of the system without the biasing potential from samples collected with the biasing potential at the endpoints of the alchemical path. In this work, we used a simple unidirectional exponential averaging formula to evaluate the free energy corrections for unbiasing at each endpoint (Figure 2). For example, in the notation of Figure 2
| (12) |
where is the metadynamics-derived flattening biasing potential and is the ensemble average of the biased state. The exponential averaging estimator converges quickly in this case because the biased ensemble is a subset of the unbiased one.
The ATM protocol augmented with metadynamics (hereafter ATM+MetaD) was applied to the calculation of ligand reorganization free energies (see above) and to the self-RBFE calculations. As shown in the Results, metadynamics sampling reduces significantly the statistical fluctuations of the self-RBFE estimates by accelerating the transitions of the ligands.
2.5 Benchmark Systems
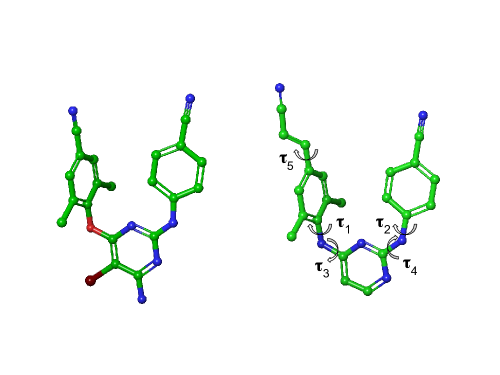
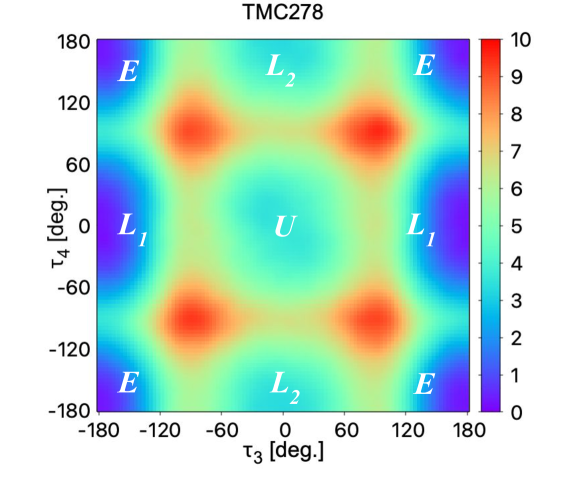
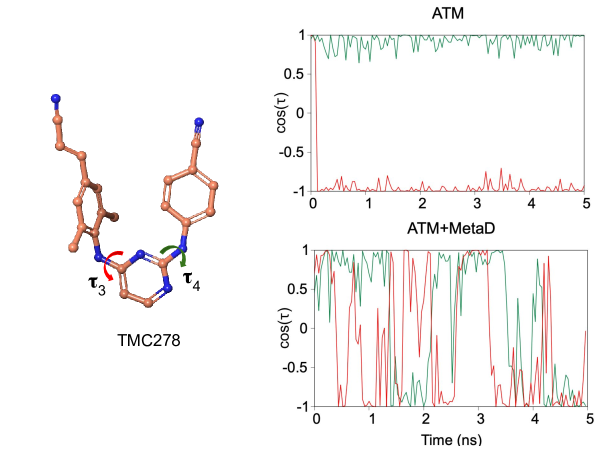
We illustrate the application of the self-RBFE and reorganization free energy analysis on four benchmark systems. The first set, composed of two non-nucleoside inhibitors (NNRTIs) (TMC125 and TMC278) of HIV-1 reverse transcriptase (HIV-RT) whose conformational reorganization properties have been studied computationally (Figure 3),59, 60 has been chosen as one of the clearest examples of conformational reorganization. TMC278, sold as rilpivirine, is known to undergo an extensive conformational reorganization from an extended conformation to a compact U-shaped conformation to bind HIV-RT. In contrast, the similar TMC125 compound (sold as etravirine) is mostly in the binding-competent U-shaped conformation in solution and does not reorganize for binding.
The other three case study systems (c-Met, Syk, and CDK8) were taken from the RBFE benchmark set prepared by Schindler et al.12 The RBFEs estimates of these systems were recently reported by Chen et al.43 using the same ATM free energy protocol and force field employed here. Chen et al.43 reported average unsigned errors relative to the experiments of , , and kcal/mol, respectively, relative to the experiments for these sets. Schindler et al.12 obtained similar prediction performance with the commercial FEP+ package.10, 61 Here we report the self-RBFE estimates for all of the 101 complexes in these sets and perform a detailed statistical fluctuation and reorganization free energy analysis on a randomly picked subset of 11 complexes.
2.6 Simulation Settings
We employed the structures of the c-Met, Syk, and CDK8 complexes posted by Schindler et al.12, 62 prepared and parameterized for ATM RBFE calculations as described by Chen et al.43 and posted on the GitHub repository https://github.com/EricChen521/ATM_MerckSet.
We used the 3MEC63 and 2ZD164 crystal structures for the complexes of TMC125 and TMC278 bound to HIV-RT. The HIV-RT receptor structures were processed using the Protein Preparation Wizard in Maestro (Schrödinger, Inc). Given the large size of the HIV-RT enzyme complex, the calculations used a simplified model of the receptor, incorporating any receptor residue with atoms within 12 Å of any ligand atom. The 12 Å limit for non-bonded interactions and the receptor’s rigidity ensure that predictions do not significantly depend on atomic interactions outside this modeled zone. The receptor model consisted of 114 residues (from positions 88 - 112, 171 - 195, 220 - 243, 314 - 323, 347 - 350, and 378 - 385 in the p66 subunit, and 132 - 142 in the p51 subunit), totaling 1905 atoms. We adopted the AMBER FF14SB force field for the protein and the TIP3P model for water. TMC125 and TMC278 were parametrized using the GAFF1.8/AM1-BCC forcefield. The solvated systems were neutralized using Na+/Cl- and K+/Cl- ions for HIV-RT protein-ligand and Schindler et. al benchmark sets respectively. ATM ligand alignment restraints23 were employed with force constants kcal/(mol Å2) and kcal/mol for the positional and orientational restraints, respectively. The receptors’ C atom positions were kept near their starting values using flat-bottom harmonic restraints with a Å allowance and a force constant of kcal/(mol Å2). The LEaP program65 was used to combine the receptor and the ligands and solvate the system. The second ligand of each ligand pair was translated by Å along the diagonal of the solvent box. This distance was sufficient to maintain a minimum separation of three water layers between the ligand in solution and the receptor’s atoms. The resulting system was solvated with a Å buffer.
The prepared systems were energy-minimized, thermalized, and equilibrated at 300 K and 1 bar of constant pressure. This was followed by slow annealing to the alchemical intermediate for 250 ps. The resulting structure served as the initial configuration for the subsequent alchemical replica exchange simulations.
For all the protein-ligand complexes, we employed 22 replicas, with 11 for each of the two legs from to . The schedules of the softplus alchemical parameters in Equation 4 were: , , , , , , , , , , , , , , , , , , , , , for the Schindler et. al. protein-ligand systems. For HIV-RT complexes, the parameters were , , , , , , , , , , , , , , , , , , , , , . For all sets and -states we set (kcal/mol)-1, and kcal/mol. We used the softcore perturbation energy parameters kcal/mol, kcal/mol, and .
The asynchronous Hamiltonian replica exchange molecular dynamics conformational sampling 66, was executed with a timestep of 2 fs. Perturbation energy samples were collected every 40 ps. The relative binding free energies were determined using replica trajectories that were a minimum of 5 ns in length. The first third of the samples were discarded for equilibration for free energy analysis. We used UWHAM, multi-state free energy estimator, 67 for free energy, and statistical error estimation.
We employed the well-tempered metadynamics44 utility available in OpenMM42 to optionally accelerate the sampling of the torsional degrees of the ligands. Torsional potential energy flattening biasing potentials were obtained by simulating each ligand in a water solution. Metadynamics MD was conducted for 50 ns with a well-tempered metadynamics bias factor of 9, Gaussian height kJ/mol, degrees Gaussian width, and a deposition rate of 0.2 ps. The biasing potential was added to the potential energy function of the ligands for a subset of the self-RBFE ATM calculations, and the resulting free energy estimates were unbiased, as described in Theory and Methods.
For the calculation of ligand reorganization energy, a set of torsions of one copy of the ligand was restrained to keep it in the bound state. To establish the range of allowed torsional angles, we obtained the distribution of torsional angles of the ligand when bound to the receptor () during the self-RBFE calculation. The tolerances of the torsional restraints were set so as to cover most of the span of the distributions. The specifications for the torsional restraints for each ligand in this study can be found at (https://github.com/sheenam1509/self-rbfe.git). The second copy of the ligand was unrestrained and was modeled with the metadynamics-derived biasing potential described above to avoid conformational trapping.
3 Results
The self-RBFE estimates from five replicates for the complexes of HIV-RT with TMC125 and TMC278 with and without accelerated metadynamics sampling are reported in Table 1. The average and variance over the five replicates measure the bias and statistical fluctuations of the ATM self-RBFE estimator for a simulation length of 5 ns per replica. With the exception of the complex with TMC278 with metadynamics sampling, the bias of the self-RBFE with respect to the true value is zero within statistical uncertainty. However, a small but consistent bias towards positive self-RBFE values is evident as the averages over the replicates are positive in all cases, and the average self-RBFE is outside the uncertainty window in the case of TMC278 with metadynamics. We interpret this residual bias as the tendency of the copy of the ligand started in solution to move away from the bound-competent conformation in the early phases of the simulation.
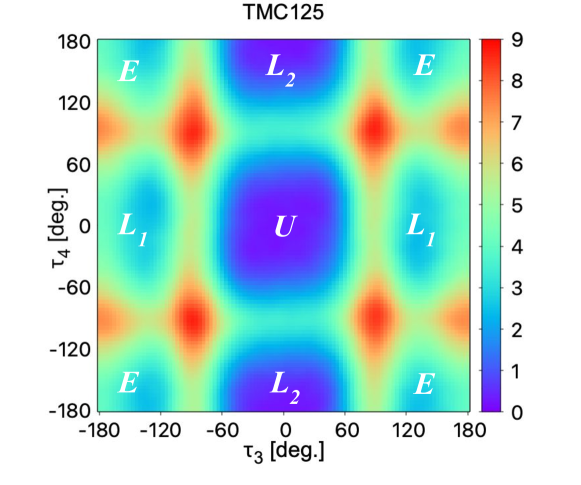
As measured by the variance, metadynamics conformational sampling reduces the statistical fluctuations of the self-RBFEs in the case of TMC278 but increases it for TMC125 (Table 1). As further discussed below, this is one of several examples we encountered where the more extensive conformational exploration afforded by metadynamics does not necessarily benefit ligands that do not significantly reorganize upon binding. The reorganization free energy estimates we obtained (Table 3) confirm that TMC278 suffers a much larger reorganization penalty than TMC125. Hence, accelerated conformational sampling helps reduce the statistical fluctuations of TMC278 by increasing the rate of interconversions between the and conformations predominant in solution (Figure 4) to the conformations required for binding. In contrast, TMC125 is already predominantly in the bound U-shaped conformation in solution (Figure 4), and exploring conformational states that do not contribute significantly to binding hurts convergence rather than enhances it.
| Replicate | (ATM)a | (ATM+MetaD)a |
|---|---|---|
| TMC125 | ||
| 1 | 0.05 | 1.12 |
| 2 | -0.81 | -0.25 |
| 3 | -0.33 | 1.80 |
| 4 | 0.83 | -0.64 |
| 5 | 0.75 | 0.17 |
| averagea | ||
| varianceb | 0.49 | 1.01 |
| TMC278 | ||
| 1 | 1.80 | 0.03 |
| 2 | 1.07 | 1.35 |
| 3 | 1.06 | 0.44 |
| 4 | 3.75 | 0.79 |
| 5 | -3.40 | 0.46 |
| averagea,c | ||
| varianceb | 6.88 | 0.24 |
aIn kcal/mol bIn (kcal/mol)2 cErrors are reported as twice the standard error of the mean.
With this knowledge in mind, we tested whether metadynamics-based accelerated conformational sampling reduces the statistical uncertainty of the RBFE between TMC125 and TMC278 binding to HIV-RT. Since biasing the sampling of the dihedral angles of TMC125 proved ineffective, in these calculations we applied the metadynamics flattening potential only to TMC278 to better address its large conformational reorganization in solution. Indeed, as the results in Table 2 show, metadynamics sampling yields an RBFE estimate with a much smaller statistical uncertainty (a variance of compared to (kcal/mol)2 without metadynamics) at essentially the same computational cost. The reduction of the model variance, in this case, is due to the frequent transitions of TMC278 from solution to bound conformational states with metadynamics. With standard MD sampling, in contrast, TMC278 remains trapped in the extended solution conformations while in solution and is unable to equilibrate with the bound state of the complex (Figure 5).
Experimentally, TMC278 is a slightly better or equivalent inhibitor of HIV-RT than TMC125.68 Without metadynamics sampling, ATM predicts that TMC125 is instead significantly more potent than TMC278 ( kcal/mol) albeit with a large uncertainty. With metadynamics sampling, the RBFE estimate is much closer to the expected value and with significantly smaller uncertainty. The overestimation of the potency of TMC125 relative to TMC278 without accelerated conformational sampling is attributed to the reduced ability of TMC278 to visit bound-competent conformations while in solution without the help of the metadynamics flattening potential.
| Replicate | (ATM)a | (ATM+MetaD)a |
|---|---|---|
| HIV-RT TMC278-TMC125 | ||
| 1 | -1.60 | -0.34 |
| 2 | -2.33 | -1.23 |
| 3 | -3.83 | -0.26 |
| 4 | -0.12 | -0.41 |
| 5 | -2.80 | -0.78 |
| averagea,c | ||
| varianceb | ||
aIn kcal/mol. bIn (kcal/mol)2 cErrors are reported as twice the standard error of the mean.
The results of the self-RBFE bias and variance analysis for the benchmark sets from Schindler et al. are shown in Table 3. The full list of self-RBFE estimates for each ligand in the set is provided in the Supplementary Information. To compare with the results of Chen et al.43, these calculations did not employ metadynamics accelerated conformational sampling. The model bias measured as the average of the self-RBFEs is within statistical uncertainty for all three sets. However, the statistical spread of the estimates as measured by the average unsigned errors (AUEs) is relatively large (, , and kcal/mol for the c-Met, Syk, and CDK8 sets, respectively, see the Supplementary Information) and comparable to the AUEs relative to the experiments of the RBFEs between dissimilar ligands of the same sets obtained by Chen at al.43 (, , and kcal/mol, respectively) using the same setup and force field employed here.
![[Uncaptioned image]](/html/2310.14350/assets/x7.png)
![[Uncaptioned image]](/html/2310.14350/assets/x8.png)
![[Uncaptioned image]](/html/2310.14350/assets/x9.png)
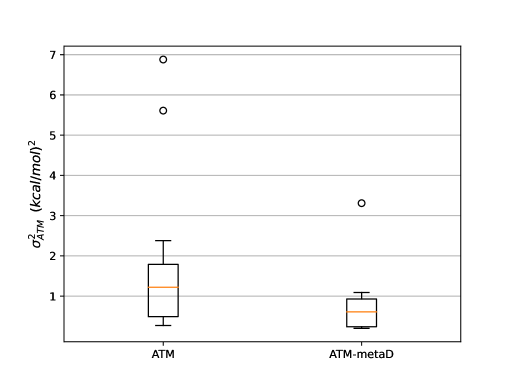
To gain a better understanding of the sources of statistical noise affecting the self-RBFE estimates, we performed a similar analysis as for the TMC125 and TMC278 inhibitors of HIV-RT above on a small subset of randomly picked ligands of the c-Met, Syk, and CDK8 sets. We conducted five self-RBFE replicates for each complex in the subset to estimate the model bias and variance with and without metadynamics accelerated conformational sampling (Supplementary tables 4, 5 and 6). The results show that self-RBFE ATM’s model bias is consistently small and within statistical uncertainty (Table 3). They also show that the self-RBFEs without accelerated conformational sampling vary considerably from one ligand to another. We observe that metadynamics sampling reduces the model variance in most cases (Figure 7). Without metadynamics sampling, the median self-RBFE model variance ATM calculations is approximately (kcal/mol)2 with some outliers reaching up to (kcal/mol)2. In contrast, the median self-RBFE variance with ATM-metaD is significantly reduced to approximately (kcal/mol)2 with fewer and less severe outliers (Figure 7).
| ATM | ATM+MetaD | ||||
| Ligand | averagea,c | varianceb | averagea,c | varianceb | a,c |
| HIV-RT | |||||
| TMC125 | |||||
| TMC278 | |||||
| c-Met | |||||
| CHEMBL3402742 | |||||
| CHEMBL3402749 | |||||
| CHEMBL3402755 | |||||
| Syk | |||||
| CHEMBL3264999 | |||||
| CHEMBL3265004 | |||||
| CHEMBL3265034 | |||||
| CHEMBL3265037 | |||||
| CDK8 | |||||
| Ligand 17 | |||||
| Ligand 19 | |||||
| Ligand 37 | |||||
| Ligand 38 | |||||
aIn kcal/mol. bIn (kcal/mol)2 cErrors are reported as twice the standard error of the mean.
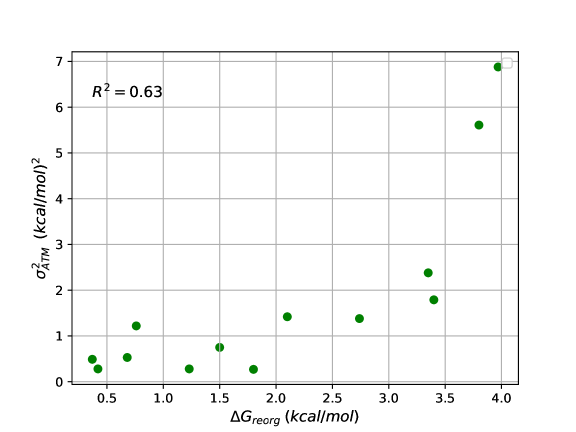
Following the insights we obtained for the HIV-RT systems, we set out to explain the large variations in self-RBFE statistical fluctuations by testing the hypothesis that self-RBFE model variance is larger for ligands that undergo a large reorganization upon binding and that, consequently, metadynamics accelerated conformational sampling would be most beneficial for ligands suffering a large reorganization free energy penalty but less so for ligands that do not appreciably reorganize upon binding. Accordingly, we calculated the reorganization free energy for binding for the same subset of ligands (Table 3) and found a strong statistical correlation between the self-RBFE model variance and the magnitude of the ligand reorganization free energy (Figure 8). This analysis reveals that about 63% of the spread of model variance is explained by the reorganization of the ligand from the solution to the bound state.
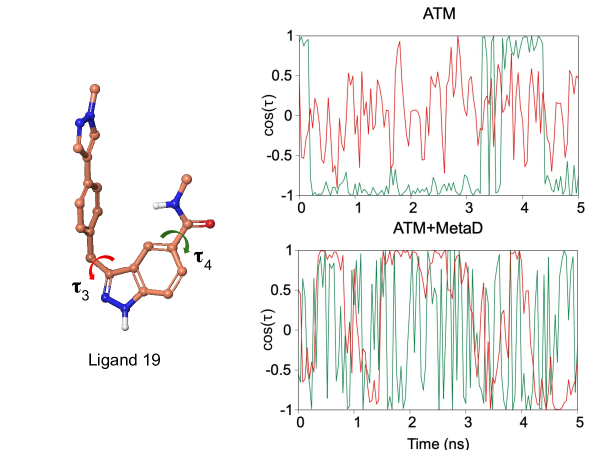
The result provides support to the conclusion that, generally, accelerated sampling of the internal degrees of the ligands reduces the variance by better representing the equilibration between the unbound and bound states of the ligand. One representative case of the many we observed is self-RBFE calculation of ligand 19 of the CDK8 protein target (Figure 9). Similarly to the TMC278 in Figure 5 above, we actively sampled the and torsional angles of 19 using metadynamics. Without metadynamics sampling (Figure 9, left panel), the ligand often gets trapped in conformations favored in solution. For example, the hindered amide torsional angle represented by visits predominantly in-plane configurations (Figure 9, left panel, green trace). In contrast, with metadynamics sampling (ATM-MetaD), the ligand visits a wide range of conformations that span preferred bound and solution conformations, resulting in smaller self-RBFE statistical fluctuations (Table 3).
4 Discussion
Binding free energy models are routinely validated against experimental datasets.10, 12, 14, 15, 5, 17, 19, 43 However because the models’ biases – the differences between the binding free energies and the values that the models would yield after infinite sampling – are not known, it is unclear how the results of these benchmarks can be used to improve the accuracy of the models. It is often found, for example, that increasing the level of accuracy of the force field does not significantly change the average deviation from the experimental data,18, 69 raising the possibility that statistical uncertainties, rather than inaccuracy of the model, dominate the observed model errors. One largely uncontrollable source of noise is the target experimental activity data, which varies depending on the conditions and does not always reliably report the actual binding strength.70, 71 However, a likely more pervasive source of statistical noise is the random variation of the free energy models’ predictions due to incomplete conformational sampling72, 8 during the relatively short simulations that are the norm in applied work. Thus, to truly appreciate the performance of binding free energy models, it is critical to investigate not only the models’ biases but also their variances.
In this work, we studied the statistical properties of relative binding free energy calculations for a ligand relative to itself (self-RBFE) to assess the bias and variance of the Alchemical Transfer Method (ATM) for systems relevant to structure-based drug discovery. Because the true value of a self-RBFE is known to be zero, we were able to estimate the bias and the variance independently by running a series of replicate calculations of the same length. We found that, while ATM’s self-RBFE bias is generally small, its variance can be occasionally quite large. We found, in fact, that the magnitudes of the self-RBFE statistical errors we measured here account for to % the average ATM errors of recent RBFE benchmarks on the same systems.43 This result is even more remarkable, considering that self-RBFEs are more straightforward transformations and likely suffer less bias than RBFEs between dissimilar ligands. Overall, the results obtained here raise the tantalizing possibility that a significant reduction of ATM’s model error can be achieved by better conformational sampling alone.
To begin along this path, we found that, for ligands that reorganize upon binding, large statistical fluctuations are caused by conformational trapping of the ligands in their solution conformations, thereby preventing proper equilibration between unbound and bound states. As a further confirmation, we established that accelerated metadynamics conformational sampling along torsional degrees of the ligand can significantly reduce the statistical variance of self-RBFEs, and, in one case (TMC125 vs. TMC278), it yielded an RBFE estimate in closer agreement with the experiment.
The reorganization free energy of binding,73, 49, 50, 51 also known in the literature as induced-fit and intramolecular strain,74, 75 has a profound effect on binding affinities.76, 60, 77, 78, 79, 80 It originates from the free energy cost for the ligand and the receptor81 to assume binding-competent conformations from their conformational ensembles when free in solution. Thus, it is important to capture reorganization effects in alchemical binding free energy calculations. Often, this requires accelerated conformational sampling algorithms to avoid conformational trapping.45 In this work, we accelerated the sampling of the intramolecular torsional degrees of the ligand by employing a biasing potential derived from metadynamics82 that flattens the conformational landscape of the ligand in solution. This approach significantly enhanced the convergence of binding free energy estimates for ligands that reorganize upon binding. However, the more thorough exploration of the degrees of freedom of the ligand unnecessarily expanded the conformational sampling of ligands that do not reorganize upon binding, resulting in a slowdown rather than an enhancement of their rate of convergence. This approach also does not directly address the equally important reorganization of the receptor.81 Nevertheless, here accelerated metadynamics conformational sampling had a significant net positive effect in general, mostly by removing large outliers.
5 Conclusions
We evaluated the self-RBFE technique to assess the intrinsic statistical fluctuations of the Alchemical Transfer Method (ATM) relative binding free energy estimator. We illustrate the approach to a small set of HIV-RT inhibitors and apply it to large datasets often used to benchmark the accuracy of alchemical relative binding free energy methods. We thoroughly examined the variance and bias of the self-RBFE calculations to gain insights into the source of errors often observed when comparing calculated RBFEs to experimental values. We find evidence that a significant fraction of these errors could be due to statistical noise. Hence, the reduction of statistical fluctuations should be taken as a priority when attempting to use the results of benchmarking studies to improve the accuracy of free energy models. Self-RBFE tests are limited to the validation of dual- and hybrid-topology alchemical relative binding free energy methods. However, the results obtained here confirm the benefits of assessing free energy models in general by means of validation tests on transformations with known true values, such as cycle-closure,22 to assess the inherent statistical fluctuations of free energy estimators.
Notably, we find that ligand reorganization is a significant contributing factor to the statistical variance of binding free energy estimates and that accelerated conformational sampling of the degrees of freedom of the ligand can drastically reduce the time to convergence. In this work, we employ a metadynamics-based approach to enhance the sampling of slow torsional degrees of freedom of the ligand that often cause conformational trapping.
The additional computational cost of self-RBFE tests and metadynamics-based conformational sampling and analysis of ligand conformational variability in solution is relatively minor compared to the already high demands of relative binding free energy campaigns and the substantial benefits coming from the greater reliability and the deeper assessment of the predictions. We recommend wide adoption of these practices.
6 Acknowledgements
We acknowledge support from the National Science Foundation (NSF CAREER 1750511 to E.G.).
7 Supplementary Information
The Supplementary Information document lists the self-RBFEs of the complexes from the Schindler et al. benchmark set, and the results of the replicates of the 11 complexes in the subset analyzed with and without accelerated metadynamics sampling.
8 Data and Software Availability
The AToM-OpenMM software used in this study is publicly available at https://github.com/Gallicchio-Lab/AToM-OpenMM. The molecular system files, AToM-OpenMM input files, and the analysis scripts for each ligand in the benchmark set used here are publicly available on GitHub at https://github.com/sheenam1509/self-rbfe.git.
References
- Abel et al. 2017 Abel, R.; Wang, L.; Harder, E. D.; Berne, B.; Friesner, R. A. Advancing drug discovery through enhanced free energy calculations. Acc. Chem. Res. 2017, 50, 1625–1632
- Armacost et al. 2020 Armacost, K. A.; Riniker, S.; Cournia, Z. Novel directions in free energy methods and applications. 2020
- Zhang et al. 2021 Zhang, C.-H.; Stone, E. A.; Deshmukh, M.; Ippolito, J. A.; Ghahremanpour, M. M.; Tirado-Rives, J.; Spasov, K. A.; Zhang, S.; Takeo, Y.; Kudalkar, S. N., et al. Potent noncovalent inhibitors of the main protease of SARS-CoV-2 from molecular sculpting of the drug perampanel guided by free energy perturbation calculations. ACS Central Science 2021, 7, 467–475
- Allen et al. 2022 Allen, B. K.; Kulkarni, M. M.; Chamberlain, B.; Dwight, T.; Koh, C.; Samant, R.; Jernigan, F.; Rice, J.; Tan, D.; Li, S.; Marino, K.; Huang, H.; Chiswick, E.; Tesar, B.; Sparks, S.; Lin, Z.; McGee, T. D.; Kolossváry, I.; Lin, C.; Shechter, S.; Soutter, H.; Bastos, C.; Taimi, M.; Lai, S.; Petrin, A.; Kane, T.; Swann, S.; Gardner, H.; Winter, C.; Sherman, W. Design of a systemic small molecule clinical STING agonist using physics-based simulations and artificial intelligence. bioRxiv 2022,
- Ganguly et al. 2022 Ganguly, A.; Tsai, H.-C.; Fernández-Pendás, M.; Lee, T.-S.; Giese, T. J.; York, D. M. AMBER Drug Discovery Boost Tools: Automated Workflow for Production Free-Energy Simulation Setup and Analysis (ProFESSA). J. Chem. Inf. Model. 2022, 62, 6069–6083
- Xu 2022 Xu, H. The slow but steady rise of binding free energy calculations in drug discovery. J. Comp. Aid. Mol. Des. 2022, 1–8
- Mobley 2012 Mobley, D. L. Let’s get honest about sampling. J Comput Aided Mol Des 2012, 26, 93–95
- Procacci 2019 Procacci, P. Solvation free energies via alchemical simulations: let’s get honest about sampling, once more. Phys. Chem. Chem. Phys. 2019, 21, 13826–13834
- Gallicchio et al. 2014 Gallicchio, E.; Deng, N.; He, P.; Perryman, A. L.; Santiago, D. N.; Forli, S.; Olson, A. J.; Levy, R. M. Virtual Screening of Integrase Inhibitors by Large Scale Binding Free Energy Calculations: the SAMPL4 Challenge. J. Comput.-Aided Mol. Des. 2014, 28, 475–490
- Wang et al. 2015 Wang, L.; Wu, Y.; Deng, Y.; Kim, B.; Pierce, L.; Krilov, G.; Lupyan, D.; Robinson, S.; Dahlgren, M. K.; Greenwood, J.; Romero, D. L.; Mass, C.; Knight, L. J.; Steinbrecher, T.; Beuming, T.; Damm, W.; Harder, E.; Sherman, W.; Brewer, M.; Wester, R.; Murcho, M.; Frye, L.; Farid, R.; Lin, T.; Mobley, D. L.; Jorgensen, W. L.; Berne, B. J.; Friesner, R. A.; Abel, R. Accurate and Reliable Prediction of Relative Ligand Binding Potency in Prospective Drug Discovery by Way of a Modern Free-Energy Calculation Protocol and Force Field. J. Am. Chem. Soc. 2015, 137, 2695–2703
- Zou et al. 2019 Zou, J.; Tian, C.; Simmerling, C. Blinded prediction of protein–ligand binding affinity using Amber thermodynamic integration for the 2018 D3R grand challenge 4. J. Comput.-Aided Mol. Des. 2019, 33, 1021–1029
- Schindler et al. 2020 Schindler, C. E.; Baumann, H.; Blum, A.; Böse, D.; Buchstaller, H.-P.; Burgdorf, L.; Cappel, D.; Chekler, E.; Czodrowski, P.; Dorsch, D.; I, E. M. K.; Follows, B.; Fuchs, T.; Grädler, U.; Gunera, J.; Johnson, T.; Lebrun, C. J.; Karra, S.; Klein, M.; Knehans, T.; Koetzner, L.; Krier, M.; Leiendecker, M.; Leuthner, B.; Li, L.; Mochalkin, I.; Musil, D.; Neagu, C.; Rippmann, F.; Schiemann, K.; Schulz, R.; Steinbrecher, T.; Tanzer, E.-M.; Unzue Lopez, A.; Viacava Follis, A.; Wegener, A.; Kuhn, D. Large-scale assessment of binding free energy calculations in active drug discovery projects. J. Chem. Inf. Model. 2020, 60, 5457–5474
- Lee et al. 2020 Lee, T.-S.; Allen, B. K.; Giese, T. J.; Guo, Z.; Li, P.; Lin, C.; McGee Jr, T. D.; Pearlman, D. A.; Radak, B. K.; Tao, Y.; Tsai, H.-C.; Xu, H.; Sherman, W.; York, D. M. Alchemical Binding Free Energy Calculations in AMBER20: Advances and Best Practices for Drug Discovery. J. Chem. Inf. Model. 2020, 60, 5595–5623
- Kuhn et al. 2020 Kuhn, M.; Firth-Clark, S.; Tosco, P.; Mey, A. S.; Mackey, M.; Michel, J. Assessment of binding affinity via alchemical free-energy calculations. J. Chem. Inf. Model. 2020, 60, 3120–3130
- Gapsys et al. 2020 Gapsys, V.; Pérez-Benito, L.; Aldeghi, M.; Seeliger, D.; Van Vlijmen, H.; Tresadern, G.; De Groot, B. L. Large scale relative protein ligand binding affinities using non-equilibrium alchemy. Chemical Science 2020, 11, 1140–1152
- Bieniek et al. 2021 Bieniek, M. K.; Bhati, A. P.; Wan, S.; Coveney, P. V. TIES 20: Relative binding free energy with a flexible superimposition algorithm and partial ring morphing. J. Chem. Theory Comput. 2021, 17, 1250–1265
- Hahn et al. 2022 Hahn, D.; Bayly, C.; Boby, M. L.; Bruce Macdonald, H.; Chodera, J.; Gapsys, V.; Mey, A.; Mobley, D.; Perez Benito, L.; Schindler, C.; Tresadern, G.; Warren, G. Best Practices for Constructing, Preparing, and Evaluating Protein-Ligand Binding Affinity Benchmarks [Article v1.0]. Living Journal of Computational Molecular Science 2022, 4, 1497
- Gapsys et al. 2022 Gapsys, V.; Hahn, D. F.; Tresadern, G.; Mobley, D. L.; Rampp, M.; de Groot, B. L. Pre-exascale computing of protein–ligand binding free energies with open source software for drug design. J. Chem. Inf. Model. 2022, 62, 1172–1177
- Sabanés Zariquiey et al. 2023 Sabanés Zariquiey, F.; Pérez, A.; Majewski, M.; Gallicchio, E.; De Fabritiis, G. Validation of the Alchemical Transfer Method for the Estimation of Relative Binding Affinities of Molecular Series. J. Chem. Inf. Model. 2023, 63, 2438–2444
- Cournia et al. 2017 Cournia, Z.; Allen, B.; Sherman, W. Relative binding free energy calculations in drug discovery: recent advances and practical considerations. J. Chem. Inf. Model. 2017, 57, 2911–2937
- Jorgensen 2004 Jorgensen, W. L. The many roles of computation in drug discovery. Science 2004, 303, 1813–1818
- Mey et al. 2020 Mey, A. S. J. S.; Allen, B. K.; Macdonald, H. E. B.; Chodera, J. D.; Hahn, D. F.; Kuhn, M.; Michel, J.; Mobley, D. L.; Naden, L. N.; Prasad, S.; Rizzi, A.; Scheen, J.; Shirts, M. R.; Tresadern, G.; Xu, H. Best Practices for Alchemical Free Energy Calculations [Article v1.0]. Living Journal of Computational Molecular Science 2020, 2, 18378
- Azimi et al. 2022 Azimi, S.; Khuttan, S.; Wu, J. Z.; Pal, R. K.; Gallicchio, E. Relative binding free energy calculations for ligands with diverse scaffolds with the alchemical transfer method. J. Chem. Inf. Model. 2022, 62, 309–323
- Liu et al. 2013 Liu, S.; Wu, Y.; Lin, T.; Abel, R.; Redmann, J. P.; Summa, C. M.; Jaber, V. R.; Lim, N. M.; Mobley, D. L. Lead optimization mapper: automating free energy calculations for lead optimization. J. Comput.-Aided Mol. Des. 2013, 27, 755–770
- Sakae et al. 2020 Sakae, Y.; Zhang, B. W.; Levy, R. M.; Deng, N. Absolute protein binding free energy simulations for ligands with multiple poses, a thermodynamic path that avoids exhaustive enumeration of the poses. J. Comp. Chem. 2020, 41, 56–68
- Khuttan et al. 2023 Khuttan, S.; Azimi, S.; Wu, J. Z.; Dick, S.; Wu, C.; Xu, H.; Gallicchio, E. Taming multiple binding poses in alchemical binding free energy prediction: the -cyclodextrin host–guest SAMPL9 blinded challenge. Phys. Chem. Chem. Phys. 2023, 25, 24364–24376
- Gilson et al. 1997 Gilson, M. K.; Given, J. A.; Bush, B. L.; McCammon, J. A. The Statistical-Thermodynamic Basis for Computation of Binding Affinities: A Critical Review. Biophys. J. 1997, 72, 1047–1069
- Rocklin et al. 2013 Rocklin, G. J.; Mobley, D. L.; Dill, K. A.; Hünenberger, P. H. Calculating the binding free energies of charged species based on explicit-solvent simulations employing lattice-sum methods: An accurate correction scheme for electrostatic finite-size effects. J. Chem. Phys. 2013, 139, 11B606_1
- Fleck et al. 2021 Fleck, M.; Wieder, M.; Boresch, S. Dummy atoms in alchemical free energy calculations. J. Chem. Theory Comput. 2021, 17, 4403–4419
- Jiang et al. 2019 Jiang, W.; Chipot, C.; Roux, B. Computing relative binding affinity of ligands to receptor: An effective hybrid single-dual-topology free-energy perturbation approach in NAMD. J. Chem. Inf. Model. 2019, 59, 3794–3802
- Gallicchio 2022 Gallicchio, E. In Computational Peptide Science: Methods and Protocols; Simonson, T., Ed.; Methods in Molecular Biology; Springer Nature, 2022; pp 303–334
- Harger et al. 2017 Harger, M.; Li, D.; Wang, Z.; Dalby, K.; Lagardère, L.; Piquemal, J.-P.; Ponder, J.; Ren, P. Tinker-OpenMM: Absolute and relative alchemical free energies using AMOEBA on GPUs. J. Comp. Chem. 2017, 38, 2047–2055
- Panel et al. 2018 Panel, N.; Villa, F.; Fuentes, E. J.; Simonson, T. Accurate PDZ/peptide binding specificity with additive and polarizable free energy simulations. Biophys. J. 2018, 114, 1091–1102
- Huang et al. 2018 Huang, J.; Lemkul, J. A.; Eastman, P. K.; MacKerell Jr., A. D. Molecular dynamics simulations using the drude polarizable force field on GPUs with OpenMM: Implementation, validation, and benchmarks. J. Comput. Chem. 2018, 39, 1682–1689
- Das et al. 2022 Das, A. K.; Liu, M.; Head-Gordon, T. Development of a Many-Body Force Field for Aqueous Alkali Metal and Halogen Ions: An Energy Decomposition Analysis Guided Approach. J. Chem. Theory and Comput. 2022, 18, 953–967
- Beierlein et al. 2011 Beierlein, F. R.; Michel, J.; Essex, J. W. A simple QM/MM approach for capturing polarization effects in protein- ligand binding free energy calculations. J. Phys. Chem. B 2011, 115, 4911–4926
- Lodola and De Vivo 2012 Lodola, A.; De Vivo, M. Adv. Protein Chem. Struct. Biol.; Elsevier, 2012; Vol. 87; pp 337–362
- Hudson et al. 2019 Hudson, P. S.; Woodcock, H. L.; Boresch, S. Use of interaction energies in QM/MM free energy simulations. J. Chem. Theory Comput. 2019, 15, 4632–4645
- Casalino et al. 2020 Casalino, L.; Nierzwicki, Ł.; Jinek, M.; Palermo, G. Catalytic mechanism of non-target DNA cleavage in CRISPR-Cas9 revealed by ab initio molecular dynamics. ACS catalysis 2020, 10, 13596–13605
- Smith et al. 2019 Smith, J. S.; Nebgen, B. T.; Zubatyuk, R.; Lubbers, N.; Devereux, C.; Barros, K.; Tretiak, S.; Isayev, O.; Roitberg, A. E. Approaching coupled cluster accuracy with a general-purpose neural network potential through transfer learning. Nature Commun. 2019, 10, 1–8
- Rufa et al. 2020 Rufa, D. A.; Macdonald, H. E. B.; Fass, J.; Wieder, M.; Grinaway, P. B.; Roitberg, A. E.; Isayev, O.; Chodera, J. D. Towards chemical accuracy for alchemical free energy calculations with hybrid physics-based machine learning/molecular mechanics potentials. BioRxiv 2020,
- Eastman et al. 2023 Eastman, P.; Galvelis, R.; Peláez, R. P.; Abreu, C. R. A.; Farr, S. E.; Gallicchio, E.; Gorenko, A.; Henry, M. M.; Hu, F.; Huang, J.; Krämer, A.; Michel, J.; Mitchell, J. A.; Pande, V. S.; Rodrigues, J. P.; Rodriguez-Guerra, J.; Simmonett, A. C.; Swails, J.; Zhang, I.; Chodera, J. D.; Fabritiis, G. D.; Markland, T. E. OpenMM 8: Molecular Dynamics Simulation with Machine Learning Potentials. arXiv 2023, 2310.03121
- Chen et al. 2023 Chen, L.; Wu, Y.; Wu, C.; Silveira, A.; Sherman, W.; Xu, H.; Gallicchio, E. Performance and Analysis of the Alchemical Transfer Method for Binding Free Energy Predictions of Diverse Ligands. arXiv 2023, 2308.08671
- Barducci et al. 2008 Barducci, A.; Bussi, G.; Parrinello, M. Well-tempered metadynamics: a smoothly converging and tunable free-energy method. Phys. Rev. Lett. 2008, 100, 020603
- Wang et al. 2013 Wang, L.; Deng, Y.; Knight, J. L.; Wu, Y.; Kim, B.; Sherman, W.; Shelley, J. C.; Lin, T.; Abel, R. Modeling local structural rearrangements using FEP/REST: application to relative binding affinity predictions of CDK2 inhibitors. J. Chem. Theory Comput. 2013, 9, 1282–1293
- Wu et al. 2021 Wu, J. Z.; Azimi, S.; Khuttan, S.; Deng, N.; Gallicchio, E. Alchemical transfer approach to absolute binding free energy estimation. J. Chem. Theory Comput. 2021, 17, 3309–3319
- Pal and Gallicchio 2019 Pal, R. K.; Gallicchio, E. Perturbation potentials to overcome order/disorder transitions in alchemical binding free energy calculations. J. Chem. Phys. 2019, 151, 124116
- Khuttan et al. 2021 Khuttan, S.; Azimi, S.; Wu, J. Z.; Gallicchio, E. Alchemical transformations for concerted hydration free energy estimation with explicit solvation. J. Chem. Phys. 2021, 154, 054103
- Gallicchio and Levy 2011 Gallicchio, E.; Levy, R. M. Recent Theoretical and Computational Advances for Modeling Protein-Ligand Binding Affinities. Adv. Prot. Chem. Struct. Biol. 2011, 85, 27–80
- Foloppe and Chen 2016 Foloppe, N.; Chen, I. Towards understanding the unbound state of drug compounds: Implications for the intramolecular reorganization energy upon binding. Bioorg. & Med. Chem. 2016, 24 10, 2159–89
- Foloppe and Chen 2021 Foloppe, N.; Chen, I. The reorganization energy of compounds upon binding to proteins, from dynamic and solvated bound and unbound states. Bioorg. & Med. Chem. 2021, 51, 116464
- Yang et al. 2009 Yang, C.-Y.; Sun, H.; Chen, J.; Nikolovska-Coleska, Z.; Wang, S. Importance of ligand reorganization free energy in protein-ligand binding-affinity prediction. J. Am. Chem. Soc. 2009, 131 38, 13709–21
- Huber et al. 1994 Huber, T.; Torda, A. E.; Van Gunsteren, W. F. Local elevation: a method for improving the searching properties of molecular dynamics simulation. J. Comp. Aided Mol. Des. 1994, 8, 695–708
- Grubmüller 1995 Grubmüller, H. Predicting slow structural transitions in macromolecular systems: Conformational flooding. Phys. Rev. E 1995, 52, 2893
- Laio and Parrinello 2002 Laio, A.; Parrinello, M. Escaping free-energy minima. Proc. Natl. Acad. Sci. (USA) 2002, 99, 12562–12566
- Iannuzzi et al. 2003 Iannuzzi, M.; Laio, A.; Parrinello, M. Efficient exploration of reactive potential energy surfaces using Car-Parrinello molecular dynamics. Phys. Rev. Lett. 2003, 90, 238302
- Eastman et al. 2017 Eastman, P.; Swails, J.; Chodera, J. D.; McGibbon, R. T.; Zhao, Y.; Beauchamp, K. A.; Wang, L.-P.; Simmonett, A. C.; Harrigan, M. P.; Stern, C. D.; Wiewiora, R. P.; Brooks, B. R.; Pande, V. S. OpenMM 7: Rapid development of high performance algorithms for molecular dynamics. PLoS Comput. Biol. 2017, 13, e1005659
- Eastman 2018 Eastman, P. K. Metadynamics. 2018; \urlhttp://docs.openmm.org/latest/api-python/generated/openmm.app.metadynamics.Metadynamics.html
- Okumura et al. 2010 Okumura, H.; Gallicchio, E.; Levy, R. M. Conformational populations of ligand-sized molecules by replica exchange molecular dynamics and temperature reweighting. J. Comput. Chem. 2010, 31, 1357–1367
- Gallicchio 2012 Gallicchio, E. Role of Ligand Reorganization and Conformational Restraints on the Binding Free Energies of DAPY Non-Nucleoside Inhibitors to HIV Reverse Transcriptase. Mol. Biosc. 2012, 2, 7–22
- Wang et al. 2017 Wang, L.; Deng, Y.; Wu, Y.; Kim, B.; LeBard, D. N.; Wandschneider, D.; Beachy, M.; Friesner, R. A.; Abel, R. Accurate modeling of scaffold hopping transformations in drug discovery. J. Chem. Theory Comput. 2017, 13, 42–54
- Schindler and Kuhn 2019 Schindler, C.; Kuhn, D. fep-benchmark. 2019; \urlhttps://github.com/MCompChem/fep-benchmark
- Lansdon et al. 2010 Lansdon, E. B.; Brendza, K. M.; Hung, M.; Wang, R.; Mukund, S.; Jin, D.; Birkus, G.; Kutty, N.; Liu, X. Crystal structures of HIV-1 reverse transcriptase with etravirine (TMC125) and rilpivirine (TMC278): implications for drug design. J Med Chem 2010, 53, 4295–4299
- Das et al. 2008 Das, K.; Bauman, J. D.; Clark, A. D.; Frenkel, Y. V.; Lewi, P. J.; Shatkin, A. J.; Hughes, S. H.; Arnold, E. High-resolution structures of HIV-1 reverse transcriptase/TMC278 complexes: strategic flexibility explains potency against resistance mutations. Proc Natl Acad Sci U S A 2008, 105, 1466–1471
- Case et al. 2019 Case, D.; Aktulga, H.; Belfon, K.; Ben-Shalom, I.; Berryman, J.; Brozell, S.; Cerutti, D.; Cheatham, T.; III,; Cisneros, G.; Cruzeiro, V.; Darden, T.; Duke, R.; Giambasu, G.; Gilson, M.; Gohlke, H.; Goetz, A.; Harris, R.; Izadi, S.; Izmailov, S.; Kasavajhala, K.; Kaymak, M.; King, E.; Kovalenko, A.; Kurtzman, T.; Lee, T.; LeGrand, S.; Li, P.; Lin, C.; Liu, J.; Luchko, T.; Luo, R.; Machado, M.; Man, V.; Manathunga, M.; Merz, K.; Miao, Y.; Mikhailovskii, O.; Monard, G.; Nguyen, H.; OHearn, K.; Onufriev, A.; Pan, F.; Pantano, S.; Qi, R.; Rahnamoun, A.; Roe, D.; Roitberg, A.; Sagui, C.; Schott-Verdugo, S.; Shajan, A.; Shen, J.; Simmerling, C.; Skrynnikov, N.; Smith, J.; Swails, J.; Walker, R.; Wang, J.; Wang, J.; Wei, H.; Wolf, R.; Wu, X.; Xiong, Y.; Xue, Y.; York, D.; Zhao, S.; ; Kollman, P. Amber 2019. 2019; \urlhttps://ambermd.org/
- Gallicchio et al. 2015 Gallicchio, E.; Xia, J.; Flynn, W. F.; Zhang, B.; Samlalsingh, S.; Mentes, A.; Levy, R. M. Asynchronous replica exchange software for grid and heterogeneous computing. Comput. Phys. Commun. 2015, 196, 236–246
- Tan et al. 2012 Tan, Z.; Gallicchio, E.; Lapelosa, M.; Levy, R. M. Theory of binless multi-state free energy estimation with applications to protein-ligand binding. J. Chem. Phys. 2012, 136, 144102
- Das et al. 2008 Das, K.; Bauman, J. D.; Clark, A. D.; Frenkel, Y. V.; Lewi, P. J.; Shatkin, A. J.; Hughes, S. H.; Arnold, E. High-resolution structures of HIV-1 reverse transcriptase/TMC278 complexes: Strategic flexibility explains potency against resistance mutations. Proc. Natl. Acad. Sci. (USA) 2008, 105, 1466 – 1471
- Hahn et al. 2023 Hahn, D.; Gapsys, V.; de Groot, B.; Mobley, D.; Tresadern, G. Current state of open source force fields in protein-ligand binding affinity predictions. ChemRxiv 2023,
- Brown et al. 2009 Brown, S. P.; Muchmore, S. W.; Hajduk, P. J. Healthy skepticism: assessing realistic model performance. Drug Discov Today 2009, 14, 420–427
- Tresadern et al. 2022 Tresadern, G.; Tatikola, K.; Cabrera, J.; Wang, L.; Abel, R.; van Vlijmen, H.; Geys, H. The impact of experimental and calculated error on the performance of affinity predictions. J. Chem. Inf. Model. 2022, 62, 703–717
- Mobley 2012 Mobley, D. L. Lets get honest about sampling. J. Comp. Aided Mol. Des. 2012, 26, 93–95
- Yang et al. 2009 Yang, C.-Y.; Sun, H.; Chen, J.; Nikolovska-Coleska, Z.; Wang, S. Importance of ligand reorganization free energy in protein-ligand binding-affinity prediction. J. Am. Chem. Soc. 2009, 131, 13709–13721
- Kar et al. 2010 Kar, G.; Keskin, O.; Gursoy, A.; Nussinov, R. Allostery and population shift in drug discovery. Curr Opin Pharmacol 2010, 10, 715–722
- Cournia et al. 2020 Cournia, Z.; Allen, B. K.; Beuming, T.; Pearlman, D. A.; Radak, B. K.; Sherman, W. Rigorous free energy simulations in virtual screening. J. Chem. Inf. Model. 2020, 60, 4153–4169
- DeLorbe et al. 2009 DeLorbe, J. E.; Clements, J. H.; Teresk, M. G.; Benfield, A. P.; Plake, H. R.; Millspaugh, L. E.; Martin, S. F. Thermodynamic and structural effects of conformational constraints in protein-ligand interactions. Entropic paradoxy associated with ligand preorganization. J. Am. Chem. Soc. 2009, 131, 16758–16770
- Wickstrom et al. 2016 Wickstrom, L.; Deng, N.; He, P.; Mentes, A.; Nguyen, C.; Gilson, M. K.; Kurtzman, T.; Gallicchio, E.; Levy, R. M. Parameterization of an effective potential for protein–ligand binding from host–guest affinity data. J. Mol. Recognition 2016, 29, 10–21
- Wickstrom et al. 2013 Wickstrom, L.; He, P.; Gallicchio, E.; Levy, R. M. Large Scale Affinity Calculations of Cyclodextrin Host-Guest Complexes: Understanding the Role of Reorganization in the Molecular Recognition Process. J. Chem. Theory Comput. 2013, 9, 3136–3150
- Zheng et al. 2017 Zheng, Y.; Tice, C. M.; Singh, S. B. Conformational control in structure-based drug design. Bioorg. & Med. Chem. Lett. 2017, 27, 2825–2837
- Pinheiro et al. 2023 Pinheiro, P. d. S. M.; Franco, L. S.; Fraga, C. A. M. The Magic Methyl and Its Tricks in Drug Discovery and Development. Pharmaceuticals 2023, 16, 1157
- 81 Fajer, M.; Borrelli, K.; Abel, R.; Wang, L. Quantitatively Accounting for Protein Reorganization in Computer-Aided Drug Design. J. Chem. Theory Comput. 19, 3080–3090
- Bussi et al. 2018 Bussi, G.; Laio, A.; Tiwary, P. Metadynamics: A Unified Framework for Accelerating Rare Events and Sampling Thermodynamics and Kinetics. Handbook of Materials Modeling: Methods: Theory and Modeling 2018, 1–31
ToC Graphic
![[Uncaptioned image]](/html/2310.14350/assets/x13.png)
Supplementary Information
This supplementary document contains the self-RBFE values for the entire set of c-Met, Syk, and CDK8 complexes discussed in the paper. Additionally, self-RBFEs from the five replicates for the subset of complexes with ATM and ATM+MetaD chosen from c-Met, Syk, and CDK8 are listed.
| Ligand | (ATM)a |
|---|---|
| CHEMBL3402741 | 0.78 |
| CHEMBL3402742 | -1.80 |
| CHEMBL3402743 | 0.43 |
| CHEMBL3402744 | -0.32 |
| CHEMBL3402745 | -0.57 |
| CHEMBL3402747 | -0.97 |
| CHEMBL3402748 | 2.29 |
| CHEMBL3402749 | 0.39 |
| CHEMBL3402750 | -0.91 |
| CHEMBL3402751 | -0.77 |
| CHEMBL3402752 | 0.09 |
| CHEMBL3402753 | 0.37 |
| CHEMBL3402755 | -2.12 |
| CHEMBL3402756 | -0.82 |
| CHEMBL3402757 | -0.17 |
| CHEMBL3402758 | -0.28 |
| CHEMBL3402759 | -0.33 |
| CHEMBL3402760 | 0.20 |
| CHEMBL3402761 | 0.02 |
| CHEMBL3402762 | 1.21 |
| CHEMBL3402763 | -0.55 |
| CHEMBL3402764 | -2.08 |
| CHEMBL3402765 | -2.63 |
| AUEa | 0.87 |
| averagea,c | |
| varianceb |
aIn kcal/mol. bIn (kcal/mol)2 cErrors are reported as twice the standard error of mean.
| Ligand | (ATM)a |
|---|---|
| CHEMBL3259820 | -0.95 |
| CHEMBL3264994 | -1.22 |
| CHEMBL3264995 | -0.93 |
| CHEMBL3264996 | 0.97 |
| CHEMBL3264997 | -0.48 |
| CHEMBL3264998 | -1.26 |
| CHEMBL3264999 | 1.17 |
| CHEMBL3265000 | 0.29 |
| CHEMBL3265001 | -0.02 |
| CHEMBL3265002 | -1.49 |
| CHEMBL3265003 | 0.41 |
| CHEMBL3265004 | 0.37 |
| CHEMBL3265005 | 0.16 |
| CHEMBL3265006 | -2.75 |
| CHEMBL3265008 | 0.51 |
| CHEMBL3265009 | -1.07 |
| CHEMBL3265010 | -3.77 |
| CHEMBL3265011 | -0.05 |
| CHEMBL3265012 | -0.51 |
| CHEMBL3265013 | -0.64 |
| CHEMBL3265014 | -0.05 |
| CHEMBL3265015 | -0.79 |
| CHEMBL3265016 | -0.96 |
| CHEMBL3265017 | 0.03 |
| CHEMBL3265018 | 1.39 |
| CHEMBL3265019 | -1.71 |
| CHEMBL3265020 | -0.42 |
| CHEMBL326502 | -1.15 |
| CHEMBL3265022 | 0.15 |
| CHEMBL3265023 | 0.56 |
| CHEMBL3265024 | -0.43 |
| CHEMBL3265025 | -0.64 |
| CHEMBL3265026 | -0.42 |
| CHEMBL3265027 | -1.19 |
| CHEMBL3265028 | 0.37 |
| CHEMBL3265029 | -0.34 |
| CHEMBL3265030 | 0.59 |
| CHEMBL3265031 | -1.05 |
| CHEMBL3265032 | 1.40 |
| CHEMBL3265033 | -0.66 |
| CHEMBL3265034 | 2.55 |
| CHEMBL3265035 | 1.25 |
| CHEMBL3265036 | -0.57 |
| CHEMBL3265037 | 0.21 |
| AUEa | 0.86 |
| averagea,c | |
| varianceb |
aIn kcal/mol. bIn (kcal/mol)2 cErrors are reported as twice the standard error of the mean.
| Complex Pair | (ATM)a |
|---|---|
| 13 | 0.01 |
| 14 | 0.16 |
| 15 | -1.32 |
| 16 | -0.27 |
| 17 | -2.17 |
| 18 | 0.03 |
| 19 | 2.93 |
| 20 | -0.65 |
| 21 | 0.85 |
| 22 | 1.75 |
| 23 | 0.44 |
| 24 | -2.03 |
| 25 | -0.87 |
| 26 | 0.48 |
| 27 | 0.50 |
| 28 | -0.16 |
| 29 | 0.19 |
| 30 | -0.38 |
| 31 | -0.11 |
| 32 | 2.42 |
| 33 | -0.14 |
| 34 | -0.93 |
| 35 | 0.14 |
| 36 | -1.05 |
| 37 | -0.97 |
| 38 | -0.95 |
| 39 | 1.25 |
| 40 | 0.25 |
| 41 | -0.79 |
| 42 | 0.12 |
| 43 | -0.37 |
| 44 | -1.55 |
| 45 | 0.15 |
| AUEa | |
| averagea,c | |
| varianceb |
aIn kcal/mol. bIn (kcal/mol)2 cErrors are reported as twice the standard error of the mean.
| Replicate | (ATM)a | (ATM+MetaD)a |
|---|---|---|
| CHEMBL3402742 | ||
| 1 | -1.80 | -0.79 |
| 2 | 0.12 | 0.21 |
| 3 | -0.04 | 0.19 |
| 4 | 1.03 | -0.21 |
| 5 | 0.76 | 0.47 |
| averagea,c | ||
| varianceb | ||
| CHEMBL3402749 | ||
| 1 | 0.39 | -0.10 |
| 2 | 1.49 | 0.20 |
| 3 | 2.39 | -0.79 |
| 4 | 1.07 | -0.90 |
| 5 | 1.20 | -0.45 |
| averagea,c | ||
| varianceb | ||
| CHEMBL3402755 | ||
| 1 | -2.12 | 0.52 |
| 2 | 0.18 | 0.35 |
| 3 | 0.77 | -0.07 |
| 4 | 0.91 | 0.54 |
| 5 | -0.96 | -0.49 |
| averagea,c | ||
| varianceb | ||
| overall varianceb | ||
aIn kcal/mol. bIn (kcal/mol)2 cErrors are reported as twice the standard error of the mean.
| Replicate | (ATM) | (ATM+MetaD) |
|---|---|---|
| CHEMBL3264999 | ||
| 1 | 1.17 | 2.15 |
| 2 | -1.79 | -0.32 |
| 3 | 0.93 | 0.83 |
| 4 | -1.09 | -2.65 |
| 5 | 0.71 | -1.00 |
| averagea,c | ||
| varianceb | ||
| CHEMBL3265004 | ||
| 1 | 0.37 | -0.46 |
| 2 | -0.91 | 0.33 |
| 3 | -0.26 | -0.81 |
| 4 | 0.15 | -0.48 |
| 5 | 1.44 | 0.70 |
| averagea,c | ||
| varianceb | ||
| CHEMBL3265034 | ||
| 1 | 2.55 | 0.56 |
| 2 | -0.16 | 0.77 |
| 3 | 0.77 | -0.90 |
| 4 | -0.47 | 0.26 |
| 5 | 0.26 | -0.01 |
| averagea,c | ||
| varianceb | ||
| CHEMBL3265037 | ||
| 1 | 0.21 | 0.59 |
| 2 | -1.00 | -1.00 |
| 3 | -0.47 | 1.10 |
| 4 | 0.21 | 0.02 |
| 5 | 0.02 | -0.01 |
| averagea,c | ||
| varianceb | ||
| overall varianceb | ||
aIn kcal/mol. bIn (kcal/mol)2 cErrors are reported as twice the standard error of the mean.
| Replicate | (ATM) | (ATM+MetaD) |
|---|---|---|
| Ligand 17 | ||
| 1 | -2.17 | 0.72 |
| 2 | 1.75 | 0.68 |
| 3 | 0.55 | -0.61 |
| 4 | -0.58 | -1.11 |
| 5 | 1.09 | -0.44 |
| averagea,c | ||
| varianceb | ||
| Ligand 19 | ||
| 1 | 2.93 | 1.18 |
| 2 | 1.58 | -0.66 |
| 3 | -1.39 | 0.21 |
| 4 | 3.34 | 0.29 |
| 5 | -1.67 | -1.34 |
| averagea,c | ||
| varianceb | ||
| Ligand 37 | ||
| 1 | ||
| 2 | ||
| 3 | ||
| 4 | ||
| 5 | ||
| averagea,c | ||
| varianceb | ||
| Ligand 38 | ||
| 1 | ||
| 2 | ||
| 3 | ||
| 4 | ||
| 5 | ||
| averagea,c | ||
| varianceb | ||
| overall varianceb | ||
aIn kcal/mol. bIn (kcal/mol)2 cErrors are reported as twice the standard error of the mean.