∎
Tel.: +98-23-31533429
22email: doost@semnan.ac.ir 33institutetext: H. Zarrabi 44institutetext: Iran Telecom Research Center (ITRC), Tehran, Iran.
44email: h.zarrabi@itrc.ac.ir 55institutetext: A. Doustmohammadian 66institutetext: Gastrointestinal and Liver Diseases Research Center, Iran University of Medical Sciences, Tehran, Iran.
66email: mohammadian.az@iums.ac.ir 77institutetext: H. R. Rabiee 88institutetext: Department of Computer Engineering, Sharif University of Technology, Tehran, Iran.
88email: rabiee@sharif.edu
Infection Curve Flattening via Targeted Interventions and Self-Isolation
Abstract
Understanding the impact of network clustering and small-world properties on epidemic spread can be crucial in developing effective strategies for managing and controlling infectious diseases. Particularly in this work, we study the impact of these network features on targeted intervention (e.g., self-isolation and quarantine). The targeted individuals for self-isolation are based on centrality measures and node influence metrics. Compared to our previous works on scale-free networks, small-world networks are considered in this paper. Small-world networks resemble real-world social and human networks. In this type of network, most nodes are not directly connected but can be reached through a few intermediaries (known as the small-worldness property). Real social networks, such as friendship networks, also exhibit this small-worldness property, where most people are connected through a relatively small number of intermediaries. We particularly study the epidemic curve flattening by centrality-based interventions/isolation over small-world networks. Our results show that high clustering while having low small-worldness (higher shortest path characteristics) implies flatter infection curves. In reality, a flatter infection curve implies that the number of new cases of a disease is spread out over a longer period of time, rather than a sharp and sudden increase in cases (a peak in epidemic). In turn, this reduces the strain on healthcare resources and helps to relieve the healthcare services.
Keywords:
Epidemic curve flattening distance distribution network science clustering small-worldness1 Introduction
Flattening the COVID-19 infection curve is key to ensuring health services aren’t overwhelmed by coronavirus cases nyt . It implies that the peak number of patients requiring healthcare at a time is reduced. In other words, flatter infection curve means that fewer people will need to be hospitalized at the same time, which can help prevent hospitals from becoming overwhelmed. This is done by both pharmaceutical (e.g., vaccination, medicine) and non-pharmaceutical intervention measures (e.g., social distancing, self-isolation, quarantine). A flattened curve distributes the needs for healthcare over time and keeps the peak of hospitalizations under the healthcare capacity. Recently social network studies have been of interest to investigate how COVID-19 spreads over real human networks chang2021mobility ; karaivanov2020social ; block2020social ; reyna2021virus (even cyber-physical contagion of malicious malware over information networks have been studied brett2021understanding ). These works study the epidemic from the scope of network science and graph theory. In this perspective, the types of the social network model (e.g., scale-free, clustered scale-free, small-world) and its graph-theoretic features (e.g., clustering, small-worldness, assortativity, preferential mixing, community structures) are of importance in the epidemiological network study.
The literature on the network science and dynamic modelling perspective of the epidemic is quite expansive. Here, we review a few most-relevant works in terms of probabilistic models, graph properties, and network types. It has been shown that, for the susceptible-infected-susceptible (SIS) model, clustering can speed-up propagation of the co-infected diseases as compared to non-clustered networks hebert2015complex , while, conversely, it slows down the spread of epidemic over hierarchical social networks grabowski2004epidemic and raises the epidemic outbreak threshold in single infection outbreak hebert2010propagation . In another perspective, shang2015epidemic shows that epidemics spread faster over networks with a higher level of overlapping communities. The effect of clustering in social networks is further studied by comparing scale-free and clustered scale-free networks, both flattening the infection curve SNAM23 and epidemic outbreak in the SIS model SNAM20 . Clustering plays a key role in the controllability of social networks me_complex , Ebola virus transmission scarpino2015epidemiological , and respiratory infections epidemic volz2011effects among others. Relevant works also show that, under the susceptible-infected-removed (SIR) model, community lock-downs are less effective than self-isolation and social distancing gosak2021community . No work in the literature studies how small-worldness affects the infection curve flattening. Few works are focused on the effect of small-worldness on diffusion (of information/disease) process Nguyen2012UnderstandingAM , herd immunization thedchanamoorthy2014influence , and epidemic outbreak (by tuning the average path length) Reppas2011OnTE . The other relevant works on immunization of epidemic spreading in networks include wu2015influence ; madar2004immunization ; wang2020preventing ; zuzek2015epidemic ; ghalmane2019immunization ; li2019suppression . The work ghalmane2019immunization exploits community structures to control epidemic. Bond percolation models to study immunization are discussed in madar2004immunization . Comparison between static and dynamic immunization strategies are discussed in wu2015influence . The work wang2020preventing proposes novel optimization strategies for community-based immunization of targeted nodes. Mitigation strategies to prevent disease propagation over multi-layer networks is discussed in zuzek2015epidemic ; li2019suppression .
In this paper, we study the targeted isolation of individuals in small-world networks modelled based on Watts-Strogatz (WS) model watts1998smallworld . Small-world networks are characterized by a high level of clustering, meaning that nodes in the network tend to be highly connected to their immediate neighbours, and short path lengths, meaning that the virus can travel from any node to any other node in the network using a small number of steps. Real social networks also exhibit these characteristics, which is why small-world networks have been used as a model to understand and study social networks. In this work, we study if the presence of clusters and high small-worldness in a network is advantageous for targeted interventions to control the spread of an epidemic or not. Identifying and targeting specific individuals (or even clusters or communities) by interventions such as quarantine, self-isolation, contact tracing, and vaccinations can potentially contain the spread of the epidemic and flatten its infection curve over small-world networks (as in any other type of network). The targeted individuals are identified based on centrality measures and isolated to slow down the virus spread. These isolation-based scenarios are shown to be effective in COVID-19 spread both in theory block2020social ; SNAM23 and in reality nyt . Our results are not limited to the coronavirus spread, but any other virus-based epidemic can be considered. Flattening the infection curve reduces the burden on healthcare services by giving more time to prepare for the influx of patients and allows for more individualized attention to each patient.
The infection curve flattening in this paper is related to the network immunization problem, although they are two distinct strategies used in the context of managing infectious diseases. They have different goals and methods, but they share some similarities. The aim of this work is to reduce the peak of the infection curve and spread out cases over a more extended period to prevent overwhelming the healthcare systems. The primary objective of infection curve flattening is to slow down the rate of new infections within a population over time. This does not necessarily eliminates the disease entirely but seeks to control its spread by public health measures like social distancing, quarantine, self-isolation, travel restrictions, and lock-downs. On the other hand, network immunization, also known as targeted immunization, aims to disrupt disease transmission within specific networks or communities by identifying and immunizing key individuals. It focuses on reducing transmission within high-risk clusters and networks by identifying key nodes (individuals or groups) in a transmission network who are most likely to spread the disease. These individuals are then prioritized for vaccination or other preventive measures. The main differences is that infection curve flattening addresses the general population and aims to slow-down overall disease spread, whereas network immunization aims to disrupt transmission within specific high-risk groups. The similarity is that both strategies aim to reduce the impact of the disease on the population, although through different approaches. Further, both approaches identify and target key individuals (or behaviors) that contribute significantly to disease transmission. Our strategy can be used in conjunction as part of a comprehensive disease control strategy, with infection curve flattening serving as a broader measure to complement network immunization. Interested readers are referred to SNAM20 ; liu2021efficient ; giakkoupis2005models ; pastor2002immunization ; thedchanamoorthy2014influence ; ghalmane2019immunization ; liu2022network for better understanding of network immunization.
2 Statement of the Problem
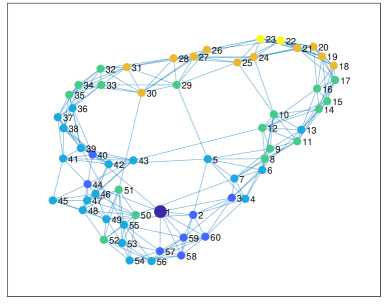
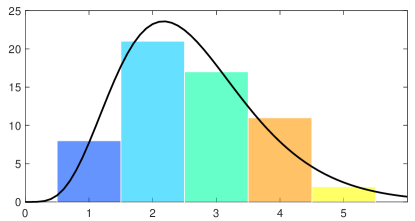
This paper studies the spread of infectious diseases over small-world networks. We consider the infection spread model in block2020social . In our model, similar to block2020social , we assume that at every iteration all the neighbors of the current infected node get infected. In other words, all the neighboring nodes in contact with the infected individual also get infected at the next iteration/epoch. This model better describes the COVID-19 spread as suggested by block2020social . We recall the model in block2020social . In the first iteration, the virus spreads from the seed node to its direct neighbours connected to the seed node. In the second iteration, it spreads to their neighbours, who are at network distance from the seed node, and so on. Over time, the virus moves along the network ties until all nodes are infected. This implies that the network distance of a node from the infection source (i.e., the seed node) is identical to the number of iterations until the virus reaches it. Then, the distribution of network distances to the source maps onto the infection curve. The problem is to find the infection curve of the epidemic and flatten this curve to reach long-tailed distribution associated with the shortest path length. The problem is described as follows and illustrated in Fig. 1. Assume an infected node as the source node of the epidemic spread. At the first iteration, the virus spreads to the neighbours of the infected source node (shown by dark blue in Fig. 1). At the next iteration , the virus spreads from the neighbours to neighbours of the neighbours or 2-hop neighbours (shown by light blue). The shortest path length from the source node to these 2-hop neighbours is 2. Then, at the next iterations, the virus spreads to susceptible 3-hop, 4-hop and 5-hop neighbours (respectively shown by green, orange, and yellow). To explain more, at every iteration all the neighboring nodes of the infected nodes get infected and at th next iteration the neighbors of the recently infected nodes (at step ) get infected. In this way, the resulting histogram of the infected nodes over different iterations in fact represents the -hop neighbors of the infected source node. In other words, the -hop neighbours (the nodes at the distance ) get infected at the same time after iterations. Counting the number of -hop neighbours, the histogram represents the distance distribution of the nodes with respect to the infected source node (shown in Fig. 1-bottom). Fitting a Gamma distribution SNAM23 to this histogram gives the infection curve of the social network. Isolating some of the nodes (or removing some of the links block2020social ) lengthens the shortest path (distance) from the source node to some other nodes and results in a more flat distance distribution. This implies the idea of infection curve flattening in real human networks to avoid high epidemic peaks and hinder overload to the healthcare system block2020social . The problem in this work is how to choose the self-isolated nodes to more flatten the infection curve over SW networks. In this work, the isolated nodes are chosen based on the node influence metrics and centrality measures. However, many graph properties may contribute to the rate of disease spread over the SW networks. In this direction, we study two network structural parameters that affect the infection curve flattening, namely small-worldness and clustering. To summerize, we change the SW rewiring probability that affects both the clustering and small-worldness of the SW network. Recall that the infection curve is constructed by the distance distribution (i.e., the distribution of shortest path length). We study how shortest path length (and its distribution) changes as we change the rewiring probability (and consequently change the clustering and small-worldness). Therefore, as other network characteristics including the number of linking and average node degrees remain unchanged, one can study how infection curve is affected by these two main network characteristics, clustering and small-worldness.
2.1 Small-World Networks
In a small-world network/graph many nodes are not directly connected, but with a high probability, their neighbours are likely to be connected to each other. This makes it possible to reach most neighbouring nodes with just a few hops or steps from any source node. It is claimed that the shortest path length (or the distance) between two randomly chosen nodes grows proportional to (with as the network size). In the perspective of social networks, the small world phenomenon connects strangers through a brief chain of acquaintances and is motivated by empirical social networks which show this effect. Small-world networks tend to contain all-to-all connected sub-networks, referred to as cliques. In other words, in a clique (almost) any two nodes are adjacent and connected with a link. This further implies a high clustering coefficient in the network. This coefficient can be further tuned by adding triad formations zaidi2013small or, similarly, the community structure of the network can be further managed by clique generation sallaberry2013model . Moreover, the majority of the nodes can be connected via a short path, indicating a small mean shortest path length within the network. This can be attributed to the abundance of hubs or high-degree nodes, which act as connections/neighbours, bridging the shortest path between other nodes. Network small-worldness (or small-worldliness) is quantified by its clustering and path length compared to an equivalent random network (with the same average node degree) and a lattice network. Different definitions for this coefficient are used which are listed in the following:
| (1) |
with and as the clustering coefficient and characteristic path length of the graph and its random equivalent humphries2008network ; telesford2011ubiquity . Based on this metric (or and ) implies that the network resembles a small-world; however, this metric performs poorly in large-scale. Another alternative metric is given below:
| (2) |
with as the clustering coefficient of the equivalent lattice and as the characteristic path length of the equivalent random graph telesford2011ubiquity . Finally, the following metric is the normalized version of neal2017small ,
| (3) |
with as the characteristic path length of the equivalent lattice.
The most well-known mechanism to build small-world networks is the Watts-Strogatz (WS) model watts1998smallworld . This model first builds a regular ring lattice (or cyclic graph) with every node connected to the same number nearest neighbours on each side (-hop neighbours). Then, the WS model takes every link connecting a node to its rightmost neighbours and randomly rewires it to another node with probability (avoiding self-loops and repetitive links). The lattice-shape structure produces a (locally) highly-clustered network with the random rewiring significantly reducing the average path lengths and network diameter. In fact, for the model gives a regular lattice and for it gives an Erdos-Renyi (ER) random network. Clearly, the small-worldness property (i.e., high local clustering and small average path length) are addressed by this model.
2.2 Clustering
Clustering in a network refers to the tendency of nodes to form clusters or groups of nodes that are more densely connected to each other than to nodes in other parts of the network. It is a measure of the degree to which nodes tend to form cohesive subgroups or communities (e.g. make triads). In graph theory, the clustering coefficient is a measure of the proportion of a node’s neighbours that are also connected. In real social networks, people tend to form clusters or groups with others who share similar interests, beliefs, or backgrounds. These clusters create highly connected sub-networks within the larger network.
The common formulation for the (global) clustering coefficient is based on the triplets of nodes, i.e., is defined as the ratio of the closed triplets to all (open and closed) triplets. Recall that a triplet denotes three nodes connected by either two (open triplet) or three links (closed triplet). From a social network perspective, a triad/triangle implies that the friend of my friend is also my friend. Therefore, high clustering means that two nodes sharing a neighbour are very likely to be connected themselves, i.e., to be neighbors of each other.
The formulation for the clustering coefficient is given below wasserman1994social ,
| (4) |
where the triad is also referred to as a triangle. For the small-world model, the clustering coefficient is a function of the randomness parameter . For the ring lattice and for the random ER network the coefficient is . In the intermediate range, value remains close to that of the regular network and only falls at relatively high .
2.3 Shortest Path Length
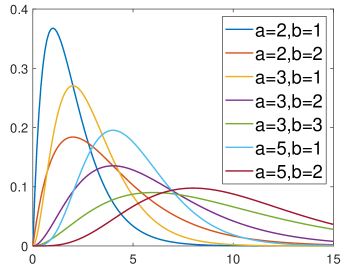
In a network, the shortest path (also known as the distance) between two nodes is the path with the minimum number of edges that connects them. It is also known as the geodesic path. The concept of shortest path is commonly used in graph theory and network analysis and is an important measure of connectivity and accessibility within a network. From a network epidemic perspective, it takes steps (or iterations) to reach from a node to another node . In some literature, node sometimes is referred to as the -hop neighbour or -hop distant neighbour of node . For small-world networks, the average path length is a function of and for a regular ring lattice, we have and scale linearly with . As the network tends toward random network we have . The distance distribution follows a Gamma distribution with its PDF defined as follows:
| (5) |
where is the shape parameter and is the scale parameter. Note that, from the figure, larger values imply flatter Gamma distribution. Some sample PDF Gamma distributions are shown in Fig. 2.
2.4 Node Influence Metrics
Centrality measures are quantitative metrics used to identify the most important or influential nodes within a network. Therefore, they are also referred to as node influence metrics. Some surveys describing different centrality measures over complex and social networks are given in the literature, see saxena2020centrality ; das2018study for different centralities and their applications. Some well-known examples (particularly related to epidemics) are listed below.
Degree: The node degree refers to the number of edges directly connected to a particular node (i.e., the number of its neighbours) saxena2020centrality ; das2018study .
Betweenness: This centrality is a measure of a node’s importance based on the number of shortest paths that pass through it freeman1977set . In other words, it measures how often a node acts as a bridge along the shortest path between other nodes in the network saxena2020centrality ; das2018study .
Closeness: This path-based centrality is a measure of a node’s importance based on the average distance between that node and all other nodes. This measure calculates the reciprocal of the sum of the distances (shortest paths) to all other nodes bavelas1950communication . In other words, it measures how quickly a node can reach all other nodes in the network saxena2020centrality ; das2018study .
Katz: This degree-based centrality is calculated by summing the number of walks between a node and all other nodes, with the number of walks decreasing exponentially as the length of the walks increases katz1953new . The Katz centrality of a node is higher if it is directly connected to other highly central nodes, or if it lies on many paths between such nodes saxena2020centrality ; das2018study .
Page-Rank: Similar to Katz score, this is another degree-based centrality quantifying a node’s score proportional to the score of the nodes that link to it, as measured by the number and quality of those links sullivan2007google . The Page-Rank score tends to be higher for nodes linked to other highly central nodes, and lower for nodes that have few or low-quality incoming links. In simple words, a node has a high Page-Rank if its neighbours are highly central, and node is one of the few neighbours of those nodes saxena2020centrality ; das2018study .
Expected Force: This is another degree-based centrality and entropy-based epidemiological measure. It is a measure of the importance of a node within a network that takes into account both the node’s degree and the degree of its neighbours. The expected force centrality of a node is defined as the sum of the product of the degree of node and the degree of each of its neighbours divided by the total number of possible edges in the network lawyer2015understanding .
Eigenvector: This centrality (also named Bonacich centrality) denotes the eigenvector associated with the greatest eigenvalue of the adjacency matrix of the network bonacich1972factoring . It can be proved that all the entries in this eigenvector are non-negative (this follows from the Perron-Frobenius theorem). To get an absolute score, the eigenvector is sometimes normalized such that the sum over all vertices is (or ). Nodes with high eigenvector centrality are those that are connected to other highly central nodes and thus have a greater ability to influence the behavior of other nodes in the network das2018study .
3 Main Results
We study how tuning different network properties flatten the infection curve of the epidemic over the network. Recall that epidemic curve flattening is tightly related to the shortest path length (or, more accurately, the node distance distribution). Based on the preliminaries given in the previous section, the simulations in this section show how self-isolation (or quarantine) affects the epidemic spread over SW networks. More specifically, we isolate the nodes based on the centrality measures and check if network features such as clustering and small-worldness encourages or discourages the infection curve flattening.
First, we compare different network properties for different rewiring probability in WS networks (as the main model for SW networks). We summarized some of these graph properties in Table 1 which are averaged over Monte-Carlo trials of WS networks with nodes and . From the table, larger value implies smaller average shortest path , lower clustering , higher small-worldness , and smaller scale parameter .
| value | 0.025 | 0.05 | 0.1 | 0.15 | 0.2 | 0.25 | 0.3 |
|---|---|---|---|---|---|---|---|
| average shortest path | 6.8 | 5.4 | 4.7 | 4.2 | 4 | 3.9 | 3.9 |
| clustering | 0.63 | 0.58 | 0.49 | 0.42 | 0.35 | 0.29 | 0.24 |
| small-worldness | -0.48 | -0.30 | -0.05 | 0.14 | 0.28 | 0.41 | 0.51 |
| small-worldness | -0.13 | -0.03 | 0.15 | 0.29 | 0.41 | 0.51 | 0.6 |
| scale parameter | 0.56 | 0.38 | 0.28 | 0.24 | 0.22 | 0.2 | 0.19 |
3.1 Clustering and Small-Worldness in SW Networks
First, we study clustering. Clusters in a network can both (i) act as natural barriers and hinder the spread of an epidemic and also (ii) facilitate the spread of an epidemic within communities or clusters. The case (i) is because if the connections between the clusters are limited (or sparse), although spreading faster inside the clusters, the virus/disease may struggle to cross over from one cluster to another which reduces the overall epidemic spread (i.e., acting as barriers to cross-cluster transmission). This barrier effect can slow down the epidemic’s progression and more flattens the infection curve by limiting its reach to specific clusters or communities. On the other hand, in case (ii), if the interconnections within the clusters are dense and individuals (nodes) densely interact (link) with others within their community, the disease may spread more rapidly within the cluster, leading to a faster and more extensive spread of the epidemic and steeper (high-peak) infection curves. In other words, this can lead to a more rapid spread of the epidemic in the network as a whole, especially if the connections between clusters are also relatively dense.
Next, we study small-worldness. Small-worldness is a property of social and human networks where most nodes are not directly connected, but can be reached through a small number of intermediate connections. Recall that, it is characterized by high clustering (i.e., individuals tend to have many common neighbours) and short average path lengths (i.e., it is possible to infect most nodes/individuals from any other node/individual in a relatively small number of steps). Therefore, high small-worldness can facilitate the faster spread of infectious diseases due to the short average path lengths. Infected individuals can rapidly transmit the disease to their close neighbours, who in turn can transmit it to their neighbours, leading to rapid spread within clusters of connected individuals. This can result in a steeper initial rise in the infection curve, as the disease spreads quickly through the network. These factors imply that small-worldness directly affects the spread of infectious diseases, including how the infection curve flattens during an epidemic. Note that high values of small-worldness also imply the formation of clusters or communities of tightly connected individuals (high clustering). If infection occurs within these clusters, it may lead to localized outbreaks, resulting in a spike in the infection curve for those clusters. Once the infection reaches the periphery of the clusters, it may spread through the shortcut links111The prevalence of the shortcut links is related to the rewiring probability . easily to other parts of the network, which can result in a sharp rise in the overall infection curve.
3.2 Self-Isolation Simulation
In order to suppress the spread of infectious disease and reduce the network susceptibility, individuals with high centrality (e.g., network hubs or individuals who efficiently bridge the transmission path between different parts of the network) are isolated. If these central nodes become infected, they can transmit the disease to a large number of individuals, potentially resulting in a rapid rise in the infection curve. Therefore, by targeted interventions on these nodes, one can flatten the infection curve as simulated in this section. By changing the value of WS networks, the clustering and small-worldness are tuned. We try the simulations for different values of network size and initial wiring to show that the results are irrespective of these values. In other words, these show robustness of the results to and . Also, note that by changing the value the number of links and average node degrees remain unchanged. Therefore, the network linking is the same and has no effect on the simulation results.
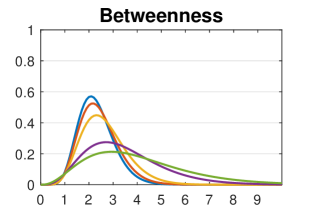
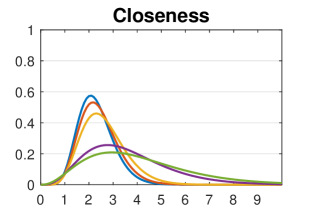
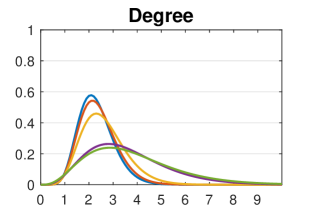
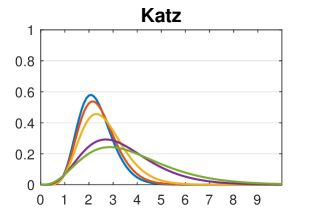
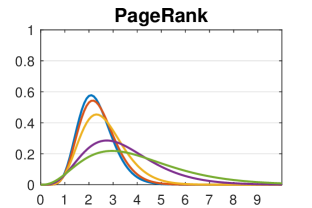
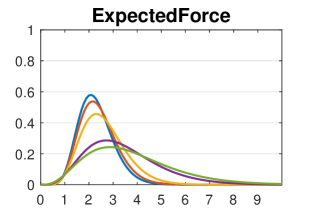
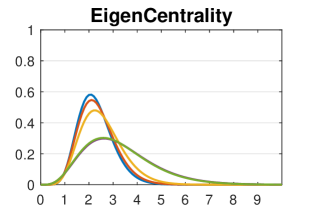
For WS networks, in this paper, Fig. 3 presents the normalized infection curve flattening with self-isolation. The figure on the top-left shows the normalized infection curve under no intervention/isolation while in the rest the infection curves are flattened by node isolation under various centrality measures and node influence metrics. Recall that the curves are normalized by the total number of shortest paths. The associated clustering coefficient values are given in the first figure. The simulations are averaged over Monte-Carlo (MC) trials. The clustering coefficient is tuned by changing the rewiring probability while the number of linking, network connectivity, and average node degrees remain the same ( and for all WS networks). This gives the clustering coefficients as . It is clear from the figure that increasing the clustering coefficient dramatically flattens the infection curve. This implies that, following the case (i), the connections between the clusters are limited (or sparse), as the number of linking in the WS model is fixed, by decreasing the value (and increasing ) there are fewer options for the cross-cluster transmission of the disease, and in turn, flattens the infection curve. Moreover, in terms of comparing the centralities, self-isolation via path-based centralities, e.g. closeness, more flattens the infection curves.
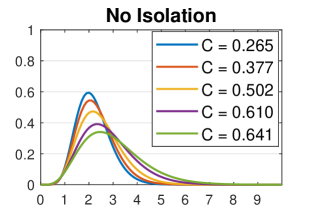
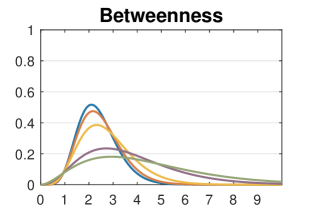
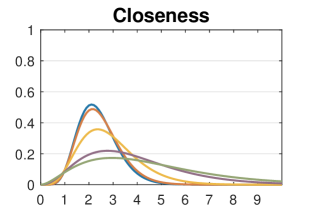
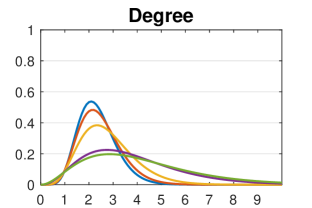
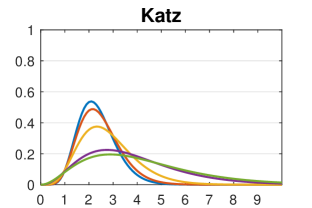
Other than the qualitative comparison in the figures, we performed quantitative comparisons here. The peak values of the distance distribution associated with Fig. 3 are given in Table 2. These peak values represent the max number of individuals infected simultaneously at the same iteration of the virus spreading over the network (see Fig. 1 for more illustration). Recall that the fitted curves in Fig. 3 are normalized by the total number of shortest-paths. Both clustering coefficient and small-worldness are given for better comparison. As it is clear from the table and the figures, self-isolation via path-based centralities (i.e., betweenness and closeness) results in lower peak values of the distance distribution and, thus, the fitted infection curves are flatter.
| None | Bet | Close | Deg | Katz | Page | Exf | Eig | |||
|---|---|---|---|---|---|---|---|---|---|---|
| 0.3 | 0.481 | 0.265 | 4013 | 3047 | 3037 | 3115 | 3122 | 3118 | 3118 | 3108 |
| 0.2 | 0.302 | 0.377 | 3822 | 2902 | 2892 | 2932 | 2996 | 2986 | 2986 | 3016 |
| 0.1 | 0.052 | 0.502 | 3299 | 2278 | 2158 | 2282 | 2275 | 2332 | 2226 | 2272 |
| 0.05 | -0.117 | 0.610 | 2276 | 1369 | 1227 | 1378 | 1378 | 1378 | 1378 | 1648 |
| 0.025 | -0.275 | 0.641 | 2104 | 923 | 870 | 1066 | 1074 | 1084 | 1070 | 1844 |
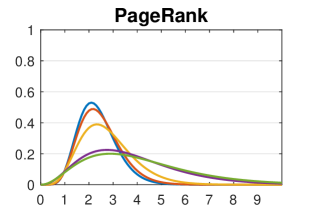
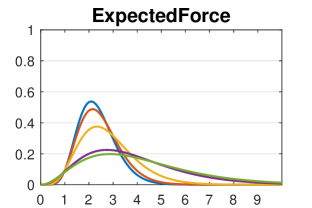
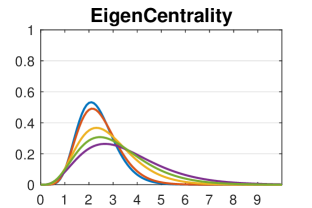
Fig. 4 presents the infection curve flattening with self-isolation. The top-left figure is with no isolation (i.e., no intervention) and in the rest of the figures, of the nodes are isolated based on different centrality ranks, which significantly flattens the infection curve. The illustrated simulations are averaged over MC trials, where the small-worldness in the WS model changes by the rewiring probability . Recall that, following the WS model (with and in this simulation), the number of linking, network connectivity, and average node degrees remain the same. We compared the small-worldness measure222Regarding the other two small-worldness measures, is not properly defined in large-scale and changes similar to the measure and, therefore, are skipped here., clustering, and peak values under different centrality-based isolation for this example. It is clear from the figure that decreasing the small-worldness dramatically flattens the infection curve. Further, note that isolation based on closeness centrality more flattens the infection curve as compared to other centrality measures.
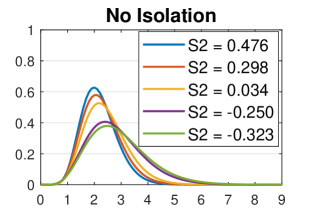
The peak values of the distance distribution associated with Fig. 4 are given in Table 3 where the values are not normalized. Both clustering coefficient and small-worldness are given for more comparison. Similarly, this figure and table also show that self-isolation via path-based betweenness and closeness centralities results in lower peak values and, thus, better flattening of the infection curves.
| None | Bet | Close | Deg | Katz | Page | Exf | Eig | |||
|---|---|---|---|---|---|---|---|---|---|---|
| 0.3 | 0.476 | 0.292 | 7801 | 7364 | 7328 | 7411 | 7350 | 7401 | 7404 | 7384 |
| 0.2 | 0.298 | 0.382 | 7595 | 7187 | 7148 | 7360 | 7284 | 7354 | 7341 | 7307 |
| 0.1 | 0.034 | 0.516 | 7064 | 6391 | 6326 | 6596 | 6524 | 6473 | 6525 | 6858 |
| 0.05 | -0.250 | 0.630 | 6066 | 4125 | 3506 | 3812 | 4415 | 4392 | 4308 | 4424 |
| 0.025 | -0.323 | 0.658 | 5815 | 3033 | 2803 | 3652 | 3661 | 3280 | 3548 | 4405 |
4 Discussions and Conclusions
This paper investigates how different network features such as clustering and small-worldness affect the centrality-based epidemic curve flattening over SW networks. We summarize our results as follows:
-
(i)
There are two types of centrality affecting the infection curve flattening: (i) degree-based centrality can be useful for identifying highly connected individuals or ”hubs” who may have a greater potential to spread the infection. Targeting these individuals for interventions, such as quarantine or vaccination, can help mitigate the spread of the disease and potentially flatten the infection curve. (ii) Measures such as betweenness or closeness centrality capture the extent to which a node lies on the shortest paths between other nodes. In the context of infectious diseases, path-based centrality can be beneficial in identifying individuals who act as bridges or bottlenecks in the spread of the infection. By targeting these individuals for interventions it may be possible to disrupt the transmission pathways and flatten the infection curve. Our results show that, for our single infection-source iterative transmission, node isolation via path-based centralities (e.g. closeness and betweenness) are more effective on flattening the infection curve over SW networks. For more illustration on this, check the quantitative comparisons for different centralities given in Table 2 and 3 and qualitative comparisons in Fig. 3 and 4. In general, the peak values for path-based centralities in Table 2 and 3 are lower, implying flatter infection curves, while for degree-based centralities the peak values are higher, implying taller and narrower infection curves. This conclusion confirms our previous results over scale-free (SF) networks SNAM23 and targeted node control to derive the SF networks towards the healthy-state (SIS model) SNAM20 . Similar results are claimed by thedchanamoorthy2014influence , saying that betweenness-based immunization is the best strategy in static networks. However, it might be the case that in other types of networks and other compartmental models of epidemic different centrality-based isolation work better.
-
(ii)
Our results show that increasing the clustering in the SW networks by decreasing the rewiring probability flattens the infection curve more effectively. network clustering can affect the spread of the epidemic in complex ways (depending on the specific characteristics of the network), it can either slow down the spread of the disease through localized outbreaks and barriers to cross-cluster transmission or enhance the spread within clusters. However, high clustering likely slows down the spread of the disease in SW networks. While the effectiveness of targeted interventions can also influence the impact of clustering on the infection curve (see SNAM23 for SF networks). The network clustering may facilitate the spread of the disease in other types of networks, influence the resilience of the network, and guide targeted interventions for epidemic control (see SNAM20 ) in various network types.
-
(iii)
In SW networks with high small-worldness the presence of more shortcuts in the network can facilitate the spread of the infection to more distant parts of the network, and the overall infection spreads more quickly than in random and regular networks. This implies that SW networks with higher small-worldness parameter have steeper (narrower) infection curves. Such high-peak infection curves imply more burden on the healthcare systems.
As a future direction, one can further consider link isolation (or link removal) which models social distancing among individuals. The targeted links can be chosen based on link-centralities, e.g., shortest path-based, to flatten the infection curve. The results can be extended to the analysis of epidemic growth rates over synthetic and cyber-networks csl2020 . Another future direction is to consider that a portion (less than ) of -hop neighbors get infected at every iteration. This makes the infection curve different from the deterministic distance distribution. For this case an infection probability can be assigned to every link and the probabilistic distance distribution is modeled to find the infection curve. Some existing works discuss such distribution models over Erdos-Renyi networks with different link probabilities, see PhysRevE.76.066101 for example.
Acknowledgements
The authors acknowledge the use of some MATLAB codes from Koblenz Network Collection (KONECT) konect .
References
- (1) Koblenz network dataset KONECT. Koblenz network dataset KONECT, https://konect.cc
- (2) Bavelas, A.: Communication patterns in task-oriented groups. The journal of the acoustical society of America 22(6), 725–730 (1950)
- (3) Block, P., Hoffman, M., Raabe, I.J., Dowd, J.B., Rahal, C., Kashyap, R., Mills, M.C.: Social network-based distancing strategies to flatten the COVID-19 curve in a post-lockdown world. Nature Human Behaviour 4(6), 588–596 (2020)
- (4) Blondel, V.D., Guillaume, J., Hendrickx, J.M., Jungers, R.M.: Distance distribution in random graphs and application to network exploration. Physical Review E 76, 066101 (2007)
- (5) Bonacich, P.: Factoring and weighting approaches to status scores and clique identification. Journal of mathematical sociology 2(1), 113–120 (1972)
- (6) Brett, T.: Understanding contagion spreading processes of cyber security threats through social networks. Ph.D. thesis, University of Greenwich (2021)
- (7) Chang, S., Pierson, E., Koh, P., Gerardin, J., Redbird, B., Grusky, D., Leskovec, J.: Mobility network models of covid-19 explain inequities and inform reopening. Nature 589(7840), 82–87 (2021)
- (8) Das, K., Samanta, S., Pal, M.: Study on centrality measures in social networks: a survey. Social network analysis and mining 8, 1–11 (2018)
- (9) Doostmohammadian, M., Khan, U.A.: On the controllability of clustered scale-free networks. Journal of Complex Networks 8(1), cnz014 (2020)
- (10) Doostmohammadian, M., Rabiee, H.R.: On the observability and controllability of large-scale IoT networks: Reducing number of unmatched nodes via link addition. IEEE Control Systems Letters 5(5), 1747–1752 (2020)
- (11) Doostmohammadian, M., Rabiee, H.R.: Network-based control of epidemic via flattening the infection curve: high-clustered vs. low-clustered social networks. Social Network Analysis and Mining 13, 1–8 (2023)
- (12) Doostmohammadian, M., Rabiee, H.R., Khan, U.A.: Centrality-based epidemic control in complex social networks. Social Network Analysis and Mining 10, 1–11 (2020)
- (13) Freeman, L.C.: A set of measures of centrality based on betweenness. Sociometry pp. 35–41 (1977)
- (14) Ghalmane, Z., Hassouni, M.E., Cherifi, H.: Immunization of networks with non-overlapping community structure. Social Network Analysis and Mining 9, 1–22 (2019)
- (15) Giakkoupis, G., Gionis, A., Terzi, E., Tsaparas, P.: Models and algorithms for network immunization. Department of Computer Science, University of Helsinki, Tech. Rep. C-2005-75 (2005)
- (16) Gosak, M., Duh, M., Markovič, R., Perc, M.: Community lockdowns in social networks hardly mitigate epidemic spreading. New Journal of Physics 23(4), 043039 (2021)
- (17) Grabowski, A., Kosiński, R.A.: Epidemic spreading in a hierarchical social network. Physical Review E 70(3), 031908 (2004)
- (18) Hébert-Dufresne, L., Althouse, B.M.: Complex dynamics of synergistic coinfections on realistically clustered networks. Proceedings of the National Academy of Sciences 112(33), 10551–10556 (2015)
- (19) Hébert-Dufresne, L., Noël, P., Marceau, V., Allard, A., Dubé, L.J.: Propagation dynamics on networks featuring complex topologies. Physical Review E 82(3), 036115 (2010)
- (20) Humphries, M.D., Gurney, K.: Network ‘small-world-ness’: a quantitative method for determining canonical network equivalence. PloS one 3(4), e0002051 (2008)
- (21) Karaivanov, A.: A social network model of covid-19. Plos one 15(10), e0240878 (2020)
- (22) Katz, L.: A new status index derived from sociometric analysis. Psychometrika 18(1), 39–43 (1953)
- (23) Lawyer, G.: Understanding the influence of all nodes in a network. Scientific reports 5(1), 8665 (2015)
- (24) Li, Z., Zhu, P., Zhao, D., Deng, Z., Wang, Z.: Suppression of epidemic spreading process on multiplex networks via active immunization. Chaos: An Interdisciplinary Journal of Nonlinear Science 29(7), 073111 (2019)
- (25) Liu, G., Deng, Y., Cheong, K.H.: Network immunization strategy by eliminating fringe nodes: A percolation perspective. IEEE Transactions on Systems, Man, and Cybernetics: Systems 53(3), 1862–1871 (2022)
- (26) Liu, Y., Sanhedrai, H., Dong, G., Shekhtman, L.M., Wang, F., Buldyrev, S.V., Havlin, S.: Efficient network immunization under limited knowledge. National Science Review 8(1), nwaa229 (2021)
- (27) Madar, N., Kalisky, T., Cohen, R., Ben-avraham, D., Havlin, S.: Immunization and epidemic dynamics in complex networks. The European Physical Journal B 38, 269–276 (2004)
- (28) Neal, Z.P.: How small is it? comparing indices of small worldliness. Network Science 5(1), 30–44 (2017)
- (29) Nguyen, A.D., Sénac, P., Diaz, M.: Understanding and modeling the small-world phenomenon in dynamic networks. In: International Conference on Modeling, Analysis and Simulation of Wireless and Mobile Systems (2012)
- (30) Pastor-Satorras, R., Vespignani, A.: Immunization of complex networks. Physical review E 65(3), 036104 (2002)
- (31) Reppas, A.I., Spiliotis, K.G., Siettos, C.I.: On the effect of the path length of small-world networks on epidemic dynamics. Virulence 3, 146–153 (2011)
- (32) Reyna-Lara, A., Soriano-Paños, D., Gómez, S., Granell, C., Matamalas, J.T., Steinegger, B., Arenas, A., Gómez-Gardeñes, J.: Virus spread versus contact tracing: Two competing contagion processes. Physical Review Research 3(1), 013163 (2021)
- (33) Roberts, S.: Flattening the coronavirus curve (27 March 2020). URL https://www.nytimes.com/article/flatten-curve-coronavirus.html
- (34) Sallaberry, A., Zaidi, F., Melançon, G.: Model for generating artificial social networks having community structures with small-world and scale-free properties. Social Network Analysis and Mining 3, 597–609 (2013)
- (35) Saxena, A., Iyengar, S.: Centrality measures in complex networks: A survey. arXiv preprint arXiv:2011.07190 (2020)
- (36) Scarpino, S.V., Iamarino, A., Wells, C., Yamin, D., Ndeffo-Mbah, M., Wenzel, N.S., Fox, S.J., Nyenswah, T., Altice, F.L., Galvani, A.P., et al.: Epidemiological and viral genomic sequence analysis of the 2014 ebola outbreak reveals clustered transmission. Clinical Infectious Diseases 60(7), 1079–1082 (2015)
- (37) Shang, J., Liu, L., Li, X., Xie, F., Wu, C.: Epidemic spreading on complex networks with overlapping and non-overlapping community structure. Physica A: Statistical Mechanics and its Applications 419, 171–182 (2015)
- (38) Sullivan, D.: What is google pagerank? a guide for searchers & webmasters. Search engine land (2007)
- (39) Telesford, Q.K., Joyce, K.E., Hayasaka, S., Burdette, J.H., Laurienti, P.J.: The ubiquity of small-world networks. Brain connectivity 1(5), 367–375 (2011)
- (40) Thedchanamoorthy, G., Piraveenan, M., Uddin, S., Senanayake, U.: Influence of vaccination strategies and topology on the herd immunity of complex networks. Social Network Analysis and Mining 4, 1–16 (2014)
- (41) Volz, E.M., Miller, J.C., Galvani, A., Ancel Meyers, L.: Effects of heterogeneous and clustered contact patterns on infectious disease dynamics. PLoS computational biology 7(6), e1002042 (2011)
- (42) Wang, S., Gong, M., Liu, W., Wu, Y.: Preventing epidemic spreading in networks by community detection and memetic algorithm. Applied Soft Computing 89, 106118 (2020)
- (43) Wasserman, S., Faust, K.: Social network analysis: Methods and applications (1994)
- (44) Watts, D.J., Strogatz, S.H.: Collective dynamics of ‘small-world’ networks. nature 393(6684), 440–442 (1998)
- (45) Wu, Q., Fu, X., Jin, Z., Small, M.: Influence of dynamic immunization on epidemic spreading in networks. Physica A: Statistical Mechanics and its Applications 419, 566–574 (2015)
- (46) Zaidi, F.: Small world networks and clustered small world networks with random connectivity. Social Network Analysis and Mining 3, 51–63 (2013)
- (47) Zuzek, L.G.A., Buono, C., Braunstein, L.A.: Epidemic spreading and immunization strategy in multiplex networks. In: Journal of Physics: Conference Series, vol. 640, p. 012007. IOP Publishing (2015)