Quartic scaling of sound attenuation with frequency in vitreous silica
Abstract
Several theoretical approaches to disordered media predict that acoustic waves should undergo a quartic increase in their attenuation coefficient with increasing frequency in the sub-terahertz region. Such Rayleigh-type scattering would be related to the anomalous low-temperature plateau in the thermal conductivity and to the so-called boson peak, i.e. an excess of vibrational modes above the Debye density of states at around . Brillouin scattering of light allows the measurement of sound absorption and velocity dispersion up to about while inelastic x-ray scattering is limited to frequencies larger than about . We take advantage of the advent of ultrafast optical techniques to explore the acoustical properties of amorphous SiO2 layers in the difficult but crucial frequency region within this gap. A quartic scaling law is clearly revealed between 0.2 and , which is further shown to be independent of temperature. This strongly damped regime is accompanied by a decrease in the sound velocity already starting from about , in line with theories.
pacs:
62.30.+d, 62.40.+i, 63.50.-x, 78.47.jgI Introduction
It is well known that glasses have universal properties at low temperatures that differ from those of crystals. Below 1 K, the specific heat of dielectric glasses is approximately linear and the thermal conductivity almost quadratic with temperature , in contrast to the cubic dependence observed for both properties in crystals [1]. This ”anomalous” behaviour of amorphous solids has been successfully explained by introducing the well-known tunneling model [2, 3]. The model assumes the existence of structural entities that can tunnel between two configurations of very similar energy (two-level systems). Above 1 K, still deviates strongly from the expected Debye model, being larger than expected from the sound velocities. The excess is related to the so-called boson peak observed in the THz frequency range by neutron spectroscopy [4]. On the other hand, a plateau is found between 1 and in of all glasses, indicating the existence of a strong attenuation mechanism for the sound waves in the subterahertz range [1, 5, 6]. The acoustic phonon mean free path is presumed to dramatically decrease with increasing phonon frequency , at least as , until the Ioffe-Regel limit is reached. Using inelastic x-ray scattering (IXS), the expected dependence has been observed for the longitudinal acoustic mode over a tiny frequency interval just below in a few glasses [7, 8, 9, 10]. It was also found that lies in the frequency region of the boson peak. Different theories have been proposed to describe this peculiar attenuation regime, strong scattering of sound waves by fluctuating elasticity [11, 12], resonant coupling with soft modes [13, 14] (which can be regarded as an extension of the tunneling model) or effect of connectedness and applied stress on vibrational properties[15], to mention only the most important ones.
In this paper, we focus on vitreous silica, v-SiO2, in which sound waves propagation has been extensively studied. For frequencies above a few tens of GHz, Brillouin light scattering (BLS) is the most commonly used technique for measuring the velocity and attenuation of acoustic waves. BLS using visible [16, 17] and ultraviolet [18, 19, 20] incident radiations can cover the range GHz, while frequencies above about THz can be studied by inelastic X-ray scattering [21, 22] as shown in Fig. 1-(a). Pump-probe optical methods, in which the propagation of acoustic phonon pulses generated by laser light pulses is monitored, have so far made it possible to explore frequencies up to GHz [23, 24, 25, 26]. However, the experimental study of the onset of the regime up to the IR limit is still missing and therefore there is a need for new advanced techniques to fill this gap. It would be particularly beneficial to carry out measurements at low temperature to reduce the acoustic absorption due to anharmonic phonon-phonon interactions and thermal relaxation of two-level systems [17], thereby increasing the visibility of the expected attenuation regime for which theories suggest it should be -independent. Here we use advanced ultrafast optical techniques to investigate the acoustic properties of v-SiO2 in this crucial unexplored gap between a few hundred GHz and the IR limit where a quartic scaling of sound attenuation with frequency and negative velocity dispersion are expected from theory.
II Femtosecond acoustics results
Acoustic phonon spectroscopy in the time domain by using femtosecond lasers for the generation and detection of acoustic waves in thin films is in constant progress [27, 28, 29]. The principle consists in generating a coherent hypersonic pulse by absorbing a femtosecond optical pulse (the pump) and detecting its echoes produced at the film interfaces thanks to a second time-delayed optical pulse (the probe). Thin metallic films and semiconductor quantum-wells provide broadband photo-acoustic transducers with a high frequency cut-off in the subterahertz range. To detect or generate acoustic fields of definite frequencies, it is necessary to design specific periodic structures such as super-lattices. We present here a combination of acoustic results in thin amorphous SiO2 samples, acquired with two distinct setups: i) broadband generation with a metallic film and enhanced detection of discrete frequencies using a superlattice consisting of multiple quantum wells, and ii) broadband generation and detection using an InGaN/GaN single quantum well.
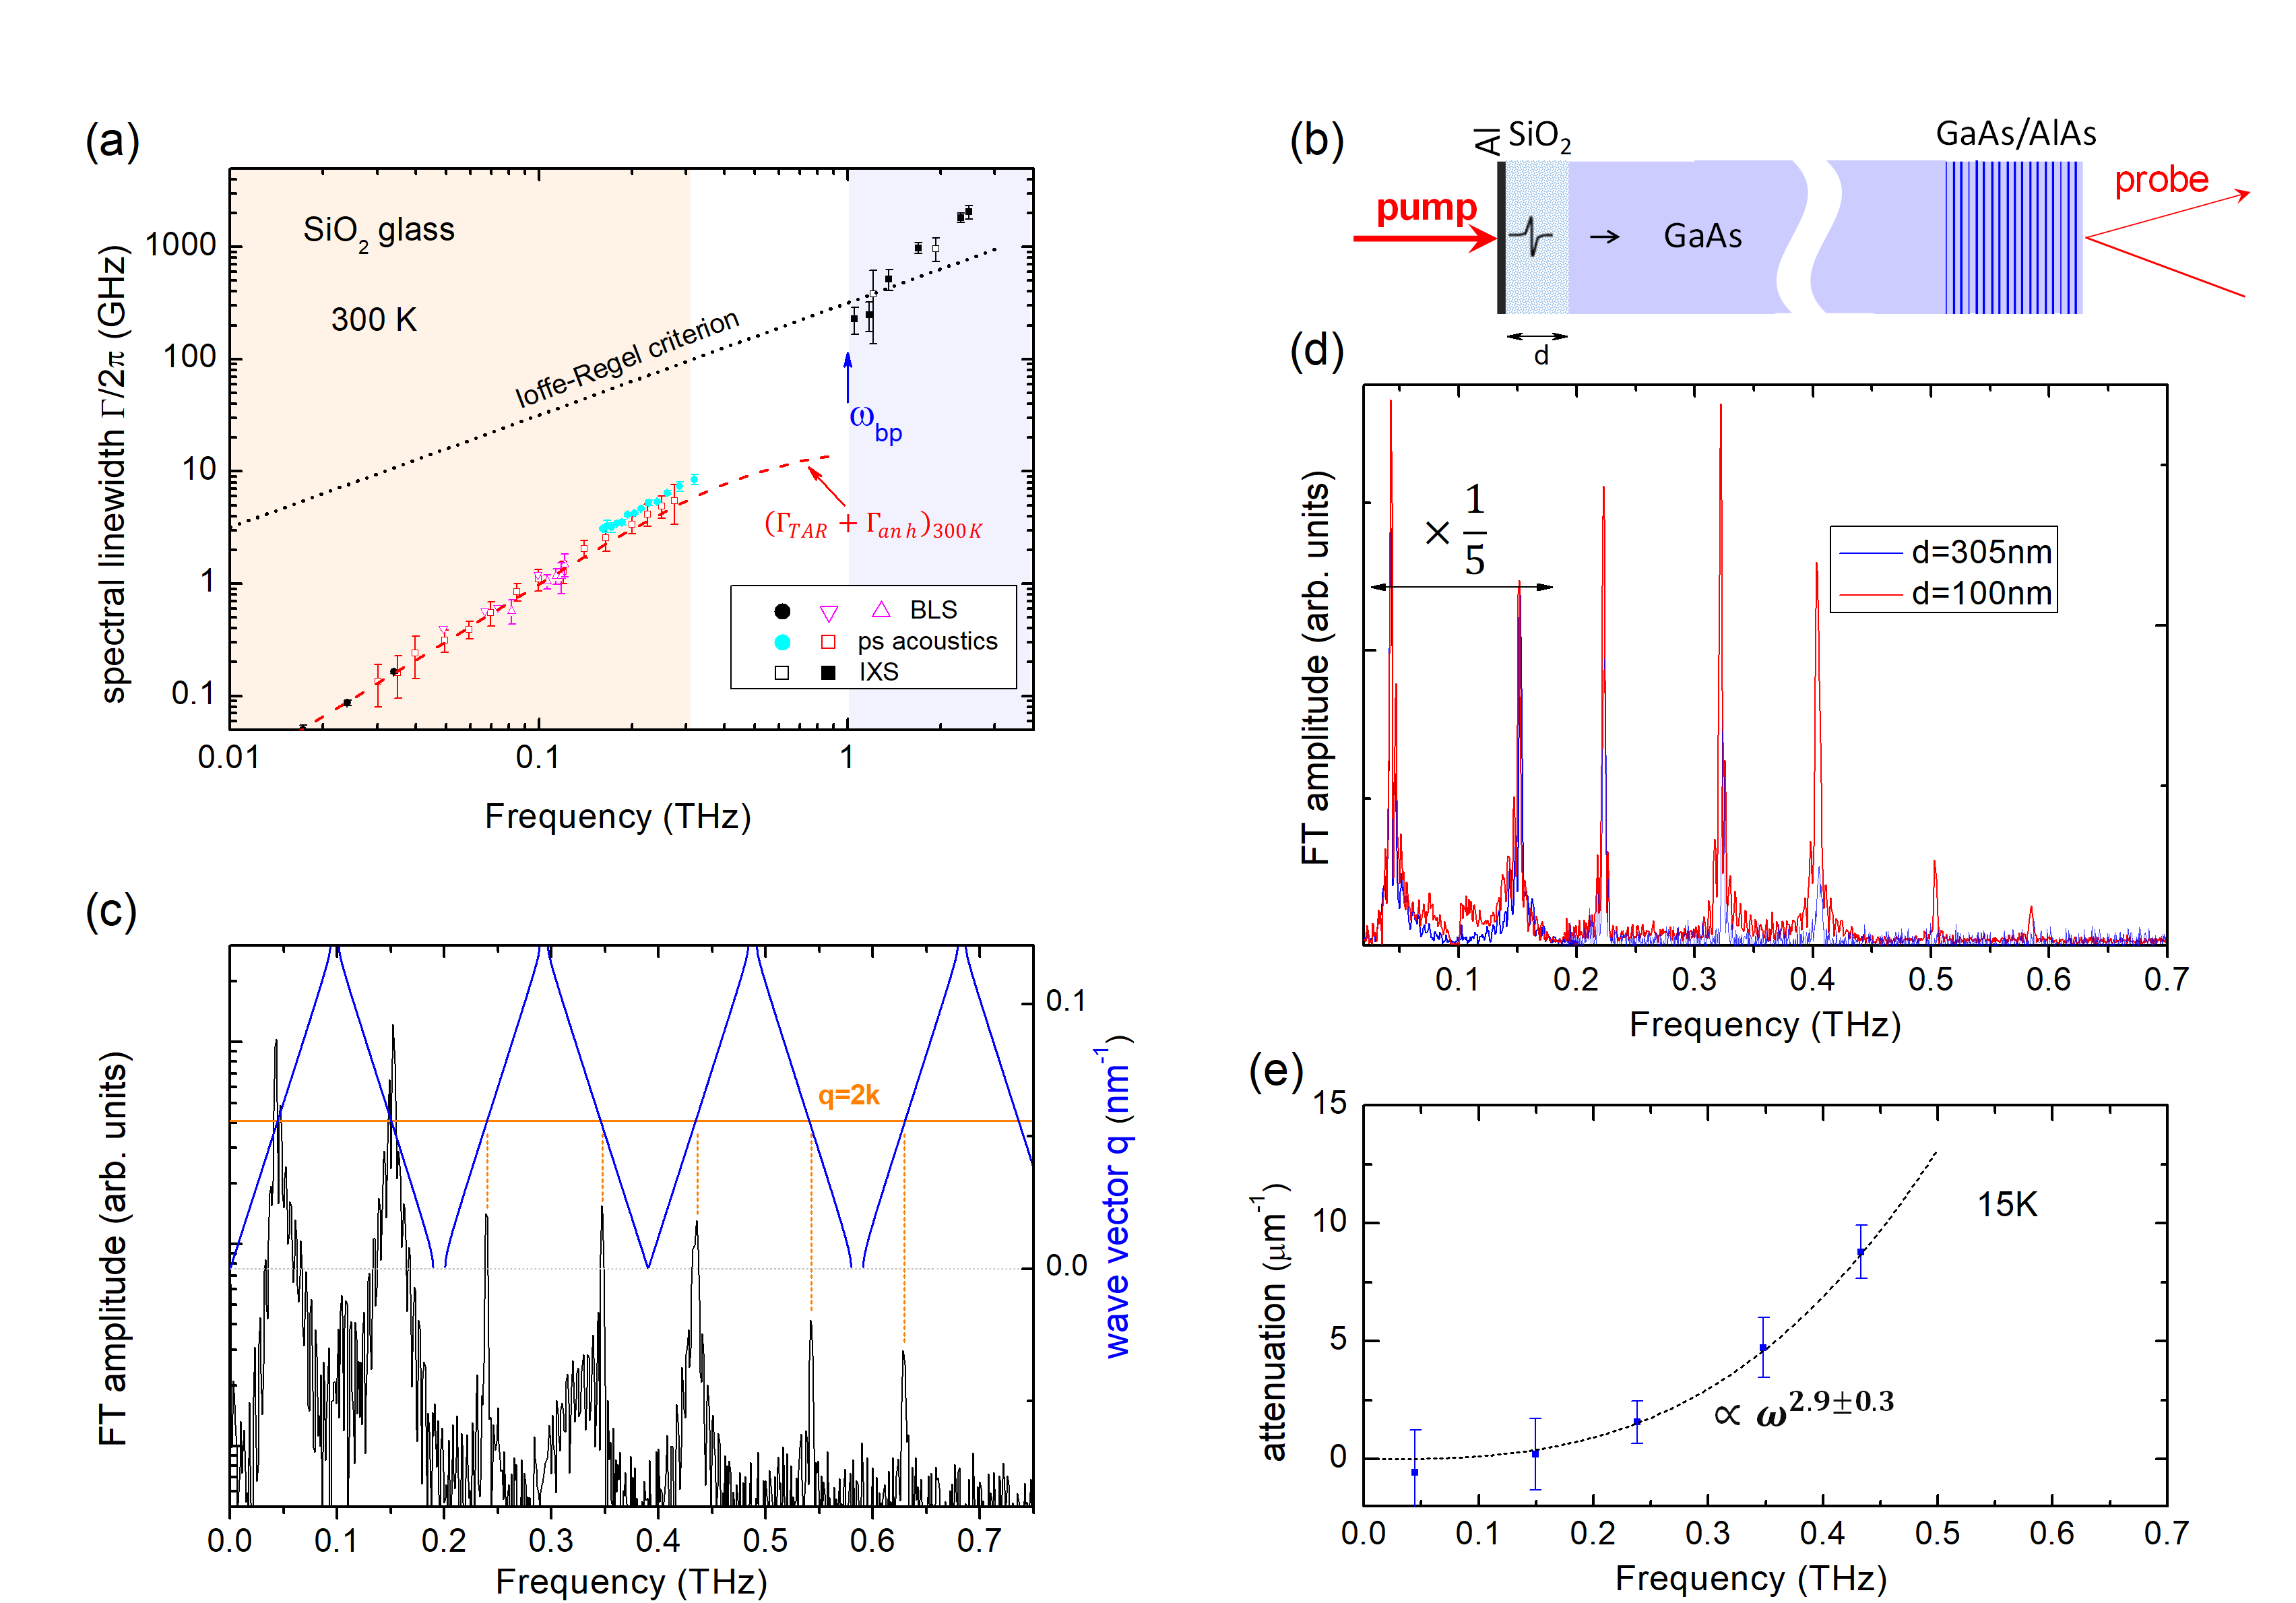
II.1 GaAs/AlAs superlattice as detection
In this first configuration, a GaAs/AlAs superlattice (SL) is used to detect with high sensitivity some components of the broadband spectrum generated in an aluminum film as sketched in Fig. 1-(b). The strain pulse generated in the Al film propagates through the GaAs substrate and can be detected in the SL by measuring the transient changes in its reflectivity using the probe light pulse (see Methods for details). The coherent phonons generation and detection processes in superlattices are now well understood [32, 28]. Due to the periodicity of the acoustic parameters in the SL, the acoustic phonon dispersion curve is folded into a mini-Brillouin zone whose boundary lies at wavevector , being the SL period. The selection rule that determines the Brillouin frequency in transparent media, ( and being the phonon and light wave vectors respectively), still holds in the superlattice, allowing in this case the detection of every frequency on the folded branches that satisfies this relation. Fig. 1-(c) shows an experimental result when the SL detects an acoustic pulse generated in the Al film. The Fourier transform of the signal is dominated by peaks at frequencies verifying the selection rule. We choose a period to sample the frequencies approximately every . Although the spectral content generated in the Al film ranges mainly from about 25 to , components up to almost contained in its weak high-frequency tail can be measured in the SL.
To access the acoustic attenuation coefficient of v-SiO2, the idea is to insert a layer of SiO2 between the GaAs substrate and the Al film and to compare the signal amplitude for different silica thicknesses (see Fig. 1-(b)). This design prevents the direct excitation of the SL by the laser pump pulse. Low pump fluences are used to avoid non linear acoustic effects during propagation in the substrate. Furthermore, measurements are limited to low temperature since phonon absorption in the substrate would be too large at room temperature. Power spectra registered at for two v-SiO2 layers with a thickness of and are shown in Fig. 1-(d). The amplitude of the peaks is found to be lower the thicker the sample and the higher the frequencies. Unfortunately, the frequency components above are no longer visible in the thickest layer. By comparing the amplitudes for each detected frequency component, the attenuation coefficients shown in Fig.1-(e) are obtained with where and denote the Fourier amplitude and the silica layer thickness of two of the three samples studied (100/305/467 nm). The overall results have been fitted with an effective power law in frequency by using a least-square method. We get ( expressed in and in ), represented by the dotted line in Fig.1-(e).
II.2 InGaN single-quantum-well as transducer
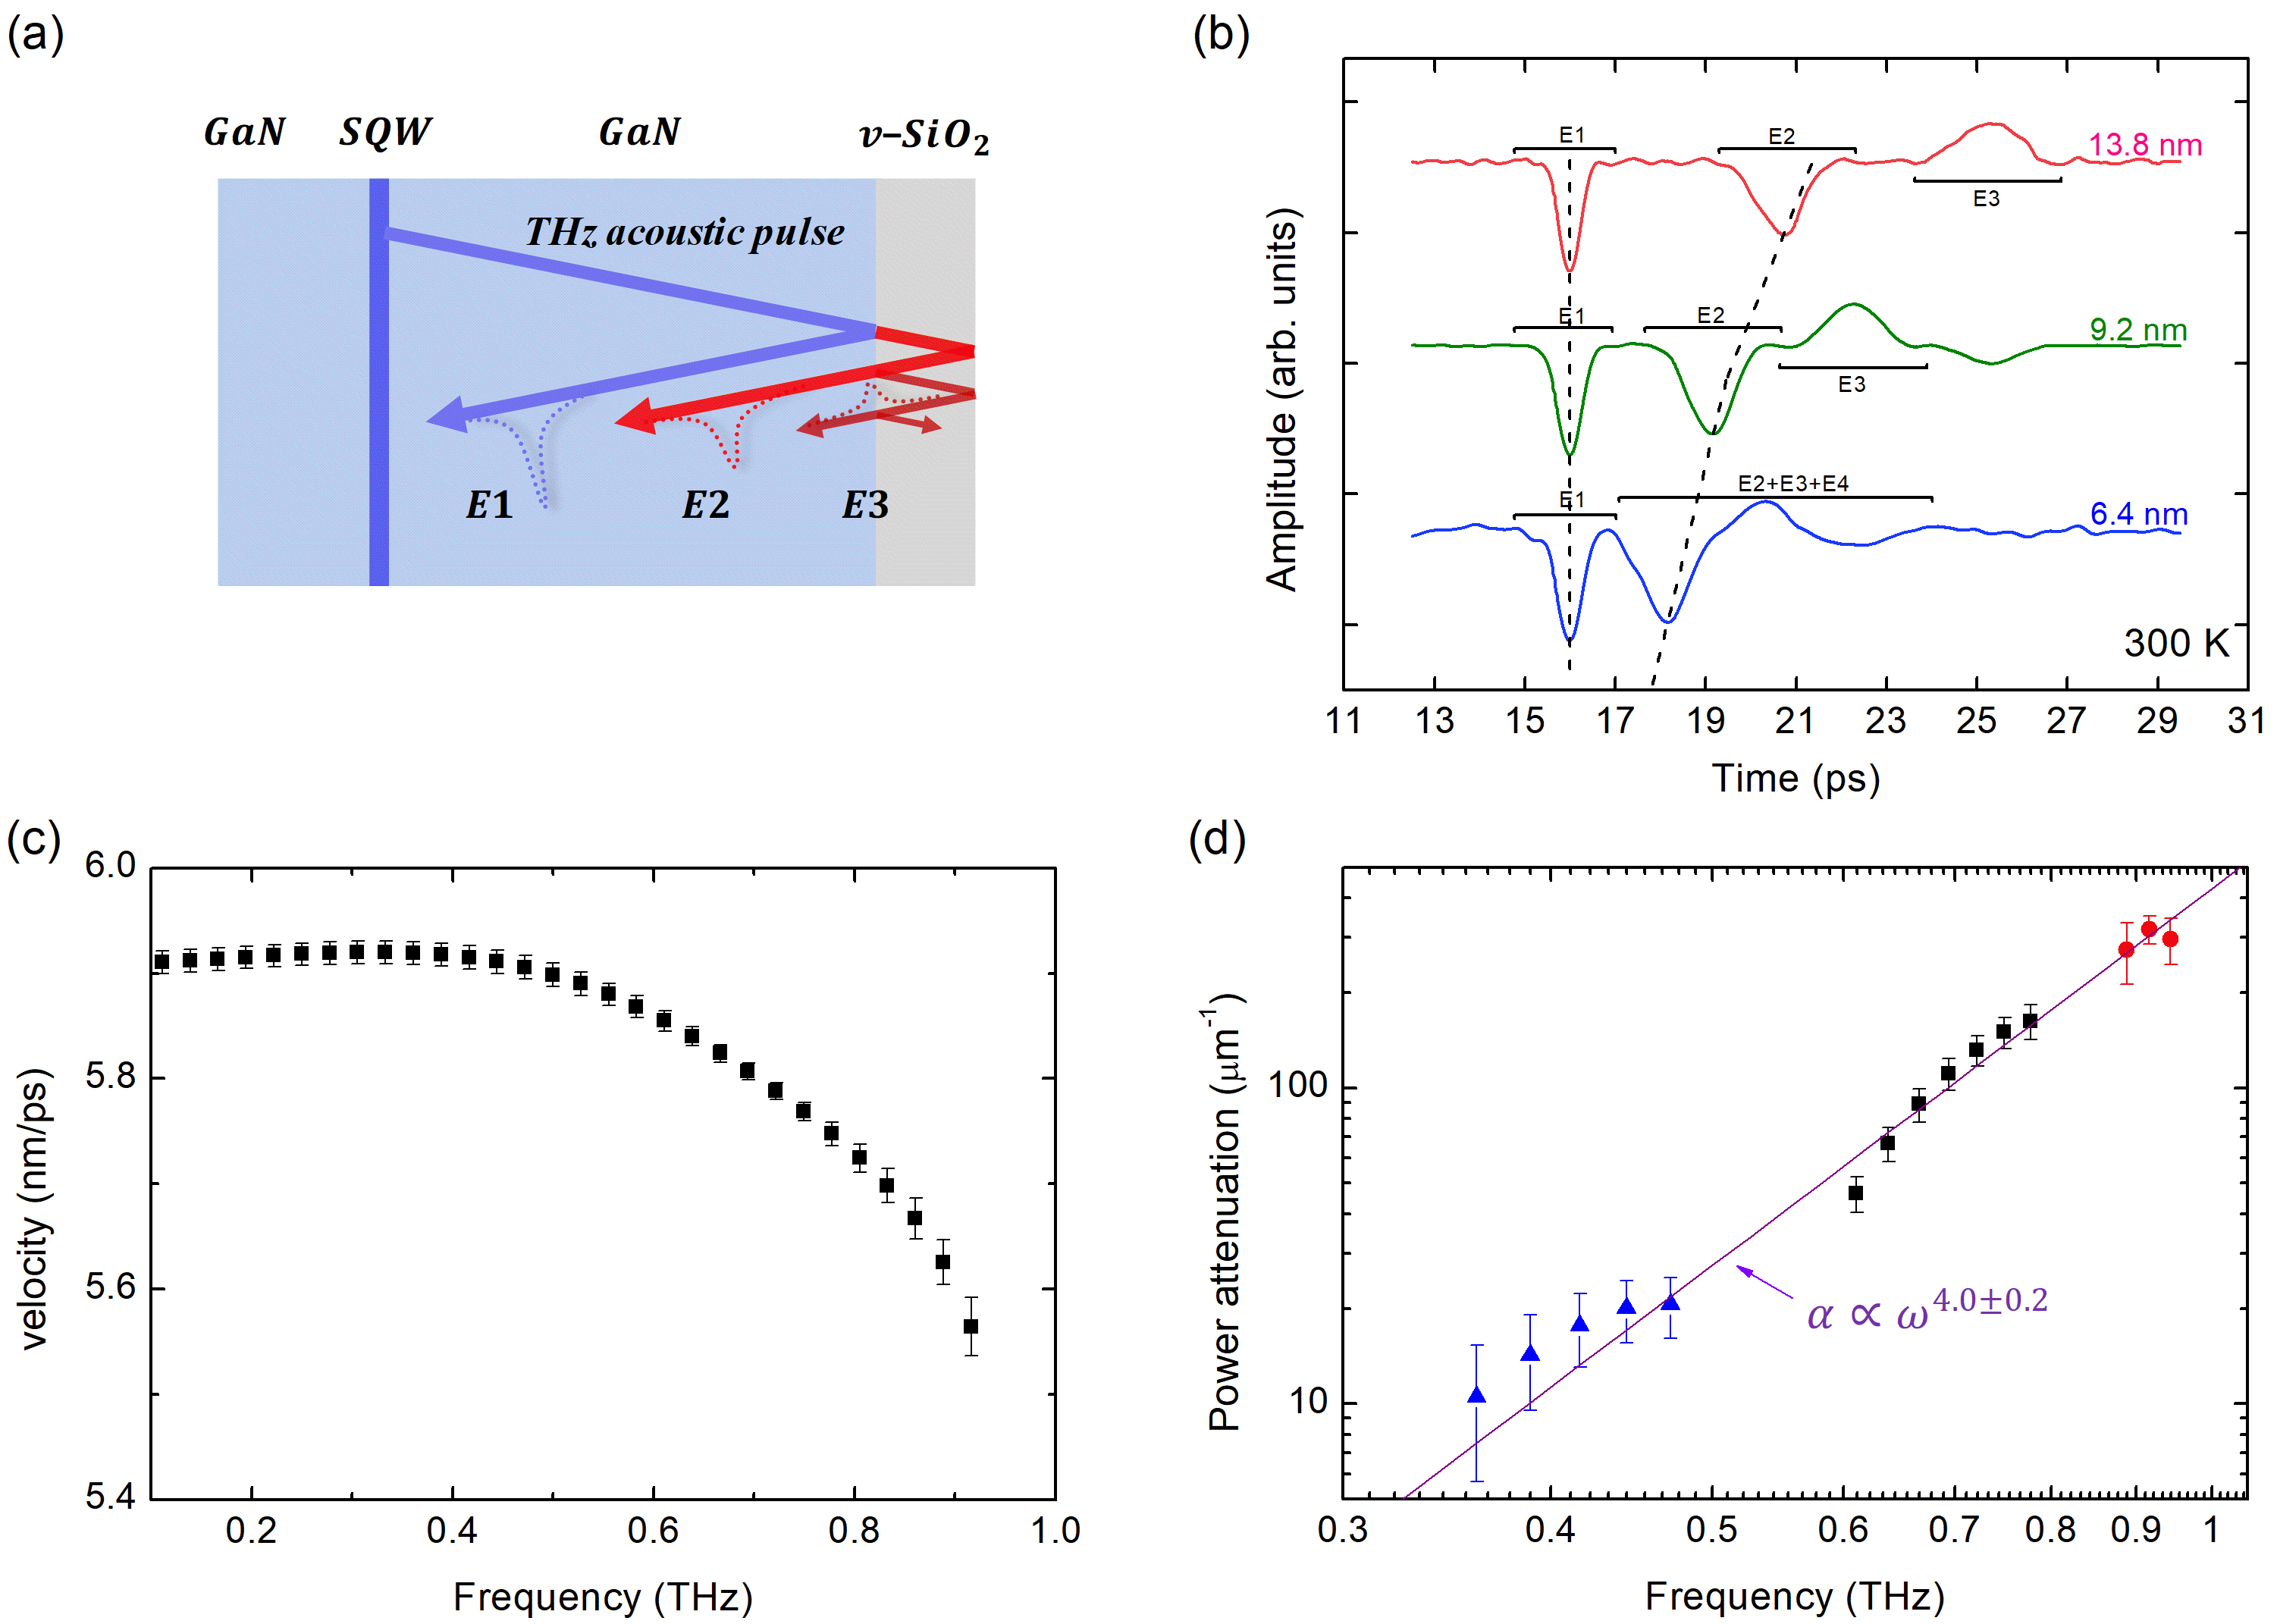
We have further conducted experiments on GaN-grown v-SiO2 layers with an embedded -thick InGaN single-quantum-well (SQW) for opto-acoustic transduction as sketched in Fig. 2-(a). Thanks to their piezoelectric properties, InGaN/GaN semiconductor heterostructures enable the generation of large amplitude coherent LA phonons over the THz range [33, 34, 35]. Here, the In0.1Ga0.9N/GaN SQW structure allows for the generation of phonons with a broadband spectrum [26, 29]. By monitoring the absorption changes in the well via the probe transmission, the SQW further provides a localised detection probe [36, 35]. The band structure as well as the photoacoustic coupling are dramatically modified as the acoustic echoes travel back to the SQW, which benefits the acquisition of the THz acoustics waveform. On the atomically flat surface of aforesaid GaN structure, we performed THz acoustics experiments on GaN-grown v-SiO2 films with thicknesses , and . The interfaces morphology and thickness of the v-SiO2 films were characterised by transmission electron microscopy and atomic force microscopy to ensure a well-defined acoustic traveling distance without additional interfacial layer.
To measure the THz hypersonic attenuation spectra of v-SiO2, the photoexcited acoustic pulse with about bandwidth is first partially reflected from the GaN/v-SiO2 interface, considered as (see Fig. 2-(b)). Part of the acoustic pulse is further transmitted into the v-SiO2 film, reflected from the v-SiO2 surface and detected as . Due to the acoustic impedance mismatch between GaN and v-SiO2, multiple reflections of the acoustic pulses with round trip time interval can also be observed (, , …). After round trip traveling inside the v-SiO2 film, the acoustics not only go through a damping mechanism denoted as , but also lose energy from the interface scattering loss. As the phonon frequency went higher, the scattering losses increase and become more crucial. However, the scattering only affects the amplitude term and induces zero phase change to the coherent phonon as for the processes of reflection and transmittance. Thus, we could first utilise the and to obtain the sound velocity dispersion spectra plotted as Fig. 2-(c). Sound velocity is related to the phase of the Fourier transform of each echo via . A strong negative dispersion at the frequency range above was measured. Furthermore, if the roughness of the interfaces and surfaces of two v-SiO2 films of different thickness were identical, then the only difference between the acoustic pulses traveling through the v-SiO2 films was the propagation distance in the films. The scattering effect can be removed by comparing the attenuation loss spectra from different silica thicknesses for successive echoes (either or ):
| (1) |
Basically, thinner film provide a higher cut-off frequency when accessing the high-frequency attenuation spectra and this property limits the suitable thickness range of v-SiO2. On the other hand, thinner films do not provide access to the attenuation of low-frequencies components because of the long propagation lengths required to attenuate the acoustic energy to an observable level. Therefore, the accessible frequency range is also limited at low frequencies. We first used the combination of the 13.8 nm/9.2 nm and 6.4 nm/9.2 nm to obtain two sets of intrinsic attenuation data for v-SiO2 in the range of - and around , respectively. Then, considering of 13.8 nm/9.2 nm, we can extend the attenuation spectra down to - . After careful analysis of the data, we finally obtained the three sets of attenuation results shown in Fig. 2-(d). A least-squares fit with an effective power law in frequency gives in which is expressed in and in . Finally, by taking into account the velocity dispersion noted above, we can express the attenuation law as a function of the wave vector of the acoustic wave. A least-squares fit with an effective power law in then gives .
III Discussion
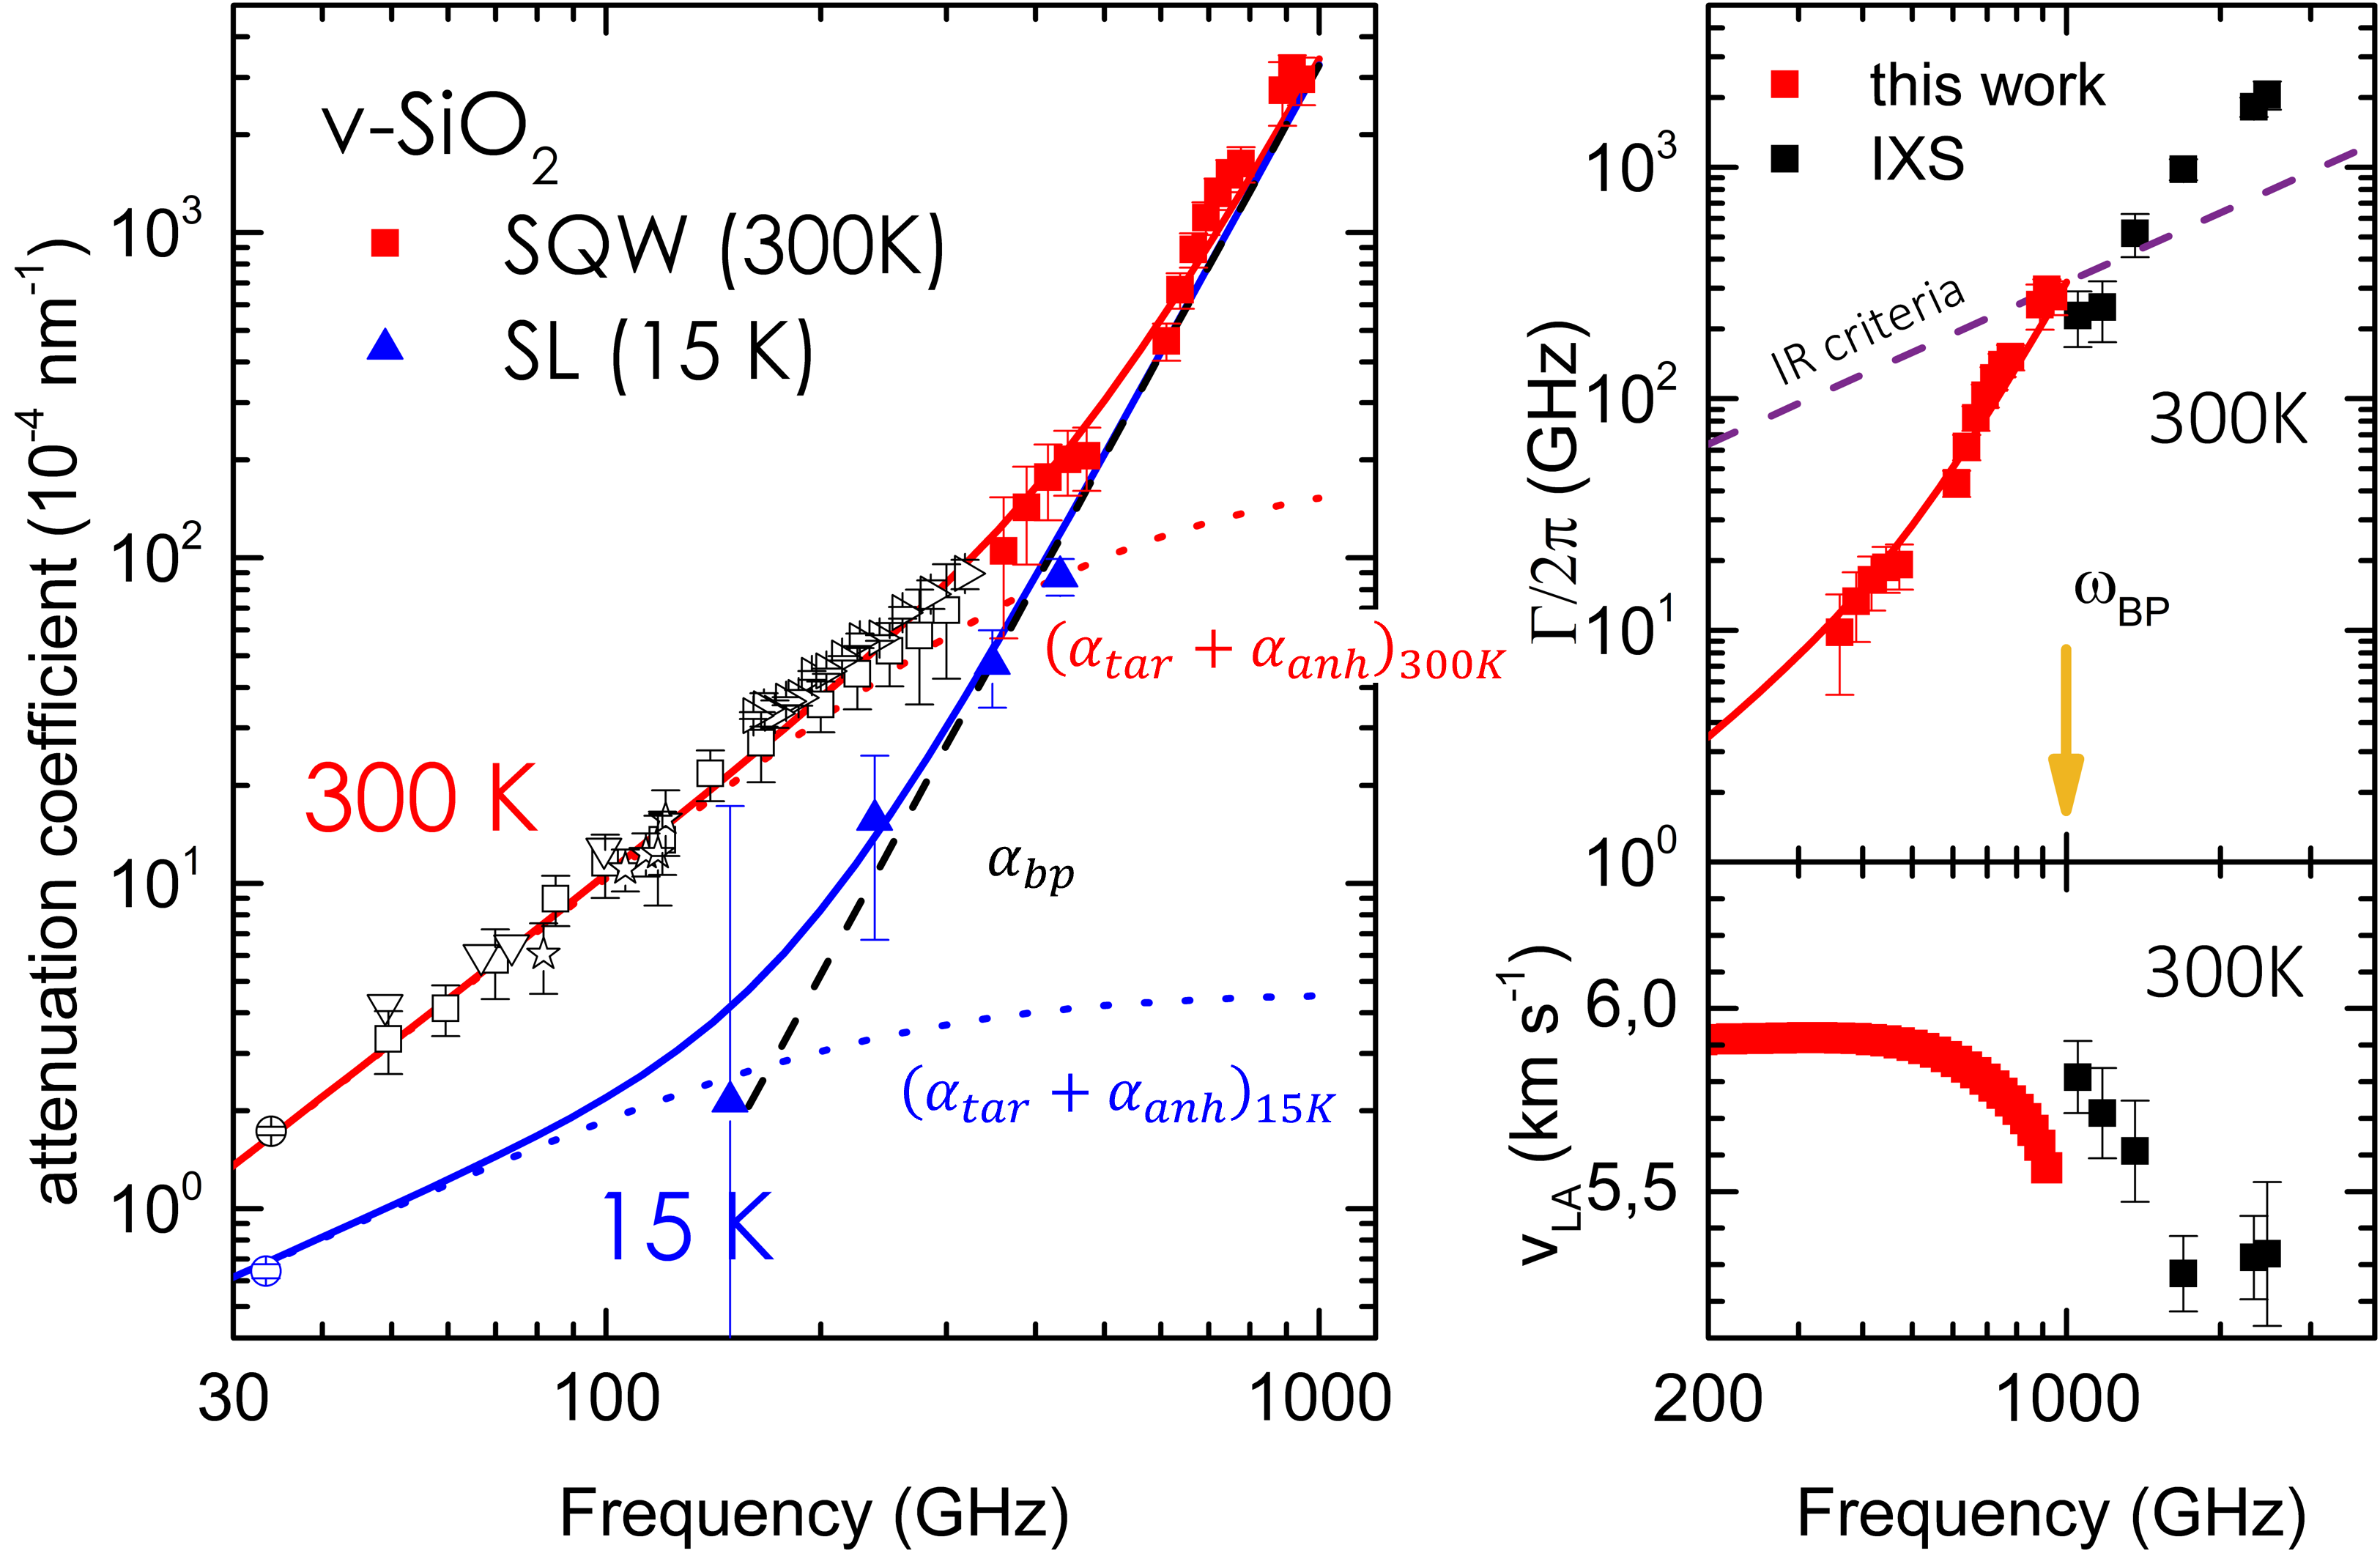
The overall new results, shown as solid symbols in Fig. 3(a), extend the existing experimental data (open symbols) on sound attenuation in silica glass up to near THz frequencies. As a reminder, below a few hundred GHz, is known to be driven by two main dissipation mechanisms : thermally activated relaxations (TAR) of structural “entities” and anharmonic interactions. It is well established that the TAR processes dominate the damping in the sonic and ultrasonic regimes. They produce an attenuation for and for , where is the characteristic time of the relaxing entity. A large distribution of relaxing entities is in fact assumed thus leading to an effective power law whose exponent varies with temperature and satisfies . The anharmonic losses result from the interaction of sound with the thermally excited vibrations in the medium at . Following the Akhiezer treatment, the interaction can also be treated as a relaxation process characterised by the mean thermal lifetime of the dominant vibrations [17]. At room temperature, is very short so that for frequencies up to at least one hundred GHz, leading to . The power exponent is nearly independent of as long as . An estimate of the relative contributions of the TAR and anharmonicity processes to the sound absorption in v-SiO2 was given in Ref. 17 as part of the results of a Brillouin light scattering experiment. The dotted lines in Fig. 3(a) are estimates of the overall contribution for and using the models and the parameters described in [17, 31, 37]. The new data therefore highlight the presence of an additional dissipation process, which adds to the part, and which gives rise to an attenuation that increases drastically at frequencies entering the boson peak region. Let us note the associated attenuation constant. From an adjustment of the whole data set, the -part being fixed at its expected value quoted above, we find the law , with the parameter being independent of temperature. The black dashed line in Fig 3(a) shows while the red and blue solid lines represent the overall total attenuation for and , respectively.
The direct demonstration of this highly damped sound wave regime via phonon spectroscopy techniques has been pursued for decades [38, 23, 39, 7, 8, 9, 10]. As suggested long ago, the rapid decay of the mean free path of sub-terahertz phonons must be the cause of the existence of the universal “plateau” observed in the thermal conductivity of almost all glasses at few kelvin [1, 6]. The physical origin of such a strong phonon attenuation regime, which should be closely linked to the glassy state (disorder), has long been debated [12, 40, 41, 42, 15, 43]. The issue is coming back into focus with the emergence of extensive work on the vibrational properties of glasses observed in computer simulations. Recent investigations on ensembles of computer-samples in different classes of amorphous materials have conclusively demonstrated the existence of soft quasi-localised vibrational modes (QLVs) exhibiting a universal quartic density of states, [44, 45, 46, 47, 48], as early predicted in the framework of a phenomenological theory, the so-called soft potential model (SPM). The SPM is an extension of the tunneling model to include soft localised vibrations in terms of soft anharmonic potentials with locally varying parameters [49, 50, 13, 14]. The quasi-localised excitations can be understood as soft localised vibrations hybridised with acoustic waves.
The QLVs explain the excess modes over the Debye model expectation that form to the so-called “boson peak” [47].
The resonant scattering of sound waves on these soft vibrations would therefore explain the strong acoustic damping regime. The acoustic attenuation increases which follows from the corresponding quartic increase in the excess vibrational density of state. On the basis of the SPM, the LA attenuation is expected to be with for v-SiO2 [41, 51], independent of . The latter value is derived from two experimentally accessible quantities, the tunneling strength for LA modes and the density of states of the soft vibrations which can be extracted from low temperature heat capacity data [52]. Here we reveal this strong damping regime along the whole low-frequency side of the boson peak. The prefactor is found to be slightly larger than .
Another prominent theoretical framework, based on the concept of fluctuating elasticity can also explain the observed phenomenology of sound damping and dispersion in glasses [12]. It relies on the Rayleigh scattering of sound waves, for space dimension , where the prefactor quantifies the spatial fluctuations of the elastic moduli. The shear elastic heterogeneity has been shown to be dominant [53, 54]. A unified view was brought by Schirmacher, who argued that below resonance frequencies local oscillators can be subsumed within the fluctuating-elasticity formalism [55]. Conversely, micro-mechanical frustration might play a central role in the occurrence of QLVS [56, 57]. In the case of silica glass, the local oscillatory motions that form QLVs are the librations of SiO4 tetrahedra [4].
Finally, the LA-linewidth and -velocity data in v-SiO2 at room using IXS [22] are compared with our results in Fig. 3(b) and (c), respectively. Due to resolution limitations, the IXS measurements are restricted to frequencies above and therefore cannot access the frequency region. The two data sets are in good agreement with the Ioffe-Regel criterion being reached at approximately . A decrease in the measured sound velocity accompanies the increase in the damping, see Fig. 3(c). However, the negative phase velocity dispersion from about , reported in this work seems to be inconsistent with that extracted from the IXS data. The latter observation can be rationalised by considering the fundamental differences between the two techniques. In Brillouin x-ray scattering experiments, the momentum-transfer (fixed by the instrument setting) defines the wave-vector of the acoustic mode under study, whose spectrum is treated in terms of the damped harmonic oscillator model, leading to a constant-wavevector phase velocity where is the resonant frequency. It should be emphasised that as the IR limit is approached from below, the acoustic modes are expected to deviate increasingly from plane-waves so that more and more modes contribute to the scattering intensity at the selected value, leading thus to an apparent . In this work, on the other hand, the analyse of the phase of the acoustic echoes gives access to a constant-frequency phase velocity . In effective medium theories based on either fluctuating elastic constants [12, 53, 15] or resonance on QLVs [13, 14], the response of the disordered system is characterised by and not by around the IR-crossover. As shown in [15], and are expected to be somewhat different for frequencies approaching this region, in agreement with our observations. Similarly, the propagation of high frequency sound waves is better described by an attenuation coefficient derived from a constant frequency measurement as reported here, rather than by values extracted from IXS constant- analysis, . It is therefore of great interest to have direct access to the constant-frequency parameters, for both the phase velocity and the scattering length (or attenuation). Above , the spectral width observed in IXS is no longer expected to be a true physical attenuation of a sound wave but rather to reflect the superposition of many vibrational modes [39, 58, 59].
In short, this work has enabled us to disentangle the various contributions to acoustic losses at frequencies entering the boson peak domain, in the prototypical silica glass. As a result of the superposition of several loss mechanisms, effective frequency power laws are observed for the attenuation coefficient, the exponent of which varies with the ranges of and . This explains the non physical exponent of observed at in the range. The expected -regime is finally uncovered at room- along the entire low-frequency side of the boson peak, and is shown to be independent of . Quantitative agreement with the SPM prediction is found. Finally, this work paves the way for phonon spectroscopy in disordered media in the challenging terahertz frequency window by using ultrafast optical techniques. Broadband detection configurations offer the unique advantage of direct access to constant-frequency quantities for acoustic damping and velocity. This could be highly relevant when vibrational modes cease to resemble plane waves as is expected in glasses in the boson peak region and beyond.
Acknowledgements.
This work has been supported by the Agence Nationale de la Recherche (Grant No. ANR-11-BS04-008-01, GlassPhon).References
- Zeller and Pohl [1971] R. C. Zeller and R. O. Pohl, Thermal conductivity and specific heat of noncrystalline solids, Phys. Rev. B 4, 2029 (1971).
- Phillips [1972] W. A. Phillips, Tunneling states in amorphous solids, Journal of Low Temperature Physics 7, 351 (1972).
- Anderson et al. [1972] P. W. Anderson, B. I. Halperin, and C. M. Varma, Anomalous low-temperature thermal properties of glasses and spin glasses, Philosophical Magazine 25, 1 (1972).
- Buchenau et al. [1984] U. Buchenau, N. Nücker, and A. J. Dianoux, Neutron scattering study of the low-frequency vibrations in vitreous silica, Phys. Rev. Lett. 53, 2316 (1984).
- Graebner et al. [1986] J. E. Graebner, B. Golding, and L. C. Allen, Phonon localization in glasses, Phys. Rev. B 34, 5696 (1986).
- Pohl et al. [2002] R. O. Pohl, X. Liu, and E. Thompson, Low-temperature thermal conductivity and acoustic attenuation in amorphous solids, Rev. Mod. Phys. 74, 991 (2002).
- Rufflé et al. [2003] B. Rufflé, M. Foret, E. Courtens, R. Vacher, and G. Monaco, Observation of the onset of strong scattering on high frequency acoustic phonons in densified silica glass, Phys. Rev. Lett. 90, 095502 (2003).
- Rufflé et al. [2006] B. Rufflé, G. Guimbretière, E. Courtens, R. Vacher, and G. Monaco, Glass-specific behavior in the damping of acousticlike vibrations, Phys. Rev. Lett. 96, 045502 (2006).
- Monaco et al. [2009] G. Monaco, V. M. Giordano, and H. E. Stanley, Breakdown of the debye approximation for the acoustic modes with nanometric wavelengths in glasses, Proceedings of the National Academy of Sciences of the United States of America 106, 3659 (2009).
- Baldi et al. [2010] G. Baldi, V. M. Giordano, G. Monaco, and B. Ruta, Sound attenuation at terahertz frequencies and the boson peak of vitreous silica, Phys. Rev. Lett. 104, 195501 (2010).
- Schirmacher et al. [1998] W. Schirmacher, G. Diezemann, and C. Ganter, Harmonic vibrational excitations in disordered solids and the “boson peak”, Phys. Rev. Lett. 81, 136 (1998).
- Schirmacher, W. [2006] Schirmacher, W., Thermal conductivity of glassy materials and the ”boson peak”, Europhys. Lett. 73, 892 (2006).
- Gurevich et al. [2003] V. L. Gurevich, D. A. Parshin, and H. R. Schober, Anharmonicity, vibrational instability, and the boson peak in glasses, Phys. Rev. B 67, 094203 (2003).
- Parshin et al. [2007] D. A. Parshin, H. R. Schober, and V. L. Gurevich, Vibrational instability, two-level systems, and the boson peak in glasses, Phys. Rev. B 76, 064206 (2007).
- DeGiuli et al. [2014] E. DeGiuli, A. Laversanne-Finot, G. During, E. Lerner, and M. Wyart, Effects of coordination and pressure on sound attenuation, boson peak and elasticity in amorphous solids, Soft Matter 10, 5628 (2014).
- Tielbürger et al. [1992] D. Tielbürger, R. Merz, R. Ehrenfels, and S. Hunklinger, Thermally activated relaxation processes in vitreous silica : an investigation by brillouin scattering at high pressures, Phys. Rev. B 45, 2750 (1992).
- Vacher et al. [2005] R. Vacher, E. Courtens, and M. Foret, Anharmonic versus relaxational sound damping in glasses. ii. vitreous silica, Phys. Rev. B 72, 214205 (2005).
- Masciovecchio et al. [2004] C. Masciovecchio, A. Gessini, S. Di Fonzo, L. Comez, S. C. Santucci, and D. Fioretto, Inelastic ultraviolet scattering from high frequency acoustic modes in glasses, Phys. Rev. Lett. 92, 247401 (2004).
- Benassi et al. [2005] P. Benassi, S. Caponi, R. Eramo, A. Fontana, A. Giugni, M. Nardone, M. Sampoli, and G. Viliani, Sound attenuation in a unexplored frequency region: Brillouin ultraviolet light scattering measurements in , Phys. Rev. B 71, 172201 (2005).
- Rufflé et al. [2011] B. Rufflé, E. Courtens, and M. Foret, Inelastic ultraviolet brillouin scattering from superpolished vitreous silica, Phys. Rev. B 84, 132201 (2011).
- Masciovecchio et al. [1997] C. Masciovecchio, G. Ruocco, F. Sette, P. Benassi, A. Cunsolo, M. Krisch, V. Mazzacurati, A. Mermet, G. Monaco, and R. Verbeni, High-frequency propagating modes in vitreous silica at 295 k, Phys. Rev. B 55, 8049 (1997).
- Baldi et al. [2011] G. Baldi, V. M. Giordano, and G. Monaco, Elastic anomalies at terahertz frequencies and excess density of vibrational states in silica glass, Phys. Rev. B 83, 174203 (2011).
- Zhu et al. [1991] T. C. Zhu, H. J. Maris, and J. Tauc, Attenuation of longitudinal-acoustic phonons in amorphous at frequencies up to 440 ghz, Phys. Rev. B 44, 4281 (1991).
- Devos et al. [2008] A. Devos, M. Foret, S. Ayrinhac, P. Emery, and B. Rufflé, Hypersound damping in vitreous silica measured by picosecond acoustics, Phys. Rev. B 77, 100201 (2008).
- Klieber et al. [2011] C. Klieber, E. Peronne, K. Katayama, J. Choi, M. Yamaguchi, T. Pezeril, and K. a. Nelson, Narrow-band acoustic attenuation measurements in vitreous silica at frequencies between 20 and 400 GHz, Applied Physics Letters 98, 211908 (2011).
- Wen et al. [2011] Y.-C. Wen, S.-H. Guol, H.-P. Chen, J.-K. Sheu, and C.-K. Sun, Femtosecond ultrasonic spectroscopy using a piezoelectric nanolayer: Hypersound attenuation in vitreous silica films, Applied Physics Letters 99, 051913 (2011).
- Chou et al. [2019] T.-H. Chou, L. Lindsay, A. A. Maznev, J. S. Gandhi, D. W. Stokes, R. L. Forrest, A. Bensaoula, K. A. Nelson, and C.-K. Sun, Long mean free paths of room-temperature thz acoustic phonons in a high thermal conductivity material, Phys. Rev. B 100, 094302 (2019).
- Huynh et al. [2015] A. Huynh, B. Perrin, and A. Lema?e, Semiconductor superlattices: A tool for terahertz acoustics, Ultrasonics 56, 66 (2015).
- Mante et al. [2015] P.-A. Mante, Y.-R. Huang, S.-C. Yang, T.-M. Liu, A. A. Maznev, J.-K. Sheu, and C.-K. Sun, Thz acoustic phonon spectroscopy and nanoscopy by using piezoelectric semiconductor heterostructures, Ultrasonics 56, 52 (2015).
- Vacher et al. [2006] S. Vacher, Ren?nd Ayrinhac, M. Foret, and E. Rufflé, Beno?and Courtens, Finite size effects in brillouin scattering from silica glass, Phys. Rev. B 74, 012203 (2006).
- Ayrinhac et al. [2011] S. Ayrinhac, M. Foret, A. Devos, B. Rufflé, E. Courtens, and R. Vacher, Subterahertz hypersound attenuation in silica glass studied via picosecond acoustics, Phys. Rev. B 83, 014204 (2011).
- Huynh et al. [2008] A. Huynh, B. Perrin, N. D. Lanzillotti-Kimura, B. Jusserand, A. Fainstein, and A. Lemaître, Subterahertz monochromatic acoustic wave propagation using semiconductor superlattices as transducers, Phys. Rev. B 78, 233302 (2008).
- Sun et al. [2000] C.-K. Sun, J.-C. Liang, and X.-Y. Yu, Coherent acoustic phonon oscillations in semiconductor multiple quantum wells with piezoelectric fields, Phys. Rev. Lett. 84, 179 (2000).
- Chern et al. [2004] G.-W. Chern, K.-H. Lin, and C.-K. Sun, Transmission of light through quantum heterostructures modulated by coherent acoustic phonons, Journal of Applied Physics 95, 1114 (2004), https://doi.org/10.1063/1.1637957 .
- Maznev et al. [2012] A. Maznev, K. J. Manke, K.-H. Lin, K. A. Nelson, C.-K. Sun, and J.-I. Chyi, Broadband terahertz ultrasonic transducer based on a laser-driven piezoelectric semiconductor superlattice, Ultrasonics 52, 1 (2012).
- Kung-Hsuan Lin et al. [2005] Kung-Hsuan Lin, Gia-Wei Chern, Cheng-Ta Yu, Tzu-Ming Liu, Chang-Chi Pan, Guan-Ting Chen, Jen-Inn Chyi, Sheng-Wen Huang, Pai-Chi Li, and Chi-Kuang Sun, Optical piezoelectric transducer for nano-ultrasonics, IEEE Transactions on Ultrasonics, Ferroelectrics, and Frequency Control 52, 1404 (2005).
- Huynh et al. [2017] A. Huynh, E. Péronne, C. Gingreau, X. Lafosse, A. Lemaître, B. Perrin, R. Vacher, B. Rufflé, and M. Foret, Temperature dependence of hypersound attenuation in silica films via picosecond acoustics, Phys. Rev. B 96, 174206 (2017).
- Dietsche and Kinder [1979] W. Dietsche and H. Kinder, Spectroscopy of phonon scattering in glass, Phys. Rev. Lett. 43, 1413 (1979).
- Foret et al. [1996] M. Foret, E. Courtens, R. Vacher, and J.-B. Suck, Scattering investigation of acoustic localization in fused silica, Phys. Rev. Lett. 77, 3831 (1996).
- Monaco and Mossa [2009] G. Monaco and S. Mossa, Anomalous properties of the acoustic excitations in glasses on the mesoscopic length scale, Proceedings of the National Academy of Sciences 106, 16907 (2009), https://www.pnas.org/doi/pdf/10.1073/pnas.0903922106 .
- Buchenau et al. [1992] U. Buchenau, Y. M. Galperin, V. L. Gurevich, D. A. Parshin, M. A. Ramos, and H. R. Schober, Interaction of soft modes and sound waves in glasses, Phys. Rev. B 46, 2798 (1992).
- H.R. [2011] S. H.R., Quasi-localized vibrations and phonon damping in glasses, Journal of Non-Crystalline Solids 357, 501 (2011), 6th International Discussion Meeting on Relaxation in Complex Systems.
- Gelin et al. [2016] S. Gelin, H. Tanaka, and A. Lemaître, Anomalous phonon scattering and elastic correlations in amorphous solids, Nature Materials 15, 1177 (2016).
- Lerner et al. [2016] E. Lerner, G. Düring, and E. Bouchbinder, Statistics and properties of low-frequency vibrational modes in structural glasses, Phys. Rev. Lett. 117, 035501 (2016).
- Mizuno et al. [2017] H. Mizuno, H. Shiba, and A. Ikeda, Continuum limit of the vibrational properties of amorphous solids, Proceedings of the National Academy of Sciences 114, E9767 (2017), https://www.pnas.org/doi/pdf/10.1073/pnas.1709015114 .
- Shimada et al. [2018] M. Shimada, H. Mizuno, M. Wyart, and A. Ikeda, Spatial structure of quasilocalized vibrations in nearly jammed amorphous solids, Phys. Rev. E 98, 060901 (2018).
- Lerner and Bouchbinder [2021] E. Lerner and E. Bouchbinder, Low-energy quasilocalized excitations in structural glasses, The Journal of Chemical Physics 155, 200901 (2021), https://doi.org/10.1063/5.0069477 .
- Richard et al. [2020] D. Richard, K. González-López, G. Kapteijns, R. Pater, T. Vaknin, E. Bouchbinder, and E. Lerner, Universality of the nonphononic vibrational spectrum across different classes of computer glasses, Phys. Rev. Lett. 125, 085502 (2020).
- Buchenau et al. [1991] U. Buchenau, Y. M. Galperin, V. L. Gurevich, and H. R. Schober, Anharmonic potentials and vibrational localization in glasses, Phys. Rev. B 43, 5039 (1991).
- Gil et al. [1993] L. Gil, M. A. Ramos, A. Bringer, and U. Buchenau, Low-temperature specific heat and thermal conductivity of glasses, Phys. Rev. Lett. 70, 182 (1993).
- Rufflé et al. [2008] B. Rufflé, D. A. Parshin, E. Courtens, and R. Vacher, Boson peak and its relation to acoustic attenuation in glasses, Phys. Rev. Lett. 100, 015501 (2008).
- Ramos and Buchenau [1997] M. A. Ramos and U. Buchenau, Low-temperature thermal conductivity of glasses within the soft-potential model, Phys. Rev. B 55, 5749 (1997).
- Schirmacher et al. [2007] W. Schirmacher, G. Ruocco, and T. Scopigno, Acoustic attenuation in glasses and its relation with the boson peak, Phys. Rev. Lett. 98, 025501 (2007).
- Léonforte et al. [2006] F. Léonforte, A. Tanguy, J. P. Wittmer, and J.-L. Barrat, Inhomogeneous elastic response of silica glass, Phys. Rev. Lett. 97, 055501 (2006).
- Walter [2011] S. Walter, Some comments on fluctuating-elasticity and local oscillator models for anomalous vibrational excitations in glasses, Journal of Non-Crystalline Solids 357, 518 (2011), 6th International Discussion Meeting on Relaxation in Complex Systems.
- Lerner and Bouchbinder [2018] E. Lerner and E. Bouchbinder, Frustration-induced internal stresses are responsible for quasilocalized modes in structural glasses, Phys. Rev. E 97, 032140 (2018).
- Kapteijns et al. [2021] G. Kapteijns, E. Bouchbinder, and E. Lerner, Unified quantifier of mechanical disorder in solids, Phys. Rev. E 104, 035001 (2021).
- Buchenau [2014] U. Buchenau, Evaluation of x-ray brillouin scattering data, Phys. Rev. E 90, 062319 (2014).
- Baldi et al. [2016] G. Baldi, V. M. Giordano, B. Ruta, and G. Monaco, On the nontrivial wave-vector dependence of the elastic modulus of glasses, Phys. Rev. B 93, 144204 (2016).
- Duquesne and Perrin [2003] J.-Y. Duquesne and B. Perrin, Ultrasonic attenuation in a quasicrystal studied by picosecond acoustics as a function of temperature and frequency, Phys. Rev. B 68, 134205 (2003).
- Malitson [1965] I. H. Malitson, Interspecimen comparison of the refractive index of fused silica, J. Opt. Soc. Am. 55, 1205 (1965).
Methods
III.0.1 Superlattice-based samples
The AlAs/GaAs superlattice (SL) has been grown by molecular beam epitaxy on a (001) oriented two-sided polished GaAs substrate. It consists of 40 periods of a layer pair structure ( / for AlAs/GaAs). On the back of the GaAs substrate, thin films of amorphous silica with various thicknesses were deposited using radio frequency cathodic sputtering. To obtain films with properties close to those of bulk silica or thermal oxide films [37], the deposition was done at using a cold O2/Ar plasma, maintaining the two gas pressure at 0.1 Pa. At last, a thin Al film is evaporated on the silica surface for use as a transducer. This last step was made in the same time for all samples. The table 1 summarizes the studied samples with various layers deposited on the back of the substrate.
| Al film (nm) | SiO2 (nm) | substrate GaAs () | SL AlAs/GaAs (Å) |
|---|---|---|---|
| 100 | |||
| 25 | 305 | 350 | 68/189() |
| 467 |
A degenerated pump-probe set-up was used with a mode-locked Ti:Sapphire femtosecond laser as the laser source. Two hundred femtosecond optical pump pulses centered at are sent with a repetition rate on the metallic film, causing it to rapidly heat and expand. As a result, a longitudinal acoustic wave is launched into the sample, propagates into the substrate and the silica layer before reaching the SL. The incoming strain induces a displacement of the SL surface and modifies the optical constants, resulting in changes in optical reflectivity. These transient changes of the complex reflectivity are detected by the probe light pulse focused on the SL, time-delayed relatively to the pump pulse. The detection setup, previously described in [60], is based on a Sagnac interferometer to measure the real and imaginary parts of the reflectivity. This interferometer presents the advantage of being particularly insensitive to noise introduced by mechanical instabilities because both arms describe the same path in counterpropagating senses. It is particularly useful here as the sample is mounted in a cryostat. Indeed, the sample is cooled down to low temperature (typically 7 to ) in a 4 K helium-flow cryostat with sample in static exchange gas to minimize sound attenuation during propagation in the substrate. The transient changes of reflectivity being of the order of to , it is necessary to use a lock-in technique and signal averaging, with a pump beam modulation of . We use typical energies per pulse of maximum for the pump and 0.1 to for the probe. Light beams are focused to a diameter of on the sample surface. These low pump intensities were required to avoid non-linearities during propagation through the thick GaAs substrate. In addition, with these experimental conditions, we have minimized the steady-state heating of the sample, especially at low temperature. The laser spot sizes are much larger than the layer thicknesses (Al or SiO2), so that the one-dimensional approximation is appropriate for the description of acoustic wave propagation.
The signal of reflectivity was measured as a function of the time delay over providing a Fourier transform with a resolution of . The attenuation was deduced from the comparison of the spectra measured on two samples in the same experimental conditions with the ratio of the peaks amplitude for each detected frequency by the SL : , and being the thickness of the silica layers.
III.0.2 InGaN single-quantum-well-based samples
Sample preparation
An In0.1Ga0.9N SQW was used as the photoacoustic transducer. The transducer samples were grown by metal-organic chemical vapor deposition (MOCVD) on 430--thick (0001) double-sided polished sapphire substrates. The InGaN SQW transducer was grown with a thickness of by embedding it between a 2--thick gallium nitride (GaN) buffer layer and a 63-nm-thick GaN cap layer. High Resolution Transmission electron microscopy (HRTEM) was used to examine the structures of the samples, to confirm the thicknesses of the InGaN SQW and the GaN cap layer, and to ensure the atomic flatness of each interface. The samples were then cleaned with buffered HF, acetone, isopropanol, and deionized water to remove the oxide layer and organic residue on the surface of the GaN cap layer.
Next, v-SiO2 films with various thicknesses were grown on top of these transducer samples using plasma-enhanced chemical vapor deposition (PECVD) at , which has been widely used as a reliable way to prepare v-SiO2 films in previous studies [25, 26]. The gas was a mixture of N2O, SiH4, and Ar. First, the optical and acoustic properties of the grown v-SiO2 films were compared with the known properties of bulk v-SiO2. The refractive index of bulk v-SiO2 is 1.46 at [61], and that of the v-SiO2 film could be controlled to be 1.46 by adjusting the process pressure to 70 Pa in 8% SiH4 with Ar [61]. The sound velocity is another unique property of v-SiO2 glass. By measuring the temporal difference between echoes reflected from the GaN/v-SiO2 and v-SiO2/air interfaces and considering the film thicknesses measured from the TEM images (Fig. S3), the calculated sound velocity of each film was compared with the previously reported sound velocity of in v-SiO2. Two samples were examined by TEM, and the thicknesses of the v-SiO2 films were measured to be and ; the error is due to the poor contrast between the v-SiO2 and the protection layer under TEM as both v-SiO2 and the protection layer have disordered structures and the interface between crystalline GaN and v-SiO2 is transparent. Under this circumstance, here we took the reported v-SiO2 sound velocity value of [25, 17] and the measured echo time to calculate the actual thickness ( and ).
Advanced femtosecond acoustics system – the optical part
A transmission-type femtosecond optical pump–probe system was constructed to optically pump the photoacoustic transducer, thereby generating femtosecond acoustic strain pulses. Split pulses were then used to optically probe the same photoacoustic transducer for femtosecond-time-resolved detection of the strain pulse echo. As depicted in Fig. 4, a mode-locked Ti:sapphire femtosecond laser with a repetition rate was adopted as the laser source. The output pulse had an energy of and a central wavelength of . In order to reach the bandgap of the indium-gallium-nitride single-quantum-well (InGaN SQW), the laser beam was focused onto a beta-barium-borate (BBO) crystal, and its frequency was doubled for the generation of ultraviolet (UV) laser beam. A half-wave plate and a polarizing beam splitter were used to adjust the relative energies of the p-polarized and s-polarized beams, which served as the pump and probe beams. The pump beam was modulated at using an acoustic-optic modulator (AOM) for the purpose of acquiring better signal-to-noise ratio by the phase-sensitive amplification technique. The pump beam was guided into a delay stage with a retro-reflector, and the optical path length difference of the two beams can thereby be translated to the time difference with femtosecond resolution. The powers of the pump and probe beams were adjusted to be 10:1, and both the pump and probe beams were focused onto the sample with the resulting spot sizes of roughly . Finally, the probe beams passing through the samples, undergoing the effect resulting from the pump beams, was collected by a silicon optical detector, and the data was recorded for the further analysis.
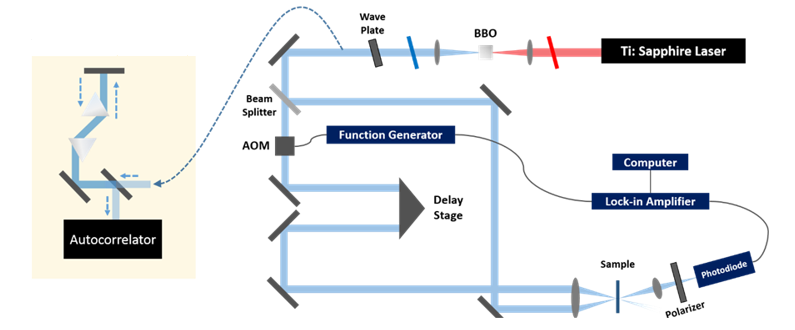
To broaden the bandwidth of the acoustic pulse, the widths of the pump and probe pulses were shortened as much as possible. A pair of prisms was placed after the BBO crystal to attain a transform-limited pulse width. Then, a UV two-photon-absorption autocorrelator was used to record the autocorrelation between the pulse and a signal having a Gaussian-like intensity and a full width at half maximum (FWHM) of , which is equivalent to the pulse width of the UV pump–probe pulses after being shortened as much as possible by the prism pair.