Break-up and Recovery of Harmony between Direct and Indirect Pathways in The Basal Ganglia; Huntington’s Disease and Treatment
Abstract
The basal ganglia (BG) in the brain exhibit diverse functions for motor, cognition, and emotion. Such BG functions could be made via competitive harmony between the two competing pathways, direct pathway (DP) (facilitating movement) and indirect pathway (IP) (suppressing movement). As a result of break-up of harmony between DP and IP, there appear pathological states with disorder for movement, cognition, and psychiatry. In this paper, we are concerned about the Huntington’s disease (HD), which is a genetic neurodegenerative disorder causing involuntary movement and severe cognitive and psychiatric symptoms. For the HD, the number of D2 SPNs () is decreased due to degenerative loss, and hence, by decreasing (fraction of ), we investigate break-up of harmony between DP and IP in terms of their competition degree , given by the ratio of strength of DP () to strength of IP () (i.e., ). In the case of HD, the IP is under-active, in contrast to the case of Parkinson’s disease with over-active IP, which results in increase in (from the normal value). Thus, hyperkinetic dyskinesia such as chorea (involuntary jerky movement) occurs. Treatment of HD, based on optogenetics, is also investigated through recovery of harmony between DP and IP. Finally, we study effect of loss of healthy synapses of all the BG cells on HD.
pacs:
87.19.lj, 87.19.lu, 87.19.rsI Introduction
The basal ganglia (BG) (called the dark basement of the brain) are a group of subcortical deep-lying nuclei, receiving excitatory cortical input from most areas of cortex, and they provide inhibitory output to the thalamus and brainstem Luo ; Kandel ; Squire ; Bear . The BG exhibit a variety of functions for motor control and regulation of cognitive and emotional processes Luo ; Kandel ; Squire ; Bear ; GPR1 ; GPR2 ; Hump1 ; Hump2 ; Hump3 ; Man . Dysfunction in the BG is related to movement disorder [e.g., Parkinson’s disease (PD) and Huntington’s disease (HD)] and cognitive and psychiatric disorders Luo ; Kandel ; Squire ; Bear .
In this paper, we are concerned about the HD. It is a rare hereditary neurodegenerative disease with severe symptoms for motor, cognition, and emotion HD1 ; HD2 ; HD3 ; HD4 ; HD5 ; HD6 ; HD7 . As is well known, patients with HD show hyperkinetic dyskinesia such as chorea (involuntary jerky dance-like movement) as well as cognitive (e.g., dementia) and psychiatric (e.g,, depression and anxiety) disorders. In contrast, patients with PD show hypokinetic disorder such as slowed movement (bradykinesia) PD1 ; PD2 ; PD3 ; PD4 ; PD5 ; PD6 . Thus, if PD lies at one end of the spectrum of movement disorders in the BG, HD lies at the other end. We note that HD is caused by a mutated huntingtin (HTT) gene on chromosome 4 HTT1 ; HTT2 . As a result of mutation in HTT gene, the defective HTT gene has abnormal excessive repeats of a three-base (CAG) DNA sequence; in the mutant gene, the repeat occurs over and over again, from 40 times to more than 80. The greater the number of CAG repeats, the earlier the onset and severity of HD. This kind of trinucleotide repeat expansion results in production of abnormal HTT protein that accumulates, resulting in creation of toxic HTT protein aggregates damaging neurons (e.g., death of striatal cells in the BG). Thus, the primary pathological feature of HD is appearance of toxic HTT protein aggregates, causing the characteristic neurodegeneration seen in HD, in contrast to the case of PD where DA deficiency is a major cause.
In our previous work for the PD in the BG KimPD , we developed a spiking neural network (SNN) for the BG, based on anatomical and physiological data derived from rat-based studies Ana4 ; Ana5 ; Ana6 ; Ana7 ; Phys1 ; Phys2 ; Phys3 ; Phys4 ; Phys5 ; Phys6 ; Phys7 ; Phys8 ; Phys9 ; Phys10 ; Phys11 ; Phys12 ; Phys13 ; Phys14 ; Phys15 ; Phys16 ; Phys17 ; Phys18 ; Phys19 ; Phys20 . Here, we use rat-brain terminology throughout. The BG receive excitatory cortical input from most regions of cortex via the input nuclei [striatum and subthalamic nucleus (STN)] and project inhibitory output via the output nucleus [substantia nigra pars reticulata (SNr)], through the thalamus to the motor area of the cortex Hump1 ; Man . We also note that, the principal input nucleus, striatum, is the primary recipient of dopamine (DA), arising from the substantia nigra pars compacta (SNc). Within the striatum, spine projection neurons (SPNs), comprising up to 95 of the whole striatal population, are the only primary output neurons Str1 ; Str2 . There are two types of SPNs with D1 and D2 receptors for the DA. The DA modulates firing activity of the D1 and D2 SPNs in a different way SPN1 ; SPN2 ; CN6 . In the early stage of HD, degenerative loss of D2 SPNs occurs due to mutation in the HTT gene, while DA level in the striatum is nearly normal Degen1 ; Degen2 ; Degen3 ; Degen4 .
There are two competing pathways, direct pathway (DP) and indirect pathway (IP), in the BG DIP1 ; DIP2 ; DIP3 ; DIP4 . D1 SPNs in the striatum make direct inhibitory projection to the output nucleus, SNr, through DP, and then the thalamus becomes disinhibited. Consequently, movement facilitation occurs. In contrast, D2 SPNs are connected to the SNr through IP, crossing the intermediate control nucleus, GP (globus pallidus), and the STN. In the case of IP, the firing activity of the SNr becomes enhanced mainly because of excitatory input from the STN. As a result, firing activity of the thalamus becomes decreased, resulting in movement suppression.
Diverse functions of the BG could be made via “balance” of DP and IP. So far, a variety of subjects for the BG have been investigated in many computational works GPR1 ; GPR2 ; Hump1 ; Hump2 ; Hump3 ; Man ; Str2 ; SPN1 ; SPN2 ; Frank1 ; Frank2 ; CN1 ; CN2 ; CN3 ; CN4 ; CN5 ; CN6 ; CN7 ; CN8 ; CN9 ; CN10 ; CN11 ; CN12 ; CN13 ; CN14 ; CN15 ; CN16 ; CN17 ; CN18 ; CN19 ; CN20 ; CN21 ; CN22 ; CNHD1 ; CNHD2 ; CNHD3 . But, no quantitative analysis for balance between DP and IP was made. As a first time, in our recent work KimPD , we made quantitative analysis for competitive harmony (i.e., competition and cooperative interplay) between DP and IP by introducing their competition degree , given by the ratio of strength of DP () to strength of IP () (i.e., ); is given by the magnitude of the total time-averaged synaptic current into the output nucleus, SNr, through DP (IP).
In this paper, we take into consideration of degenerative loss of D2 SPNs for the HD; (number of D2 SPNs) = (normal value) [ (fraction of number of D2 SPNs) ] Degen1 ; Degen2 ; Degen3 ; Degen4 ; Degen5 ; Degen6 . By decreasing from 1, we investigate break-up of harmony between DP and IP for the HD by employing the competition degree in the case of normal DA level (). Due to degenerative loss of D2 SPNs, IP becomes under-active (i.e., weakened), leading to increase in from normal value. Thus, hyperkinetic dyskinesia such as chorea occurs, which is in contrast to the case of PD with reduced , causing hypokinetic disorder. Next, based on optogenetics OG1 ; OG2 , treatment of HD is also studied via recovery of harmony between DP and IP. Through activation of D2 SPN (STN) and deactivation of GP, IP becomes strengthened and thus harmony between DP and IP may be recovered. Finally, we investigate effect of loss of healthy synapses of all the BG cells on HD Loss1 ; Loss2 ; Loss3 ; Loss4 ; Loss5 ; Loss6 .
II BG Spiking Neural Network
In this section, we describe our SNN for the BG. In our recent work KimPD , we developed our BG SNN, composed of D1/D2 SPNs, STN neurons, GP neurons, and SNr neurons, based on the anatomical and the physiological properties of the BG Ana4 ; Ana5 ; Ana6 ; Ana7 ; Phys1 ; Phys2 ; Phys3 ; Phys4 ; Phys5 ; Phys6 ; Phys7 ; Phys8 ; Phys9 ; Phys10 ; Phys11 ; Phys12 ; Phys13 ; Phys14 ; Phys15 ; Phys16 ; Phys17 ; Phys18 ; Phys19 ; Phys20 . In our BG SNN, we also consider the modulation effect of DA on D1/D2 SPN and afferent synapses into the D1/D2 SPNs, the STN, and the GP SPN1 ; SPN2 ; CN6 . Here, for the sake of completeness and understanding of readers, we provide description of our BG SNN; for more details, refer to Sec. II in Ref. KimPD .
| Parmeters | D1/D2 SPN | STN | GP | SNr |
|---|---|---|---|---|
| 16.1 | 23.0 | 68.0 | 172.1 | |
| -80.0 | -56.2 | -53.0 | -64.58 | |
| -29.3 | -41.4 | -44.0 | -51.8 | |
| 1 | 0.439 | 0.943 | 0.7836 | |
| 0.01 | 0.021 | 0.0045 | 0.113 | |
| -20 | 4 | 3.895 | 11.057 | |
| -55 | -47.7 | -58.36 | -62.7 | |
| 84.2 | 17.1 | 0.353 | 138.4 | |
| 40 | 15.4 | 25 | 9.8 |
II.1 Framework of Our SNN of The BG
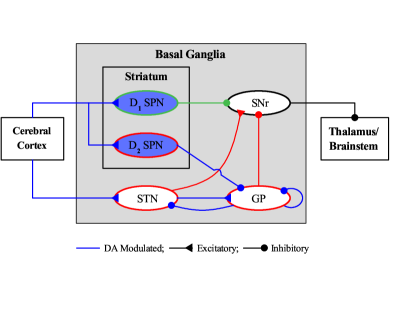
Figure 1 shows a box diagram of major neurons and synaptic connections in our BG SNN. Our BG SNN consists of striatum and STN (input nuclei), SNr (output nucleus), and GP (intermediate controller). Here, all the BG neurons except the excitatory STN neuron are inhibitory ones.
Both striatum and STN receive cortical inputs from most regions of the cortex. Here, we model cortical inputs in terms of 1,000 independent Poisson spike trains with firing rate . Tonic cortical input in the resting state has Hz. On the other hand, the phasic cortical input in the phasically-active state has Hz, independently of Hump1 ; CI1 ; CI2 ; CI3 ; CI4 ; CI5 ; Str2 ; CN6 ; CN14 . The striatum is also the primary recipient of the DA (arising from the SNc). Two kinds of SPNs with D1 and D2 receptors for the DA exist within the striatum. They comprise up to 95 of the whole striatal population Str1 ; Str2 . We note that these D1 and D2 SPNs show different firing behaviors because of DA modulation SPN1 ; SPN2 ; CN6 .
There are two competing pathways, DP and IP, in the BG DIP1 ; DIP2 ; DIP3 ; DIP4 . The D1 SPNs make direct inhibitory projection to the output nucleus, SNr, via DP (green color in Fig. 1). Then, the thalamus is disinhibited, resulting in movement facilitation. On the other hand, the D2 SPNs are connected to the SNr via IP (red color in Fig. 1), crossing the GP and the STN. Here, the GP plays a role of intermediate controller to control the firing behavior of the STN. In the case of IP, the firing activity of the SNr becomes increased mainly due to excitatory input from the STN. Consequently, firing activity of the thalamus becomes decreased, leading to movement suppression. Thus, the firing activity of the output nucleus, SNr, is controlled through competition between DP (green) and IP (red).
We choose the numbers of the striatal neurons, the STN neurons, the GP neurons, and the SNr neurons in the BG, based on the anatomical information Ana6 . A scaled-down SNN where the total number of striatal neurons is , corresponding to of the striatal cells found in the rat BG, is developed. In this way, we scale down with ratio for all the BG neurons CN11 ; CN17 ; and ( is the number of neurons in the population). 90-97 of the whole striatal population corresponds to the major subpopulation of D1/D2 SPNs CN11 ; in our BG SNN, we choose 95 . The remaining 5 subpopulation of fast spiking interneurons are not considered in our SNN.
The cortex (Ctx) provides the external excitatory inputs randomly to the D1/D2 SPNs and the STN neurons with the connection probabilities, = 0.084 (8.4 ) and = 0.03 (3 ), respectively CN6 . Here, we consider random synaptic connections between BG cells in Fig. 1. The synaptic connection probabilities from a presynaptic neuron in the source population () to a postsynaptic neuron in the target population () in the BG are as follows CN14 : (3.3 ), (3.3 ), (30 ), (10 ), (10 ), (30 ), and (10.66 ).
II.2 Izhikevich Spiking Neuron Models and DA Effects in Our BG SNN
The Izhikevich spiking neuron model (which is not only biologically plausible, but also computationally efficient) is used as elements of our BG SNN Izhi1 ; Izhi2 ; Izhi3 ; Izhi4 . Unlike the Hodgkin-Huxley-type conductance-based models, the Izhikevich model matches neuronal dynamics by tuning its parameters.
Our BG SNN consists of 5 populations of D1 SPNs, D2 SPNs, STN neurons, GP neurons, and SNr neurons. The following equations govern evolution of dynamical states of individual neurons in the population [ D1 (SPN), D2 (SPN), STN, GP, and SNr]:
| (1) | |||||
| (2) | |||||
with the auxiliary after-spike resetting:
| (3) |
Here, and are the total number of neurons and the current into the th neuron in the population, respectively. The dynamical state of the th neuron in the population at a time (msec) is given by its membrane potential (mV) and the slow recovery variable (pA). As the membrane potential arrives at its apex , the neuron fires, and then both the membrane potential and the recovery variable are reset according to the rules of Eq. (3).
The Izhikevich neuron model has 9 intrinsic parameters in each population; (membrane capacitance, pF), (resting membrane potential, mV), (instantaneous threshold potential, mV), (parameter associated with the neuron’s rheobase, nS/mV), (recovery time constant, ), (parameter associated with the input resistance, nS), (after-spike reset value of , mV), (after-spike jump value of , pA), and (spike cutoff value, mV). The 9 intrinsic parameter values of D1 SPN, D2 SPN, STN, GP, and SNr are shown in Table 1. We obtain the parameter values of the STN neuron, GP neuron, and SNr neuron, based on the work in CN6 , in addition to the parameter values of the D1/D2 SPNs given in SPN1 ; SPN2 . These parameter values are based on physiological properties of the D1/D2 SPNs, the STN neurons, the GP neurons, and the SNr neurons Phys1 ; Phys2 ; Phys3 ; Phys4 ; Phys5 ; Phys6 ; Phys7 ; Phys8 ; Phys9 ; Phys10 ; Phys11 .
Time-evolution of the dynamical state [ ] is governed by the current into the th neuron in the population in Eq. (1), given by:
| (4) |
where , , and represent the external current from the external background region (not considered in the modeling), the synaptic current, and the injected stimulation current, respectively. Here, we consider the case of no injected stimulation DC current (i.e., ).
We model the external current in terms of its time average, (spontaneous current for spontaneous firing activity), and fluctuation from the time average, (random background input). Here, (independent of ) is just the spontaneous in-vivo current, , to obtain the spontaneous in-vivo firing rate in the presence of synaptic inputs in the tonic cortical resting state. We also model the random background current as follows:
| (5) |
Here, is the noise intensity parameter and is the Gaussian white noise, which satisfies the zero mean and the unit variance Kim1 ; Kim2 ; Kim3 :
| (6) |
Finally, we consider the effects of DA modulation on the D1 and D2 SPNs SPN1 ; SPN2 ; CN6 . As a result of D1 receptors activation, there occur two opposing effects on intrinsic ion channels. Enhancement of the inward-rectifying potassium current (KIR) results in hyperpolarization of the D1 SPN. On the other hand, decrease in the activation threshold of the L type current leads to depolarization of the D1 SPN. These two competing hyperpolarization and depolarization effects may be modeled through changes in intrinsic parameters of the D1 SPN:
| (7) |
where and is the DA level (i.e., fraction of active DA receptors) for the D1 SPNs. Here, the hyperpolarizing effect of the increasing KIR is modeled by upscaling in Eq. (7). On the other hand, enhanced depolarizing effect of the L type current is modelled by downscaling in Eq. (7). The parameters and denote the amplitudes of their respective effects.
| Parmeters | D1/D2 SPN | STN | GP | SNr |
|---|---|---|---|---|
| 0 | 56.5 | 84.0 | 292.0 | |
| 1 | 9.9 | 29.9 | 25.5 | |
| 246 | 11.9 | 274 | 942 |
In contrast, small inhibitory effect on the slow A-type potassium current through D2 receptors activation results in decrease in the neuron’s rheobase current. We model the depolarizing effect by downscaling the parameter, :
| (8) |
where is the DA level for the D2 SPNs, and the parameter denotes the downscaling degree in .
In this paper, we consider the case of normal DA level throughout; . In-vivo firing activities of BG neurons in awake resting state with tonic cortical input (3 Hz) are shown in Table 2; spontaneous in-vivo currents , in-vivo firing rates , and random background inputs in each population [ D1 (SPN), D2 (SPN), STN, GP, and SNr] are given.
II.3 Synaptic Currents and DA Effects in Our BG SNN
We consider the synaptic current into the th neuron in the population in Eq. (4). As in our previous works Cere1 ; Cere2 ; Hippo1 ; Hippo2 ; Hippo3 ; Hippo4 , we follow the “canonical” formalism for the synaptic currents. There are 3 kinds of synaptic currents, , , and . Here, and are the excitatory AMPA (-amino-3-hydroxy-5-methyl-4-isoxazolepropionic acid) receptor-mediated and NMDA (-methyl--aspartate) receptor-mediated currents from the presynaptic source population to the postsynaptic th neuron in the target population. In contrast, is the inhibitory (-aminobutyric acid type A) receptor-mediated current from the presynaptic source population to the postsynaptic th neuron in the target population.
The (= AMPA, NMDA, or GABA) receptor-mediated synaptic current from the presynaptic source population to the th postsynaptic neuron in the target population is given by:
| (9) |
Here, and are synaptic conductance and synaptic reversal potential, respectively.
We get the synaptic conductance from:
| (10) |
Here, is the maximum synaptic conductance and is the number of neurons in the source population. The interpopulation synaptic connection from the source population to the target population is given by the connection weight matrix () where in the presence of synaptic connection from the th neuron in the source population to the th neuron in the target population; otherwise, in the absence of synaptic connection, .
Fraction of open postsynaptic ion channels (opened via binding of neurotransmitters emitted from the source population) is represented by in Eq. (10). Time evolution of is given by a sum of exponential-decay functions :
| (11) |
Here, and are the th spike time and the total number of spikes of the th cell in the source population, respectively, and is the synaptic latency time constant for -mediated synaptic current.
As in our previous works in the cerebellum Cere1 ; Cere2 , the exponential-decay function (corresponding to contribution of a presynaptic spike occurring at in the absence of synaptic latency) is given by:
| (12) |
Here, is the synaptic decay time constant, and is the Heaviside step function: for and 0 for .
| Ctx D1/D2 SPN | AMPA | 0.6 | 6 | 10 | 0 |
| NMDA | 0.3 | 160 | 10 | 0 | |
| Ctx STN | AMPA | 0.388 | 2 | 2.5 | 0 |
| NMDA | 0.233 | 100 | 2.5 | 0 | |
| D1 SPN SNr | GABA | 4.5 | 5.2 | 4 | -80 |
| D2 SPN GP | GABA | 3.0 | 6 | 5 | -65 |
| STN GP | AMPA | 1.29 | 2 | 2 | 0 |
| NMDA | 0.4644 | 100 | 2 | 0 | |
| GP GP | GABA | 0.765 | 5 | 1 | -65 |
| GP STN | GABA | 0.518 | 8 | 4 | -84 |
| STN SNr | AMPA | 12 | 2 | 1.5 | 0 |
| NMDA | 5.04 | 100 | 1.5 | 0 | |
| GP SNr | GABA | 73 | 2.1 | 3 | -80 |
In the NMDA-receptor case, some of the postsynaptic NMDA channels are known to be blocked by the positive magnesium ion Mg2+. In this case, fraction of NMDA channels that are not blocked by the Mg2+ ion is given by a sigmoidal function SPN1 ; CN6 ; NMDA ,
| (13) |
Here, is the membrane potential of a neuron in the target population and is the equilibrium concentration of magnesium ions ( = 1 mM).
Thus, the synaptic current into the th neuron in the target population becomes
| (14) |
Synaptic parameters of the synaptic currents from the source population to the target population : maximum synaptic conductance , synaptic decay time , synaptic delay time , and synaptic reversal potential are shown in Table 3. These parameter values are also based on the physiological properties of the relevant neurons SPN2 ; CN6 ; CN14 ; Phys2 ; Phys12 ; Phys13 ; Phys14 ; Phys15 ; Phys16 ; Phys17 ; Phys18 ; Phys19 ; Phys20 .
Finally, we consider the effect of DA modulation on the synaptic currents into D1 SPN, D2 SPN, STN, and GP neurons in Fig. 1 SPN1 ; SPN2 ; CN6 . In the case of synaptic currents into the D1 SPNs, DA modulation effect is modeled by up-scaling the NMDA receptor-mediated current with the factor :
| (15) |
where and is the DA level for the D1 SPNs. (In the case of D1 SPNs, there is no effect of DA modulation on the AMPA receptor-mediated current ) On the other hand, in the case of synaptic currents into the D2 SPNs, DA modulation effect is modeled by down-scaling the AMPA receptor-mediated current with the factor :
| (16) |
where and is the DA level for the D2 SPNs. (There is no DA effect on for the D2 SPNs.)
Unlike the above cases of D1 and D2 SPNs, there are DA effects on all the synaptic currents, and into the STN neurons and GP neurons. In these cases, all excitatory and inhibitory synaptic currents, , , and , are down-scaled with their scaling factors, depending on (DA level for the D2 SPNs):
| (17) | |||
| (18) |
Here, the scaling factors and .
III Quantitative Analysis of Break-up and Recovery of Harmony between DP and IP for the HD
In this section, we quantitatively analyze competitive harmony (i.e., competition and cooperative interplay) between DP and IP for the HD in terms of the competition degree between them, introduced in our previous work KimPD . is given by the ratio of strength of DP () to strength of IP () (i.e., ).
We consider the early stage of HD where neurodegerative loss of D2 SPNs occurs; (number of D2 SPNs) = (=1325; normal value) [ (fraction of number of D2 SPNs) ] Degen1 ; Degen2 ; Degen3 ; Degen4 ; Degen5 ; Degen6 . By decreasing from 1, we investigate break-up of harmony between DP and IP in both cases of tonic cortical input (3 Hz) in the resting state and phasic cortical input (10 Hz) in the phasically active state. In these cases, the IP becomes weakened, and thus becomes larger than normal ones. Consequently, involuntary jerky movement and abnormal hyperkinetic movement occur in the tonic and phasic cases, respectively. Next, we study treatment of HD through recovery of harmony between DP and IP. We strengthen the IP via activation of D2 SPNs and STN neurons and deactivation of GP neurons, based on optogenetics OG1 ; OG2 . Consequently, harmony between DP and IP becomes recovered, leading to normal movement. Finally, we also investigate the effect of loss of healthy synapses in the BG neurons on the HD.
III.1 Break-up of Harmony between DP and IP for the HD
In the early stage of HD, we consider the case of normal DA level of for the D1 and D2 SPNs. As explained in Sec. II.1, cortical inputs are modeled in terms of 1,000 independent Poisson spike trains with firing rate . We first consider the case of tonic cortical input with Hz in the resting state Hump1 ; CI1 ; CI2 ; CI3 ; CI4 ; CI5 ; Str2 ; CN6 ; CN14 .
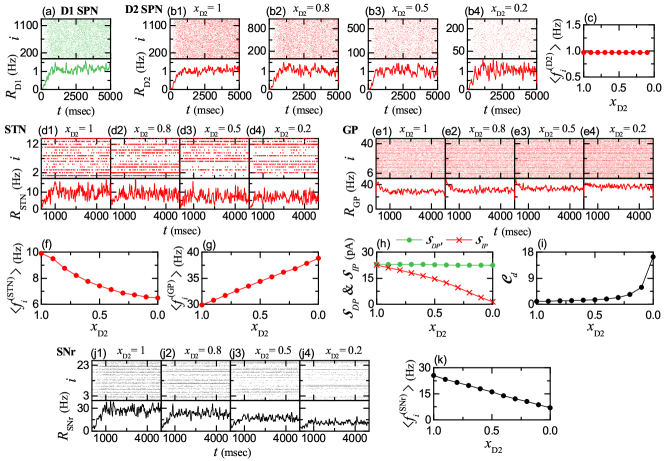
Population firing behavior of BG neurons could be well visualized in the raster plot of spikes, corresponding to a collection of spike trains of individual BG neurons. Figure 2(a) shows the raster plot of spikes for D1 SPNs, associated with DP (green color). In contrast to the case of D1 SPNs, degenerative loss of D2 SPNs occurs. With decreasing (i.e., fraction of number of D2 SPNs) from 1, we also get the raster plots of spikes of D2 SPNs [Figs. 2(b1)-2(b4)], the STN neurons [Figs. 2(d1)-2(d4)], and the GP neurons [Figs. 2(e1)-2(e4)], related to the IP (red color) for 1.0, 0.8, 0.5, and 0.2.
As a collective quantity showing population behaviors, we employ an IPSR (instantaneous population spike rate) which may be obtained from the raster plot of spikes IPSR1 ; IPSR2 ; IPSR3 ; IPSR4 ; IPSR5 . Each spike in the raster plot is convoluted with a kernel function to get a smooth estimate of IPSR Kernel :
| (19) |
Here, is the number of the neurons in the population, and and are the th spiking time and the total number of spikes for the th neuron, respectively. We use a Gaussian kernel function of band width :
| (20) |
where the band width of is 20 msec. The IPSRs for D1 (SPN), D2 (SPN), STN, GP, and SNr are also shown below their respective raster plots of spikes. Here, the case of corresponds to the normal one without degenerative loss of D2 SPNs. With decreasing from 1, the population firing activities of the D2 SPNs, the STN neurons, and the GP neurons, associated with IP (red), are changed, while that of the D1 SPN, related to DP (green), is unchanged.
We also study the population-averaged mean firing rate (MFR) of the neurons in the population [ D1 (SPN), D2 (SPN), STN, and GP]; is the MFR of the th neuron in the population, and represents a population average over all the neurons. For the D1 and D2 SPNs, Hz and Hz, independently of , because there is no change in cortical inputs to the D1/D2 SPNs; see Fig. 2(c) for the D2 SPNs. As is decreased from 1, of the GP neurons is increased from 29.9 to 38.8 Hz, due to decrease in inhibitory projection from the D2 SPNs, as shown in Fig. 2(g). In contrast, because of increased inhibitory projection from the GP, of the STN neurons is decreased from 9.9 to 6.5 Hz [see Fig. 2(f)].
We note that, there are two types of synaptic currents into the (output) SNr neurons, and , via DP (green) and IP (red) in Fig. 1, respectively. The DP current, is just the (inhibitory) synaptic current from the D1 SPNs to the SNr neurons:
| (21) |
There is no change in independently of .
The IP current, is composed of the excitatory component, and the inhibitory component,
| (22) |
Here, [] is just the synaptic current from the STN (GP) to the SNr:
| (23) |
Unlike the case of with decreasing from 1, becomes decreased due to decrease in and increase in (: absolute magnitude).
Firing activity of the (output) SNr neurons is determined through competition between (DP current) and (IP current) into the SNr. The strengths of DP and IP, and , are given by the magnitudes of their respective time-averaged synaptic currents:
| (24) |
where the overline denotes the time averaging and represents the absolute magnitude. Then, the competition degree between DP and IP (given by the ratio of to ) was introduced in KimPD :
| (25) |
For (without degenerative loss of D2 SPNs), = 23.1 and = 23.4, and hence DP and IP become nearly balanced (i.e., ). In this non-degenerative case, the SNr neurons fire very actively with Hz. Due to strong inhibitory projection from the SNr, the thalamic cells become silent, resulting in no movement (i.e., the BG door to the thalamus is locked in the normal tonic default state).
But, with decreasing from 1 (degenerative case), as shown in Fig. 2(h), is rapidly decreased from 23.4 to 1.4 , while there is no change in (= 23.1). In this way, IP for the HD becomes weakened. Thus, as is decreased from 1, the competition degree between DP and IP is found to increase from 0.99 to 16.5 [see Fig. 2(i)]. Thus, balance between DP and IP becomes broken up in the degenerative tonic case.
Figures 2(j1)-2(j4) show raster plots of spikes and IPSRs of the (output) SNr neurons for = 1.0, 0.8, 0.5, and 0.2, respectively. We note that, firing activity of the SNr neurons becomes reduced with decreasing because of weakened IP. As a result of decrease in (strength of IP), the population-averaged MFR is found to decrease from 25.5 to 6.9 Hz with decreasing from 1, as shown in Fig. 2(k). Thus, the BG gate to the thalamus becomes opened even in the case of tonic cortical input (3 Hz) in the resting state via break-up of balance between DP and IP. Consequently, a tonic pathological state with involuntary jerky movement occurs, in contrast to the tonic default state without movement.
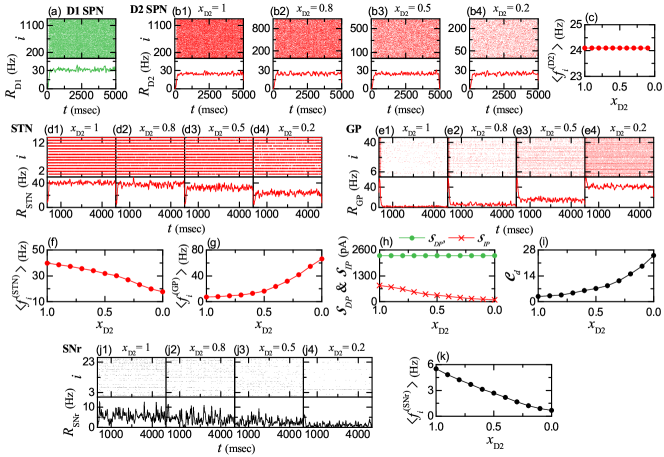
Next, we consider the case of phasic cortical input (10 Hz) in the phasically active state Hump1 ; CI1 ; CI2 ; CI3 ; CI4 ; CI5 ; Str2 ; CN6 ; CN14 , which is shown in Fig. 3. Population firing behavior of D1 SPNs, associated with DP (green color), is shown in their raster plot of spikes and the IPSR (t) in Fig. 3(a). In comparison to the tonic case with the population-averaged MFR = 1.03 Hz in Fig. 2(a), firing activity of the D1 SPNs become very active with = 30.7 Hz, independently of .
But, due to degenerative loss of D2 SPNs, population firing activities of the D2 SPNs, the STN neurons, and the GP neurons [related to the IP (red color)] are changed with decreasing , as shown in their raster plots of spikes and IPSRs in Fig. 3. The population-averaged MFRs of the D2 SPNs, the STN neurons, and the GP neurons are also shown in Figs. 3(c), 3(f), and 3(g), respectively. For the D2 SPNs, = 24.1 Hz [much larger than that (0.97 Hz) in the tonic case], independently of , because there is no change in cortical input to the D2 SPNs. As a result of decreased inhibitory projection from the D2 SPNs, of the GP neurons is rapidly increased from 7.3 to 66.1 Hz with decreasing from 1; the increasing rate is higher than the tonic case. On the other hand, due to increase in inhibitory projection from the GP, of the STN neurons decreases from 39.8 to 17.6 Hz; the decreasing rate is also larger than that in the tonic case.
We consider the case of without degeneration. In this non-degenerative case, = 2309.7 and = 815.6. Thus, the competition degree becomes [i.e., (strength of DP) is 2.82 times larger than (strength of IP)]. In this case, of the (output) SNr neurons are decreased to 5.5 Hz (cf., in the tonic case, 25.5 Hz). Consequently, the BG door to the thalamus becomes opened, leading to normal movement. This phasic healthy state with is in contrast to the tonic healthy state with resulting in no movement.
However, as is decreased from 1 (degenerative case), is rapidly decreased from 815.6 to 92.3 , while there is no change in (= 2309.7) [see Fig. 3(h)]. Thus, IP becomes rapidly weakened. Due to such under-activity of IP, the competition degree increases from 2.82 (healthy state) to 25.0, as shown in Fig. 3(i). Consequently, harmony between DP and IP becomes broken up in the degenerative case with , and then a phasic pathological state with abnormal hyperkinetic movement appears, in contrast to the phasic healthy state with normal movement.
Raster plots of spikes and IPSRs of the (output) SNr neurons for = 1.0, 0.8, 0.5, and 0.2 are shown in Figs. 3(j1)-3(j4), respectively. Due to under-activity of IP, firing activity of the SNr neurons becomes decreased with decreasing from 1. Due to decreased (strength of IP), the population-averaged MFR decreases from 5.5 (healthy state) to 0.7 Hz with decreasing from 1 [see Fig. 3(k)]. In this phasic pathological state with (where harmony between DP and IP is broken up), abnormal hyperkinetic movement disorder occurs, in contrast to the normal movement for the phasic healthy state with (where there is harmony between DP and IP).
To sum up the above results briefly, it is shown that, for the HD, pathological states (where harmony between DP and IP is broken up) appear due to degenerative loss of D2 SPNs in the cases of both tonic and phasic cortical inputs. On the other hand, for the PD, pathological states appear because of DA deficiency PD1 ; PD2 ; PD3 ; PD4 ; PD5 ; PD6 ; KimPD . In the case of HD, IP is under-active, in contrast to the case of PD with over-active IP. Thus, patients with HD exhibit abnormal hyperkinetic movement disorder, while patients with PD show abnormal hypokinetic movement disorder. Consequently, HD lies at one end of the spectrum of movement disorders in the BG, while PD lies at the other end.
III.2 Treatment of HD via Recovery of Harmony between DP and IP
For the pathological state in the HD, IP is under-active due to degenerative loss of D2 SPNs, in comparison to the healthy state. Thus, harmony between DP and IP is broken up (i.e. occurrence of disharmony between DP and IP), leading to abnormal hyperkinetic movement disorder. Here, we investigate treatment of the pathological state with enhanced competition degree (than the normal one for the healthy state) in both cases of tonic and phasic cortical inputs via recovery of harmony between DP and IP.
Activation and deactivation of the target neurons via optogenetics are studied in KimPD . When light-sensitive proteins (called the opsins) are activated through light stimulation, variation in the intrinsic ionic currents of the neurons in the target population , , takes place. If is positive (negative), firing activity of the target neurons is increased (decreased), leading to their activation (deactivation) OG1 ; OG2 . As discussed in KimPD , we simulate the effects of optogenetics by adding in Eq. (1), in addition to the current, , into the target population. With increasing the intensity of light stimulation, the magnitude of also increases.
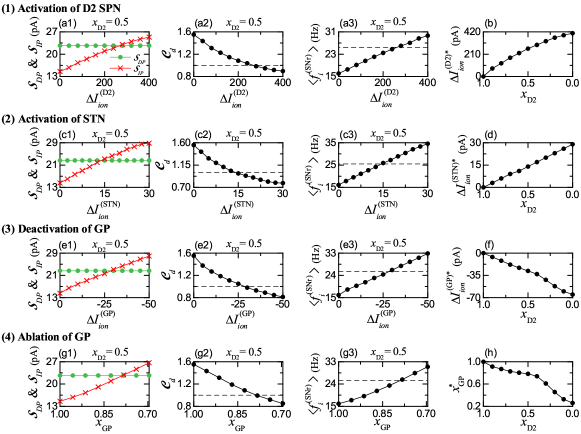
We first consider tonic pathological states with enhanced competition degree [larger than that (1) for the tonic healthy state (with balanced DP and IP)], occurring due to degenerative loss of D2 SPNs, in the case of tonic cortical input (3 Hz) (see Fig. 2). As an example, we consider the tonic pathological case of with . In this pathological case, IP is under-active in comparison to the tonic healthy case (with balanced DP and IP); firing activity of D2 SPNs is under-active, leading to over-activity of GP neurons, which then results in under-activity of the STN neurons. Hence, for recovery of balance between DP and IP, we try to strengthen the IP via activation of D2 SPNs and STN neurons and deactivation of GP neurons.
We first strengthen the IP through activation of the target (under-active) D2 SPNs. Figure 4(a1) shows plots of (strength of IP) and (strength of DP) versus . As is increased from 0, (red) increases from 15.1, while (green) remains unchanged (i.e., 23.1). As a result of increase in , the competition degree between DP and IP is found to decrease from 1.53 [Fig. 4(a2)]. Also, the population-averaged MFR of the output SNr neurons, , is found to increase from 16.1 Hz [Fig. 4(a3)].
We note that, as passes a threshold (= 262 pA), and (= 25.5 Hz); and are those for the tonic healthy state, and they are represented by the horizontal dashed lines in Figs. 4(a2) and 4(a3). Thus, for , the pathological state with may have (= 1.0) via activation of D2 SPNs for the threshold, (= 262 pA); DP and IP becomes balanced, as in the case of tonic healthy state. In this way, balance between DP and IP is recovered for = 262 pA. Figure 4(b) shows the plot of versus . As is decreased from 1, the threshold is increased; with decreasing , more is necessary for recovery of balance between DP and IP.
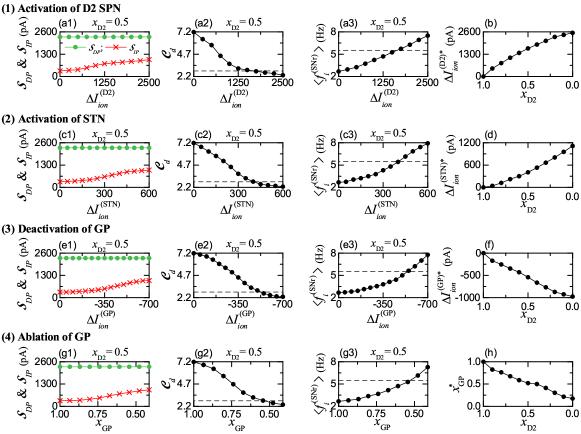
We also strengthen the IP via activation of the target (under-active) STN neurons, which is shown in Figs. 4(c1)-4(c3) for . All the behaviors are qualitatively the same as those in the case of activation of D2 SPNs. With increasing from 0, (strength of IP) increases, leading to decrease in the competition degree , and the population-averaged MFR of the output SNr neurons, , also increases. But, the threshold (= 14 pA), where balance between DP and IP is recovered (i.e., = 1 and = 25.5 Hz, as in the case of tonic healthy state), is smaller than that (262 pA) in the case of activation of D2 SPNs. The mono-synaptic effect of STN neurons on the output SNr neurons is more direct than the bi- or tri-synaptic effect of D2 SPNs, which could result in the smaller threshold in the case of STN neurons. Figure 4(d) shows the plot of versus . With decreasing from 1, the threshold increases, as shown in Fig. 4(d); As is decreased, more is necessary for recovery of balance between DP and IP.
Unlike the cases of activation of (under-active) D2 SPNs and STN neurons, IP may be strengthened via deactivation of (over-active) GP neurons; in the case of deactivation, is negative, in contrast to the case of activation with [ = D2 (SPN) and STN]. Figures 4(e1)- 4(e3) and 4(f) show the case of deactivation of GP neurons. As the magnitude of is increased (i.e., more negative), strength of IP, (red), is found to increase from 15.1, while (green) remains constant (= 23.1). Thus, when passing a threshold pA, balance between DP and IP becomes recovered (i.e., the competition degree becomes 1 and the population-averaged MFR of output SNr neurons becomes 25.5 Hz) [see Figs. 4(e2)- 4(e3)]. As shown in Fig. 4(f), with decreasing from 1, the threshold is decreased (i.e., its magnitude increases); as is decreased from 1, more negative is required for recovery of balance between DP and IP.
Instead of the above deactivation of GP neurons via optogenetics, we also consider ablation of (over-active) GP neurons in the pathological state for to reduce the over-activity of GP neurons. In the case of ablation, the number of GP neurons, , is reduced to (, where (= 46) is the normal number of GP neurons and is the fraction of number of GP neurons. As shown in Figs. 4(g1)- 4(g3) and 4(h), the effect of decreasing via ablation is similar to that of deactivation of GP neurons via optogenetics. As is decreased from 1, strength of IP, (red), is found to increase from 15.1 (i.e., IP becomes strengthened) [see Fig. 4(g1)]. When passing a threshold, , balance between DP and IP becomes recovered (i.e., = 1.0 and = 25.5 Hz), as shown in Figs. 4(g2)-4(g3). Figure 4(h) shows the plot of versus . With decreasing from 1, decreases; more ablation (i.e., smaller ) is necessary for balance between DP and IP.
Next, we consider phasic pathological states with enhanced competition degree [larger than that (2.82) for the phasic healthy state (with harmony between DP and IP)], occurring due to degenerative loss of D2 SPNs, in the case of phasic cortical input (10 Hz) (see Fig. 3). As an example, we consider the pathological case of with . In this phasic pathological case, IP is under-active in comparison to the case of phasic healthy state. For the phasic healthy state with = 2.82 (i.e., harmony between DP and IP), the population-averaged MFR of output STr neurons, is much reduced to 5.5 Hz, leading to normal movement, in contrast to the case of tonic healthy state with and = 25.5 Hz without movement. As in the above tonic pathological state, firing activity of D2 SPNs is under-active, resulting in over-activity of GP neurons, which then leads to under-activity of the STN neurons. Hence, for recovery of harmony between DP and IP, we strengthen the IP through activation of D2 SPNs and STN neurons and deactivation of GP neurons by employing optogenetic technique and via ablation of GP neurons.
Figure 5 shows treatment of phasic pathological state for with ; (1) activation of D2 SPNs, (2) activation of STN neurons, (3) deactivation of GP neurons, and (4) ablation of GP neurons. The overall results of these treatments are qualitatively the same as those in the above case of tonic pathological state in Fig. 4. Only the corresponding thresholds are quantitatively different; (1) = 1,636 pA, (2) = 405 pA, (3) pA, and (4) . When passing a threshold for each treatment, harmony between DP and IP becomes recovered (i.e., = 2.82 and = 5.5 Hz), resulting in normal movement. Finally, we note that, with decreasing , the thresholds, and , for activations of D2 SPNs and STN neurons are increased (i.e., more positive), and the threshold, for deactivation of GP neurons becomes more negative, as shown in Figs. 5(b), 5(d), and 5(f). Thus, as is decreased, more light stimulation for activation and deactivation is necessary for recovery of harmony between DP and IP. Also, in the case of ablation of GP neurons, with decreasing , more ablation is required to get harmony between DP and IP.
III.3 Effect of Loss of Healthy Synapses on The HD
In the HD, loss of healthy synapses occurs not only in the striatum, but also in other regions of the BG, including STN, GP, and SNr Loss1 ; Loss2 ; Loss3 ; Loss4 ; Loss5 ; Loss6 . Such loss of synapses in the BG neurons is an important feature of HD, and it is thought to contribute to the motor and cognitive symptoms of the disease. Here, we study effect of loss of healthy synapses of all the BG neurons on HD.
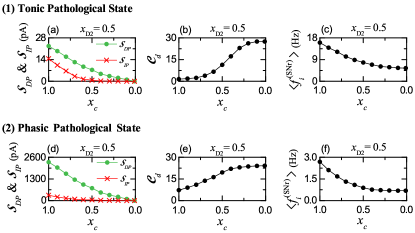
As examples, we consider pathological states for = 0.5 in both cases of tonic (3 Hz) and phasic (10 Hz) cortical inputs. Loss of synapses in the BG neurons is modeled in terms of decreased synaptic connection probability, ; is the normal synaptic connection probability (depending on the type of BG neurons and given in the subsection II.1) and represents the fraction in ().
We first consider a tonic pathological state in Figs. 6(a)-6(c). As a result of loss of synapses, decreased cortical inputs into D1 SPNs leads to reduction in their firing activity . Then, strength of DP, , becomes decreased. As shown in Fig. 6(a), (green color) is found to monotonically decrease from 23.1 with decreasing from 1. Also, due to reduced cortical synaptic inputs into D2 SPNs, firing activity of D2 SPNs, , becomes decreased, leading to increased firing activity of GP neurons (), which then results in decrease in the firing activity of STN neurons (). Consequently, strength of IP, , becomes decreased. In this case of IP, with decreasing from 1, (red color) is found to more rapidly decrease from 15.1 than the case of DP. Then, the competition between DP and IP increases rapidly from 1.53 with decreasing from 1 [see Fig. 6(b)]. Thus, as is decreased from 1, population-averaged MFR of the output SNr neurons () decreases from 16.1 Hz. In this way, with decreasing , the degree of disharmony between DP and IP becomes increased, resulting in more severe involuntary jerky movement in the tonic pathological case.
Next, we consider a phasic pathological state in Figs. 6(d)-6(f). With decreasing , tendency in the phasic pathological case is qualitatively the same as that in the above tonic pathological case. Based on the same reasoning given in the tonic pathological case, as is decreased from 1, strength of IP (; red color) is found to decreases much more rapidly than strength of DP (; green color), as shown in Fig. 5(d). Then, the competition degree increases from 7.19 with decreasing from 1 [see Fig. 5(e)]. Consequently, firing activity of the output SNr neurons () decreases from 2.7 Hz with , as shown in Fig. 5(f). In this way, as is decreased from 1, the broken-up degree of harmony between DP and IP becomes increased, leading to more severe abnormal hyperkinetic movement disorder in the phasic pathological case.
Overall, in both tonic and phasic pathological cases, as a result of loss of healthy synapses in the BG neurons, symptoms of the HD become more severe with decreasing , because the disharmony degree between DP and IP becomes increased.
IV Summary and Discussion
The BG exhibit a variety of functions for motor, cognition, and emotion. Dysfunction in the BG is associated with movement disorder (e.g., HD and PD) and cognitive and psychiatric disorders. There are two competing pathways in the BG, DP (facilitating movement) and IP (suppressing movement) DIP1 ; DIP2 ; DIP3 ; DIP4 . In our recent work KimPD , as a first time, we made quantitative analysis of competitive harmony between DP and IP in the default tonic state and the phasic healthy and pathological states by introducing their competition degree, between DP and IP, given by the ratio of strength of DP ( to strength of IP ( (i.e., ).
In the case of normal DA level. a healthy state with normal movement was found to appear, while in the case of lower DA level, a pathological state (PD) with reduced competition degree was found to occur. In PD, DP is under-active, while IP is over-active, resulting in abnormal hypokinetic movement.
In this paper, we are concerned in the HD which is a genetic neurodegenerative disease. As a result of mutant HTT gene, toxic HTT protein aggregates appear, causing the characteristic neurodegeneration seen in HD. We considered degenerative loss of D2 SPNs in the case of normal DA level. By decreasing (i.e. fraction of number of D2 SPNs) from 1, we quantitatively analyzed break-up of harmony between DP and IP. IP was found to be under-active (i.e., weakened), in contrast to the case of PD with over-active IP. Thus, the competition degree becomes increased than normal one. Consequently, abnormal hyperkinetic movement such as chorea occurs, in contrast to the case of PD with hypokinetic disorder.
Unfortunately, at present there is no cure for HD. The available treatments for HD primarily aim to control and alleviate its symptoms, resulting from weakened IP: medication treatment Treat1 ; Treat2 ; Treat3 ; Treat4 , reducing symptoms, deep brain stimulation in research and clinical trials Treat5 ; Treat6 ; Treat7 , and experimental surgery Treat8 . We studied treatment of HD via recovery of harmony between DP and IP by activating D2 SPNs and STN neurons and deactivating GP neurons, based on optogenetics OG1 ; OG2 . Through the treatment process, the IP becomes strengthened, and thus harmony between DP and IP may be regained. We also studied effects of loss of healthy synapses of the BG cells on the HD. As a result of such synaptic loss, the HD status was found to become more severe.
Finally, we discuss limitations of our present work and future works. In the present work, we considered early stage of HD where degenerative loss of D2 SPNs occurs in the nearly normal DA level. But, in the late stage of HD, degenerative loss of D1 SPN also occurs along with decrease in DA level, leading to hypokinetic disorder (e.g., rigidity and bradykinesia) due to weakened DP, as in the case of PD Dege-D1 . Moreover, in addition to deaths of D1/D2 SPNs, degeneration of cortical pyramidal cells occurs Dege-C1 ; Dege-C2 . Hence, as a future work, it would be interesting to investigate consequences of degeneration of D1 SPNs and cortical pyramidal cells, in addition to degenerative loss of D2 SPNs.
Next, we would like to consider more realistic striatal circuit in the BG. In our present striatal circuit, we considered only the D1/D2 SPNs (95 major population). But, the minor population of fast interneurons (FSIs) in the striatum are known to exert strong effects on firing activities of the D1/D2 SPNs Str2 ; FSI . Hence, in future, it would be worth while to contain the FSIs in our BG SNN. In our present BG SNN, cortical inputs were modelled by Poisson spike trains. Such SNN could be extended to the cortico-BG-thalamo-cortical (CBGTC) loop by including the cortical and the thalamic neurons for more complete computational work CN1 ; CBGTC .
We also make discussion on application of the optogenetics to human patients for treatment of a pathological state OG3 ; OG4 . In the case of HD, harmony between DP and IP is broken up due to under-active IP. As shown in Sec. III.2, harmony between DP and IP could be recovered by strengthening IP. To this end, optogenetic techniques may be employed. Activation of D2 SPNs and STN neurons via optogenetics results in strengthening IP. We hope that, in near future, safe clinical applications of optogenetics to human patients with HD could be successfully available via collaboration of researchers and clinicians. Then, it would take a substantial step forward for treatment of HD.
Acknowledgments
This research was supported by the Basic Science Research Program through the National Research Foundation of Korea (NRF) funded by the Ministry of Education (Grant No. 20162007688).
References
- (1) L. Luo, Principles of Neurobiology (Garland Science, New York, 2016).
- (2) E. R. Kandel, J. H. Schwartz, and T. M. Jessell, Principles of Neural Science (McGraw-Hill, New York, 1991).
- (3) L. R. Squire, F. E. Bloom, S. K. McConnell, J. L. Roberts, N. C. Spitzer, and M. J. Zigmond, Fundamental Neuroscience (Academic Press, New York, 2003).
- (4) M. F. Bear, B. M. Connors, and M. A. Paradiso, Neuroscience: Exploring the Brain (Lippincott Williams Wikins, Philadelphia, 2007).
- (5) K. Gurney, T. J. Prescott, and P. Redgrave, Biol. Cybern. 84, 401 (2001).
- (6) K. Gurney, T. J. Prescott, and P. Redgrave, Biol. Cybern. 84, 411 (2001).
- (7) M. D. Humphries, R. D. Stewart, and K. N. Gurney, J. Neurosci. 26, 12921 (2006).
- (8) M. D. Humphries, “Basal ganglia: Mechanisms for action selection,” in Encyclopedia of Computation Neuroscience (Springer, New York, 2014).
- (9) M. D. Humphries and K. Gurney, Biol. Cybern. 115, 323 (2021).
- (10) A. Mandali, M. Rengaswamy, V. S. Chakravarthy, and A. A. Moustafa, Front. Neurosci. 9, 191 (2015).
- (11) G. P. Bates, R. Dorsey, J. F. Gusella, M. R. Hayden, C. Kay, B. R. Leavitt, M. Nance, C. A. Ross, R. I. Scahill, R. Wetzel, E. J. Wild, and S. J. Tabrizi, Nat. Rev. Dis. Primers 1, 15005 (2015).
- (12) C. A Ross and S. J. Tabrizi, Lancet Neurol. 10, 83 (2011).
- (13) J. S. Paulsen, J. D. Long, H. J. Johnson, E. H. Aylward, C. A. Ross, J. K. Williams, M. A. Nance, C. J. Erwin, H. J. Westervelt, D. L. Harrington, H. J. Bockholt, Y. Zhang, E. A. McCusker, E. M. Chiu, and P. K. Panegyres; PREDICT-HD Investigators and Coordinators of the Huntington Study Group, Front. Aging Neurosci. 6, 78 (2014).
- (14) F. O. Walker, Lancet 369, 218 (2007).
- (15) M. E. MacDonald, C. M. Ambrose, M. P. Duyao, R. H. Myers, C. Lin, L. Srinidhi, G. Barnes, S. A. Taylor, M. James, N. Groot, H. MacFarlane, B. Jenkins, M. A. Anderson, N. S. Wexler, J. F. Gusella, G. P. Bates, S. Baxendale, H. Hummerich, S. Kirby, M. North, S. Youngman, R. Mott, G. Zehetner, Z. Sedlacek, A. Poustka, A. M. Frischauf, H. Lehrach, A. J. Buckler, D. Church, L. Doucettestamm, M. C. Odonovan, W. Riba-rodriguez, M. Shah, V. P. Stanton, S. A. Strobel, K. M. Draths, J. L. Wales, P. Dervan, D. E. Housman, M. Altherr, R. Shiang, L. Thompson, T. Fielder, and J. J. Wasmuth, Cell 72, 971 (1993).
- (16) N. G. Rojas, M. E. Cesarini, G. Peker, G. A. Da Prat, J. L. Etcheverry, and E. Gatto, J. Neurol. Res. 12, 93 (2022).
- (17) G. P. Bates, Nat. Rev. Genet. 6, 766 (2005).
- (18) M. J. Armstrong and M. S. Okun, JAMA 323. 548 (2020).
- (19) B. L. B. Marino, L. R. de Souza, K. P. A. Sousa, J. V. Ferreira, E. C. Padilha, C. H. T. P. da Silva, C. A. Taft and L. I. S. Hage-Melim, Mini. Rev. Med. Chem. 20, 754 (2020).
- (20) J. Guridi, R. González-Redondo, and J. A. Obeso, Parkinsons Dis., 943159 (2012).
- (21) M. D. Humphries, J. A. Obeso, and J. A. Dreyer, J. Neurol. Neurosurg. Psychiatry 89, 1181 (2018).
- (22) J. A. Obeso, M. Rodriguez-Oroz, C. Marın, P. Alonso, I. Zamarbide, J. L. Lanciego, and M. Rodriguez-Diaz, Neurology 62, S17 (2004).
- (23) J. A. Obeso, C. Marin, C. Rodriguez-Oroz, J. Blesa, B. Benitez-Temiño, J. Mena-Segovia, M. Rodríguez, and C. W. Olanow, Ann. Neurol. 64, S30 (008).
- (24) J. F. Gusella, N. S. Wexler, P. M. Conneally, S. L. Naylor, M. A. Anderson, R. E. Tanzi, P. C. Watkins, K. Ottina, M. R. Wallace, A. Y. Sakaguchi, A. B. Young, I. Shoulson, E. Bonilla, and J. B. Martin, Nature 306, 234 (1983).
- (25) M. E. MacDonald, C. M. Ambrose, M. P. Duyao, R. H. Myers, C. Lin, L. Srinidhi, G. Barnes, S. A. Taylor, M. James, N. Groat, H. MacFarlane, B. Jenkins, M. A. Anderson, N. S. Wexler, J. F. Gusella. G. P. Bates, S. Baxendale, H. Hummerich, S. Kirby, M. North, S. Youngman, R. Mott, G. Zehetner, Z. Sedlacek, A. Poustka, A.-M. Frischauf, H. Lehrach, A. J. Buckler, D. Church, L. Doucette-Stamm, M. C. O’Donovan, L. Riba-Ramirer, M. Shah, V. P. Stanton, S. A. Strobe, K. M. Draths, J. L. Wales, P. Dervan, D. E. Housman, M. Altherr, R. Shiang, L. Thompson, T. Fielder, J. J. Wasmuth, D. Tagle, J. Valdes, L. Elmer, M. Allard, L. Castilla, M. Swaroop, K. Blanchard, and F. S. Collins, R. Snell, T. Holloway, K. Gillespie, N. Datson, D. Shaw, and P. S. Harper; The Huntington’s Disease Collaborative Research Group, Cell 72, 971 (1993).
- (26) S.-Y. Kim and W. Lim, “Ying-yang competitive harmony between direct and indirect pathways in a spiking neural network of the basal ganglia,” (2023). bioRxiv doi: https://doi.org/10.1101/2023.09.19.558549.
- (27) A.R. Sadek, P. J. Magill, and J. P. Bolam, J. Neurosci. 27, 6352 (2007).
- (28) P. Mailly, S. Charpier, A. Menetrey, and J. M. Deniau, J. Neurosci. 23, 5247 (2003).
- (29) D. E. Oorschot, J Comp. Neurol. 366, 580 (1996).
- (30) I. Bar-Gad, G. Morris, and H. Bergman, Prog. Neurobiol. 71, 439 (2003).
- (31) T. S. Gertler, C. S. Chan, and D. J. Surmeier, J. Neurosci, 28, 10814 (2008).
- (32) J. Moyer, J. A. Wolf, and L. H. Finkel, J Neurophysiol. 98, 3731 (2007).
- (33) J. A. Wolf, J. T. Moyer, M. T. Lazarewicz, D. Contreras, M. Benoit-Marand, P. O’Donnell, and L. H. Finkel, J. Neurosci. 25, 9080 (2005).
- (34) N. E. Hallworth, C. J. Wilson, and M. D. Bevan, J. Neurosci. 23, (2003).
- (35) J. Bugaysen, M. Bronfeld, H. Tischler, I. Bar-Gad, and A. Korngreen, PLoS One 5, e12001 (2010).
- (36) C. Richards, T. Shiroyama, and S. Kitai, Neurosci. 80, 545 (1997).
- (37) M. D. Bevan and C. J. Wilson, J. Neurosci. 19, 7617 (1999).
- (38) M. D. Bevan, C. J. Wilson, J. P. Bolam, and P. J. Magill, J. Neurophysiol. 83, 3169 (2000).
- (39) M. D. Bevan, P. J. Magill, N. E. Hallworth, J. P. Bolam, and C. J. Wilson, J. Nuerophysiol. 87, 1348 (2002).
- (40) J. L. Góngora-Alfaro, S. Hernández-López, J. Flores-Hernández, and E. Galarraga, Neurosci. Res. 29, 225 (1997).
- (41) X. Liu, Q. Zhang, Y. Wang, and F. Chen, J. Shanghai Jiaotong Univ. (Sci.) 27, 505 (2022).
- (42) J. Baufreton, J. F. Atherton, D.J. Surmeier, and M. D. Bevan, J. Neurosci. 25, 8505 (2005).
- (43) W. M. Connelly, J. M. Schulz, G. Lees, and J. N. Reynolds, J. Neurosci. 30, 14854 (2010).
- (44) K. Fujimoto and H. Kita, Brain Res. 609, 185 (1993).
- (45) K.-Z. Shen and S. W. Johnson, J. Physiol. 573, 697 (2006).
- (46) R. Ammari, B. Bioulac, L. Garcia, and C. Hammond, Front. Syst. Neurosci. 5, 43 (2011).
- (47) H. Nakanishi, H. Kita, and S. T. Kitai, Brain Res. 527, 81 (1990).
- (48) M. R. Park, W. M. Falls, and S. T. Kitai, J. Comp. Neurol. 211, 284 (1982).
- (49) P. Dayan, L. F. Abbott, Theoretical Neuroscience (MIT, Cambridge, 2001).
- (50) T. Götz, U. Kraushaar, J. Geiger, J. Lübke, T. Berger, P. Jonas, J. Neurosci. 17, 204 (1997).
- (51) J. P. Bolam, H. Bergman, A. M. Graybiel, M. Kimura, D. Plenz, H. S. Seung, D. J. Surmeier, and J. R. Wickens, “Microcircuits in the striatum,” in S. Grillner and A. M. Graybiel (eds.), Microcircuits: The Interface Between Neurons and Global Brain Function (MIT Press, Cambridge, 2006) pp. 165–190.
- (52) M. D. Humphries. R. Wood, and K. Gurney, Neural Netw. 22, 1174 (2009).
- (53) M. D. Humphries. N. Lepora, R. Wood, and K. Gurney, Front. Comput. Neurosci. 3, 26 (2009).
- (54) A. Tomkins, E. Vasilaki, C. Beste, K. Gurney, and M. D. Humphries, Front. Comput. Neurosci. 7, 192 (2014).
- (55) Z. Fountas and M. Shanahan, PLoS ONE 12, e0189109 (2017).
- (56) I. Han, Y. M. You, J. H. Kordower, S. T. Brady, and G. A. Morfini, J. Neurochem. 113, 1073 (2010).
- (57) A. Reiner, R. L. Albin, K. D. Anderson, C. J. D’Amato, J. B. Penney, and A. B. Young, Proc. Natl. Acad. Sci. U S A. 85, 5733 (1988).
- (58) R. L. Albin, A. Reiner, K. D. Anderson, L. S. Dure, B. Handelin, R. Balfour, W. O. Whetsell Jr, J. B. Penney, and A. B. Young, Ann. Neurol. 31, 425 (1992).
- (59) E. K. Richfield, K. A. Maguire-Zeiss, H. E. Vonkeman, and P. Voorn, Ann. Neurol. 38, 852 (1995).
- (60) R. L. Albin, A. B. Young, and J. B. Penne, Trends Neurosci. 12, 366 (1989).
- (61) G. E. Alexander and M. D. Crutcher, Trends Neurosci. 13, 266 (1990).
- (62) M. R. DeLong, Trends Neurosci. 13, 281 (1990).
- (63) A. V. Kravitz, B. S. Freeze, P. R. L. Parker, K. Kay, M. T. Thwin, K. Deisseroth, and A. C. Kreitzer, Nature 466, 622 (2010).
- (64) M. J. Frank, L. C. Seeberger, and R. C. O’Reilly, Science 306, 1940 (2004).
- (65) M. J. Frank, J. Cogn. Neurosci. 17, 51 (2005).
- (66) E. M. Navarro-López, U. Celikok, and N. S. Sengör, Cogn. Neurodyn. 15, 693 (2021).
- (67) E. M. Navarro-López, U. Celikok, and N. S. Sengör, “Chapter 9 - Hybrid systems neuroscience,” in A. E. Hady (ed.) Closed Loop Neuroscience (Elsevier, London, 2016) pp. 113-129.
- (68) U. Celikok, E. M. Navarro-López, and N. S. Sengör (2016) arXiv:1601.07740.
- (69) U. Celikok and N. S. Sengör, Conference paper in the International Conference on Artificial Neural Networks (2016).
- (70) Y. Cakir, J. Cogn. Syst. 4, 38 (2019).
- (71) Z. Fountas and M. Shanahan, International Joint Conference on Neural Networks (IJCNN) 1 (2014).
- (72) Z. Fountas and M. Shanahan, (2017) BioRxiv DOI:10.1101/197129.
- (73) Z. Fountas and M. Shanahan, International Joint Conference on Neural Networks (IJCNN), 2407 (2014).
- (74) Z. Fountas, Action Selection in The Rhythmic Brain: The Role of The Basal Ganglia and Tremor (2016) PhD thesis.
- (75) M. D. Mark, R. Wood, and K. Gurney, PLoS Comput. Biol. 6, e1001011 (2010).
- (76) M. D. Humphries, J. A. Obeso, and J. K. Dreyer, J. Neurol. Neurosurg. Psychiatry 89, 1181 (2018).
- (77) M. J. Frank, B. Loughry, and R. C. O’Reilly, Cogn. Affect Behav. Neurosci. 1, 137 (2001).
- (78) M. Lindahl, I. K. Sarvestani, O. Ekeberg, and J. H. Kotaleski, Front. Comput. Neurosci. 7, 76 (2013).
- (79) M. Lindahl and J. H. Kotaleski, eNeuro 3, e0156-16 (2016).
- (80) K. P. Michmizos, K. S. Nikita, “Local field potential driven Izhikevich model predicts a subthalamic nucleus neuron activity,” in: Engineering in Medicine and Biology Society, EMBC, 2011 Annual International Conference of the IEEE (IEEE, 2011). p. 5900-5903.
- (81) B. Sen-Bhattacharya, S. James, O. Rhodes, I. Sugiarto, A. Rowley, A, B. Stokes, K. Gurney, and S. B. Furber, IEEE Trans. Cogn. Develop. Syst. 10, 823 (2018).
- (82) K. Kumaravelu, D. T. Brocker, and W. M. Grill, J. Comput. Neurosci. 40, 207 (2016).
- (83) C. M. Thibeault and N. Srinivasa, Front. Comput. Neurosci. 7, 88 (2013).
- (84) J. E. Rubin, Curr. Opin. Neurobiol. 46, 127 (2017).
- (85) D. S. Andres and O. Darbin, J. Neuropsychiatry Clin. Neurosci. 30, 101 (2018).
- (86) O. Maith, F. V. Escudero, H. Ü. Dinkelbach, J. Baladron, A. Horn, F. Irmen, A. A. Kühn, and F. H. Hamker, Eur. J. Neurosci. 53, 2278 (2021).
- (87) Á. González-Redondo, F. Naveros, E. Ros, and J. A. Garrido, Int. J. Neural Syst. 30, 2050057 (2020).
- (88) J. W. Goodliffe, H. Song, A. Rubakovic, W. Chang, M. Medalla, C. M. Weaver, and J. I. Lübke, PLOS ONE 13, e0200626 (2018).
- (89) G. Mulcahy, B. Atwood, and A. Kuznetsov, PLOS ONE 15, e0228081 (2020).
- (90) A. R. Crossman, Neurosci. 21, 1 (1987).
- (91) A. R. Crossman, I. J. Mitchell, M. A. Sambrook, and A. Jackson. Brain 111, 1211 (1988).
- (92) A. V. Kravitz, B. S. Freeze, P. R. L. Parker, K. Kay, M. T. Thwin, K. Deisseroth, and A. C. Kreitzer, Nature 466, 622 (2010).
- (93) F. Tecuapetla, S. Matias, G. P. Dugue, Z. F. Mainen, and R. M. Costa, Nat. Commun. 5, 4315 (2014).
- (94) G. J. Klapstein, R. S. Fisher, H. Zanjani, C. Cepeda, E. S. Jokel, M. F. Chesselet, and M. S. Levine, J. Neurophysiol. 86, 2667 (2001).
- (95) A. Reiner, R. L. Albin, K. D. Anderson, C. J. D’Amato, J. B. Penney, and A. B. Young, Proc. Natl. Acad. Sci. U S A. 85, 5733 (1988).
- (96) A. J. Milnerwood and L. A. Raymond, Trends Neurosci. 33, 513 (2010).
- (97) J. L. Plotkin, and D. J. Surmeier, Curr. Opin. Neurobiol. 33, 53 (2015).
- (98) C. Cepeda, N. Wu, V. M. André, D. M. Cummings, and M. S. Levine, Prog. Neurobiol. 81, 253 (2007).
- (99) A. J. Milnerwood, C. M. Gladding, M. A. Pouladi, A. M. Kaufman, R. M. Hines, J. D. Boyd, R. W. Ko, O. C. Vasuta, R. K. Graham, M. R. Hayden, T. H. Murphy, and L. A. Raymond, Neuron 65, 178 (2010).
- (100) R. S. Turner and M. R. DeLong, J. Neurosci. 20, 7096 (2000).
- (101) E. Bauswein, C. Fromm, and A. Preuss, Brain Res. 493, 198 (1989).
- (102) J. E. Belforte, V. Zsiros, E. R. Sklar, Z. Jiang, G. Yu, Y. Li, E. M. Quinlan, and K. Nakazawa, Nat. Neurosci. 13, 76 (2010).
- (103) J. L. Reed, H. Z. Qi, Z. Zhou, M. R. Bernard, M. J. Burish, A. Bonds, and J. H. Kaas, J. Neurophysiol. 103, 2139 (2010).
- (104) T. Zheng and C. J. Wilson, J. Neurophysiol. 87, 1007 (2002).
- (105) E. M. Izhikevich, IEEE Trans. Neural. Netw. 14, 1569 (2003).
- (106) E. M. Izhikevich, IEEE Trans. Neural Netw. 15, 1063 (2004).
- (107) E. M. Izhikevich, Dynamical Systems in Neuroscience: The Geometry of Excitability and Bursting (MIT Press, Cambridge, 2007).
- (108) E. M. Izhikevich, Cereb. Cortex 17, 2443 (2007).
- (109) S.-Y. Kim and W. Lim, Cogn. Neurodyn. 14, 535 (2020).
- (110) S.-Y. Kim and W. Lim, Neural Netw. 106, 50 (2018).
- (111) S.-Y. Kim and W. Lim, Neural Netw. 97, 92 (2018).
- (112) S.-Y. Kim and W. Lim, Neural Netw. 134, 173 (2021).
- (113) S.-Y. Kim and W. Lim, Cogn. Neurodyn. 15, 1067 (2021).
- (114) S.-Y. Kim and W. Lim, Phys. Rev. E 105, 014418 (2022)
- (115) S.-Y. Kim and W. Lim, Cogn. Neurodyn. 16, 643 (2022).
- (116) S.-Y. Kim and W. Lim, Cogn. Heurodyn. 16, 1427 (2022).
- (117) S.-Y. Kim and W. Lim, Cogn. Neurodyn. DOI: 10.1007/s11571-023-09985-5 (2023).
- (118) C. E. Jahr and C. F. Stevens, J. Neurosci. 10, 3178 (1990).
- (119) X. J. Wang, Physiol. Rev. 90, 1195 (2010).
- (120) N. Brunel and X. J. Wang, J Neurophysiol. 90, 415 (2003).
- (121) C. Geisler, N. Brunel, and X. J. Wang, J. Neurophysiol. 94, 4344 (2005).
- (122) N. Brunel and V. Hakim, Chaos 18, 015113 (2008).
- (123) S.-Y. Kim and W. Lim W, J. Neurosci. Meth. 226, 161 (2014).
- (124) H. Shimazaki and S. Shinomoto, J. Comput. Neurosci. 29, 171 (2010).
- (125) A. C. Bachoud-Lévi, J. Ferreira, R. Massart, K. Youssov, A. Rosser, M. Busse, D. Craufurd, R. Reilmann, G. D. Michele, D. Rae, F. Squitieri, K. Seppi, C. Perrine, C. Scherer-Gagou, O. Audrey, C. Verny, and J.-M. Burgunder, Front. Neurol. 10, 710 (2019).
- (126) D. Luis-Ravelo, H. Estévez-Silva, P. Barroso-Chinea, D. Afonso-Oramas, J. Salas-Hern’andez, J. Rodríguez-Núñez, A. Acevedo-Arozena, D. Marcellino, T. González-Hernández, Exp. Neurol. 299, 137 (2018).
- (127) M. R. Hayden, B. R. Leavitt, U. Yasothan, and P. Kirkpatrick, Nat. Rev. Drug Discov. 8, 17 (2009).
- (128) H. Bashir and J. Jakovic, Expert Rev. Neurother. 18, 51 (2018).
- (129) S. J. Nagel, A. G. Machado, John T. Gale, D. A. Lobel, and M. Pandya, Front. Syst. Neurosci. 9, 32 (2015).
- (130) M. Sharma and M. Deogaonkar, J. Clin. Neurosci. 22, 812 (2015).
- (131) L. Wojtecki, S. J. Groiss, C. J. Hartmann, S. Elben, S. Omlor, A. Schnitzler, and J. Vesper, Brain Sci. 6, 38 (2016).
- (132) J. Demeestere and W. Vandenberghe, CNS Nuerosci. Ther. 17, 705 (2011).
- (133) A. Berardelli, J. Noth, P. D. Thompson, E. L. Bollen, A. Curra, G. Deuschl, J. G. van Dijk, R. Topper, M. Schwarz, and R. A. Roos, Mov. Disord. 14, 398 (1999).
- (134) M. Cudkowicz and N. W. Kowall, Ann. Neurol. 27, 200 (1990).
- (135) J. C. Hedreen, C. E. Peyser, S. E. Folstein, and C. A. Ross, Neurosci. Lett. 133, 257 (1991).
- (136) T. Koos and J. M. Tepper, Nature Neurosci. 2, 467 (1999).
- (137) S. Narayanan, Neurocomput. 52–54, 605 (2003).
- (138) A. H. Gittis and E. A. Yttri, Curr. Opin. Biomed. Eng. 8, 14 (2018).
- (139) Y. Shen, R. E. Campbell, D. C. Côté and M.-E. Paquet, Front. Neural Circuits 14, article 41 (2020).