The Impact of Patchy Reionization on Ultra-faint Dwarf Galaxies
Abstract
We investigate how patchy reionization affects the star formation history (SFH) and stellar metallicity of ultra-faint dwarf galaxies (UFDs). Patchy reionization refers to varying ultraviolet (UV) background strengths depending on a galaxy’s environment. Recent observations highlight the significance of this effect on UFDs, as UFDs can have different SFHs depending on their relative position with respect to their host halo during the period of reionization. However, most cosmological hydrodynamic simulations do not consider environmental factors such as patchy reionization, and the effect of reionization is typically applied homogeneously. Using a novel approach to implement patchy reionization, we show how SFHs of simulated UFDs can change. Our cosmological hydrodynamic zoom-in simulations focus on UFD analogs with , at . We find that patchy reionization can weaken the effect of reionization by two orders of magnitude up to , enabling late star formation in half of the simulated UFDs, with quenching times 460 Myr later than those with homogeneous reionization. We also show that halo merger and mass assembly can affect the SFHs of simulated UFDs, in addition to patchy reionization. The average stellar iron-to-hydrogen ratio, [Fe/H], of the simulated UFDs with patchy reionization increases by 0.22-0.42 dex. Finally, our findings suggest that patchy reionization could be responsible for the extended SFHs of Magellanic UFDs compared to non-Magellanic UFDs.
1 Introduction
In the context of hierarchical CDM models of structure formation, where small galaxies are expected to form first and progressively grow into massive ones, it is essential to understand the formation and evolution of low-mass galaxies to obtain a comprehensive understanding of galaxy formation (e.g., Padmanabhan, 1993). Ultra-faint dwarf galaxies (UFDs), which are known as the smallest unit of galaxies with the lowest luminosity () and stellar mass () in the universe, have been considered as the fundamental building blocks of massive galaxies (reviewed in Simon, 2019, also see Tolstoy et al., 2009; McConnachie, 2012). Additionally, due to their shallow potential wells, UFD systems are highly vulnerable to internal and external feedback effects, making them an excellent laboratory for studying how feedback mechanisms change star formation activities in small systems (e.g., Stinson et al., 2007; Sawala et al., 2010; Simpson et al., 2013; Agertz & Kravtsov, 2015; Jeon et al., 2017; Wheeler et al., 2019; Agertz et al., 2020; Rey et al., 2020; Gutcke et al., 2022; Sanati et al., 2023).
The star formation histories (SFHs) of UFDs are generally governed by physical processes such as photoionization heating from stars, supernova feedback (SNe), which releases energy when stars die, and global heating caused by cosmic reionization. Interestingly, a common trait observed in the SFHs of UFD galaxies is that they likely formed the majority of their stars (about 80%) prior to the onset of reionization, which is followed by a suppression of their star formation. (e.g., Brown et al., 2014; Weisz et al., 2014). This implies that reionization played a crucial role globally in quenching the star formation of UFD galaxies, along with SN feedback, which dissipates dense gas that is eligible for star formation. Without SN feedback, SFHs of the UFDs can extend to as late as , otherwise, they are truncated at an early stage around (e.g., Simpson et al., 2013; Jeon et al., 2017). However, despite the importance of cosmic reionization in shaping UFD SFHs, current implementations of reionization in simulations typically adopt a simple spatially uniform UV background model (Faucher-Giguère et al., 2009; Haardt & Madau, 2012, hereafter HM2012). To be specific, the UV background intensity used in simulations of UFD analogs is applied uniformly without taking into account the local UV fields originating from their host galaxies.
According to recent research by Sacchi et al. (2021), the SFHs of UFDs associated with the Magellanic Clouds (MCs) could offer evidence of patchy reionization. To clarify, the MCs consist of the Large Magellanic Cloud (LMC) and the Small Magellanic Cloud (SMC), both being the largest satellite galaxies of the Milky Way (MW). Patchy reionization refers to the non-uniform reionization process, which varies based on the individual environments of UFDs, their proximity to their host galaxy, and the intensity of UV photon emissions from the host halo during the era of reionization. The Magellanic UFDs could present an ideal opportunity to investigate the impact of patchy reionization, primarily because recent data from Gaia DR2 proper motions suggest that they entered the MW’s virial radius relatively recently, less than 3.5 billion years ago (e.g., Patel et al., 2020). This implies that Magellanic UFDs might have been situated at a considerable distance from the host halo during the reionization period, leading to a weak influence from the MW halo.
Sacchi et al. (2021) conducted a comparative analysis of the SFHs of Magellanic UFDs, primarily linked to the LMC and having recently entered the MW’s halo, with those of long-standing UFD satellites of the MW, which they refer to as non-Magellanic UFDs. Their findings revealed that Magellanic UFDs tend to exhibit more extended SFHs, lasting 600 Myr, in contrast to non-Magellanic UFDs. Given that both Magellanic and non-Magellanic UFD satellites share similar stellar masses (), and a significant fraction of their stars () formed prior to reionization, the discrepancy in their SFHs could be attributed to the effects of patchy reionization. Specifically, Magellanic UFDs may have been located farther from the MW’s progenitor halo during the reionization era, experiencing a weaker reionization impact compared to non-Magellanic UFDs, thus explaining their extended SFHs. As such, the effect of reionization on UFDs could vary depending on the environment in which they were located at the time of reionization, leaving an imprint on their SFH. In this study, we investigate how the local UV fields, which are mainly determined by connection with the host halo, can shape the SFHs of satellite UFDs through cosmological hydrodynamic zoom-in simulations.
Several previous studies have investigated how the timing and strength of reionization affect individual dwarf galaxies by adopting uniform UV background radiation (e.g., Simpson et al., 2013; Bose et al., 2018; Garrison-Kimmel et al., 2019; Pereira-Wilson et al., 2023). Simpson et al. (2013), for example, utilized the table provided by HM2012 by varying the period of reionization, , during which the intensity of reionization increases from zero to full strength. They discovered that when was set to , the resulting stellar mass of dwarf galaxies with a mass of at could be larger by one order of magnitude than when was set to . It should be mentioned, however, that the HM2012 method may overestimate the ionization emissivity at high redshifts (e.g., ) by extrapolating the UV background radiation that was derived for lower redshifts. This could lead to premature and excessive heating of the intergalactic medium (IGM) at high redshifts (e.g., Puchwein et al., 2015; Oñorbe et al., 2017), which may significantly suppress star formation in low-mass galaxies like UFD systems.
An alternative approach to implementing the effect of reionization is to solve radiative transfer equations self-consistently to trace UV photons, but this method is computationally expensive and is usually conducted on a large scale with lower mass resolution (e.g., Pawlik & Schaye, 2008; Dixon et al., 2018; Rosdahl et al., 2018). Such large-volume simulations that have focused on studying the large-scale reionization history, resultant galaxy luminosity functions, and the escape of ionizing radiation have not placed much emphasis on the detailed evolution of small satellite galaxies such as UFDs. Among these, the SPHINX simulation (Rosdahl et al., 2018) achieved high spatial resolution ( pc) and addressed the radiative transfer aspect in the context of UFD formation.
This paper takes a unique approach to model the influence of reionization on UFDs by applying local UV fields from host galaxies rather than the traditional approach of using a uniform and homogeneous reionization effect. To avoid computationally expensive calculations such as radiative transfer, pre-calculated local UV fields from dark-matter-only simulations are utilized in cosmological hydrodynamic simulations of UFD analogs. In particular, we choose a halo pair consisting of a target UFD and its host halo, analogous to the MW and its satellites, from dark-matter-only simulations. Then, we calculate the strength of local UV fields from the host as a function of the distance between the target UFD and the host and the spectral energy distribution (SED) of the host galaxy.
Furthermore, we test a scenario where reionization happens later than previously thought by incorporating a transition redshift, , which marks the point at which the impact of the overall UV radiation in the universe becomes stronger than that of the local UV radiation from a host galaxy. Regarding the timing of reionization completion, while it is widely accepted to occur at (e.g., Becker et al., 2001; Fan et al., 2006), recent spectroscopic studies of Lyman alpha emitters and distant quasars suggest a late reionization scenario, where reionization is completed up to , which potentially leads to prolonged SFHs (Becker et al., 2015; Choudhury et al., 2015; McGreer et al., 2015; Mesinger et al., 2015). To better understand whether this delayed reionization can result in extended SFHs in UFD galaxies, we carry out simulations by altering the value of from to .
The paper is structured as follows. In Section 2, we describe the numerical methodology used in this study, while in Section 3, we present the simulation results. Our main conclusions are summarized in Section 4. Unless stated otherwise, all distances are given in physical units for consistency.
| Halo | |||||||
|---|---|---|---|---|---|---|---|
| - | - | - | |||||
| Halo1-GR | 0.74 | 18.5 | 0.14 | -3.28 | 1.5 | yes | 7.036 |
| Halo2-GR | 1.02 | 20.8 | 0.38 | -2.43 | 2.0 | yes | 6.998 |
| Halo3-GR | 1.05 | 20.7 | 0.24 | -2.81 | 2.6 | yes | 7.106 |
| Halo4-GR | 1.09 | 21.0 | 0.14 | -2.82 | 3.2 | yes | 7.037 |
| Halo5-GR | 1.40 | 22.9 | 0.63 | -2.33 | 2.0 | yes | 6.917 |
| Halo6-GR | 1.84 | 25.0 | 0.50 | -2.37 | 7.0 | yes | 6.895 |
Note. — Column (1): the name of halos. Column (2): viral mass (in units of ). Column (3): virial radius (in kpc). Column (4): stellar mass (in ). Column (5): average stellar iron-to-hydrogen ratios. Column (6): gas mass (in ). Column (7): whether star formation is truncated after reionization. Column (8): the time when star formation is completed.
2 Numerical methodology
2.1 Simulation Set Up
We have utilized a modified version of the N-body and Smoothed Particle Hydrodynamics (SPH) code GADGET (Springel et al., 2001; Springel, 2005) to perform a set of hydrodynamic zoom-in simulations. The adopted cosmological parameters include a matter density parameter of , a baryon density of , a present-day Hubble expansion rate of , a spectral index of , and a normalization of (Komatsu et al., 2011; Planck Collaboration, 2016). The initial conditions are generated using the cosmological initial conditions code MUSIC (Hahn & Abel, 2011). A preliminary dark-matter-only simulation using particles in a box is carried out to select target halos. The target halos chosen represent UFD analogs with a mass of at , and their physical properties are listed in Table 1. It is important to emphasize that we choose UFD analogs that are isolated and situated at a considerable distance from the host halo throughout their evolution. Our primary purpose is to study how patchy reionization affects the SFHs of these UFD analogs, particularly during high-. By focusing on isolated UFD analogs, we can exclude the potential impact of environmental factors, such as ram pressure stripping, as they come closer to the MW.
Next, we have conducted four consecutive refinements to the region enclosing the area two times the virial radius of the target UFD halo at . In the most refined region, the final resolution is , with dark matter (DM) and gas-particle masses of and , respectively. The softening length of DM and stellar particles is fixed at 40 pc at all redshifts in our simulations. However, for gas particles, we utilize an adaptive softening length that is proportional to the minimum value of pc. At each time step, we solve the non-equilibrium rate equations for the primordial chemistry of nine atomic and molecular species (H, H+, H-, H2, H+2, He, He+, He++, e-, D, D+). Besides primordial cooling, we have incorporated metal cooling processes with carbon, oxygen, silicon, magnesium, neon, nitrogen, and iron. The cooling rates for these elements in the simulation are determined using the photo-ionization package CLOUDY (Ferland et al., 1998).
2.2 UV background
2.2.1 Global reionization
This section describes one of two methods used to implement the UV background in our simulations. There are two distinct approaches we have utilized for this purpose. The first method is the homogeneous and flash-like cosmic UV/X-ray background, which was proposed by Haardt & Madau (2012). This approach involves the use of redshift-dependent photoionization and photoheating rates for H I, He I, and He II to mimic the process of reionization. This effect is uniformly applied to all galaxies within the simulation box, regardless of their position relative to their host galaxy. From this point on, we will refer to the homogeneous reionization effect as global reionization (GR). In our simulations, we start by introducing the UV background at and progressively increase it to the full strength at to prevent abrupt and significant heating of gas particles. Then, we maintain it at the constant 100% strength of HM2012 until .
2.2.2 Patchy reionization
The second approach is a patchy UV background, which takes into account environmental factors specific to each target UFD halo, such as the proximity of ionizing sources and the distance between them, which may alter the reionization effect experienced by the target halo. To achieve the most accurate results in calculating the effect of patchy reionization (PR) for our UFD analogs, it would be ideal to track the trajectory of ionizing photons emitted from the surrounding galaxies and apply the resulting heating and ionization effects on the target dwarf galaxy. However, carrying out a hydrodynamic simulation that self-consistently solves radiative transfer equations necessitates a significant amount of computational power.
To overcome this computational challenge, we have devised a novel approach where we pre-calculate the impact of local UV fields generated by the surrounding galaxies using DM-only simulations. This pre-calculated information is then utilized in our cosmological hydrodynamic simulations. In summary, obtaining pre-calculated UV fields involves three steps. Firstly, a DM-only simulation is performed to determine the environmental factors, such as the distance between a target UFD analog and the surrounding DM halos, as well as their halo masses. Secondly, we employ the abundance-matching approach proposed by Behroozi et al. (2013) to estimate the stellar mass of the surrounding halos. Finally, to attain the photoionization and photoheating rates from the neighboring galaxies, we use the Starburst99 package (Leitherer et al., 1999) to derive the SED. Below, we provide a detailed explanation for each step.
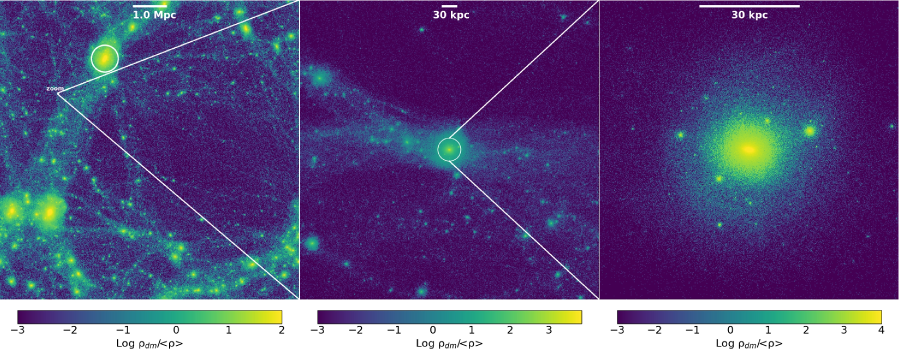
The first step of the process includes carrying out a dark-matter-only simulation with particles using the same simulation setup and cosmology as described in Section 2.1. Following this, a target UFD analog is selected, and the distance between the target UFD analog and the surrounding halos, including its host halo, as well as the mass evolution of the surrounding halos, are tracked. Figure 1 displays the DM morphology at , which highlights a pair consisting of the target UFD () and its host halo ().
In the second step, we estimate the stellar masses of the surrounding halos using the abundance matching technique (Behroozi et al., 2013). This is a widely used approach for assigning galaxy stellar mass or luminosity to halos generated in N-body simulations without having to perform hydrodynamical simulations.
In the final step, we adopt the Starburst99 package to derive the SED of the simulated galaxies. To do this, we utilize standard parameters, employing the Geneva evolutionary tracks without rotation as a model for stellar evolution, and black body spectra as a model for the atmosphere. Starburst99 generates a synthetic spectrum of galaxies based on their stellar masses, which were obtained in the previous step using the abundance matching technique. Since the massive OB stars formed in the neighboring galaxies are the primary source of ionizing photons, and their main sequence lifetime is approximately 10 Myr, we divide the stellar mass evolution of the surrounding galaxies into time intervals that are similar to the lifetime of OB stars. We then estimate the change in stellar mass () due to newly formed stars in the surrounding galaxies. We calculate the local UV fields exerted by the neighboring galaxies onto the target UFD analog by plugging in the distance between them and the synthetic spectrum of the surrounding galaxies into equations (1) and (2).
The rates of photoionization and photoheating are given by
| (1) |
| (2) |
Here, refers to the ionization cross-section (Osterbrock & Ferland, 2006), is the number density of the respective neutral species, while represents the ionization threshold frequency, such as eV, eV, and eV for H I, He I, and He II, respectively. The ionizing flux, , incident upon the target UFD analog, originating from the surrounding galaxies, is computed by taking into account the distance between the target halo and the neighboring galaxies and their SEDs. Self-shielding of the dense gas is implemented by attenuating the UV background based on , where (Simpson et al., 2013). Here, represents the SPH kernel size, denotes the neutral hydrogen number density, and refers to the frequency-averaged photoionization cross-section for HI. Similarly, a simple approach to self-shielding is applied for He I and He II as well.
It should be noted that the halo masses of the surrounding halos range from approximately to at . While we consider roughly 40 surrounding galaxies, including a host galaxy within the simulated box, we find that the impact of the host halo on the target UFD analog is likely to outweigh the effects of other smaller halos. Therefore, we will only focus on the influence of the host halo going forward. Additionally, we conduct simulations to examine whether the trajectories of UFD analogs in relation to the MW-like host halo remain consistent between simulations with hydrodynamics and the DM-only simulation. We verify that the difference in distance between the two sets of simulations is less than 1%, indicating that the DM-only simulation aligns with the hydro simulations in terms of proximity to the host halo.
2.2.3 Transition time,
In the PR implementation discussed in the preceding section, we only take star-forming galaxies into consideration as the ionizing sources of reionization. However, HM2012 suggests that hard UV-emitting quasars should also be considered as a source of reionization alongside star-forming galaxies. The precise contribution of these two ionizing sources as a function of redshift remains uncertain, although it is anticipated that quasars will be the dominant source at lower redshifts () (e.g., Wyithe & Loeb, 2003; Haardt & Madau, 2012).To take into account the influence of quasars on the reionization process, which is beyond the scope of this study, we combine our patchy UV background approach with the homogeneous reionization provided by HM2012. To be specific, we apply our patchy reionization implementation at relatively higher redshifts, where star-forming galaxies are the primary source of reionization and the impact of quasars is insignificant. We then designate a transition time, , where we switch from the patchy reionization approach to the homogeneous reionization model proposed by HM2012.
The transition period, ranging from to , is inspired by late reionization scenarios, which suggest that the end of reionization could extend from to as late as , as proposed in various studies (Becker et al., 2015; Choudhury et al., 2015; McGreer et al., 2015; Mesinger et al., 2015). Given the significant impact of GR, such that star formation in UFD analogs is immediately suppressed upon its introduction, the transition time can be regarded as marking the end of reionization. Indeed, this combined approach enables an exploration of how patchy reionization might impact the SFHs of the simulated UFD analogs and provides insights into when reionization reaches its completion.
Moreover, we incorporate an escape fraction, , as a free parameter, which represents the fraction of ionizing photons from star-forming galaxies that can escape and propagate into the IGM. The estimate of varies with halo mass and redshift, and theoretical studies have estimated the average value of to be 0.1-0.2 at high redshifts () (e.g., Kimm & Cen, 2014; Bouwens et al., 2015; Mitra et al., 2015; Khaire et al., 2016; Ma et al., 2020), with some studies suggesting a somewhat higher value of (e.g., Yajima et al., 2011). Increasing the escape fraction has a stronger impact on reionization, resulting in the heating of gas within low-mass halos and the consequent suppression of star formation in such systems. Observational studies have extensively investigated the constraints on the escape fraction, particularly for galaxies at lower redshifts (e.g., Choi et al., 2020; Meštrić et al., 2021; Naidu et al., 2022). Notably, Choi et al. (2020) proposed a value of 0.25 for based on the SED analysis of resolved stars in NGC 4214. Despite being a dwarf galaxy at a low redshift, NGC 4214 exhibits properties that make it a suitable analog for studying the ionizing sources responsible for reionization.
The can also be influenced by the binary population within galaxies (e.g., Ma et al., 2016; Rosdahl et al., 2018). In particular, Rosdahl et al. (2018), who investigated the impact of binary population on and the reionization history, proposed that considering binary stars leads to about three times higher in observed 1500 Å than a single stellar population. However, due to the challenge of constraining the frequency of binary stars, we have not accounted for the effect of binaries in our SED models, which would yield harder resulting SEDs. Choi et al. (2020) also did not incorporate stellar rotation or binary evolution in their SED models. In our simulations involving patchy UV fields, we adopt a fixed value of for the range , considering that star-forming galaxies are the primary contributors to reionization during this epoch. This choice is reasonable for the host galaxies involved in the reionization process.
2.3 Star formation
We include the formation of Population III (Pop III) stars, metal-free first-generation stars, and Population II (Pop II) stars, which form from gas clouds enriched by metals from the SN explosions of Pop III stars. The transition from Pop III to Pop II star formation occurs when the metallicity of the gas cloud exceeds a critical value of (Omukai, 2000; Schneider & Omukai, 2010; Safranek-Shrader et al., 2016). For a detailed description of the star formation recipe and associated stellar feedback, we refer readers to Jeon et al. (2017). In short, star formation is triggered when the hydrogen number density of a gas particle surpasses the threshold value of . The gas particle is transformed into collisionless star particles with a mass of . Instead of treating each star particle as an individual star, we consider them as a single stellar cluster. We assume that the initial mass function (IMF) for Pop III stars is top-heavy, , with a slope and covers the mass range of . For Pop II stars, we adopt the Chabrier IMF within the mass range of .
We implement a stochastic conversion of gas particles to star particles based on Schmidt’s law (Schmidt, 1959), where stars are formed at a rate of . Here, is the gas density, and the star formation timescale, , is given by , where corresponds to the free-fall time, and denotes the star formation efficiency per free-fall time. During each numerical time interval of , the conversion from gas to star particle only occurs when a randomly generated number between 0 and 1 is less than the minimum of and 1. We set the star formation efficiency, , for both Pop III and Pop II stars, and the star formation timescale is given by
| (3) |
where the free fall time is . The level of star formation activity in galaxies is regulated by various factors, including their mass and the potency of associated SN feedback in suppressing subsequent star formation. This interplay between galaxy mass and the effectiveness of SN feedback can lead to diverse SFHs, largely characterized by either continuous or bursty star formation.
It is important to highlight that in this study, we have not considered the impact of photoionization heating from Pop III and Pop II stars, primarily due to the considerable computational cost. The influence of radiative feedback from these local sources remains a topic of ongoing debate. For instance, Hopkins et al. (2020) suggests that the stellar mass of small galaxies (with a halo mass of ) is predominantly shaped by external UVB radiation, while local sources have a negligible effect. Conversely, Agertz et al. (2020) have presented contrasting results, suggesting that photoionization heating from stars could reduce the stellar mass by a factor of 5-10 for dwarf galaxies with a halo mass of .
2.4 Chemical feedback
We account for chemical enrichment through the contribution of winds from asymptotic giant branch (AGB) stars and the explosions of CCSNe and Type Ia SNe, following the implementation described in Wiersma et al. (2009). At each simulation time step, we estimate the masses of 11 individual elements produced by dying stars and release them into the neighboring medium. These elements undergo diffusive mixing in both the interstellar medium (ISM) and the IGM. The initial masses of Pop III stars determine their nucleosynthetic yields and remnant masses. For instance, Pop III stars with initial masses between and end their lives in core-collapse supernovae (CCSNe), while those with masses between and end their lives in pair-instability supernovae (PISNe). We adopt the nucleosynthetic yields and remnant masses for CCSNe of Pop III stars from Heger & Woosley (2010) and for PISNe from Heger & Woosley (2002).
Pop II stars undergo mass loss through AGB or SN in their final stage. We incorporate metallicity-dependent tables ranging from to (Portinari et al., 1998) to determine the yield and evolution of these stars. Intermediate mass stars () can lose up to 60% of their mass during the terminal AGB stage, and these yields are taken from Marigo (2001). CCSNe from massive stars () release significant amounts of metals, and Type Ia SNe are expected to occur for stars with masses in the range . Due to uncertainties in the detailed evolution of Type Ia SNe, we use an empirical delay time function expressed in terms of e-folding times (e.g., Barris & Tonry, 2006; Förster et al., 2006). Metals from dying Pop II stars are also transported to the IGM and ISM via diffusion-based metallicity, as described by Greif et al. (2009), where ejected metals disperse into neighboring gas particles (). The initial metallicity of the surrounding gas is given below.
| (4) |
where represents the mass of metal assigned to one of the neighboring gas particles, and is the mass of a gas particle.
2.5 Thermal feedback
When a star reaches the end of its life and undergoes an SN explosion, we release the energy from the explosion to neighboring gas particles as thermal energy. However, it is well known that an over-cooling problem can arise if the SN energy is deposited onto too much surrounding gas, resulting in the thermal energy being radiated away (e.g., Stinson et al., 2007). To avoid the over-cooling problem associated with SN explosions, we use the method suggested by Dalla Vecchia & Schaye (2012), where a temperature increase of more than K is guaranteed by limiting the number of neighboring particles that receive SN thermal energy. To achieve this, we deposit the energy from the SN explosion onto a single neighboring particle () to ensure that the effect of the explosion is preserved. The total SN energy per unit solar mass, , is calculated using the adopted IMF for Pop III and Pop II stars, assuming that each SN releases erg of energy. This is expressed as , where is the number of SNe per unit mass. is obtained by integrating the IMF, , over the mass range from to . Here, and are the minimum and maximum initial mass of stars that can undergo SN, respectively. For Pop III stars, the resultant value is erg , while for Pop II stars, it is erg .
3 Results
In this section, we present the results of our simulations, focusing on how patchy reionization affects the SFHs and stellar metallicities of our simulated UFD analogs. Specifically, we compare two scenarios: one with a homogeneous UV background throughout the entire cosmic history until , and the other incorporating patchy reionization effects on the galaxy analogs. Section 3.1 examines the fundamental properties of our simulated UFD analogs with a homogeneous UV background. Section 3.2 investigates the impact of patchy reionization on the SFHs of our simulated galaxies. Section 3.3 analyzes how the duration of star formation varies depending on the transition time, , from patchy to homogeneous reionization. Finally, we compare the physical properties of our simulated UFDs with those of observed UFDs in the MW and discuss the implications of patchy reionization on UFDs in Section 3.4
3.1 Basic properties (GR)
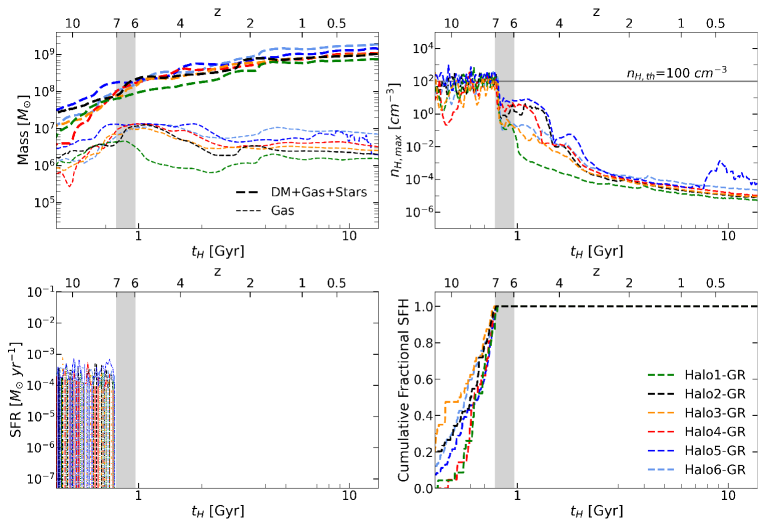
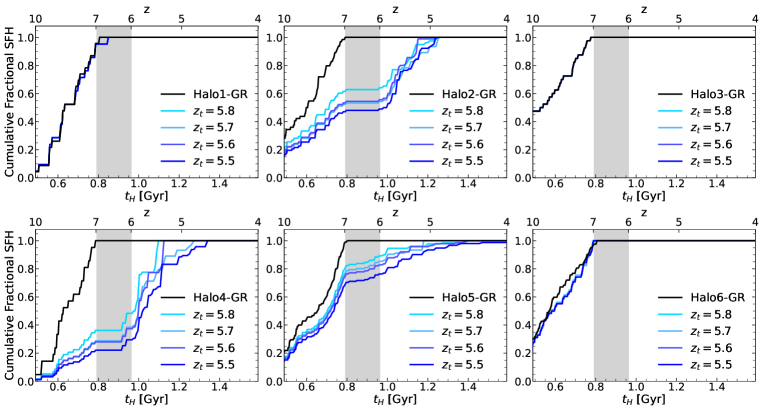
Figure 2 exhibits the evolution of the simulated UFD analogs using a homogeneous UV background from the initial star formation activities until . The basic properties of the simulated galaxies at are provided in Table 1. The four panels, arranged clockwise from the upper left, illustrate the mass assembly for the virial and gas masses, the maximum hydrogen number density, the cumulative SFH, and the star formation rate (SFR). All physical quantities in each panel are calculated using the particles found within the virial radius of the halo at a given time. A grey-shaded region in each panel denotes the reionization period, during which a homogeneous UV background is introduced at , gradually ramping up to its full value by . Notably, all the simulated analogs have a virial mass of 1-2 at .
We find that the total gas mass within the halos tends to decrease after the UV background reaches its full strength, and the degree of gas loss due to reionization depends on how massive a halo is when the onset of reionization is initiated (). As shown in the upper-left panel of Figure 2, four sets of halos (Halo1-GR, Halo2-GR, Halo3-GR, Halo4-GR) attain gas masses of at . In contrast, Halo5-GR, the most massive set of halos at , having a total mass of 1.6 108, tends to preserve a gas mass of 1.3 107, which is three times larger than those of the other four halos. On the other hand, Halo2-GR loses roughly 90% of its gas mass ( at ) between and .
In addition to the total gas mass, the process of reionization also disperses dense gas clouds within the halos. The upper-right panel of Figure 2 displays the maximum hydrogen number density of gas particles within each halo, compared to the density threshold for star formation, , represented by a solid gray horizontal line. Gas particles above this density threshold can be transformed into star particles with a mass of . The maximum gas densities of all halos decrease significantly by two orders of magnitude from to . The UV background effectively disperses the dense gas particles, making it difficult to form new stars, resulting in no star formation in all halos below . Interestingly, Halo2-GR, Halo4-GR, and Halo5-GR can retain the gas particles with for 250 Myr at . This is due to the relatively higher virial masses of these halos, with , , and for Halo2-GR, Halo4-GR and Halo5-GR, respectively, at . On the other hand, Halo1-GR, which has the lowest mass with at , shows a significant reduction in the maximum hydrogen number density by five orders of magnitude between and .
This quenching trend by reionization is reflected as a truncated SFH in the bottom-right panel of Figure 2. The SFHs in this panel represent the cumulative fraction of stars formed until a given time among all stars in each halo at . For instance, all simulated halos exhibit a ratio of unity at , implying that all stars in each halo are formed prior to reionization. Our findings are consistent with previous studies (e.g., Brown et al., 2014; Weisz et al., 2014; Jeon et al., 2017), confirming that low-mass progenitor halos of the UFD analogs are vulnerable to internal and external processes, such as SN feedback and reionization, giving rise to short SFHs.
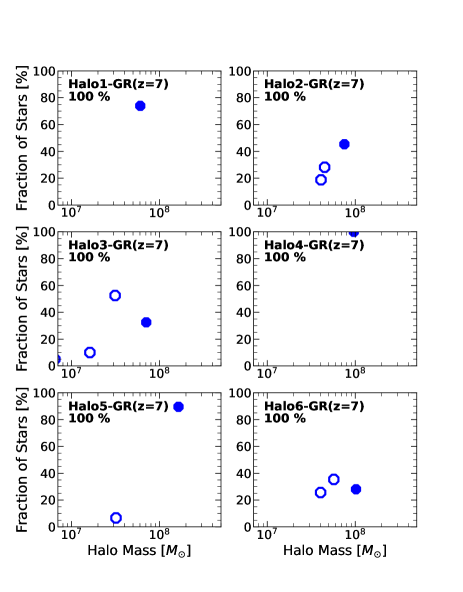
It should be emphasized that the simulated galaxies are the result of the merging of multiple progenitor halos, indicating that they have several small-mass progenitors at high redshifts. Figure 3 illustrates the progenitor halos, which are the halos where the stars that are found within the virial radius at are formed and then merged with the primary halo. Only the progenitors that contribute more than 5% of the final stellar mass of the simulated galaxies are shown, with a filled circle representing the primary halo, the most massive halo among the progenitors. The percentage of the fraction of stellar mass at in comparison to the final stellar mass of the UFD analogs at is presented below the halo name in each panel of Figure 3. The percentage is 100% in all panels, which is due to the truncated SFHs at .
Since the contribution from star-forming galaxies to reionization is the only consideration, we switch to the GR implementation at a designated transition time, . In the bottom panels, the same data is presented as in the upper panels, but with a transition redshift of applied. Below this redshift, the GR implementation is used, and this combination of GR and PR is referred to as PR going forward.
Our analysis shows that the simulated galaxies in Halo2-GR, Halo3-GR, and Halo6-GR have approximately three progenitors, while the stars in Halo1-GR, Halo4-GR, and Halo5-GR are primarily () formed in a single primary halo. The difference between a multiple-progenitor and a single-progenitor group is attributed to the rate of halo mass growth. The primary halos of the single-progenitor group experience more rapid mass assembly than those of the multiple-progenitor group. For example, during the period of , the primary halo of Halo4-GR increases its halo mass from to , along with an increase in gas mass, resulting in a substantial amount of star formation compared to the relatively less massive progenitor halos.
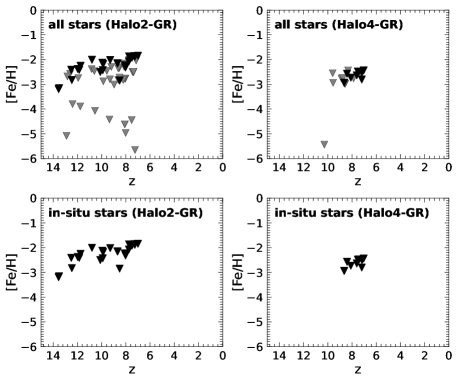
UFDs are known to be systems with low metallicity, with (e.g., Martin et al., 2007; Norris et al., 2010; Kirby et al., 2013; Simon, 2019). Due to the combined effects of reionization and SN feedback, which lead to short SFHs, the chances of these systems being enriched are limited. The metal-poor nature of UFD systems is depicted in Figure 4. Within both the upper and bottom panels, the estimated values of in-situ stars and externally originated stars are represented by black and grey inverted triangles, respectively, plotted as a function of their formation time. Note that in-situ stars refer to stars that are formed within the primary progenitor halo. We focus especially on two specific cases: in Halo2-GR, stars form in multiple progenitors that merge at a later time, while in Halo4-GR, stars are primarily formed in situ within the primary progenitor halo. In both halos, the values of all stars show a wide range from to (upper panels). However, the metallicity of in-situ stars tends to display a narrow metallicity range of (bottom panels).
This trend is expected as star formation can proceed steadily in a relatively massive progenitor halo, increasing the metallicity of in-situ stars over time. This is because in the primary halos, the gas is not entirely expelled by the feedback of stars, and even if it is dispersed, it rapidly recollapses, allowing star formation to continue. Consequently, new stars can form with increased metallicity before the metals associated with the gas are diffused. Meanwhile, in relatively low-mass progenitor halos, star formation is more likely to be quenched by SN feedback, making it difficult to form stars with higher metallicities (). Furthermore, we observe that the formation of extremely low-metallicity stars () is solely a result of external metal enrichment. This occurs when gas is contaminated by metals from nearby halos, allowing for the formation of low-metallicity stars in the absence of previous metal-free star formation. Although the metallicity trend mentioned above is applicable to both simulations, Halo2-GR and Halo4-GR, the metallicity of Halo4-GR (right panels) increases from [Fe/H] to and it shows a narrow range than Halo2-GR due to the insufficient time for gas enrichment in the halo. This is because star formation begins later in Halo4-GR than in Halo2-GR. Specifically, Halo2-GR starts forming the first Pop II star at , whereas in Halo4-GR, the first Pop II star is formed at , around 270 Myr later. However, reionization at halts star formation in both simulations, resulting in a rather short metal enrichment history in Halo4-GR.
3.2 Patchy reionization effects on the SFHs and stellar metallicity
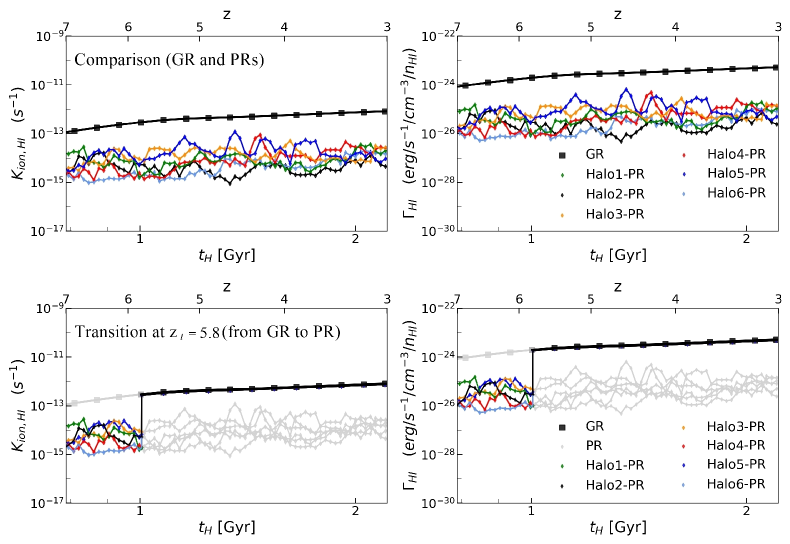
This section highlights the results of our galaxy simulations that are impacted by the spatially non-uniform reionization process. The intensity of this patchy reionization is ascertained by considering the environmental factors of each simulated galaxy, corresponding to the galaxy analogs listed in Table 1. As explained in Section 2.2, we calculate the impact of patchy reionization by taking into account the stellar mass of the host halo and its distance as a function of cosmic time. The resulting photoionization and photoheating rates, covering the range from to , are illustrated in Figure 5. Although we consider the effects of PR on H I, He I, and He II, only the results for H I are presented in the upper panels of Figure 5 because we confirm that the effect of PR on the other species exhibits similar trends to that of H I. The black solid line shows the values obtained from the GR runs, while the colored solid lines represent the estimates from the PR runs. The intensity of PR is, on average, two orders of magnitude lower than that of GR up to , indicating that the effect of reionization on the simulated galaxies is relatively weaker when using the PR implementation. The calculated values should be regarded as the lower limit because we do not account for the complete photon flux originating from galaxies beyond the spatial scales we have modeled. Our findings indicate that the distant nature of these galaxies renders their impact insignificant, but the overall degree of reionization increases by a factor of by considering galaxies on a larger scale (refer to Appendix B for details).
As described in Section 2.2, ionizing sources contributing to reionization include radiation from both star-forming galaxies and quasars, with quasars being the predominant source at lower redshifts compared to star-forming galaxies. Given that we solely consider star-forming galaxies as the ionizing source, it is crucial to improve our PR estimates to account for the impact of quasars at low redshifts. As a result, we employ a hybrid method that merges GR and PR methods, wherein the reionization process transitions from PR to GR at a designated redshift. The lower panels of Figure 5 show the intensity of the combined GR+PR reionization. From this point onward, we will refer to GR+PR reionization as PR, and we have selected the transition time from PR to GR to occur at . In the following two sections, we will explore the effects of PR on the SFH and stellar metallicity of the simulated galaxies.
3.2.1 Star formation histories
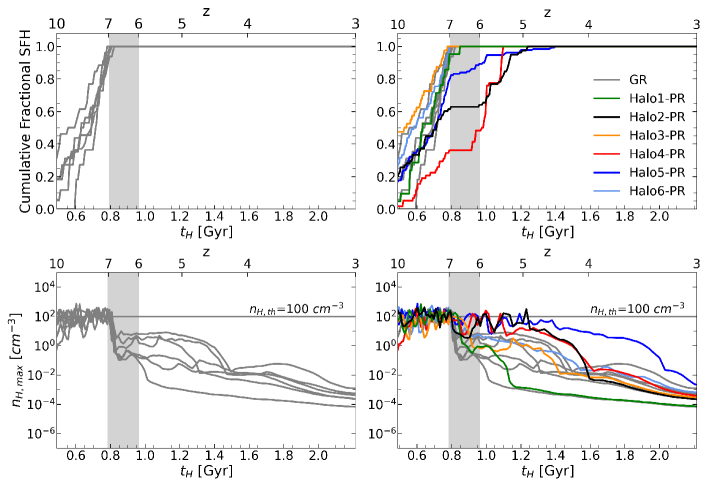
In Figure 6, we present the resulting SFHs for both GR (left panels) and PR (right panels) implementations by showing the cumulative SFHs (top panels) and the maximum hydrogen number density (bottom panels) for our simulated halos. Furthermore, on the right panels, we overplot the values from the GR runs as grey lines to enable easy comparison. Similar to the GR runs, where all halos encounter a complete halt of star formation as a consequence of reionization, most halos except Halo5-PR experience a temporary suppression of star formation with the patchy UV background. However, considering the reduced intensity of patchy reionization, which is two orders of magnitude weaker than that in the GR scenario, unlike the GR cases where the gas density fails to recover enough for star formation, in the PR cases, the gas density bounces back to a level that allows star formation to resume. We refer to this star formation taking place below in the PR runs as late star formation.
We observe that Halo2-PR, Halo4-PR, and Halo5-PR form 60%, 35%, and 80% of the total stellar mass before and undergo late star formation up to after reionization. Notably, Halo5-PR exhibits a unique characteristic in its SFH, which extends 550 Myr since , significantly longer than the 280 Myr in Halo2-PR and 180 Myr in Halo4-PR (see Table A1). Furthermore, in contrast to Halo2-PR and Halo4-PR, where late star formation commences at after a temporary quenching period from to , Halo5-PR manages to sustain star formation even when subjected to a stronger reionization effect than the other two cases, Halo2-PR and Halo4-PR.
As depicted in the bottom panels of Figure 6, the maximum hydrogen number density drops to 0.1-1.0 in the GR runs as soon as the reionization effect is introduced. On the other hand, in the PR runs, whether complete quenching occurs or late star formation is observed depends on the halo mass at the onset of reionization, corresponding to . For instance, we find that three halos, Halo2-PR, Halo4-PR, and Halo5-PR, with masses of , , and at , respectively, exhibit late star formation. In contrast, relatively less massive halos, such as Halo1-PR and Halo3-PR, undergo complete quenching. Notably, Halo5-PR is the most massive halo at among the three halos (Halo2-PR, Halo4-PR, and Halo5-PR). By maintaining high-density gas particles within its virial radius, Halo5-PR can sustain continuous star formation.
We find that stars produced during the late star formation period contribute to 40% (Halo2-PR), 65% (Halo4-PR), and 20% (Halo5-PR) of the total stellar mass in each respective run. Interestingly, there seems to be a negative correlation between the duration of late star formation and the fraction of stars formed during that period, with Halo5-PR showing the lowest value of the fraction of late star formation; however, this correlation is not meaningful. The fraction of stars formed through late star formation within a given halo is determined by a complex interplay of factors, including the halo mass at the onset of reionization, the total duration of star formation activity, and the burstiness of star formation. It is important to note that the galaxies in Halo2-PR, Halo4-PR, and Halo5-PR attain comparable halo masses at . Nonetheless, the fraction of stars formed in late star formation can differ significantly based on when the halo growth occurs, either before or after reionization. For example, Halo2-PR and Halo4-PR form a substantial amount of stars after reionization, whereas in the case of Halo5-PR, as mentioned earlier, even though the galaxy exhibits the most extended SFH until , the majority of its stars () have already formed prior to reionization.
Furthermore, while Halo4-PR has a shorter duration of late star formation of 180 Myr, around 100 Myr less than that of Halo2-PR, a larger fraction of stars are formed in the late phase in Halo4-PR (roughly 65%) compared to Halo2-PR, which forms about 40% of its stars below . This difference can be ascribed to the galaxy in Halo4-PR commencing star formation at a later redshift () relative to the galaxy in Halo2-PR. Moreover, the galaxy in Halo4-PR undergoes a phase of bursty star formation at , during which stars with a total mass of form within a 10 Myr span. Consequently, the duration of late star formation in Halo4-PR is shorter than that of Halo2-PR, due to the strong stellar feedback from the bursty star formation event that interrupts subsequent star formation.
It should be noted that using the PR approach in simulating UFD analogs does not guarantee extended SFHs. Achieving late star formation becomes challenging if the progenitor halo’s mass is relatively small, leading to complete quenching despite the weak intensity from PR. For example, as illustrated in Figure 5, the PR intensity applied to the galaxy in Halo3-PR is comparable to that of Halo5-PR between and . However, the halo mass of Halo3-PR () is 2.3 times less massive than that of Halo5-PR at , which makes it difficult for the galaxy to maintain gas particles able to form stars after reionization. Consequently, the mass of the progenitor halo at the time of onset of reionization is critical for an extended SFH.
This is because even though the UV field from patchy reionization is not strong enough to completely stop star formation, it temporarily halts it between and . During this time, metals in the gas tend to diffuse along with the gas due to patchy reionization. This leads to a decrease in the gas metallicity and the formation of stars with similar or lower metallicities.
3.2.2 Stellar metallicity
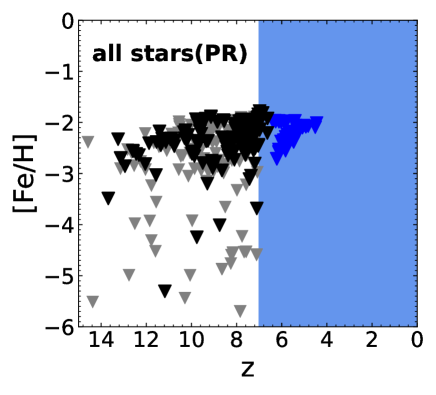
To investigate whether the prolonged SFHs resulting from weaker PR intensities are reflected in the stellar metallicity of the simulated galaxies, we present Figure 7. This figure illustrates the stellar metallicity as a function of the formation time of stars located within the virial radius of the simulated halos using PR at . In particular, we compare the [Fe/H] values for all stars (gray and black) within the virial radius of all the simulated galaxies employing PR to those formed internally within the primary progenitor halos (black). We find that almost all stars are metal-poor, ranging from to , and the in-situ stars (black) also exhibit a similar metallicity range to that of all stars. We denote the stars formed during late star formation with blue inverted triangles in each panel. The metallicity of these late-forming stars, ranging between , is comparable to that of in-situ stars formed at , just before a patchy UV field is introduced.
We observe two distinct characteristics of stars resulting from late star formation. Firstly, all stars originating from the late star formation phase are formed internally within the halo rather than being accreted stars. This occurs because only the primary halo can sustain star formation under the influence of reionization, while less massive progenitors experience a total cessation of star formation due to reionization. Secondly, even though these newly formed in-situ stars originate at relatively lower redshifts, they tend to display metallicities similar to or lower than the peak [Fe/H] of stars formed prior to reionization. This is attributed to the temporary quenching experienced by the simulated galaxies, even with the weak impact of patchy reionization, which causes dense gas and metals to dissipate. Given that the late star formation in Halo2-PR and Halo4-PR commences later than in Halo5-PR, in-situ stars from the late star formation at in Halo2-PR and Halo4-PR exhibit lower metallicities ([Fe/H] -2.7) than those in Halo5-PR by approximately 0.6 dex. This implies that the longer it takes for the late star formation to begin, the more dense gas in gas in the primary progenitor halo disperses. Consequently, it becomes difficult to form high metallicity stars (). Once the late star formation starts, the peak [Fe/H] of in-situ stars increases from to over time in both Halo2-PR and Halo4-PR runs, due to the increase in metals from SN explosions occurring within the halo.
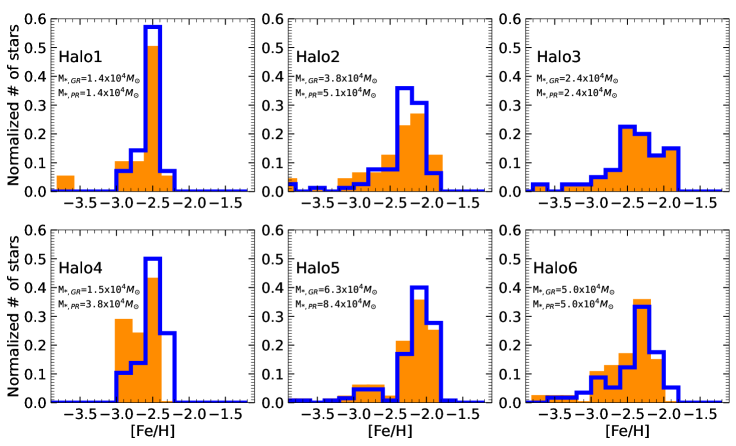
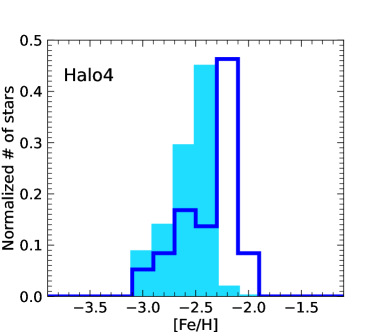
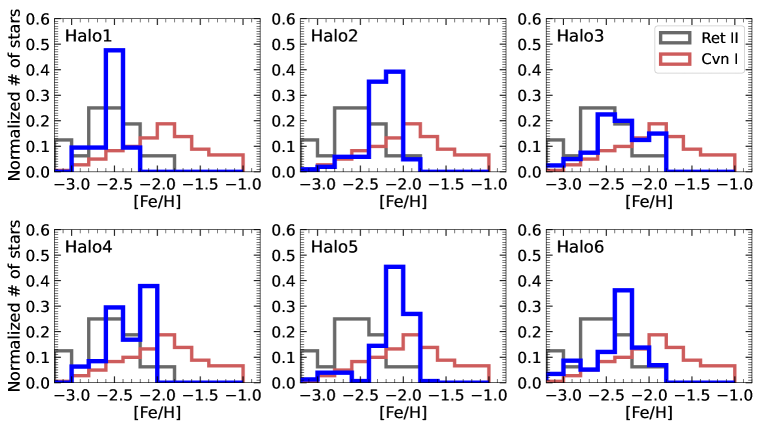
In Figure 8, we show the metallicity distribution function (MDF) of the simulated galaxies, where we categorize Pop II stars from each halo, spanning from to , with intervals of 0.2 dex. Specifically, we compare the MDF of Pop II stars from GR runs, depicted in orange, with those from PR runs, illustrated in blue. First, the MDF of galaxies with a stellar mass larger than at tends to peak at . We observe no significant difference in the MDF, except for Halo4-PR, among the three runs: Halo2-PR, Halo4-PR, and Halo5-PR, which have extended SFHs due to adopting patchy reionization. Only in the run Halo4-PR do we find the MDF shifts as a result of the patchy reionization effect, extending towards a higher metallicity by 0.22 dex. The cause of this minimal change in the MDF, shown in Halo2-PR and Halo5-PR, is that the simulated galaxies experience a temporary quenching due to weak patchy reionization rather than continuously forming stars. Consequently, metals are expelled along with the gas, reducing the gas metallicity when the halo is replenished to form subsequent stars.
3.3 Patchy UV background with transition time
In this section, the question we aim to address is how the duration of late star formation and stellar metallicity may change if we adopt a transition time for the PR to GR implementation up to , which is later than the fiducial value of . To investigate this, we have conducted simulations on the same runs as in the PR cases, but with a gradual change in the transition time from to , incrementing by 0.1. We explore the effects of a delayed transition time for two primary reasons: (1) there is no consensus on when reionization is completed, and (2) recent observational studies have proposed a late reionization scenario, indicating that reionization may have been completed between and (e.g., Becker et al., 2015; Choudhury et al., 2015; McGreer et al., 2015; Mesinger et al., 2015). As such, by incorporating a delayed transition time, we are also able to examine the implications of a late reionization scenario. The properties of the simulated halos with delayed transition times are summarized in Table A1. As explained in Section 3.2, the notation PR-z‘5.x’ in the halo name signifies that the transition from PR to GR takes place at .x. For example, in the PR-z5.5 run, the transition from PR to GR occurs 0.3 later in redshift compared to the PR-z5.8 run, resulting in a longer application of the PR effect. It is important to note that all physical quantities in Table A1 are calculated based on the particles within the virial radius of each halo at . We halted all simulations adopting PR at because no more late star formation is expected in the simulated halos beyond this period, as demonstrated in the GR runs.
Figure 9 presents the SFHs of the simulated halos as a function of the transition time. Notably, we find that in line with the fiducial PR runs, the relatively less massive halos during the onset of reionization (Halo1-PR, Halo3-PR, Halo6-PR) still fail to achieve sufficient density for star formation to take place, even when the patchy reionization period is prolonged by postponing the transition time. Meanwhile, the impact of the late transition time is evident in the runs Halo2-PR, Halo4-PR, and Halo5-PR as follows. As expected, when the period of patchy reionization is extended by delaying the transition from PR to GR, the simulated galaxies tend to form more stars through late star formation.
For example, with the transition time of (), Halo2-PR in Figure 9 accounts for 40% (50%) of stars from late star formation, so more stars are formed in Halo2 by late reionization. Consequently, the stars produced by late star formation contribute to an increase in stellar mass. For instance, when adopting (), the stellar mass of Halo2-PR increases by up to 31%, comapared to those of Halo2-PR-z5.8 (refer to Table A1).
We observe a slight correlation between the transition time and the duration of late star formation. As indicated in Table A1, by postponing the transition time from to , the duration of late star formation in Halo4-PR can be extended by approximately 240 Myr, while Halo2-PR experiences a minimal change in duration, at around 15 Myr. Interestingly, the duration of late star formation and the resulting stellar masses are not always proportional, as evidenced by the weak correlation in Halo4-PR. To be specific, the stellar mass of Halo4-PR-z5.6 is similar to that of Halo4-PR-z5.7, with a difference in halo mass of less than 3%. However, Halo4-PR-z5.6 has a late star formation duration that is shorter than Halo4-PR-z5.7 by approximately 140 Myr.
This difference is ascribed to whether the galaxy undergoes bursty or continuous star formation. In Halo4-PR-z5.6, stars with a total stellar mass of are formed during a short period of 4.4 Myr, causing the galaxy to experience a more episodic and bursty star formation compared to Halo4-PR-z5.7. Stellar feedback from such bursty star formation significantly reduces the gas density by two orders of magnitude, effectively suppressing further star formation. Overall, the extent of the late star formation of the simulated galaxies depends not only on the transition time from PR to GR implementation but also on the nature of their late star formation, whether occurring in episodic bursts or as a continuous process. To examine the primary factor shaping the characteristics of SFHs, we carry out additional simulations employing various star formation random seeds. Our results reveal that the trends, which suggest that a delayed transition results in a more prolonged SFH, remain consistent, albeit with slight variations in the duration of late star formation due to its inherent nature.
Since Halo2-PR and Halo4-PR have similar masses at the onset of reionization, it is useful to compare their evolution while keeping the transition time constant, given that the intensity of patchy reionization in Halo4-PR is one-third that of Halo2-PR. Our comparison reveals that when is employed, the SFH of Halo4-PR extends for 90 Myrs longer than that of Halo2-PR. Furthermore, it would be meaningful to consider Halo2-PR and Halo4-PR as non-Magellanic and Magellanic UFDs, respectively, as proposed by Sacchi et al. (2021). Assuming that Magellanic UFDs may have been situated farther from the host halo during reionization, the strength of reionization could be weaker than that applied to non-Magellanic satellites that had already entered the host environment at that time. Consequently, Magellanic systems could be expected to exhibit longer SFHs, similar to Halo4-PR.
To explore how the stellar metallicity may vary based on the transition time, we compare the MDF of Pop II stars in Halo4-PR-z5.8 (filled cyan) and Halo4-PR-z5.5 (blue) in Figure 10. Notably, it is evident that the relatively high metallicity stars with are formed only in the Halo4-PR-z5.5 run during late star formation, resulting in a median metallicity of which is greater than the median value of shown in Halo4-PR-z5.8. As discussed in Section 3.2.2, if the duration of late star formation resulting from weak patchy reionization is temporary, it may be difficult to discern a significant difference in the subsequent stellar metallicity. This is because metals are expelled alongside the gas during the short quenching period, leading to the formation of stars with metallicities that are either lower or similar to those formed prior to reionization. On the other hand, if the duration of late star formation is prolonged by postponing the transition time, the patchy reionization effect becomes more apparent in the emerging stellar metallicity.
3.4 Comparison with observations and theoretical work
So far, we have demonstrated the impact of patchy reionization on the SFHs and stellar metallicity of UFD galaxy analogs while taking into account environmental conditions. In this section, we will compare our simulated UFD analogs, which incorporate a transition redshift of , with observed UFD satellites in the MW. Additionally, we will compare our findings with other theoretical studies that have investigated the metallicity of UFDs. The objective is to provide novel insights into star formation, stellar metallicity, and the galactocentric distance of observed UFD satellites through the implementation of our patchy reionization model.
| Galaxy | (Gyr ago) | (Gyr ago) | (Gyr ago) |
|---|---|---|---|
| non-MC mean | 13.40 0.06 | 12.68 0.23 | 11.5 |
| MC mean | 13.49 0.09 | 12.06 0.72 | 8.5 |
| GR mean | 13.15 | 13.01 | 12.96 |
| PR-z5.5 mean | 12.82 | 12.55 | 12.28 |
Note. — Column (1) specifies the names of each UFD group. Columns (2), (3), and (4) represent the times at which UFDs reach 50%, 90%, and 100% of their final stellar mass, respectively.
3.4.1 Star formation histories of the observed UFDs
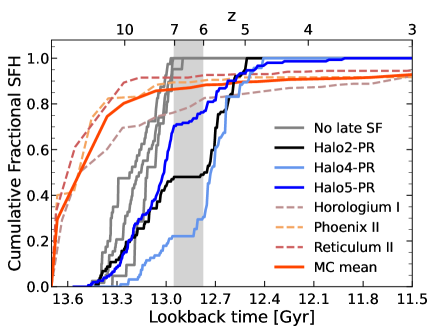
Figure 11 depicts a comparison of the cumulative fractional SFH obtained from simulated galaxies with those of Magellanic UFDs, including Horologium I, Phoenix II, and Reticulum II, along with their averaged SFH denoted as MC mean (Sacchi et al., 2021). We have specifically selected the simulation runs that incorporate patchy reionization with a transition time of , as these runs demonstrate the most extended SFHs. Based on the reconstructed SFHs of observed Magellanic UFDs, it is likely that they formed a significant proportion of stars (mean value of ) before , while the simulated galaxies tend to display a broader range in terms of the fraction of stars formed prior to , which spans from 20% to 70%. In addition, the observed Magellanic UFDs are expected to continue forming the remaining 20% of stars for a more extended duration, up to a redshift of , while the simulated galaxies complete their star formation by .
Table 2 shows a summary of the differences between the simulated galaxies and observed Magellanic UFDs in terms of the quenching time, including and , which represent the time required to form 50% and 90% of the final stellar mass (e.g., Weisz et al., 2019), and , which indicates the point at which star formation is entirely quenched, both as a look-back cosmic time. The table reveals that the quenching time, , is similar for Magellanic UFDs and PR-z5.5 runs with Gyr ago and Gyr ago, respectively, implying that 90% of stars are formed by in both cases. However, the timing of the most rapid star formation is different between the two, with Magellanic UFDs forming stars early, represented as Gyr ago, while it occurs relatively late, showing Gyr ago for the PR-z5.5 runs. As discussed in Section 3.2.1, the fraction of stars formed before cosmic reionization is greater when the halo mass is higher, particularly in the early stages of its evolution, which is evident in the case of Halo 5. Conversely, for smaller halo masses during the early stages of evolution, such as Halo 2 and Halo 4, the impact of patchy reionization is more significant. The implication is that patchy reionization has the potential to enable galaxies that would have otherwise experienced complete quenching with the GR model, to form more stars instead. This, in turn, leads to a smaller value of .
Magellanic UFDs exhibit a more prolonged star formation period compared to the PR runs. For instance, Magellanic UFDs with Gyr ago have SFHs that are extended by at least 3 Gyr compared to those of the simulated galaxies. The mean value for of the PR runs with is Gyr ago. It is possible that the difference in between Magellanic UFDs and the simulated galaxies could be due to weaker reionization experienced by the former from the surrounding galaxies. This suggests that the strength of patchy reionization applied in our PR-z5.5 runs might be greater than what was experienced by the Magellanic UFDs. Furthermore, as discussed in Section 3.2.1, comparing Halo2 and Halo4, the duration of star formation can also depend on whether the star formation is continuous or bursty, while patchy reionization is taking place even for halos of the same mass. In other words, the more bursty the star formation, the greater the impact of the powerful SN explosion effect, resulting in complete quenching and, consequently, a shorter duration of star formation.
Although our simulations may not perfectly replicate the extent of star formation in the observed Magellanic UFDs, the fact that patchy reionization can extend the duration of star formation to a greater extent than homogeneous reionization is in line with the findings of Sacchi et al. (2021). For instance, the quenching times of the simulated UFDs with extended SFHs (Halo2-PR, Halo4-PR, and Halo5-PR), on average, are Gyr ago, compared to Gyr ago for the runs with homogeneous reionization, resulting in a difference of 460 Myr. The observed difference in quenching time between non-Magellanic and Magellanic UFDs, approximately 600 Myr, aligns with our findings and lends support to theoretical models suggesting that the SFHs of MW satellite galaxies may exhibit hints of patchy reionization during the early Universe.
In summary, our simulation results suggest that the extended SFHs of Magellanic UFDs, as reconstructed through a color-magnitude diagram, may be attributed to a non-uniform reionization effect or halo mass. Galaxies within massive halos can overcome the suppression of star formation by reionization, leading to longer star formation duration. However, given the negligible difference in stellar masses between Magellanic and non-Magellanic UFDs, the prolonged SFHs of Magellanic UFDs are more likely due to patchy reionization effects. The fact that approximately 90% of the stellar mass of Magellanic UFDs is estimated to have formed before reionization, and the remaining 10% during the period of patchy reionization, suggests that the intensity of patchy reionization was moderate, and star formation was not bursty. If star formation were to burst, the dense gas would have been dissipated by the powerful SN feedback, leading to shortened SFHs. Alternatively, it could be interpreted that the transition from patchy to global reionization occurred at a late time. However, such a scenario would result in higher stellar masses than those observed in Magellanic UFDs.
3.4.2 Stellar metallicity
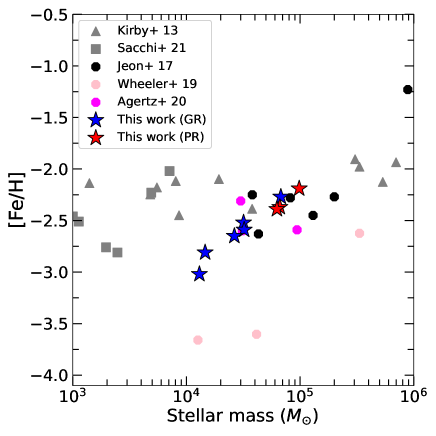
Figure 12 presents a comparison of the estimated stellar mass and averaged [Fe/H] relation of our simulated UFDs, indicated both by blue and red filled stars, with those from other hydrodynamic simulations (Jeon et al., 2017; Wheeler et al., 2019; Agertz et al., 2020) and observations (Kirby et al., 2013; Sacchi et al., 2021). Our simulation results show that the estimated [Fe/H] values range from for stellar masses between and . We find that the averaged [Fe/H] value of the runs with homogeneous reionization, , is lower by 0.32 dex than that of the cases with patchy reionization. It is important to note that only three runs (Halo2-PR, Halo4-PR, Halo5-PR) are considered for the patchy reionization cases since only these runs exhibit the impact of patchy reionization.
Theoretical studies tend to predict lower [Fe/H] values for UFDs with stellar masses in the range of compared to the observed values. In order to bridge the gap between observation and theory, several theoretical studies have been conducted. For example, Wheeler et al. (2019) suggested that this discrepancy in metallicity might be due to the neglect of Pop III or a lack of environmental pre-enrichment. In addition, Jaacks et al. (2019) demonstrated that pre-enrichment by Pop III is insufficient to raise the metallicity floor above , particularly in low-density regions. On the other hand, Applebaum et al. (2021), who adopted the same metallicity floor, successfully reproduced considerably more metal-enriched galaxies than Wheeler et al. (2019). Furthermore, strong feedback from SNe may also contribute to the low metallicity, as Agertz et al. (2020) showed that SNe feedback could expel enriched gas out of the galaxy, thereby reducing the metallicity of the gas.
Our simulation results are also in line with other theoretical works, given that the predicted values are lower than what is observed. For example, the estimated for the smallest galaxy in our simulations, with , is around , which is on average 0.5 dex lower than the observed values for UFDs with similar stellar masses. While implementing patchy reionization in our simulations can increase the stellar metallicities due to the formation of relatively high-metallicity stars during late star formation, it also leads to an increase in the stellar masses.
In Figure 13, we compare the MDF of our simulated UFDs, shown as a blue histogram, with that of the observed UFDs, specifically Reticulum II and Canes Venatici I. These observed UFDs have estimated stellar masses of and , respectively. The metallicity measurements for Reticulum II and Canes Venatici I are provided by the Stellar Abundances for Galactic Archaeology (SAGA) database (Suda et al., 2008). Both the simulated UFDs and Reticulum II consist mainly of metal-poor stars, spanning a metallicity range from to . Despite the substantial difference in stellar mass between Reticulum II and the simulated galaxies (with a mean stellar mass of ), the mean metallicity of member stars in Reticulum II () is comparable to that of the simulated galaxies (). As illustrated in Figure 11, Reticulum II, which is one of the Magellanic UFDs expected to show the effect of patchy reionization, is likely to have formed the majority of its stars () before reionization, with only 10% of its stars forming during the late star formation phase. On the contrary, Canes Venatici I, which is approximately twice as massive as the simulated galaxy, is likely to display a wide range of metallicities, including stars with relatively high metallicity at .
The formation of relatively high-metallicity stars () may not always occur at a later epoch when the global cosmic enrichment is achieved. Instead, during the rapid assembly process, even before reionization, high-metallicity stars can form from gas that has not had enough time to mix or diffuse into the surrounding gas. Note, however, that such a scenario is not demonstrated in our simulations. Furthermore, as demonstrated in Figure 7, we find that stars formed during the late star formation phase tend to have metallicities similar to or lower than those formed before reionization. This is because even a weak patchy reionization can temporally suppress star formation between , during which metals in the dense gas are dispersed by reionization, resulting in subsequent stars forming with lower metallicity.
3.4.3 Orbital histories of the observed UFDs
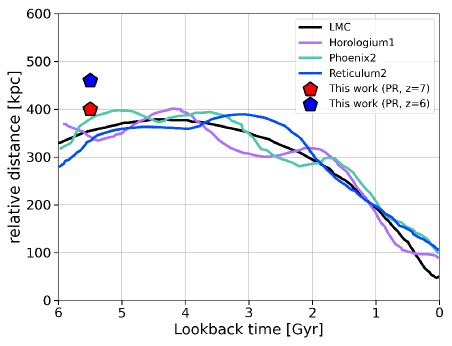
In order to investigate how far the simulated galaxy was from its host halo at the time of reionization, we show the average distance of the simulated galaxy with respect to its host halo at and , marked as pentagon symbols in Figure 14. We compare these distances with the orbital histories of Magellanic UFD satellites and the LMC itself over the past 6 Gyr. The solid lines in Figure 14 represent the reconstructed orbital histories of selected Magellanic satellites (Horologium 1, Phoenix 2, and Recticulum 2), derived from Gaia DR2 proper motion measurements, by taking into account the combined gravitational effects of the MW, LMC, and SMC (Patel et al., 2020). These results suggest that the LMC is currently on a first infall, long-period orbit and that its recent pericenter occurred 50 Myr ago, assuming an MW mass of . Moreover, the farthest distance from the MW over the last 6 Gyr is around 360 kpc. It should be noted that the unit of length used is physical rather than comoving units.
To make a more precise comparison with our simulations, it would be useful to have knowledge of the distances between the LMC and its associated satellites and the MW progenitor halo at earlier times than 6 Gyr. However, this is challenging as it requires a sophisticated orbital model that considers the mass evolution of MW-like galaxies, which have acquired roughly 80% of their mass by 6 Gyr (e.g., Santistevan et al., 2020). Moreover, according to Patel et al. (2017), results obtained from further orbit integration earlier than 6 Gyr may deviate from the predictions made by cosmological simulations. Despite this, we can anticipate that the LMC and its satellites were located far away during reionization since they appear to be currently undergoing their first infall (e.g., Busha et al., 2011; Patel et al., 2017, 2020). In particular, Patel et al. (2017) studied LMC analogs in Illustris simulations (e.g., Vogelsberger et al., 2014; Nelson et al., 2015) and calculated the cross time, which refers to the lookback time when the LMC initially crossed the physical virial radius of the MW while moving inward. Their analysis revealed that 40% of LMC analogs had a cross time of less than 2 Gyr ago, while about 20% had a crossing time of less than 4 Gyr ago. These results suggest that the LMC experienced its first infall relatively recently and was located far away from the MW progenitor halo at earlier times.
Based on the reconstructed orbital histories of Magellanic systems, there is a possibility that the UV intensity field used in our simulated galaxy is underestimated when compared to what the LMC satellites received. This is because the UV field in our simulation is mainly attributed to the MW-like host, and the contribution of the LMC is not adequately taken into account. If the LMC satellites were long-term satellites that were captured early on, their proximity to the LMC would have made the UV intensity from the LMC potentially significant. Patel et al. (2020) classified the satellites associated with the LMC into two categories based on the number of passages around the LMC, which depends on the masses of the MW and LMC and the inclusion of the SMC’s contribution. Reticulum II and Phoenix II are believed to be recently captured systems as they completed one bound orbit around the MCs in the last 1 Gyr, while Horologium I is classified as a long-term satellite as it completed multiple passages around the MCs in the last 6 Gyr. Considering the above information, it is possible that the local UV field intensity by the LMC may not have had a significant effect on the recently captured LMC satellites because the LMC was relatively more distant at the time of reionization. However, in the case of long-term satellites like Horologium I, the LMC might have contributed to quenching star formation due to its own potentially significant UV intensity.
4 Summary and Conclusions
We have conducted a study to examine how patchy reionization affects the star formation histories (SFHs) and stellar metallicity of ultra-faint dwarfs (UFDs) by utilizing a set of cosmological hydrodynamic zoom-in simulations. Our study is motivated by recent findings by Sacchi et al. (2021), who proposed that the contrasting SFHs between long-established Milky Way (MW) UFDs and recently entered ones could be attributed to the influence of patchy reionization. Specifically, the extended SFH observed in the Magellanic UFD satellites, which are estimated to have entered the MW’s potential about 3.5 Gyr ago based on their orbital histories reconstructed using Gaia proper motion measurements, is thought to be a result of environmental factors, such as a weaker UV field during the reionization epoch compared to that experienced by the long-established MW satellites. Although patchy reionization could play a crucial role in shaping the formation and evolution of UFDs, the most common implementation of the reionization effect is simplistic, applying a uniform and instantaneous global heating to all galaxies within the simulation box without accounting for the relative distances between a target UFD and its surrounding galaxies.
We employ a novel method to account for the impact of local UV fields on a target UFD analog by surrounding galaxies, particularly its host galaxy. This method involves three steps to calculate the effects of patchy reionization. First, we conduct dark-matter-only simulations to identify a target UFD analog halo and track its distance from surrounding halos, as well as their halo masses. Second, we use the abundance-matching technique to determine the stellar masses of the surrounding halos. Third, we obtain synthetic galaxy spectra for the surrounding galaxies from Starburst99 to derive flux and subsequently calculate the photoionization and photoheating rates for hydrogen and helium atoms. We then perform cosmological hydrodynamic zoom-in simulations using these rates, which are provided in a table as a function of redshift. To clarify, our study involves a series of simulations that compare two models: one that employs homogeneous global reionization (GR) and another that uses a hybrid approach. The hybrid approach starts with patchy reionization and then switches to global reionization implementation below a transition redshift (referred to as PR).
Our main findings are summarized as follows.
-
•
Global reionization effect
-
–
We confirm that reionization has a significant effect in suppressing star formation in the simulated UFDs. This is evidenced by the significant decrease in the maximum gas densities of all halos by two orders of magnitude from to , which hinders the formation of new stars and results in no star formation in all halos below .
-
–
The amount of gas loss due to reionization depends on the halo mass at the onset of reionization. For instance, Halo5-GR, the most massive halo at , retains a gas mass of 1.3 107, which is three times larger than that of the other halos, while Halo2-GR loses approximately 90% of its gas mass ( at ) between and .
-
–
Our results indicate that stars with higher metallicities () are challenging to form due to the combined effects of supernova feedback and reionization. Moreover, we find that stars with extremely low metallicities () are formed through external metal enrichment.
-
–
-
•
Patchy reionization effect
-
–
Most halos experience a temporary halt of star formation due to the patchy UV field during the PR runs, except for Halo5-PR. However, the reduced intensity of patchy reionization, which is about two orders of magnitude lower than that in the GR scenario, allows the gas density to recovering to a level that enables star formation to resume in some PR cases.
-
–
The occurrence of complete quenching or late star formation depends on the halo mass at the onset of reionization at . For example, halos with higher masses, such as Halo2-PR, Halo4-PR, and Halo5-PR, exhibit late star formation, while less massive halos, like Halo1-PR and Halo3-PR, experience complete quenching.
-
–
The simulated halos, Halo2-PR, Halo4-PR, and Halo5-PR, undergo late star formation and form a significant portion of their total stellar mass before . Specifically, they form 60%, 35%, and 80% of the total stellar mass, respectively. Halo5-PR is unique in having a significantly longer star formation history, extending 550 Myr since , compared to 280 Myr in Halo2-PR and 180 Myr in Halo4-PR.
-
–
Multiple factors, such as the halo mass at the time of reionization, the duration of star formation, and the degree of star formation burstiness, influence the fraction of stars formed during late star formation.
-
–
The in-situ stars formed through late star formation tend to have metallicities similar to or lower than the peak [Fe/H] of stars formed before reionization despite being formed at lower redshifts. This is due to the temporary quenching experienced by the simulated galaxies under the influence of a weak patchy reionization effect, which causes the dissipation of dense gas and the loss of associated metals.
-
–
Our simulations indicate that by delaying the transition from PR to GR from to , the SFHs are more extended with an average extension of 235 Myr. This prolonged period of star formation results in an increase in stellar mass, with a 63% increase, observed in Halo4-PR. Moreover, we find that the average metallicity of the UFD increases proportionally to the fraction of late star formation, causing the metallicity distribution function to shift toward higher metallicity by 0.2 dex.
-
–
-
•
Comparison with observations
-
–
We find that is similar between Magellanic UFDs and PR-z5.5 runs, indicating that 90% of stars are formed by in both cases. However, the shape of the SFHs differs between the two, with Magellanic UFDs forming stars earlier than the PR-z5.5 runs, with occurring 13.5 Gyr ago and 12.7 Gyr ago, respectively.
-
–
Our simulations are consistent with the idea proposed by Sacchi et al. (2021) that patchy reionization could substantially extend the duration of star formation in UFDs. The quenching times of UFD analogs with extended SFHs in our PR runs adopting are 460 Myr later than those in the GR runs, similar to the 600 Myr more recent quenching times of Magellanic UFDs compared to non-Magellanic UFDs.
-
–
Our simulations do not perfectly reproduce the absolute duration of late star formation observed in Magellanic UFDs. As such, the observed Magellanic UFDs exhibit a longer period of star formation, with a star formation cessation () occurring 8.5 Gyr ago, whereas the PR runs indicate a mean of 12.5 Gyr ago. This discrepancy in could potentially be attributed to the comparatively milder reionization experienced by the Magellanic UFDs within their specific environment.
-
–
Reproducing the high metallicity plateau of below , which is the mass range of Magellanic UFDs used for comparison, is challenging in our simulations. While patchy reionization can increase stellar metallicities by forming high-metallicity stars during late star formation, it also leads to an increase in stellar masses.
-
–
The prolonged SFHs of the Magellanic UFDs with 8.5 Gyr ago could imply that the strength of the UV field they were subjected to might have been lower than the assumptions made in our PR runs. This discrepancy could suggest that the Magellanic UFDs were positioned farther away than the inferred distance of 400 kpc, based on reconstructed orbital histories at .
-
–
It is important to emphasize that the weakened UV background resulting from patchy reionization is not the sole explanation for the extended SFHs, and various factors can contribute to differing SFHs of dwarf galaxies. For instance, Rey et al. (2020) demonstrated that UFDs formed in halos with the same halo mass but varying assembly times can exhibit similar stellar masses while having distinct SFHs. To be specific, their study revealed that star formation can be reignited at later epochs () due to a significant increase in dynamical mass during these late periods. However, it is worth noting that the halos in their study have a mass of at , which is 2-4 times more massive than those in our research. In a fair comparison, the least massive galaxy among their halos, with a mass of at , similar to Halo5 in our study, also experiences complete quenching due to reionization.
As such, the mass of the halo is one of the crucial determinants of whether stars continue to form under the influence of reionization, leading to a minimum mass below which star formation is likely to be entirely quenched. This threshold varies from (e.g., Jeon et al., 2017; Rey et al., 2020) to (e.g., Fitts et al., 2017; Wheeler et al., 2019. However, explaining the extended SFHs of the observed Magellanic UFDs by adopting more massive halos presents a significant challenge. This is primarily because the estimated stellar mass of the Magellanic UFDs, which is on the order of a few , is too small to be hosted in massive halos with . Theoretical predictions generally suggest that is required to produce a stellar mass of . However, as mentioned earlier, within this mass range, the effects of reionization are likely to result in complete quenching when adopting the conventional UV background (HM2012). Therefore, the extended SFHs observed in the Magellanic UFDs are more likely a consequence of encountering a weak UV field during the reionization epoch rather than being hosted by highly massive halos. Moreover, if massive halos are indeed the cause, an even weaker UV field than what we have adopted would be required to generate the more prolonged SFHs observed in the Magellanic UFDs.
One possible approach to diminish the intensity of the UV field is to consider an alternative escape fraction of ionizing photons from galaxies, rather than the currently adopted value of . A lower escape fraction would result in more extended SFHs (refer to Appendix C). It has been suggested that there may be a correlation between star formation rate and escape fraction and that the escape fraction may evolve with redshift (e.g., Kuhlen & Faucher-Giguère, 2012). According to Ma et al. (2020), for instance, the average escape fraction of ionizing photons from galaxies increases with halo mass for , remains roughly constant, , for , and then drops for due to dust attenuation, with an of less than 0.1 at the massive end.
Finally, we would like to emphasize that we are not claiming that our patchy reionization model surpasses the HM2012 model, primarily because we did not incorporate the influence of galaxies on a large scale. However, it is important to note that previous simulations, especially those concentrated on UFD galaxy formation, have typically employed a flash-like reionization approach that affects all gas particles, resulting in an abrupt cessation of star formation within UFDs. In contrast, our approach in this study considers the unique environments of the simulated UFD analogs, allowing us to test the patchy reionization model as a potential explanation for the extended SFHs observed in Magellanic UFDs. To further validate our predictions regarding the effect of patchy reionization on the SFHs of observed UFDs, additional SFHs for satellite galaxies would be beneficial. The forthcoming SFHs for Magellanic satellites, obtained from deep HST and JWST imaging, will help identify differences between the SFHs of Magellanic UFDs and long-standing satellites of the MW. Additionally, spectroscopic surveys could provide more accurate constraints on metallicities and enable us to estimate more precise ages of stars.
Acknowledgements
We would like to thank Gurtina Besla for providing valuable comments. We are grateful to Volker Springel, Joop Schaye, and Claudio Dalla Vecchia for permission to use their versions of gadget. J. L. and M. J. are supported by the National Research Foundation (NRF) grant No. 2021R1A2C109491713, funded by the Korean government (MSIT). Y.C. acknowledges support from NASA grant No. HST-GO-16293.
Appendix A Results of the UFD analogs with two different reionization implementations
| Halo | |||||||||
|---|---|---|---|---|---|---|---|---|---|
| - | - | - | - | - | [Myr] | ||||
| Halo1-GR | 1.97 | 1.30 | -3.02 | 6.52 | - | 7.036 | - | - | - |
| Halo1-PR-z5.8 | 1.97 | 1.36 | -2.98 | 6.89 | 5.8 | 7.036 | 6.639 | 6.639 | - |
| Halo1-PR-z5.7 | 1.97 | 1.36 | -2.98 | 6.93 | 5.7 | 7.036 | 6.639 | 6.639 | - |
| Halo1-PR-z5.6 | 1.97 | 1.36 | -2.98 | 6.96 | 5.6 | 7.036 | 6.639 | 6.639 | - |
| Halo1-PR-z5.5 | 1.97 | 1.36 | -2.98 | 7.02 | 5.5 | 7.036 | 6.639 | 6.639 | - |
| Halo2-GR | 3.17 | 3.18 | -2.52 | 2.03 | - | 6.998 | - | - | - |
| Halo2-PR-z5.8 | 3.17 | 5.07 | -2.45 | 2.16 | 5.8 | 6.953 | 6.034 | 4.933 | 277 |
| Halo2-PR-z5.7 | 3.17 | 5.98 | -2.40 | 2.20 | 5.7 | 6.953 | 6.034 | 4.876 | 295 |
| Halo2-PR-z5.6 | 3.17 | 5.85 | -2.40 | 2.22 | 5.6 | 6.953 | 6.034 | 4.885 | 292 |
| Halo2-PR-z5.5 | 3.17 | 6.63 | -2.37 | 2.22 | 5.5 | 6.953 | 6.034 | 4.909 | 284 |
| Halo3-GR | 3.89 | 2.64 | -2.65 | 2.96 | - | 7.106 | - | - | - |
| Halo3-PR-z5.8 | 3.89 | 2.64 | -2.65 | 3.32 | 5.8 | 7.106 | - | - | - |
| Halo3-PR-z5.7 | 3.89 | 2.64 | -2.65 | 3.39 | 5.7 | 7.106 | - | - | - |
| Halo3-PR-z5.6 | 3.89 | 2.64 | -2.65 | 3.44 | 5.6 | 7.106 | - | - | - |
| Halo3-PR-z5.5 | 3.89 | 2.64 | -2.65 | 3.46 | 5.5 | 7.106 | - | - | - |
| Halo4-GR | 3.87 | 1.46 | -2.81 | 4.07 | - | 7.037 | - | - | - |
| Halo4-PR-z5.8 | 3.87 | 3.84 | -2.59 | 4.26 | 5.8 | 7.037 | 6.223 | 5.430 | 174 |
| Halo4-PR-z5.7 | 3.87 | 4.82 | -2.48 | 4.31 | 5.7 | 7.037 | 6.223 | 4.831 | 346 |
| Halo4-PR-z5.6 | 3.87 | 4.94 | -2.48 | 4.27 | 5.6 | 7.037 | 6.223 | 5.313 | 205 |
| Halo4-PR-z5.5 | 3.87 | 6.25 | -2.39 | 4.35 | 5.5 | 7.037 | 6.223 | 4.639 | 411 |
| Halo5-GR | 5.35 | 6.77 | -2.27 | 7.68 | - | 6.917 | - | - | - |
| Halo5-PR-z5.8 | 5.35 | 8.38 | -2.22 | 9.66 | 5.8 | 6.859 | 6.630 | 4.454 | 550 |
| Halo5-PR-z5.7 | 5.35 | 8.77 | -2.21 | 9.19 | 5.7 | 6.859 | 6.630 | 5.113 | 332 |
| Halo5-PR-z5.6 | 5.35 | 9.03 | -2.20 | 10.04 | 5.6 | 6.859 | 6.630 | 4.638 | 483 |
| Halo5-PR-z5.5 | 5.35 | 9.82 | -2.19 | 12.91 | 5.5 | 6.859 | 6.630 | 3.566 | 974 |
| Halo6-GR | 4.95 | 3.22 | -2.59 | 5.75 | - | 6.895 | - | - | - |
| Halo6-PR-z5.8 | 4.95 | 3.74 | -2.69 | 6.47 | 5.8 | 7.040 | - | - | - |
| Halo6-PR-z5.7 | 4.95 | 3.74 | -2.69 | 6.90 | 5.7 | 7.040 | - | - | - |
| Halo6-PR-z5.6 | 4.95 | 3.80 | -2.69 | 6.64 | 5.6 | 6.990 | - | - | - |
| Halo6-PR-z5.5 | 4.95 | 3.80 | -2.69 | 6.78 | 5.5 | 6.990 | - | - | - |
Note. — Column (1): the name of the halo. Column (2): viral mass (in units of ). Column (3): stellar mass (in ). Column (4): average stellar iron-to-hydrogen ratios. Column (5): gas mass (in units of ). Column (6): transition time. Column (7): the time that the simulated UFDs are quenched by reionization at . Column (8): the time of beginning late star formation. Column (9): the time of completing late star formation. Column (10): duration of late star formation.
Appendix B The strength of patchy reionization on a large scale
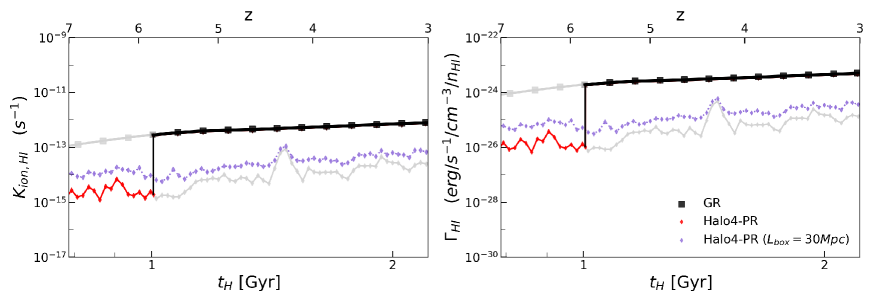
Appendix C The effect of escape fraction on SFHs
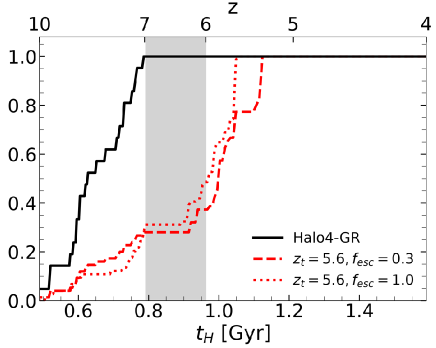
References
- Agertz & Kravtsov (2015) Agertz, O., & Kravtsov, A. V. 2015, ApJ, 804, 18, doi: 10.1088/0004-637X/804/1/18
- Agertz et al. (2020) Agertz, O., Pontzen, A., Read, J. I., et al. 2020, MNRAS, 491, 1656, doi: 10.1093/mnras/stz3053
- Applebaum et al. (2021) Applebaum, E., Brooks, A. M., Christensen, C. R., et al. 2021, ApJ, 906, 96, doi: 10.3847/1538-4357/abcafa
- Barris & Tonry (2006) Barris, B. J., & Tonry, J. L. 2006, ApJ, 637, 427, doi: 10.1086/498292
- Becker et al. (2015) Becker, G. D., Bolton, J. S., Madau, P., et al. 2015, MNRAS, 447, 3402, doi: 10.1093/mnras/stu2646
- Becker et al. (2001) Becker, R. H., Fan, X., White, R. L., et al. 2001, AJ, 122, 2850, doi: 10.1086/324231
- Behroozi et al. (2013) Behroozi, P. S., Wechsler, R. H., & Conroy, C. 2013, ApJ, 770, 57, doi: 10.1088/0004-637X/770/1/57
- Bose et al. (2018) Bose, S., Deason, A. J., & Frenk, C. S. 2018, ApJ, 863, 123, doi: 10.3847/1538-4357/aacbc4
- Bouwens et al. (2015) Bouwens, R. J., Illingworth, G. D., Oesch, P. A., et al. 2015, ApJ, 803, 34, doi: 10.1088/0004-637X/803/1/34
- Brown et al. (2014) Brown, T. M., Tumlinson, J., Geha, M., et al. 2014, ApJ, 796, 91, doi: 10.1088/0004-637X/796/2/91
- Busha et al. (2011) Busha, M. T., Marshall, P. J., Wechsler, R. H., Klypin, A., & Primack, J. 2011, ApJ, 743, 40, doi: 10.1088/0004-637X/743/1/40
- Choi et al. (2020) Choi, Y., Dalcanton, J. J., Williams, B. F., et al. 2020, ApJ, 902, 54, doi: 10.3847/1538-4357/abb467
- Choudhury et al. (2015) Choudhury, T. R., Puchwein, E., Haehnelt, M. G., & Bolton, J. S. 2015, MNRAS, 452, 261, doi: 10.1093/mnras/stv1250
- Dalla Vecchia & Schaye (2012) Dalla Vecchia, C., & Schaye, J. 2012, MNRAS, 426, 140, doi: 10.1111/j.1365-2966.2012.21704.x
- Dixon et al. (2018) Dixon, K. L., Iliev, I. T., Gottlöber, S., et al. 2018, MNRAS, 477, 867, doi: 10.1093/mnras/sty494
- Fan et al. (2006) Fan et al. 2006, AJ, 131, 1203, doi: 10.1086/500296
- Faucher-Giguère et al. (2009) Faucher-Giguère, C.-A., Lidz, A., Zaldarriaga, M., & Hernquist, L. 2009, ApJ, 703, 1416, doi: 10.1088/0004-637X/703/2/1416
- Ferland et al. (1998) Ferland, G. J., Korista, K. T., Verner, D. A., et al. 1998, PASP, 110, 761, doi: 10.1086/316190
- Fitts et al. (2017) Fitts, A., Boylan-Kolchin, M., Elbert, O. D., et al. 2017, MNRAS, 471, 3547, doi: 10.1093/mnras/stx1757
- Förster et al. (2006) Förster, F., Wolf, C., Podsiadlowski, P., & Han, Z. 2006, MNRAS, 368, 1893, doi: 10.1111/j.1365-2966.2006.10258.x
- Garrison-Kimmel et al. (2019) Garrison-Kimmel, S., Wetzel, A., Hopkins, P. F., et al. 2019, MNRAS, 489, 4574, doi: 10.1093/mnras/stz2507
- Greif et al. (2009) Greif, T. H., Johnson, J. L., Klessen, R. S., & Bromm, V. 2009, MNRAS, 399, 639, doi: 10.1111/j.1365-2966.2009.15336.x
- Gutcke et al. (2022) Gutcke, T. A., Pakmor, R., Naab, T., & Springel, V. 2022, MNRAS, 513, 1372, doi: 10.1093/mnras/stac867
- Haardt & Madau (2012) Haardt, F., & Madau, P. 2012, ApJ, 746, 125, doi: 10.1088/0004-637X/746/2/125
- Hahn & Abel (2011) Hahn, O., & Abel, T. 2011, MNRAS, 415, 2101, doi: 10.1111/j.1365-2966.2011.18820.x
- Heger & Woosley (2002) Heger, A., & Woosley, S. E. 2002, ApJ, 567, 532, doi: 10.1086/338487
- Heger & Woosley (2010) —. 2010, ApJ, 724, 341, doi: 10.1088/0004-637X/724/1/341
- Hopkins et al. (2020) Hopkins, P. F., Grudić, M. Y., Wetzel, A., et al. 2020, MNRAS, 491, 3702, doi: 10.1093/mnras/stz3129
- Jaacks et al. (2019) Jaacks, J., Finkelstein, S. L., & Bromm, V. 2019, MNRAS, 488, 2202, doi: 10.1093/mnras/stz1529
- Jeon et al. (2017) Jeon, M., Besla, G., & Bromm, V. 2017, ApJ, 848, 85, doi: 10.3847/1538-4357/aa8c80
- Khaire et al. (2016) Khaire, V., Srianand, R., Choudhury, T. R., & Gaikwad, P. 2016, MNRAS, 457, 4051, doi: 10.1093/mnras/stw192
- Kimm & Cen (2014) Kimm, T., & Cen, R. 2014, ApJ, 788, 121, doi: 10.1088/0004-637X/788/2/121
- Kirby et al. (2013) Kirby, E. N., Cohen, J. G., Guhathakurta, P., et al. 2013, ApJ, 779, 102, doi: 10.1088/0004-637X/779/2/102
- Komatsu et al. (2011) Komatsu, E., Smith, K. M., Dunkley, J., et al. 2011, ApJS, 192, 18, doi: 10.1088/0067-0049/192/2/18
- Kuhlen & Faucher-Giguère (2012) Kuhlen, M., & Faucher-Giguère, C.-A. 2012, MNRAS, 423, 862, doi: 10.1111/j.1365-2966.2012.20924.x
- Leitherer et al. (1999) Leitherer, C., Schaerer, D., Goldader, J. D., et al. 1999, ApJS, 123, 3, doi: 10.1086/313233
- Ma et al. (2016) Ma, X., Hopkins, P. F., Kasen, D., et al. 2016, MNRAS, 459, 3614, doi: 10.1093/mnras/stw941
- Ma et al. (2020) Ma, X., Quataert, E., Wetzel, A., et al. 2020, MNRAS, 498, 2001, doi: 10.1093/mnras/staa2404
- Marigo (2001) Marigo, P. 2001, A&A, 370, 194, doi: 10.1051/0004-6361:20000247
- Martin et al. (2007) Martin, N. F., Ibata, R. A., Chapman, S. C., Irwin, M., & Lewis, G. F. 2007, MNRAS, 380, 281, doi: 10.1111/j.1365-2966.2007.12055.x
- McConnachie (2012) McConnachie, A. W. 2012, AJ, 144, 4, doi: 10.1088/0004-6256/144/1/4
- McGreer et al. (2015) McGreer, I. D., Mesinger, A., & D’Odorico, V. 2015, MNRAS, 447, 499, doi: 10.1093/mnras/stu2449
- Mesinger et al. (2015) Mesinger, A., Aykutalp, A., Vanzella, E., et al. 2015, MNRAS, 446, 566, doi: 10.1093/mnras/stu2089
- Meštrić et al. (2021) Meštrić, U., Ryan-Weber, E. V., Cooke, J., et al. 2021, MNRAS, 508, 4443, doi: 10.1093/mnras/stab2615
- Mitra et al. (2015) Mitra, S., Choudhury, T. R., & Ferrara, A. 2015, MNRAS, 454, L76, doi: 10.1093/mnrasl/slv134
- Naidu et al. (2022) Naidu, R. P., Matthee, J., Oesch, P. A., et al. 2022, MNRAS, 510, 4582, doi: 10.1093/mnras/stab3601
- Nelson et al. (2015) Nelson, D., Pillepich, A., Genel, S., et al. 2015, Astronomy and Computing, 13, 12, doi: 10.1016/j.ascom.2015.09.003
- Norris et al. (2010) Norris, J. E., Wyse, R. F. G., Gilmore, G., et al. 2010, ApJ, 723, 1632, doi: 10.1088/0004-637X/723/2/1632
- Oñorbe et al. (2017) Oñorbe, J., Hennawi, J. F., & Lukić, Z. 2017, ApJ, 837, 106, doi: 10.3847/1538-4357/aa6031
- Omukai (2000) Omukai, K. 2000, ApJ, 534, 809, doi: 10.1086/308776
- Osterbrock & Ferland (2006) Osterbrock, D. E., & Ferland, G. J. 2006, Astrophysics of gaseous nebulae and active galactic nuclei (CA: University Science Books), ed. Osterbrock, D. E. & Ferland, G. J.
- Padmanabhan (1993) Padmanabhan, T. 1993, Structure Formation in the Universe
- Patel et al. (2017) Patel, E., Besla, G., & Sohn, S. T. 2017, MNRAS, 464, 3825, doi: 10.1093/mnras/stw2616
- Patel et al. (2020) Patel, E., Kallivayalil, N., Garavito-Camargo, N., et al. 2020, ApJ, 893, 121, doi: 10.3847/1538-4357/ab7b75
- Pawlik & Schaye (2008) Pawlik, A. H., & Schaye, J. 2008, MNRAS, 389, 651, doi: 10.1111/j.1365-2966.2008.13601.x
- Pereira-Wilson et al. (2023) Pereira-Wilson, M., Navarro, J. F., Benítez-Llambay, A., & Santos-Santos, I. 2023, MNRAS, 519, 1425, doi: 10.1093/mnras/stac3633
- Planck Collaboration (2016) Planck Collaboration. 2016, A&A, 594, A13, doi: 10.1051/0004-6361/201525830
- Portinari et al. (1998) Portinari, L., Chiosi, C., & Bressan, A. 1998, A&A, 334, 505
- Puchwein et al. (2015) Puchwein, E., Bolton, J. S., Haehnelt, M. G., et al. 2015, MNRAS, 450, 4081, doi: 10.1093/mnras/stv773
- Rey et al. (2020) Rey, M. P., Pontzen, A., Agertz, O., et al. 2020, arXiv:2004.09530, arXiv:2004.09530. https://arxiv.org/abs/2004.09530
- Rosdahl et al. (2018) Rosdahl, J., Katz, H., Blaizot, J., et al. 2018, MNRAS, 479, 994, doi: 10.1093/mnras/sty1655
- Sacchi et al. (2021) Sacchi, E., Richstein, H., Kallivayalil, N., et al. 2021, ApJ, 920, L19, doi: 10.3847/2041-8213/ac2aa3
- Safranek-Shrader et al. (2016) Safranek-Shrader, C., Montgomery, M. H., Milosavljević, M., & Bromm, V. 2016, MNRAS, 455, 3288, doi: 10.1093/mnras/stv2545
- Sanati et al. (2023) Sanati, M., Jeanquartier, F., Revaz, Y., & Jablonka, P. 2023, A&A, 669, A94, doi: 10.1051/0004-6361/202244309
- Santistevan et al. (2020) Santistevan, I. B., Wetzel, A., El-Badry, K., et al. 2020, MNRAS, 497, 747, doi: 10.1093/mnras/staa1923
- Sawala et al. (2010) Sawala, T., Scannapieco, C., Maio, U., & White, S. 2010, MNRAS, 402, 1599, doi: 10.1111/j.1365-2966.2009.16035.x
- Schmidt (1959) Schmidt, M. 1959, ApJ, 129, 243, doi: 10.1086/146614
- Schneider & Omukai (2010) Schneider, R., & Omukai, K. 2010, MNRAS, 402, 429, doi: 10.1111/j.1365-2966.2009.15891.x
- Simon (2019) Simon, J. D. 2019, ARA&A, 57, 375, doi: 10.1146/annurev-astro-091918-104453
- Simpson et al. (2013) Simpson, C. M., Bryan, G. L., Johnston, K. V., et al. 2013, MNRAS, 432, 1989, doi: 10.1093/mnras/stt474
- Springel (2005) Springel, V. 2005, MNRAS, 364, 1105, doi: 10.1111/j.1365-2966.2005.09655.x
- Springel et al. (2001) Springel, V., White, S. D. M., Tormen, G., & Kauffmann, G. 2001, MNRAS, 328, 726, doi: 10.1046/j.1365-8711.2001.04912.x
- Stinson et al. (2007) Stinson, G. S., Dalcanton, J. J., Quinn, T., Kaufmann, T., & Wadsley, J. 2007, ApJ, 667, 170, doi: 10.1086/520504
- Suda et al. (2008) Suda, T., Katsuta, Y., Yamada, S., et al. 2008, PASJ, 60, 1159, doi: 10.1093/pasj/60.5.1159
- Tolstoy et al. (2009) Tolstoy, E., Hill, V., & Tosi, M. 2009, ARA&A, 47, 371, doi: 10.1146/annurev-astro-082708-101650
- Vogelsberger et al. (2014) Vogelsberger, M., Genel, S., Springel, V., et al. 2014, MNRAS, 444, 1518, doi: 10.1093/mnras/stu1536
- Weisz et al. (2014) Weisz, D. R., Dolphin, A. E., Skillman, E. D., et al. 2014, ApJ, 789, 147, doi: 10.1088/0004-637X/789/2/147
- Weisz et al. (2019) Weisz, D. R., Martin, N. F., Dolphin, A. E., et al. 2019, ApJ, 885, L8, doi: 10.3847/2041-8213/ab4b52
- Wheeler et al. (2019) Wheeler, C., Hopkins, P. F., Pace, A. B., et al. 2019, MNRAS, 490, 4447, doi: 10.1093/mnras/stz2887
- Wiersma et al. (2009) Wiersma, R. P. C., Schaye, J., Theuns, T., Dalla Vecchia, C., & Tornatore, L. 2009, MNRAS, 399, 574, doi: 10.1111/j.1365-2966.2009.15331.x
- Wyithe & Loeb (2003) Wyithe, J. S. B., & Loeb, A. 2003, ApJ, 586, 693, doi: 10.1086/367721
- Yajima et al. (2011) Yajima, H., Choi, J.-H., & Nagamine, K. 2011, MNRAS, 412, 411, doi: 10.1111/j.1365-2966.2010.17920.x