Tabular Representation, Noisy Operators, and Impacts on Table Structure Understanding Tasks in LLMs
Abstract
Large language models (LLMs) are increasingly applied for tabular tasks using in-context learning. The prompt representation for a table may play a role in the LLMs ability to process the table. Inspired by prior work, we generate a collection of self-supervised table structure understanding tasks (e.g. navigate to a cell and row; transpose the table) and evaluate the performance differences when using eight formats. In contrast to past work, we introduce eight noise operations inspired by real-world messy data and adversarial inputs, and show that these can impact LLM performance across formats for different structural understanding tasks.
1 Introduction
Recent progress in large language models (LLMs) has enabled substantial gains when performing data-related tasks, such as table question answering [6], semantic type annotation [12], and data wrangling [8]—often with just in-context learning. However, data is also messy. Tabular data often arrives in a semi-structured format, with inconsistent shapes, missing entries, and unnormalized or inconsistently formatted values. This makes the task of processing and understanding tabular data particularly challenging for any system, including LLMs. For example, based on product telemetry, 21% of Excel files imported using LLM-based Dataverse Copilot111https://powerapps.microsoft.com/en-us/blog/introducing-an-easier-than-ever-experience-to-import-data-from-excel/ were missing headers. Furthermore, in industrial settings, challenges such as privacy, compliance, and even potentially adversarial table inputs constrain how data can be handled and processed [3].
In this work we systematically explore the impact that the tabular representation format and real-world-inspired noise have on LLMs’ ability to perform basic structural table understanding tasks [13] through in-context learning. Like prior work, we generate self-supervised structural table tasks to assess structural understanding. In contrast to prior investigations, we incorporate eight noise-inducing operations—such as renaming columns or transposing the table—that manipulate the table’s structure in ways that emulate messy data [11] or even adversarial inputs.
We evaluate both fact-finding and transformation tasks over seven public datasets, eight table representations commonly used in data-science and eight noise-inducing operations. In contrast to prior work, we find that HTML does not seem to provide the best performance at fact-finding or transformation tasks. We find that a dataframe-based format (DFLoader) obtains the highest overall pass@1 (79.79%) in fact-finding tasks and the highest overall F1 score (98.55%) for transformation tasks. We find that applying noise operations to tables can affect performance in fact-finding and transformation tasks. For example, introducing semi-structured content impacts data type detection (e.g. JSON format’s pass@1 drops by 12.43%) and introducing sequential column naming can degrade performance for a column reordering task (e.g. comma-separated-value format’s F1 score degrades by 67.33%).
We believe future work can build on our findings by exploring the extent to which these structural table understanding tasks relate to downstream task performance. Furthermore, such work should include (and extend) our noise operations to evaluate the impact of structural changes.
In summary, our key contributions are:
-
1.
Extending self-supervised table structure understanding tasks by incorporating noise operations inspired by real-world noise
-
2.
An extensive evaluation over eight table formats and eight noise-inducing operations
-
3.
Our data and code to facilitate future work on structural table understanding
2 Related Work
Transformer architectures have led to state-of-the-art performance in NLP and other areas of machine learning. This has motivated a line of research developing transformer models designed for tabular tasks, such as table question answering. These models (e.g. TUTA [14], TAPAS [7]) are predominantly developed by training and fine-tuning on large corpus of data scraped from Wikipedia and introducing different attention mechanisms. Prior work [10] has carried out a detailed analysis of how these mechanisms work and how they affect table understanding tasks. In contrast, we focus on a general LLM (GPT3) rather than ones designed for table tasks and carry out our experiments using in-context learning. Importantly, we scope our experiments to understand the impact of table representation format (subject to noise operations) on self-supervised table structure tasks.
Prior work has used in-context learning to carry out tasks on tabular data. For example, TableLLM showed that LLMs can perform classification tasks over tabular datasets. Techniques like chain-of-thought [15] have been further refined in the context of tabular data [16, 5]. In contrast, we focus on self-supervised table structure tasks and consider the impact of table formats and the robustness to noise inspired by real-world data issues and adversarial behaviors.
The closest related work is [13], which examines LLM performance on structural understanding tasks as a function of different tabular formats. Our work extends this line of research with other formats, new fact-finding and transformation tasks, and noise operations inspired by messy data.
3 Methodology
To evaluate the extent to which different table representation formats and noise operations affect an LLM’s ability to correctly answer structural table understanding tasks, we generate a collection of self-supervised tasks (i.e. where we can derive the task and answer from the table without the need for annotation). We now describe this approach in detail.
Let be a flat table with a header, be a set of table representation formats (e.g. JSON), each of which transforms into a corresponding string representation for the prompt. Let be the set of noise operations (e.g. shuffle header names), each of which transforms into . Let be the set of self-supervised tasks (e.g. lookup the value at row X and column Y), each of which given a table generates a collection of self-supervised task question and answer pairs. We create an evaluation benchmark for a given table of the form . For each , we then compare to the LLM’s answer given and .
3.1 Table and Formats
Tables: We scope our experiments to flat tables with a header row. Furthermore, each column must contain a single datatype (e.g. string, numeric, date).
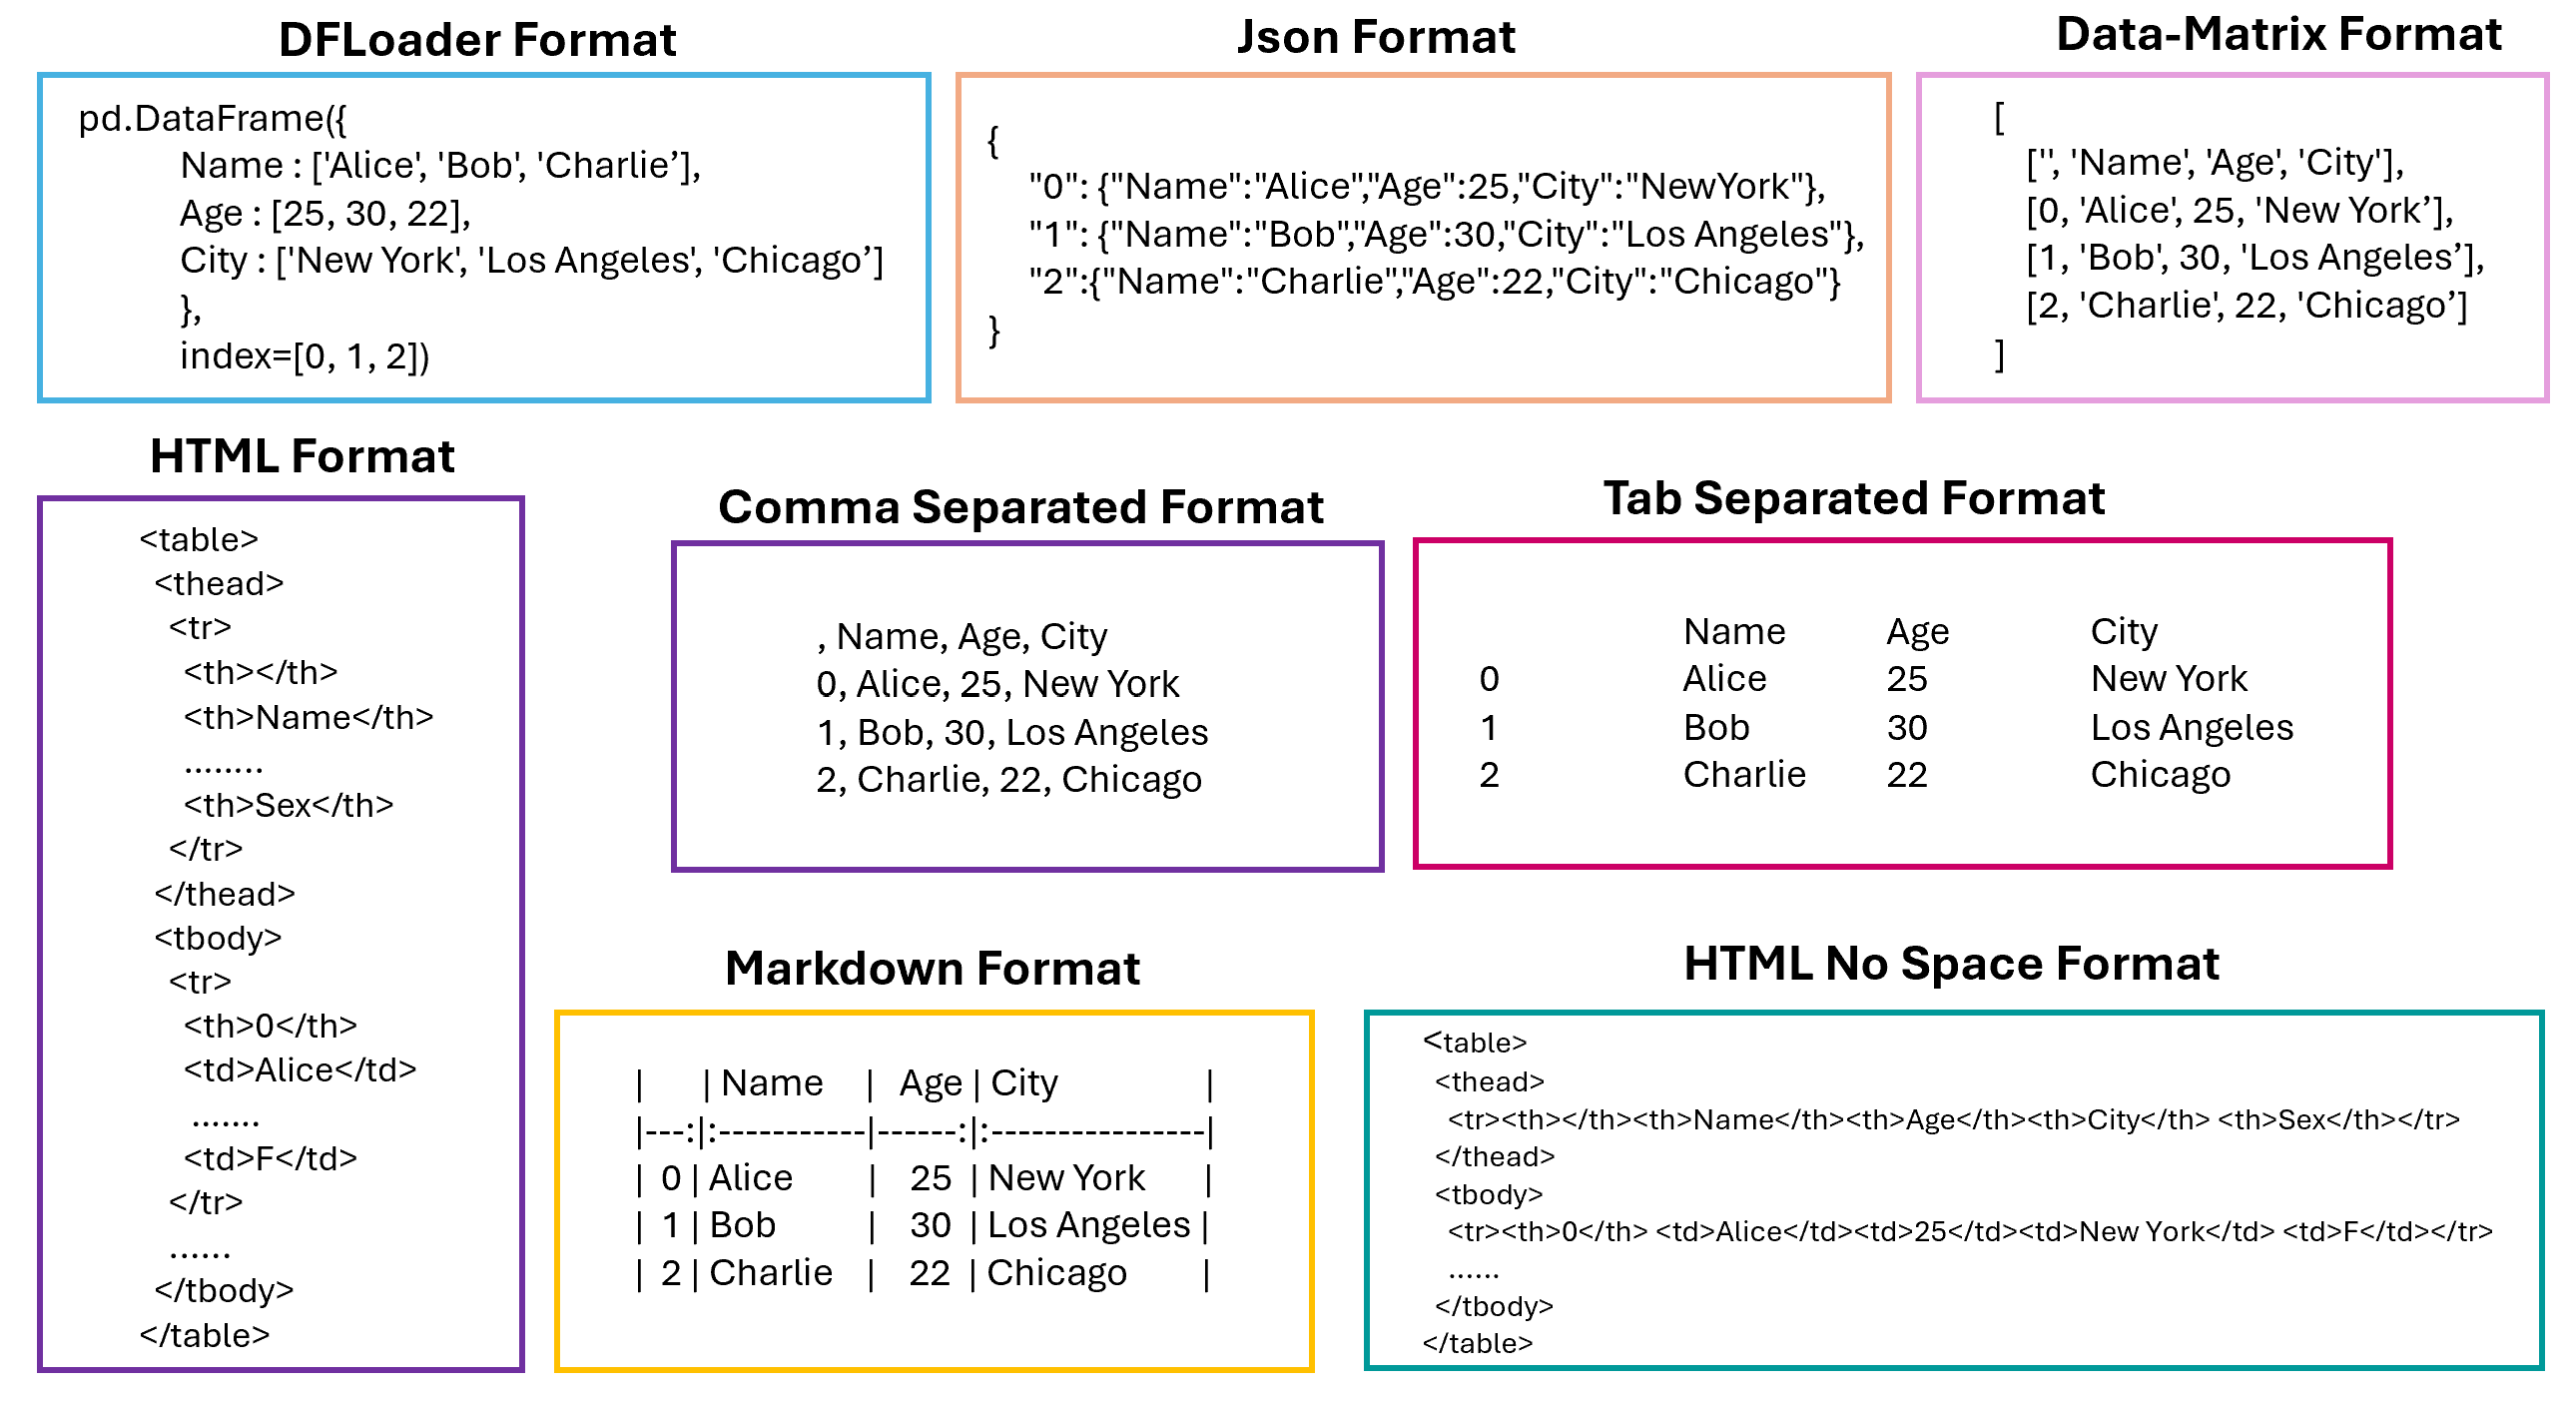
Formats: We represent these tables with the following 8 popular formats, summarized in Figure 1: DFLoader, JSON, Data-Matrix, Markdown, Comma-Separated-Values, and Tab-Separated-Values format. DFLoader corresponds to the associated Python code snippet to define the table using the Pandas DataFrame API. Data-Matrix format represents each row as a mixed-type list of values. HTML format represent the table using nested tags. HTML No Space inlines HTML by removing whitespaces. Note that our tables include both headers and row indices.
3.2 Noise Operations
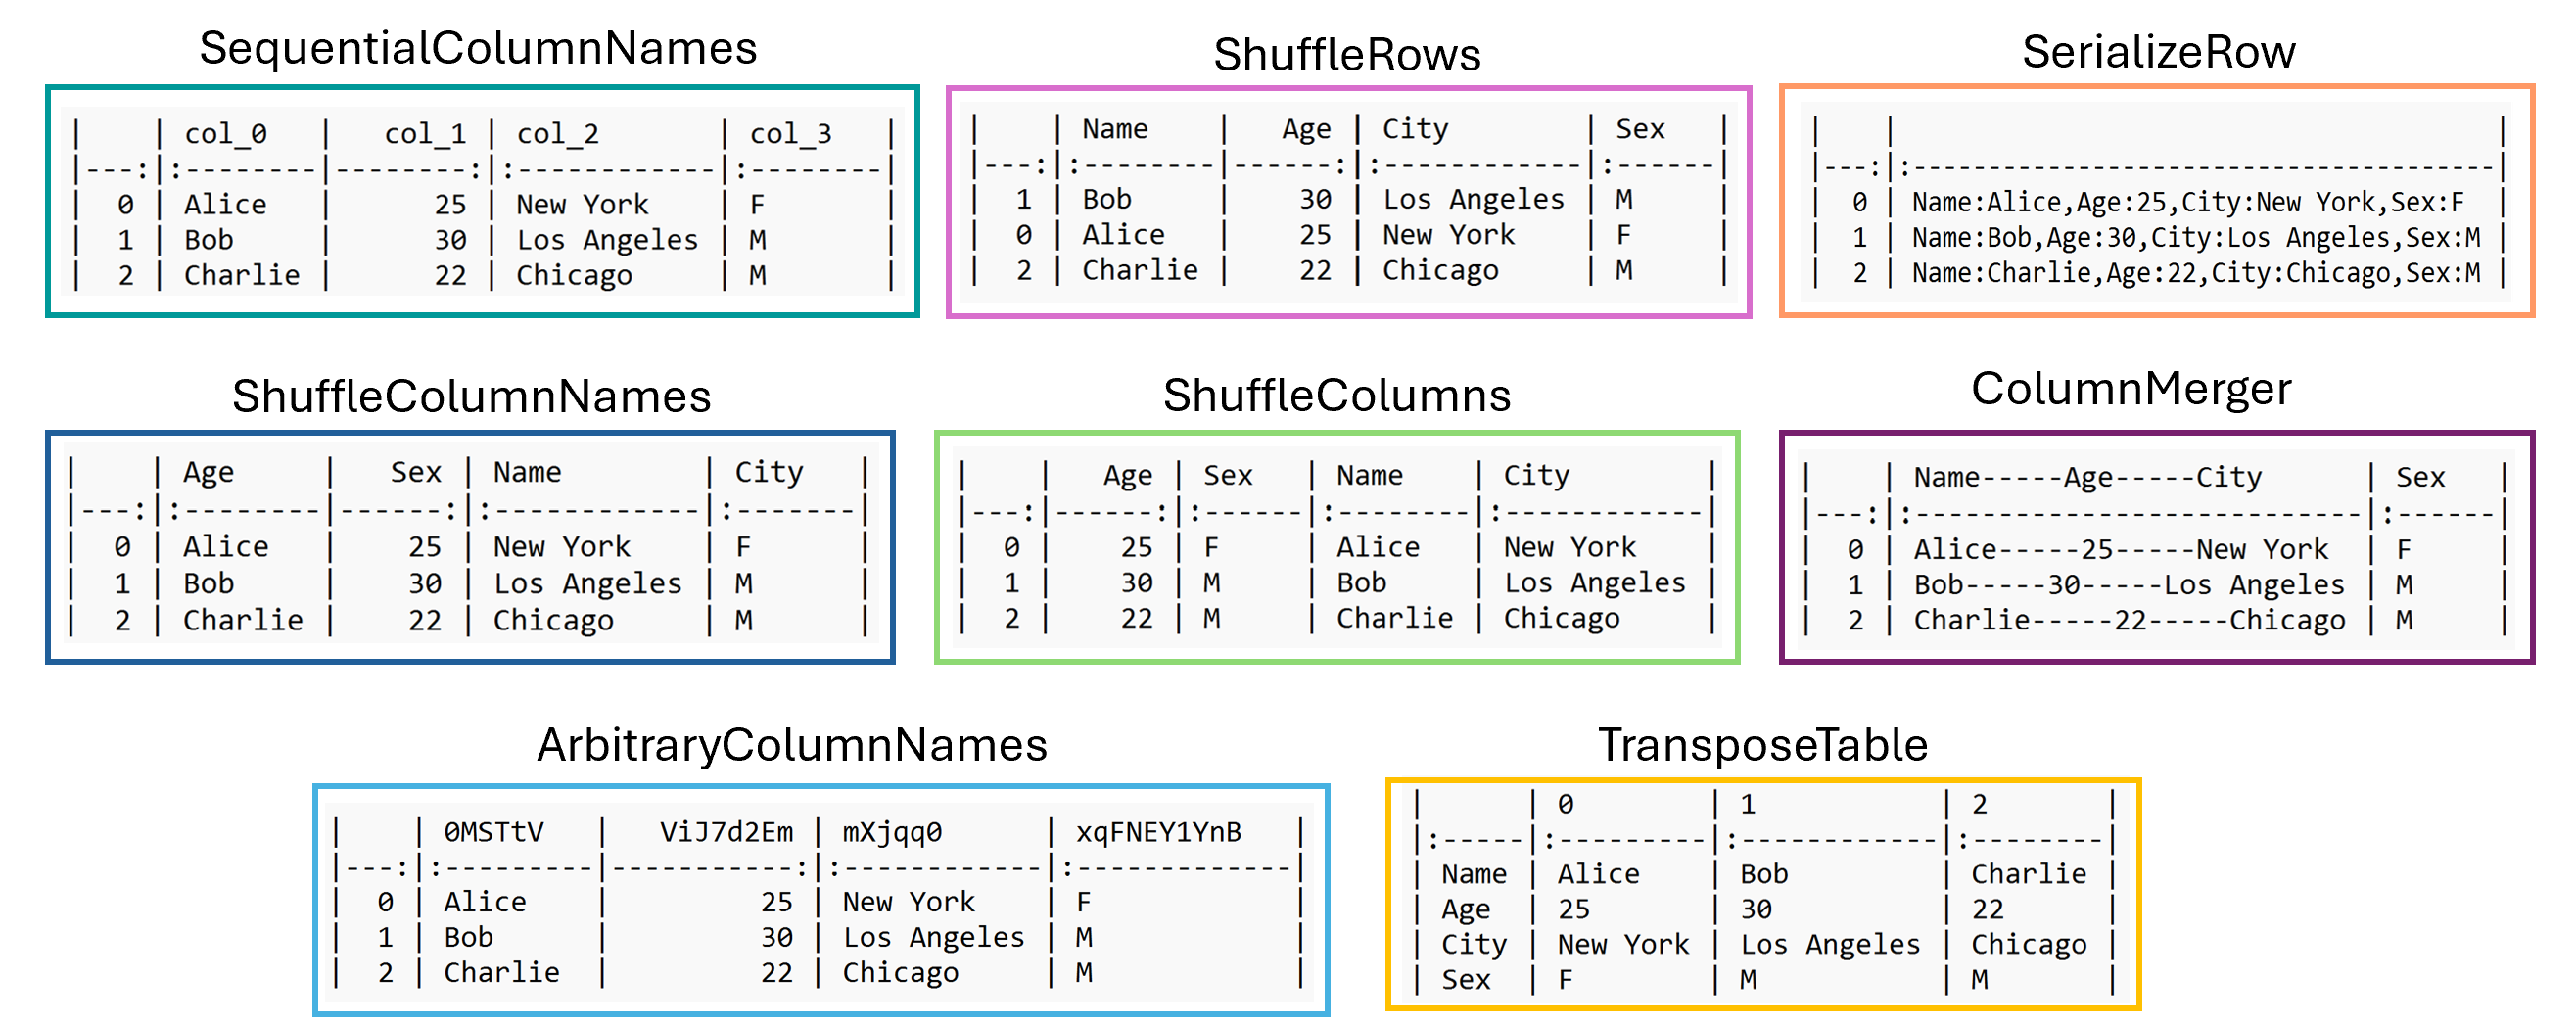
We explore the extent to which noise operations can impact the LLM’s ability to correctly perform structural table tasks under varying table representation formats. We design noise operators that emulate real world table challenges (e.g., uninformative sequential headers or merged cells) or even adversarial behavior (e.g. shuffled or arbitrary column names).
Spatial Invariance: Tables often need to be rearranged or transformed to be used. For example, long tables with many columns may need to be transposed to faciliate plotting or for better readability. Inspired by these challenges, we introduced the following noise operations:
-
•
ShuffleRows: We randomly reorder table rows.
-
•
ShuffleColumns: We randomize the order of columns within the table.
-
•
TransposeTable: We transpose the table.
Headers: Table headers often play an important role in table understanding, providing pseudo-natural language information about their content and facilitating referencing. However, in practice, user tables may not always have informative or consistent headers, or adversarial actors may remove header information altogether. To simulate such cases we introduce the following noise operations:
-
•
ArbitraryColumnNames: We arbitrarily rename headers to randomly drawn alphanumeric sequences.
-
•
SequentialColumnNames: We rename headers to sequential entries of the form col_0, col_1, so on.
-
•
ShuffleColumnNames: We shuffle header names, while keeping data intact.
Semi-structured Content: Tables may contain columns that have semi-structured content (e.g. phone numbers) or users may need to start by parsing the table from a semi-structured representation. To induce such semi-structured data we use two noise operations:
-
•
SerializeRow: We transform each row into a string of key-value pairs. The resulting table has only one column in it.
-
•
ColumnMerger: We merge randomly chosen 2, 3 and 4 contiguous columns together by adding (within each row) a —– between their values.
Figure 2 shows each of these noise operations applied to a table.
3.3 Self-Supervised Structural Tasks
We employ self-supervised structural tasks [13], which can be automatically generated, to evaluate the extent to which formats and noise operations affect the LLM’s ability to understand table structure.
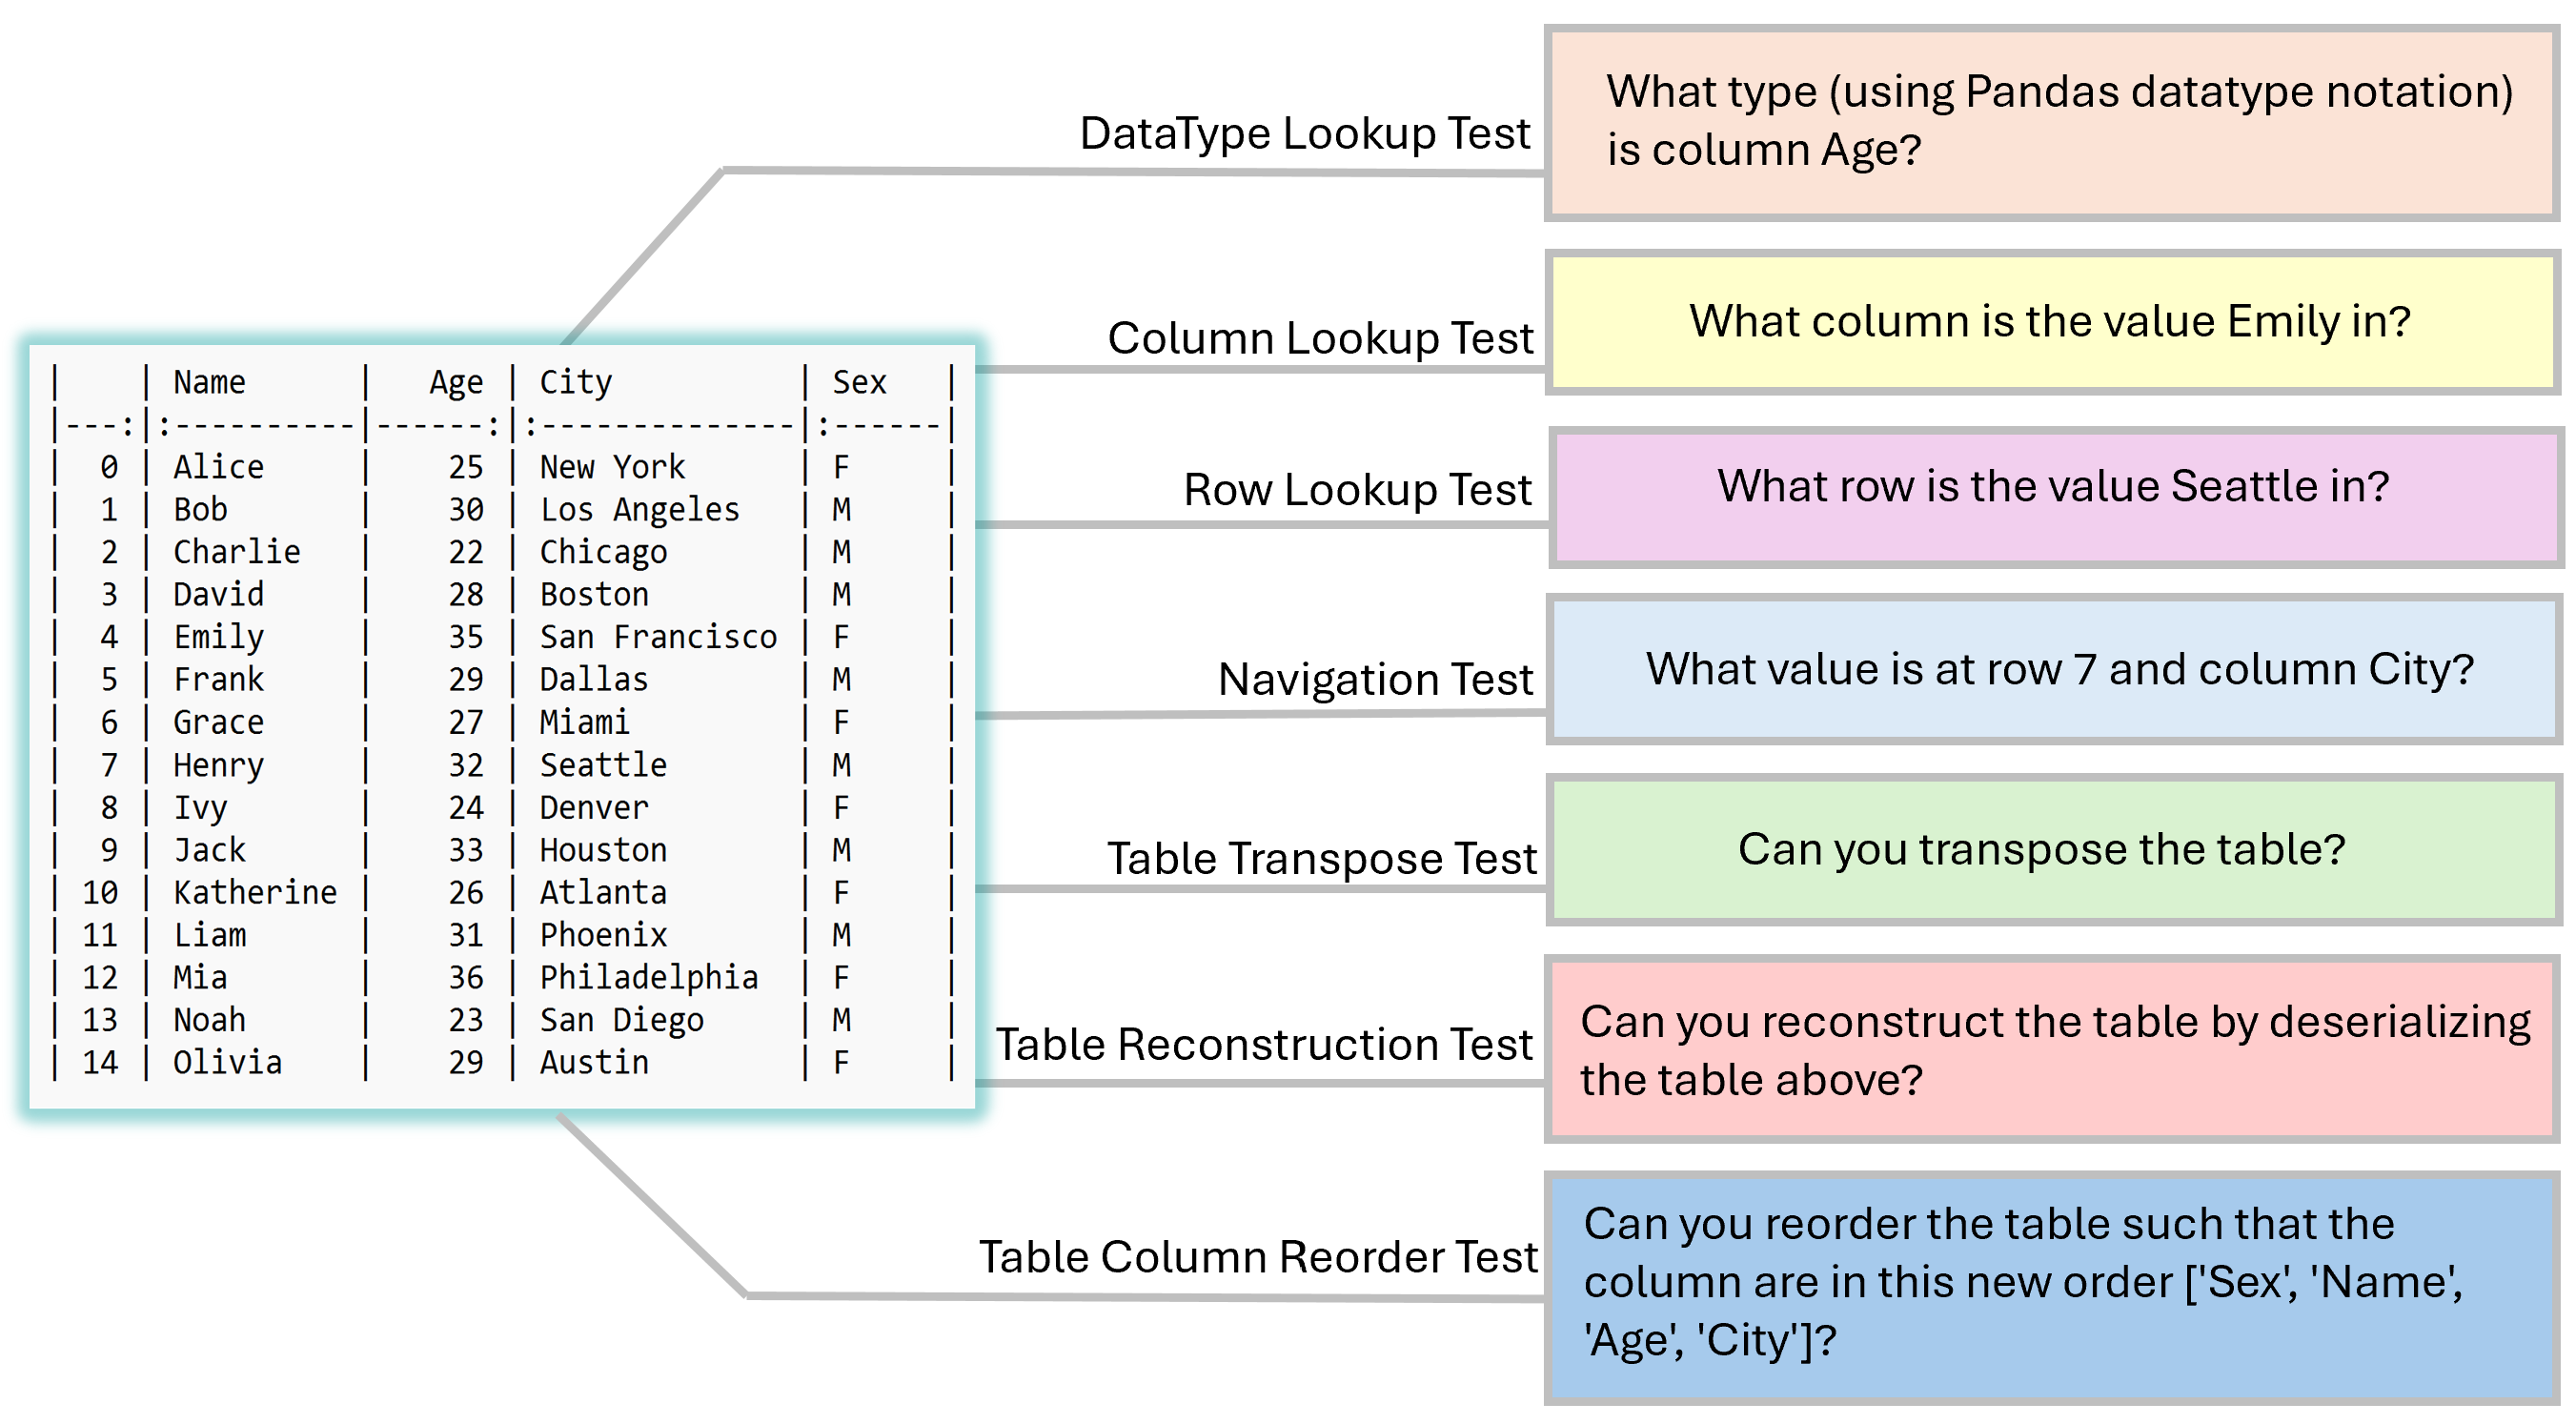
We consider the following structural fact-finding tasks:
-
•
Navigation Test: Given row and column coordinates, retrieve the value at that location. The model succeeds if it retrieves the value at those coordinates.
-
•
Column Lookup Test: Given a value, retrieve the name of a column that contains that value. The model succeeds if it retrieves the name of a column that contains that value.
-
•
Row Lookup Test: Given a value, retrieve the row index for a row that contains it. The model succeeds if it retrieves the index of a row that contains that value.
-
•
Data Type Lookup Test: Given a column name, determine the associated Pandas API datatype for the column values. The model succeeds if the datatype matches the groundtruth.
In addition to fact-finding tasks, we introduce transformation tasks that require manipulating the whole table:
-
•
Table Reconstruction Test: Given a table, we serialize it (applying the Serialize Rows operation previously described and then joining rows with new line character). The model must parse the table and generate its output in one of our 8 table formats.
-
•
Table Transpose Test: Given a table, the model is tasked with transposing the table.
-
•
Table Column Reordering Test: Given a table and a new (random) column order, the model must reorder the columns to match the indicated order.
To measure the success of transformation tasks we compute precision, recall, and F1 score over the table values based on coordinates. Figure 3 shows an example for each task.
4 Experimental Setup
Our evaluation is designed to answer the following research questions:
-
RQ1:
How does the table format impact LLM performance for self-supervised structural table understanding tasks?
-
RQ2:
How do noise operations impact LLM performance across different table formats?
4.1 Experimental Setup
We use OpenAI’s GPT3 (text-davinci-003 endpoint) [2]. Exploring cross-LLM behavior is left to future work. We generate responses with temperature 0 to encourage deterministic behavior. Our prompts have a token limit of 4097, as determined by the underlying LLM. For each (table, format, noise operation, structural task) we generate 100 tests222For HTML format we generate 50 tests per (table, format, noise operation, structural task), due to token limits and throttling for fact-finding tasks and 25 tests for transformation tasks. For each fact-finding test we generate 15 completions and for each transformation test we generate 5 completions.
We report average performance metrics over tests. For fact-finding tasks we compute pass@1 [4] for each test. For transformation tasks we compute cell-wise precision, recall and F1 per completion and average them. Computing exact table match, as needed for pass@1 would not account for partial performance. When reporting statistical significance, we perform comparisons using the t-test (SciPy T-Test implementation) and perform Bonferroni correction for multiple comparisons [1].
We evaluate on 7 public datasets collected from the popular data-science website Kaggle [9]. We chose datasets that are popularly used for both classification and regression tasks: AirQuality, HousingData, Diabetes, Wine Testing, Iris and Titanic. We remove all rows where null values are present to avoid creating spurious tasks.
5 Results
5.1 RQ1: Impact of Formats on LLMs performance on Different Task
Fact-Finding Tasks: Table 1 summarizes pass@1 rates for different formats across our fact-finding tasks.
| Table Formats | ColumnLookupTests | DataTypeLookupTests | NavigationTests | RowLookupTests | Overall |
|---|---|---|---|---|---|
| CommaSeparated | 64.43 | 95.00 | 65.57 | 78.14 | 75.78 |
| DFloader | 72.71 | 95.29 | 68.29 | 82.86 | 79.79 |
| DataMatrix | 62.57 | 84.00 | 56.57 | 87.43 | 72.64 |
| Json | 65.00 | 96.43 | 71.43 | 78.86 | 77.93 |
| Markdown | 61.43 | 85.86 | 48.71 | 73.29 | 67.32 |
| TabSeparated | 67.00 | 94.00 | 64.43 | 78.14 | 75.8 |
| HTML | 79.83 | 94.67 | 58.83 | 52.33 | 71.4 |
| HTMLNoSpace | 73.00 | 93.50 | 62.00 | 59.50 | 72.00 |
We find that performance can vary substantially by format and task. For example, while Markdown is a popular format for data scientists sharing results, using this format for tabular representation results in the worst ColumnLookupTest performance — 18.4% points lower than the best performing HTML format (p-value < ).
In contrast to prior work [13], we found that the HTML format underperforms alternatives like the JSON and DFLoader formats. However, HTML did result in the highest performance for one of our fact-finding tests: ColumnLookUpTest, where the average pass@1 was 6.38% higher than the next best (p-value < ). A substantial downside of HTML as a table representation is its verbosity: in our experiments, using HTML results in up to half as many rows being included compared to other formats. Removing spaces in HTML improves this slightly but the challenge remains.
JSON format, which is a popular serialization format, outperformed alternatives in the NavigationTests: 5.86% higher than the Comma Separated format (p-value < ). We hypothesize that this performance stems from a combination of orderly structure and repeating navigation elements (specifically headers). As shown in Figure 1, every row is laid out in a separate line with an associated key (showing the row index) and each row contains a dictionary where keys are header names.
Our results further emphasize the brittleness of LLMs to minor changes in structure representation. For example, while there is relatively little difference between the DataMatrix format and Comma Separated format, RowLookup performance for Data Matrix was 9.3% higher (p-value < ).
On average, across our fact-finding tasks, we found that DFLoader format, which is essentially a code snippet in Pandas, demonstrates competitive results and may be a suitable choice for prompts where the user does not yet known what kind of fact-finding knowledge is important for their task.
Finally, we find that all of our formats perform relatively well in our DataTypeLookUpTests, highlighting that different table formats may not play a substantially role in understanding the type of values (e.g. string versus numeric).
Transformation Tasks: Our transformation tasks require that a format be suitable for whole-table transformations. Our results are summarized in Table 2.
Overall, we found that DFLoader and JSON format outperformed alternatives for all the table transformation tasks. We hypothesize that this stems from isolation and repetition of key structural elements, which enable use of local context to carry out whole-table tasks: DFLoader presents each column in a separate list, and JSON repeats headers locally. For example, TableTranspose over our JSON format can effectively be carried out per-line, compared to transposition over a format like comma separated values, which requires more complex retrievals (e.g. all header values are in first row).
Similarly to the fact-finding tasks, Markdown format results in low performance across all our tasks providing further evidence that such a format should not be used for prompts for tabular data. For example, Markdown’s F1 score for column reordering is 49.67% lower than JSON’s (p-value < ).
| Table | TableColumnReorderTests | TableReconstructionTests | TableTransposeTests | Overall |
|---|---|---|---|---|
| CommaSeparated | 95.33 | 74.33 | 99.00 | 89.55 |
| DFloader | 99.33 | 98.00 | 98.33 | 98.55 |
| DataMatrix | 92.67 | 90.67 | 0.00 | 61.11 |
| Json | 99.67 | 85.00 | 100.00 | 94.89 |
| Markdown | 50.00 | 24.33 | 34.00 | 36.11 |
| TabSeparated | 93.33 | 92.33 | 50.00 | 78.55 |
| HTML | 50.00 | 86.00 | 83.33 | 73.11 |
| HTMLNoSpace | 83.33 | 84.00 | 83.33 | 83.55 |
5.2 RQ2: Impact of Noise Operations on LLM’s Performance on Structural Tasks.
Fact-Finding Tasks: Table 3 presents results of the impact of different noise operations on a subset of formats for our fact-finding tasks, chosen based on RQ1 performance. The first takeaway from these experiments is that different noise operations have a different impact on formats and particular fact-finding tasks. Furthermore, this impact can be both positive and negative.
For example, we find that transposing the input table and representing it as JSON results in an improvement of 20.86% (p-value < ) at the navigation tests compared to the original input. However, this same transformation substantially degrades column and row lookup tests. After inspecting generations, we found that the LLM’s generations for these tasks seem to ignore the transposition and often reply with the former headers (now row indices) as column names and viceversa.
For both the DataMatrix format and HTML formats, we found that introducing noise into the header names through operations like shuffling column names, sequential column renaming, and arbitrary column renaming resulted in degraded performance across our navigation and column lookup tests. For example, the Data Matrix format with sequential column naming resulted in 38% (p-value < ) and 27.14% (p-value < ) declines in navigation tests and column lookup tests, respectively.
Similarly, inducing semi-structured content results can lower performance. Serializing rows results in worse performance for data type detection across our formats. For example, JSON format’s pass@1 score drops by 12.43% (p-value < ). Merging cells impacts column lookup tests negatively, while not impacting (or in some cases even improving) row lookup performance. For example, Data Matrix format’s pass@1 score drops by 8% (p-value < ) in column lookup tests after applying the column merger noise operation.
| Table Format | Table Manipulation | NavigationTests | ColumnLookupTests | RowLookupTests | DataTypeLookupTests |
|---|---|---|---|---|---|
| Json | OriginalData | 71.43 | 65.00 | 78.86 | 96.43 |
| ShuffleRows | +0.57 | +1.43 | -6.57 | +0.14 | |
| ShuffleColumns | 0.00 | +1.14 | -6.72 | -1.86 | |
| ShuffleColumnNames | -1.57 | +1.43 | -6.57 | -8.86** | |
| SequentialColumnNames | -1.72 | +24.57** | -4.29 | -1.01 | |
| ArbitraryColumnNames | -4.43 | +23.14** | -10.43** | +0.57 | |
| TransposeTable | +20.86** | -65.00** | -76.29** | -33.86** | |
| ColumnMerger | +7.28** | -7.71** | +2.28 | -5.57** | |
| SerializeRow | +16.57** | +3.14** | +2.57 | -12.43** | |
| DFloader | OriginalData | 68.29 | 72.71 | 82.86 | 95.29 |
| ShuffleRows | -23.29** | -4.85 | -44.57** | +1.42 | |
| ShuffleColumns | +2.42 | +4.72 | -0.86 | +2.85 | |
| ShuffleColumnNames | +3.14 | -3.57 | -10.43** | -3.86** | |
| SequentialColumnNames | +2.28 | +11.43** | -10.72** | 0.00 | |
| ArbitraryColumnNames | +2.14 | +0.58 | -11.29** | +1.28 | |
| TransposeTable | +3.00 | -52.85** | -69.29** | -29.43** | |
| ColumnMerger | -7.72** | -4.57 | -3.43 | -2.15 | |
| SerializeRow | -3.86 | +10.58** | -15.86** | -16.00** | |
| DataMatrix | OriginalData | 56.57 | 62.57 | 87.43 | 84.00 |
| ShuffleRows | -17.43** | -4.00 | -31.72** | +2.29 | |
| ShuffleColumns | -6.57 | -2.14 | -0.72 | +1.12 | |
| ShuffleColumnNames | -20.57** | -23.14** | -1.86 | -15.00** | |
| SequentialColumnNames | -38.00** | -27.14** | +2.28 | -7.43** | |
| ArbitraryColumnNames | -17.71** | -23.71** | -1.57 | -2.43 | |
| TransposeTable | -4.57 | -60.00** | -85.14** | -22.00** | |
| ColumnMerger | -10.71** | -8.00** | -2.00 | +4.86 | |
| SerializeRow | -22.57** | +8.72** | -39.57** | -1.00 | |
| HTML | OriginalData | 58.83 | 79.83 | 52.33 | 94.67 |
| ShuffleRows | -1.50 | -1.50 | -3.50 | +1.83 | |
| ShuffleColumns | -1.16 | -2.33 | +4.00 | -0.34 | |
| ShuffleColumnNames | -20.50** | -27.16** | -11.66** | -15.67** | |
| SequentialColumnNames | -27.66** | -36.16** | +9.34** | -19.67** | |
| ArbitraryColumnNames | -12.16** | -30.58 | -7.33 | -2.00 | |
| TransposeTable | -25.08 | -79.83 | -9.83 | -49.92 | |
| ColumnMerger | +13.17** | -25.83** | +3.17 | -6.34** | |
| SerializeRow | +24.84** | +3.50 | -1.33 | -18.67** |
Transformation Tasks: Table 4 presents our transformation task results after applying noise operations. We discuss multiple interesting trends.
First, we find that introducing sequence information into headers (through the sequential column renaming noise operation) can significantly impact performance for the column reordering task (which requires changing column order) for some formats. For example, for the comma separated format, introducing sequential column renaming degrades column reordering F1-score by 67.33% (p-value < ). Column name shuffling and arbitrary column renaming, which do not introduce any form of sequential bias reduce performance as well, but by a smaller margin.
Second, we find that table transpose performance can be significantly affected by transposing the table initially. For example, transposing the table in JSON reduces the transpose task F1-score by 89% (p-value < ). This emphasizes that preprocessing may be necessary for tabular data, compared to relying on the model to perform such transformations itself for downstream tasks.
Finally, we find that introducing unstructured content can impact transformation tasks. For example, we find that JSON format, which obtains high table transposition performance, drops to zero (p-value < ), when the column merging noise operation is applied.
| Table Formats | Table Manipulation | TableColumnReorderTests | TableReconstructionTests | TableTransposeTests |
|---|---|---|---|---|
| Json | OriginalData | 99.67 | 85.00 | 100.00 |
| ShuffleRows | -1.00 | -45.00∗∗ | -13.33** | |
| ShuffleColumns | +0.33 | -19.00 | -40.67** | |
| ShuffleColumnNames | -0.34 | -13.67 | -29.33** | |
| SequentialColumnNames | +0.33 | -9.00 | -2.00 | |
| ArbitraryColumnNames | +0.33 | -4.33 | -0.67 | |
| TransposeTable | -89.00** | -78.33** | -42.00** | |
| ColumnMerger | +0.33 | -85.00** | -75.33** | |
| SerializeRow | -59.00** | -46.33** | -100.00** | |
| DFloader | OriginalData | 99.33 | 98.00 | 98.33 |
| ShuffleRows | +0.67 | -78.67** | -16.33** | |
| ShuffleColumns | +0.67 | -34.00** | -34.33** | |
| ShuffleColumnNames | +0.67 | -31.33** | -26.33** | |
| SequentialColumnNames | +0.67 | -54.67** | -1.00 | |
| ArbitraryColumnNames | +0.67 | -18.00** | -0.33 | |
| TransposeTable | -43.33** | -98.00** | -83.00** | |
| ColumnMerger | +0.67 | -98.00** | -81.00** | |
| SerializeRow | -33.33** | -73.33** | -60.33** | |
| CommaSeparated | OriginalData | 95.33 | 74.33 | 99.00 |
| ShuffleRows | -7.33 | -41.66** | -70.33** | |
| ShuffleColumns | -4.66 | -19.00 | -33.00** | |
| ShuffleColumnNames | -32.00** | -9.66 | -47.00** | |
| SequentialColumnNames | -67.33** | -13.00 | -24.33** | |
| ArbitraryColumnNames | -28.66** | +4.34 | -21.67** | |
| TransposeTable | +2.00 | -65.00** | -98.33** | |
| ColumnMerger | -4.66 | -74.33** | -80.33** | |
| SerializeRow | -95.33** | -57.66** | -99.00** | |
| TabSeparated | OriginalData | 93.33 | 92.33 | 50.00 |
| ShuffleRows | -4.00 | -57.00** | -34.67** | |
| ShuffleColumns | -6.00 | -31.00** | -6.00** | |
| ShuffleColumnNames | -59.33** | -29.66** | 0.00 | |
| SequentialColumnNames | -68.00** | -27.00** | -7.33** | |
| ArbitraryColumnNames | -45.33** | -13.00** | -2.00** | |
| TransposeTable | -44.66** | -83.00** | -50.00** | |
| ColumnMerger | -41.33** | -92.33** | -48.00** | |
| SerializeRow | -93.33** | -91.66** | -50.00** |
6 Conclusion
We evaluated LLM performance on self-supervised structural table understanding tasks using different formats and noise operations. Our results show that different formats obtain varying performance and noise operations can change results (both positively and negatively). Future work should consider cross-LLM performance, further exploring what format properties correlate with performance, and evaluating whether performance on table structure understanding tasks correlates with performance on downstream table task such as question answering or NL-to-code generation.
References
- [1] C. Bonferroni. Teoria statistica delle classi e calcolo delle probabilita. Pubblicazioni del R Istituto Superiore di Scienze Economiche e Commericiali di Firenze, 8:3–62, 1936.
- [2] T. Brown, B. Mann, N. Ryder, M. Subbiah, J. D. Kaplan, P. Dhariwal, A. Neelakantan, P. Shyam, G. Sastry, A. Askell, et al. Language models are few-shot learners. Advances in neural information processing systems, 33:1877–1901, 2020.
- [3] J. Cahoon, A. Savelieva, A. C. Mueller, A. Floratou, C. Curino, H. Patel, J. Henkel, M. Weimer, N. Gustafsson, R. Wydrowski, et al. The need for tabular representation learning: An industry perspective. In NeurIPS 2022 First Table Representation Workshop, 2022.
- [4] M. Chen, J. Tworek, H. Jun, Q. Yuan, H. P. d. O. Pinto, J. Kaplan, H. Edwards, Y. Burda, N. Joseph, G. Brockman, et al. Evaluating large language models trained on code. arXiv preprint arXiv:2107.03374, 2021.
- [5] W. Chen. Large language models are few (1)-shot table reasoners. arXiv preprint arXiv:2210.06710, 2022.
- [6] W. Chen. Large language models are few(1)-shot table reasoners, 2023.
- [7] J. Herzig, P. K. Nowak, T. Müller, F. Piccinno, and J. M. Eisenschlos. Tapas: Weakly supervised table parsing via pre-training. arXiv preprint arXiv:2004.02349, 2020.
- [8] G. Jaimovitch-López, C. Ferri, J. Hernández-Orallo, F. Martínez-Plumed, and M. J. Ramírez-Quintana. Can language models automate data wrangling? Machine Learning, 112(6):2053–2082, 2023.
- [9] Kaggle. Kaggle. https://www.kaggle.com, 2023. Accessed on 2023-10-02.
- [10] A. Koleva, M. Ringsquandl, and V. Tresp. Analysis of the attention in tabular language models. In NeurIPS 2022 First Table Representation Workshop, 2022.
- [11] Microsoft. Top ten ways to clean your data, 2023. Accessed on 2023-10-02.
- [12] Y. Suhara, J. Li, Y. Li, D. Zhang, c. Demiralp, C. Chen, and W.-C. Tan. Annotating columns with pre-trained language models. In Proceedings of the 2022 International Conference on Management of Data, SIGMOD ’22, page 1493–1503, New York, NY, USA, 2022. Association for Computing Machinery.
- [13] Y. Sui, M. Zhou, M. Zhou, S. Han, and D. Zhang. Evaluating and enhancing structural understanding capabilities of large language models on tables via input designs, 2023.
- [14] Z. Wang, H. Dong, R. Jia, J. Li, Z. Fu, S. Han, and D. Zhang. Tuta: Tree-based transformers for generally structured table pre-training. In Proceedings of the 27th ACM SIGKDD Conference on Knowledge Discovery & Data Mining, pages 1780–1790, 2021.
- [15] J. Wei, X. Wang, D. Schuurmans, M. Bosma, F. Xia, E. Chi, Q. V. Le, D. Zhou, et al. Chain-of-thought prompting elicits reasoning in large language models. Advances in Neural Information Processing Systems, 35:24824–24837, 2022.
- [16] L. Zha, J. Zhou, L. Li, R. Wang, Q. Huang, S. Yang, J. Yuan, C. Su, X. Li, A. Su, et al. Tablegpt: Towards unifying tables, nature language and commands into one gpt. arXiv preprint arXiv:2307.08674, 2023.