A Framework for Empowering Reinforcement Learning Agents with Causal Analysis: Enhancing Automated Cryptocurrency Trading
Abstract
Despite advances in artificial intelligence-enhanced trading methods, developing a profitable automated trading system remains challenging in the rapidly evolving cryptocurrency market. This study aims to address these challenges by developing a reinforcement learning-based automated trading system for five popular altcoins (cryptocurrencies other than Bitcoin): Binance Coin, Ethereum, Litecoin, Ripple, and Tether. To this end, we present CausalReinforceNet, a framework framed as a decision support system. Designed as the foundational architecture of the trading system, the CausalReinforceNet framework enhances the capabilities of the reinforcement learning agent through causal analysis. Within this framework, we use Bayesian networks in the feature engineering process to identify the most relevant features with causal relationships that influence cryptocurrency price movements. Additionally, we incorporate probabilistic price direction signals from dynamic Bayesian networks to enhance our reinforcement learning agent’s decision-making. Due to the high volatility of the cryptocurrency market, we design our framework to adopt a conservative approach that limits sell and buy position sizes to manage risk. We develop two agents using the CausalReinforceNet framework, each based on distinct reinforcement learning algorithms. The results indicate that our framework substantially surpasses the Buy-and-Hold benchmark strategy in profitability. Additionally, both agents generated notable returns on investment for Binance Coin and Ethereum.
keywords:
Cryptocurrency , Altcoins , Reinforcement Learning , Automated Trading System , Causal Features , Dynamic Bayesian networks1 Introduction
Since the introduction of Bitcoin in Satoshi Nakamoto’s paper [51], the cryptocurrency market has experienced significant growth, despite its relatively short existence. From January 2019 to June 2023, the market capitalisation of cryptocurrencies increased by approximately 340%, reaching a total value of 1.6 trillion US dollars.111www.tradingview.com Moreover, this growth has been accompanied by a considerable expansion of altcoins. While most altcoins utilise a similar underlying blockchain protocol as Bitcoin, they differentiate themselves by offering distinct concepts and objectives. These objectives are more than financial goals and often aim to attract new users from diverse business domains [3, 47]. For instance, unlike Bitcoin, Ethereum does not have a maximum total for the number of cryptocurrencies but limits its annual release. Ethereum’s block times (the duration needed to create a new block) are around 14 seconds, while Bitcoin’s is 10 minutes [21]. In June 2023, altcoins collectively are composed of approximately 52% of the cryptocurrency market.1 Furthermore, the number of noteworthy altcoins222 It is worth noting that more than 22,000 cryptocurrencies exist by the middle of 2023. However, only a portion of them remain active or have any value. was limited to around 1700 coins (March 2017), but this number has now expanded to around 9000 in February 2023.333www.statista.com These statistics highlight the increasing significance of altcoins for investors. Thus, while Bitcoin remains the most important cryptocurrency in terms of market capitalisation and setting market trends, broadening the perspective to include altcoins as significant contributors to the cryptocurrency market is important.
Although the empirical data demonstrate the growth and importance of cryptocurrencies, the associated market has encountered significant challenges. While this market shares common challenges with traditional financial assets, such as speculation, potential bubbles, and market volatility, it also faces unique challenges stemming from its attributes, including decentralisation, utilisation of blockchain technology, and 24/7 trading, which are not typically supported by traditional financial systems. These challenges include the association of cryptocurrencies with illicit activities and the need for their acceptance by governments and regulatory bodies [49]. One of the important challenges of cryptocurrencies is high volatility, which emphasises a greater risk for investors due to the high level of uncertainty in this market. For instance, Ethereum’s price surged 284% from January to November 2021, fell 76%, and then increased another 77% by April 2023. The significant price fluctuations in the cryptocurrency market present both investment opportunities and risks. In particular, these fluctuations create a potential for investors to profit from market volatility. However, it is important to note that large price changes have inherent risks of sudden downturns and potential losses. Therefore, providing investors with decision support system tools to capture these opportunities while mitigating risks can be beneficial.
Financial markets are characterised by complexity, noise, and volatility [35]. Certain traditional statistical methods, such as the autoregressive integrated moving average (ARIMA) model, may not be effective in capturing these market dynamics due to assumptions of linearity. In contrast, methods of artificial intelligence (AI), particularly machine learning (ML), have demonstrated their effectiveness as powerful tools in the design of trading systems [24]. In particular, AI has found various applications in trading financial assets, including quantitative trading, algorithmic trading, high-frequency trading, and automated trading [53]. Within this domain, an automated trading system representing an advanced integration of AI in finance is an information-based decision-making system that automatically generates buy and sell signals for assets based on pre-defined algorithms [61, 52].444The terms ‘automated trading’ and ‘algorithmic trading’ are often used interchangeably in the literature [19, 17] The application of automated trading systems has recently grown within the cryptocurrency market, emerging as a valuable tool to assist traders in responding to this complex financial market.
While ML techniques demonstrate improvements in the profitability of automated trading systems, they nonetheless have limitations. Supervised learning algorithms, such as long short-term memory [58] and artificial neural networks [40] primarily focus on predicting prices, trends, or volatility, but are unable to construct fully automated trading systems [46]. To incorporate these ML methods into trading systems, an extra logic layer of the trading module is required to handle the execution of trading actions such as buying, holding, or selling based on the predictions generated by the ML algorithms [1]. Moreover, trading strategies that rely on predictions typically perform under initial, fixed rules or parameters, which means they remain unchanged once a strategy is established. However, trading strategies that rely on fixed and unvarying rules or parameters can pose inherent risks, as financial market trends are dynamic and subject to frequent changes [10, 7].
On the other hand, reinforcement learning (RL) is an ML paradigm, where a self-governing agent learns from interactions with its environment to improve its behaviour [2]. The agent aims to identify a sequence of actions that maximise the probability of achieving a predefined goal [14]. In particular, the decision maker, known as an agent, interacts with the system, known as an environment, and receives information about the current state of the environment and the associated rewards. Its goal is to make decisions or take actions that maximise its overall reward. By optimising its actions based on the feedback from the environment, the agent aims to achieve the best possible outcome [32]. RL has been around for several decades, and progress in the field of AI has increased its popularity and advancements [15, 59]. This has resulted in RL finding applications in various domains, including games [26], robotics [50], natural language processing [38], computer vision [9], and finance [44].
RL offers several advantages over other ML methods. RL agents do not require supervision during the learning process and explore solutions by themselves from interactions with the environment without relying on pre-labelled data, unlike traditional supervised learning. Additionally, RL enables learning directly from the environment, where an agent receives feedback in the form of rewards or penalties based on its actions, allowing the agent to learn through trial and error [25, 20]. This empowers the development of self-improving trading strategies as RL agents learn and adapt their behaviour over time. This adaptability makes RL a promising approach for the dynamic and evolving cryptocurrency market.
In order to tackle the challenges associated with automated trading systems in the cryptocurrency market, this study proposes an RL-based trading system specifically designed for five popular altcoins. These five altcoins are chosen considering two main criteria – market capitalisation and data availability. Additionally, feature selection in RL for financial data presents significant challenges, mainly due to the large feature space involved. Numerous features, including fundamental and technical factors, make manual feature selection challenging [5]. Thus, Bayesian networks (BNs) are employed for feature engineering to address the challenge of selecting appropriate states of the RL model. This aids in identifying the most relevant features influencing the price movements of cryptocurrencies. Furthermore, the RL model’s design incorporates the price direction predictions of dynamic Bayesian networks (DBNs) as buy and sell signals, enabling the proposed RL model to adjust to both extreme upward and downward market conditions during trading. We also establish specific trading rules for our RL agent to mitigate the risks associated with the high volatility of the cryptocurrency market.
In summary, the contributions of the study are:
-
1.
Provide a broader understanding of the altcoin market and its unique characteristics by focusing on five popular altcoins, including Binance Coin, Ethereum, Litecoin, Ripple, and Tether.
-
2.
Design an enhanced RL-based automated trading framework for investors with lower risk tolerance to trade altcoins.
-
3.
Incorporate BNs analysis into the feature engineering process, allowing to selection of an RL agent’s states that are causally related.
-
4.
Proposes an approach to use DBNs to empower the RL agent in adjusting trading decisions based on the price directions.
The remainder of this paper is structured as follows. Section 2 provides a review of related literature in the domain. Section 3 provides a brief introduction to RL. Our proposed RL automated trading system is outlined in Section 4, while Section 5 describes the details of the implementation of our experiment and data analysis. The results of the research are discussed in Section 6. Finally, Section 7 provides concluding remarks on the study and suggests potential directions for future research.
2 Related Works
RL has shown remarkable promise in the creation of cryptocurrency trading systems aimed at generating profits and managing portfolios. In fact, RL has already found applications in the cryptocurrency domain, particularly in portfolio management and detecting trading policies, where it competes with established traditional trading strategies. RL systems observed in the literature exhibit variations in their design aspects. These variations include considerations like the formulation of an effective reward function, the integration of traditional financial strategies to increase RL profitability, the selection of suitable RL algorithms for trading, and the choice of relevant features for RL-based trading. Furthermore, these RL systems also employ diverse types of actions in their implementations, such as continuous or discrete actions, which have distinct implications for the trading system’s performance. We present a brief literature review of RL systems used in cryptocurrency in this section.
Koker and Koutmos [30] develop a deep RL model to effectively manage portfolios of five cryptocurrencies (Bitcoin, Ethereum, Litecoin, Ripple, and Monero) from 2015 to 2019. To achieve this target, they utilise the Sortino ratio as a reward function to assess the performance of the proposed model in evaluating trading returns. The Sortino ratio measures an investment’s risk-adjusted return considering only downside volatility. Unlike the Sharpe ratio, it does not consider total volatility. They compare their proposed model against the traditional Buy-and-Hold strategy. The findings reveal that the deep RL approach outperforms the baseline model, yielding higher returns in the portfolio management task. In addition, Sattarov et al. [54] propose a deep RL model employing a four-layer neural network for hourly trading of Bitcoin, Litecoin, and Ethereum. The model’s reward function calculates the difference between the sell and purchase prices of the assets. Additionally, a negative reward is assigned to discourage excessive trading when the number of open trades exceeds twenty. This restriction prevents the agent from engaging in excessive trading solely to increase rewards. Their model outperforms traditional strategies like double-crossing, swing trading, and scalping. In summary, the proposed deep RL approach identifies more trading opportunities, executes more trades, and achieves higher net returns. In another study, Lucarelli and Borrotti [43] proposes a deep Q-learning framework for managing a portfolio consisting of Bitcoin, Litecoin, Ethereum, and Ripple. They compare three deep RL techniques: deep Q-learning, double deep Q-learning, and duelling double deep Q-learning, using the Sharpe ratio as the evaluation metric. In addition, the study explores two types of reward functions, namely, local and global reward functions. Results show that the proposed models generate positive average daily returns, and the return on investment surpasses the initial investment.
Even profitable deep RL techniques require additional financial strategies to maximise profit and reduce risk. Hence, Kochliaridis et al. [29] combine rule-based mechanisms with deep RL for cryptocurrency trading, using hourly Open, High, Low, Close, Volume (OHLCV) data and Google Trends scores for Bitcoin, Ethereum, Cardano, Litecoin, and Ripple. The agent performs three discrete actions buy, hold, and sell. In addition, they incorporate a round-trip strategy and train the agent to detect high-risk states. Although generating lower profits according to portfolio performance metrics, the integrated approach results in steadily increasing profits and better risk management compared to using deep RL alone. The proposed approach would suit risk-averse investors with lower risk tolerance.
A study by Gort et al. [18] focuses on utilising the Proximal Policy Optimisation (PPO) RL algorithm to trade ten cryptocurrencies at five-minute intervals. The authors employ correlation matrix analysis to reduce the initial set of 13 features, consisting of OHLCV data and nine technical indicators, to a final set of 10 features for the RL environment. As a novelty in their work, they propose an approach to prevent the agent from overfitting during training. Overfitting can lead to models that perform well on historical data but fail to generalise to new data. The results show the least overfitting agent PPO outperforms other benchmark methods.
3 An Overview of Reinforcement Learning
Reinforcement learning is a widely used branch of ML that is inspired by human decision-making processes, where learning is guided by the reward signals generated as a consequence of executed actions [39]. RL aims to emulate the learning process of humans when they face an unprecedented task [33]. In order to achieve this goal, RL agents are employed to interact with the environment by following a predefined procedure. In particular, the fundamental nature of RL is to learn through a process of trial and error. This means that the RL agent continually interacts with its environment, receiving feedback in the form of rewards and penalties, and learning to modify its behaviour accordingly.
Figure 1 shows the RL framework for agent–environment interactions. At each time step , an agent finds itself in a particular state, represented as , and selects an action, denoted as . In response to this action, the agent receives a reward, denoted as , and transitions to a new state, . States, actions, and rewards are defined in the process of an RL agent’s design.

An RL problem can be modelled as a Markov decision process (MDP). It is a five-tuple . An RL algorithm is composed of the following:
-
States or observations : A state serves as a complete representation of the conditions and circumstances within an environment. The agent obtains all relevant information from its states required to make decisions and interact effectively with the environment.
-
Action spaces : In every environment, a range of actions can be performed. This set of acceptable actions within a specific environment is referred to as the action space. The nature of the action space can differ based on whether it is discrete or continuous. As opposed to a continuous action space, an agent has a finite number of available actions in a discrete action space.
-
Policy : A policy is the way an agent behaves at a given time. It determines the action that has to be decided by the agent when the agent is in a particular state within the environment. In a probabilistic context, a policy maps the current state of the environment to a set of probabilities associated with each action in the action space. These probabilities indicate the likelihood or chance of the agent blue performing each possible action.
-
Rewards : The reward is a unique component of RL that represents the immediate gain or benefits an agent receives for selecting a specific action in the current state, resulting in a transition to the following state.
-
Discount factor : The discount factor is a parameter that determines the relative importance of future rewards compared to immediate rewards. The discount factor influences the agent’s decision-making by assigning weight to future rewards. A value of 0 indicates that the agent only considers immediate rewards and disregards any potential long-term consequences. In contrast, means that the agent evaluates its actions based on cumulative rewards in the future.
There are generally two types of RL algorithms: model-based and model-free. Model-based algorithms have the knowledge of the transition matrix and reward function, allowing the agent to plan ahead and make decisions based on a range of possible options. On the other hand, model-free methods lack knowledge of the transition matrix and reward function, relying on previous experience to estimate state-action pairs [11]. Model-based algorithms in RL are computationally expensive as they require learning an accurate environment model, which can be a challenging task in real-world applications. Hence, model-free algorithms are more popular since they are less computationally expensive [60].
Model-free algorithms are classified into value-based and policy-based. Value-based methods aim to estimate a value function, which assigns a value to each state or state-action pair. The value function represents the expected return that can be obtained from a particular state or state-action pair [65]. On the other hand, policy-based methods directly learn the policy, which is a mapping from states to actions [41]. Instead of estimating the value function, policy-based algorithms focus on learning the policy directly [13].
4 A Comprehensive Guide to the CausalReinforceNet Framework
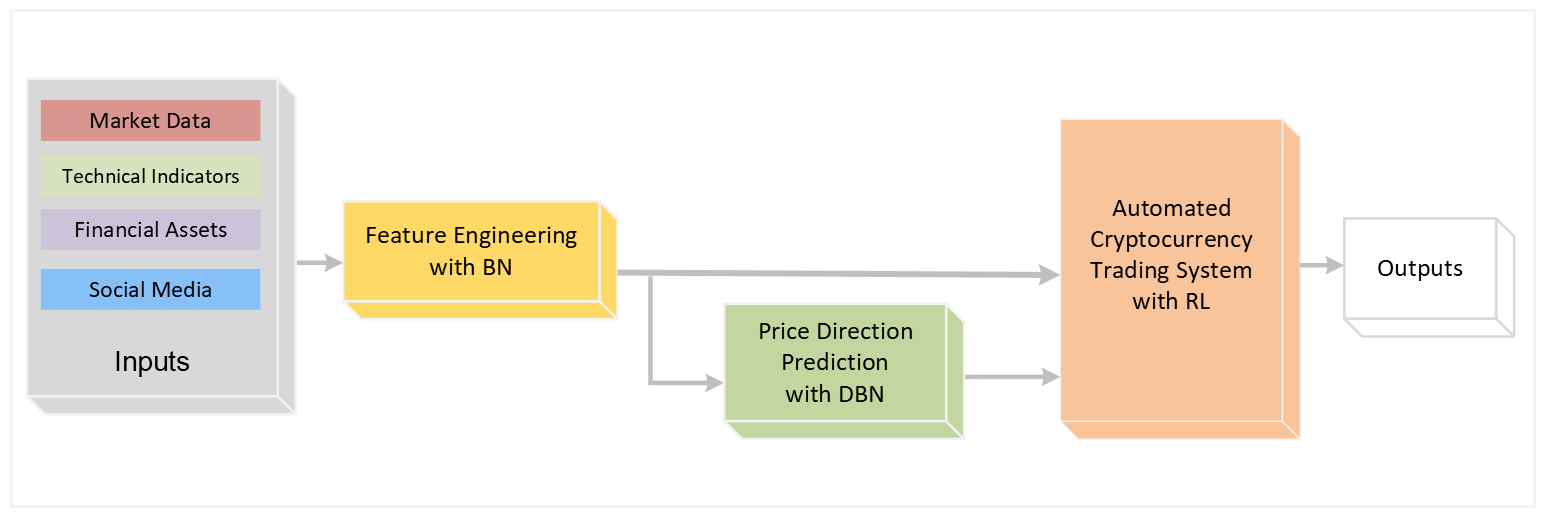
This section provides a comprehensive overview of the development process involved in building our framework. To optimise the learning process and improve overall performance in an RL system, considering all system elements is essential. This includes various aspects such as state representation, action state space, reward function design, and the choice of the RL algorithm. An effective RL system can be created by carefully considering and incorporating these factors into the design. Therefore, we introduce a framework called CausalReinforceNet (CRN), which serves as the foundational architecture for designing our RL-based automated trading system. As illustrated in Figure 2, CRN comprises four main components, each playing a specific role in RL system development. This figure outlines both the input features of the trading system and the interplay among BN, DBN, and RL methods, demonstrating their contribution to enhancing the agent’s overall performance.
The first component encompasses inputs, which are grouped into four distinct feature categories. Following this, the BN model’s task is to select the most relevant features within a combination of these groups of features for each altcoin. The third component, the DBN model, leverages the selected group of features delivered by the BN to predict the price predictions for each cryptocurrency. Finally, the RL component completes the system, implementing the automated trading system by integrating additional insights derived from the BN and DBN methods.
4.1 States
In an RL-based trading system, observations represent the current state of the market environment perceived by the RL agent. These observations guide the decision-making process and actions of the agent within the trading system. However, developing an effective policy depends on extracting informative states from high-dimensional observations [28], which is particularly challenging in finance, where numerous factors, often characterised by noise and complexity, contribute to these observations. When applied to real-world tasks, it is necessary to construct a suitable state space to mitigate the dimensionality problem [22, 8]. Therefore, employing feature selection or dimensionality reduction techniques can improve RL algorithms’ efficiency and computational effectiveness [63].
RL models incorporate both internal and external state observations. The selected group of features is utilized as the state representation within the trading system for each altcoin.
The first group is the combination of OHLCV with ten technical indicators, including AD (Accumulation/Distribution), BBands (Bollinger Bands), EMA (Exponential Moving Average), OBV (On-Balance Volume), MACD (Moving Average Convergence/Divergence), NATR (Normalized Average True Range), RSI (Relative Strength Indicator), SMA (Simple Moving Average), and Stoch (Stochastic Oscillator). These indicators provide insights into various aspects of the financial market, such as trend strength, the potential reversal of price trends, and price volatility [4, 57]. The second group of features combines OHLCV data with five traditional financial assets, including gold, the US dollar index (USDX), Standard & Poor’s 500 Index (S&P 500), MSCI, and West Texas Intermediate (WTI), and the number of daily tweets associated with each altcoin. The combination of these features with OHLCV enables our RL agent to consider broader market influences and the impact of social media on our analysis. A brief overview of these features can be found in Table 1.
| Type | Feature | Description | Time window |
| Macro financial | Gold | The gold spot market price in USD | Daily |
| MSCI | Market capitalisation-weighted index of 1,546 global companies | Daily | |
| S&P500 | Market capitalisation-weighted index of top 500 US companies | Daily | |
| USDX | US dollar value relative to six foreign currencies | Daily | |
| WTI | A prevalent oil price benchmark | Daily | |
| OHLVC | Close price | Last traded price in an interval | Daily |
| Low price | Lowest trading price in an interval | Daily | |
| High price | Highest trading price in an interval | Daily | |
| Open price | First traded price in an interval | Daily | |
| Volume | The total number of cryptocurrencies traded in a trading interva | Daily | |
| Social media | Tweet number | The number of daily tweets associated with a cryptocurrency | Daily |
| Technical indicators | AD | Uses volume and price for money flow | Last Period |
| BBands | Three lines, central SMA with 2 standard deviations boundaries | 5 days | |
| EMA | Weighted moving average to reduce the data lag | 10 days | |
| MACD | Measures two EMAs |
Fast period=12,
Slow period=26, Signal period=9 |
|
| NATR | Metric measuring volatility | 14 day | |
| OBV | Cumulative indicator of buying and selling pressure | Last period | |
| RSI | Measures overbought and oversold conditions | 14 days | |
| SMA | Simple moving average of data points | 10 days | |
| Stoch | Range-bound momentum indicator to determine overbought and oversold situations | 14 days |
Based on our proposed approach and the exploration of the causal influence of feature groups using BNs, we select features for each altcoin (Table 2). These features significantly influence the price movements of the altcoins in our analysis This process, labelled as ‘Feature Engineering with BN’, is represented in Figure 2.
| Cryptocurrency | Observations | Number of Features |
|---|---|---|
| Binance Coin | OHLCV and technical indicators | 15 |
| Ethereum | OHLCV | 5 |
| Litecoin | OHLCV, financial factors, and tweet number | 11 |
| Ripple | OHLCV and technical indicators | 15 |
| Tether | OHLCV | 5 |
In addition to the observations in Table 2 and features utilised in our framework, we incorporate a DBN’s predictions for daily closing price directions of altcoins. In particular, the DBN generates probabilistic predictions of daily prices of altcoins, meaning that for each day, it presents the probabilities of a price increase (Up) and a decrease (Down). It should be noted that each altcoin is influenced by distinct factors affecting its price movements, as shown in Table 2, and accordingly, DBNs use these related features for each altcoin to predict the daily price directions. Particularly, while daily closing price predictions for Binance Coin and Ripple are produced using both OHLCV and technical indicators, the DBN generates the predictions for Ethereum and Tether using only OHLCV. Notably, the DBN predicts the daily closing price of Litecoin based on a combination of OHLCV, tweet numbers, and financial factors. These DBN predictions are integrated into the observations of all altcoins to enhance our agent’s trading strategy, offering valuable insights into market trends and potential trading opportunities. This process is visually represented by ‘Price Direction Prediction with DBN’ in Figure 2.
4.2 Action
In the implementation of our framework, the agent’s action space contains two states. The first is the selection of the type of action, which includes options of buy, hold, or sell. Another trading decision that traders encounter is the position size of trades. This means the number of units of a financial asset that a trader or investor buys or sells in a single transaction. The position size can be in various forms, such as fixed lot sizes in forex trading, a set number of shares in stock trading, or a specific money amount.
In this research, unlike approaches that either buy assets using the entire available balance or sell all available assets at each trading period, we empower our agent to make decisions regarding the position size of trades. This allows the agent to adjust the number of assets being bought or sold. By incorporating this additional layer of decision-making, our agent can optimise its trading performance and adapt to different market conditions.
Furthermore, given the high volatility in the cryptocurrency market, we design our agent to adopt a more conservative approach. We set specific rules regarding the amount of cryptocurrency that can be sold and the amount of money that can be allocated for purchasing. In particular, the trading strategy is constrained to invest within a certain range. Through experimentation, we discovered that setting thresholds between 40% and 60% of the available balance yields higher returns. The purchased cryptocurrency is then stored in the agent’s wallet. Limiting trades to a maximum of 60% of available balance minimises risk by preventing overexposure to market volatility from any single trade, while a 40% minimum threshold allows having enough money for future trading opportunities. Moreover, during a sell action, the agent can sell between 40% (lower threshold) and 60% (upper threshold) of the cryptocurrency available in its wallet. This strategy ensures that a significant portion of the hold cryptocurrencies is preserved, mitigating the impact of sudden market downturns. Although implementing these restrictions on the buying and selling actions may potentially decrease the profitability of our agent, we aim to mitigate the risks associated with large and sudden market fluctuations while still allowing the agent to participate actively in trading activities. It is important to mention that individual traders may consider different thresholds based on various factors, such as risk management strategies and risk appetite.
Furthermore, to protect our agent from sudden movements in the cryptocurrency market, we use the price direction predictions from the DBN to guide its trading decisions. In particular, when the DBN indicates a Down price direction with a probability exceeding 80% (indicating a strong downward market condition ), the agent is programmed to sell 75% the maximised threshold) of the cryptocurrency in its wallet. Conversely, if the DBN signals an Up price direction with an 80% probability (suggesting a strong upward market condition), the agent will allocate 75% of its available balance as the trade position size to purchase more cryptocurrency. These adaptive rules enable the agent to adjust its position sizes based on the market conditions indicated by the DBN predictions.
Finally, we consider the transaction cost associated with each trade, which directly impacts the overall profitability of the agent. Therefore, we incorporate a transaction cost of 0.1% based on the position size of every trade conducted by the agent to ensure a realistic evaluation of the trading strategy’s performance. Transaction fees can vary in different exchanges, while 0.1% is the most commonly occurring fee. A list of top transaction fees in most known cryptocurrency exchanges can be found in [6]
The pseudo-code outlined in Algorithm 1 shows the step-by-step actions executed by our trading agent within each time step, as discussed earlier. The position-sizing algorithm outlines the agent’s strategy to determine the size of trades when buying or selling. Specifically, for a sell action, the algorithm sells 75% of the available wallet amount (WA) if there is an 80% or higher likelihood of a downward price movement. Otherwise, it sells a position size ranging from 40% to 60% of WA. In contrast, for a buy action, the agent invests 75% of the available balance (B) if there is at least an 80% probability of an upward price movement. Otherwise, the buying position size is between 40% and 60% of B. Transaction costs (TC) are then calculated based on the selected trading position. The algorithm performs a hold action if neither buy nor sell actions are chosen.
Inputs:
-
1.
WA: Amount of available coins in the wallet
-
2.
B: Available balance for trading
-
3.
TC: Transaction cost per trade
4.3 Reward
The primary goal of a trading RL agent is to maximise its profitability. Many studies in the field have employed the return on investment (ROI) of trades as the reward function for RL trading agents to enhance profitability. However, a common limitation of this reward function is that it does not consider the stability of the financial market or risk factors [64].555Financial market stability, although a multifaceted topic, can be defined as a state wherein a financial system is flexible and adaptable for effective risk management and absorbing shocks [23].
Therefore, we incorporate the Sharpe ratio (SR) as a reward function. SR quantifies the expected return per unit of risk undertaken. It provides a measure of the risk-adjusted performance of an investment or trading strategy, and is defined as follows:
where is average return, is the risk-free rate, and is standard deviation of investment return. In contrast to studies that assume a risk-free rate of zero, our work considers a more realistic assumption by considering a risk-free rate of 3.4%.666A government bond is a security issued by a government to support its spending. These bonds generally offer periodic interest payments and are considered low-risk due to the backing of the government. The 3.4% rate refers to the interest rate of the Australian 10-year Government Bond. By incorporating a more representative risk-free rate, we aim to provide a more accurate evaluation of the performance and profitability of our trading strategy in a real-world environment.
In order to improve both profitability and risk management, we adopt and modify a reward function proposed by [42], and combine the weighted ROI reward () and the weighted SR reward () functions as our final reward function. By incorporating SR in the reward function, we aim to balance profitability and risk in our agent decision-making process. function at time is defined as:
The function is defined as:
The objective of our reward function is to encourage actions that generate higher risk-adjusted returns and positive ROI while discouraging actions that lead to negative returns or excessive risk. Through experimentation, we find that a weight distribution of 30% for and 70% for yields a higher overall return. Therefore, the final reward function is defined as below:
4.4 RL algorithm
There are various RL algorithms available for training RL agents. However, as there is no universal solution, it remains challenging to identify which algorithm is best suited for a particular task [16]. Our study examines two commonly used RL algorithms: Proximal Policy Optimisation and Deep Deterministic Policy Gradient (DDPG). These two algorithms are both model-free; however, they possess distinct key differences in their approaches and applications.
Proximal Policy Optimisation [55] is an on-policy algorithm that aims to optimise a policy by taking the biggest possible improvement step on a policy while using the current experience without moving so far from the current policy [48]. PPO, developed by OpenAI, supports a broad range of state and action representations [34]. Moreover, this algorithm, adopted as the default algorithm by OpenAI, is used to train the RL agent due to its simplicity, generality, and low sample complexity. Unlike most ML algorithms requiring extensive hyperparameter tuning, PPO can create effective results with default settings or minimal adjustments [27].
As the second algorithm under investigation, we examine Deep Deterministic Policy Gradient (DDPG) [56]. It is a deep RL method that combines RL with deep learning strategies to enhance the performance of agents in complex environments. DDPG approach employs deep neural networks, which comprise multiple hidden layers populated with numerous units each, to facilitate learning [62]. This is an off-policy algorithm with better real-time adaptability and can only work in environments with continuous action spaces [36].
These algorithms utilise a continuous state and action space, which makes them particularly suitable for the trading rules within our system. Moreover, they demonstrate great potential in this complex environment of the financial markets [12, 37]. Therefore, we develop two distinct agents of the CRN framework by modifying the RL component based on these algorithms. One version utilises the PPO algorithm and is denoted as the agent, while the other employs the DDPG algorithm, termed the agent. Through analysis of these algorithms within the context of our proposed framework, we aim to determine the more suitable approach, considering the unique features of each algorithm.
5 Experimental Design
To conduct the experiments, the data was divided into training and testing sets using a 67% to 33% ratio, which is a commonly used split ratio [45].
In order to assess the effectiveness of our proposed trading model, we compare its performance to a common benchmark trading strategy used by many investors called Buy-and-Hold. This traditional investment strategy involves purchasing and holding assets for an extended period without actively trading. Moreover, the ROI metric is used to evaluate the performance of our agent and Buy-and-Hold strategy. ROI measures the profitability of an investment relative to the initial investment amount. In our examination, we calculate the ROI of our model by selling all available cryptocurrencies held in the agent’s wallet at the final time step. Basic ROI calculations do not account for the duration of the investment. Considering the duration of the investment is essential because it provides valuable insights into the consistency and sustainability of trading strategies. Therefore, we also calculate the annual ROI, which provides an average yearly return on the investment. By considering both ROI and annual ROI, we gain a more comprehensive understanding of both the overall profitability and the year-over-year returns generated by implemented trading strategies.
We conduct experiments on a Windows 10 Enterprise system with an Intel i7-Core CPU and 16 GB of RAM. Our study is implemented in Python, using the Stable Baselines3 library for RL algorithms and the pandas-ts library for computing technical indicators. All abbreviations used in the study are provided in Table 3 to facilitate ease of reference.
| Abbreviation | Explanation | Abbreviation | Explanation |
|---|---|---|---|
| AI | Artificial Intelligence | ML | Machine Learning |
| BNs | Bayesian Network | PPO | Proximal Policy Optimisation |
| CRN | CausalReinforceNet | RL | Reinforcement Learning |
| CRN implemented by DDPG algorithm | ROI | Return on Investment | |
| CRN implemented by PPO algorithm | ROI Reward Function | ||
| DBNs | Dynamic Bayesian Network | SR Reward Function | |
| DDPG | Deep Deterministic Policy Gradient | SR | Sharpe Ratio |
5.1 Data
The research investigates five cryptocurrencies: Binance Coin, Ethereum, Litecoin, Ripple, and Tether. These altcoins have consistently been among the top 10 cryptocurrencies in terms of market capitalisation, highlighting their popularity and influence in the cryptocurrency market. Their market capitalisation represents a substantial portion of the cryptocurrency market, over 30% of the overall market in the middle of 2023. Moreover, we include altcoins with a minimum of 1,900 daily data records, equivalent to more than six years, to enhance our analysis’s robustness and statistical significance.
The daily price data for both altcoins and traditional financial assets are collected from Yahoo Finance777https://finance.yahoo.com/ using the yfinance Python package. Furthermore, the daily tweet number for the related altcoins is extracted from bitinfocharts.com. Table 4 presents the descriptive statistics of the close price data for the studied altcoins.
| Mean | Std. Dev. | Min. | Median | Max. | |
|---|---|---|---|---|---|
| Binance coin | 160.61 | 182.14 | 4.53 | 29.02 | 675.68 |
| Ethereum | 1179.13 | 1170.65 | 84.31 | 609.82 | 4812.09 |
| Litecoin | 98.89 | 59.36 | 23.46 | 77.52 | 386.45 |
| Ripple | 0.52 | 0.35 | 0.14 | 0.39 | 3.38 |
| Tether | 1.00 | 0.01 | 0.97 | 1.00 | 1.05 |
Figure 3 provides a visual representation of the price and fluctuation patterns of the cryptocurrencies of the research. This visualisation facilitates the analysis of price trends and volatility for each cryptocurrency over time. Moreover, the training and test sets are visually differentiated through distinct colours, which helps to understand their different characteristics and dynamics.
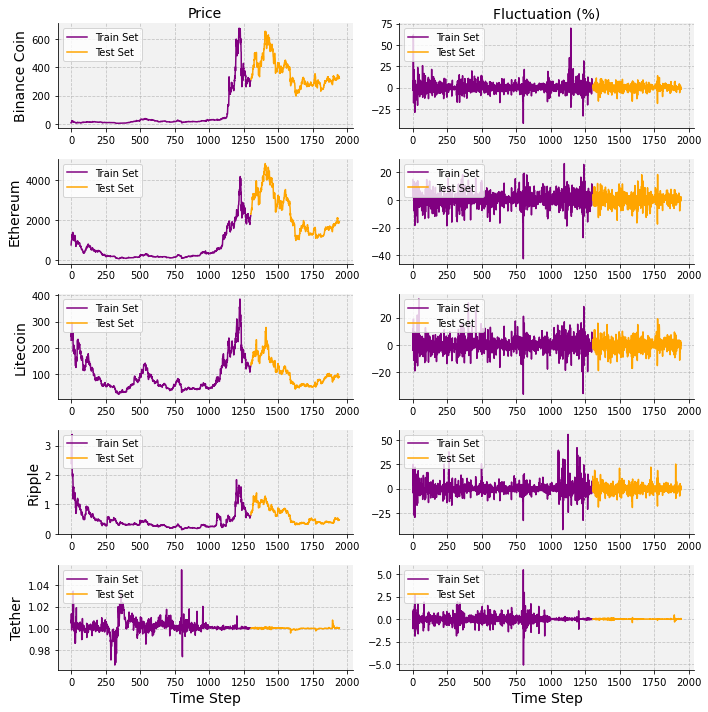
There are several notable observations from the plots. All coins exhibit both positive and negative fluctuations in their price movements. Binance Coin, Ethereum, Ripple, and Litecoin demonstrate significant price fluctuations, ranging approximately between -25% and 75%. On the other hand, Tether, being a stablecoin designed to maintain a stable value pegged to the US dollar, does not exhibit significant price fluctuations compared to other cryptocurrencies. These observations highlight the dynamic nature of the cryptocurrency market and the varying price behaviours demonstrated by different altcoins. Additionally, during both the training and test periods, there are extreme downward and upward market conditions that present a challenging situation for our agent.
Furthermore, the period of 2021 experienced a considerably higher level of variation compared to other periods covered in the study. For instance, Ethereum showed high variances of 53,225.206 and 905,922.229 before and after 2021, respectively. This considerable variance increase indicates the significant fluctuation and volatility associated with Ethereum during the year 2021. As a result, high prediction error is expected due to the growing variances in the data.
6 Results and Discussions
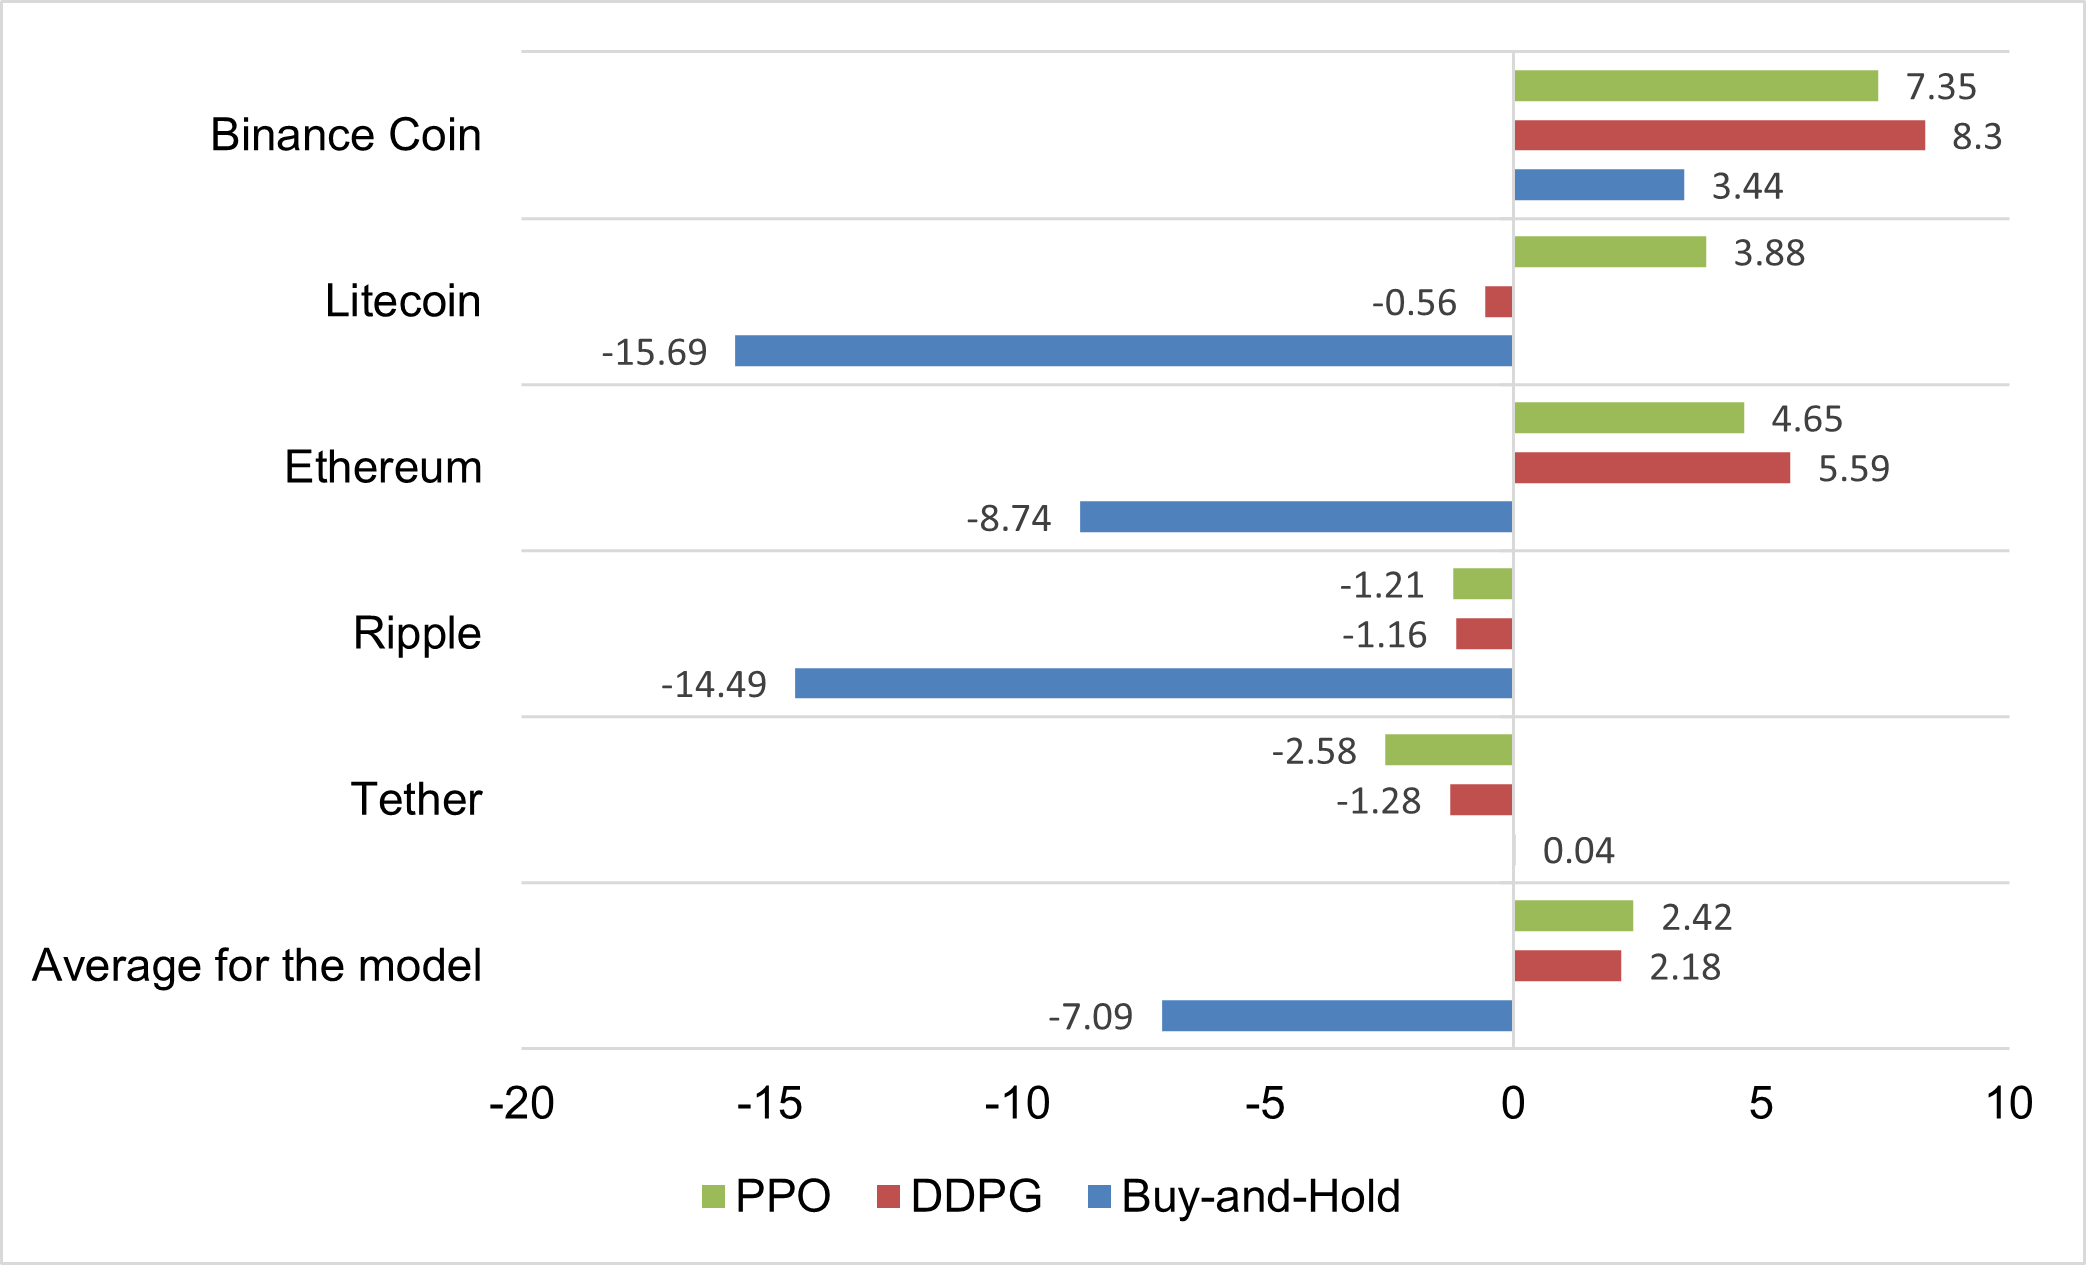
In this section, we present the results of our experiment. As suggested in [31] a single experiment may not provide conclusive evidence of a trading system performance; therefore, we conduct five experiments. Then, the average value for various metrics is calculated for altcoins. The results are illustrated in Table 5, which outlines ROI and the annualised ROI of the trading system for three different strategies: two RL agents of and in addition to the Buy-and-Hold approach. To facilitate the comparison, the performance of models based on annual ROI is visually presented in Figure 4.
| Buy-and-Hold | ||||||
|---|---|---|---|---|---|---|
| ROI | Annual ROI | ROI | Annual ROI | ROI | Annual ROI | |
| Binance Coin | 12.9330.34 | 7.3517.25 | 14.5917.18 | 8.309.77 | 5.92 | 3.44 |
| Ethereum | 8.19 44.56 | 4.6525.34 | 10.4640.15 | 5.5922.83 | -14.40 | -8.74 |
| Litecoin | 5.1326.06 | 3.88 19.70 | -0.7413.43 | -0.5610.15 | -25.18 | -15.69 |
| Ripple | -2.13 15.80 | -1.21 8.99 | -2.0436.24 | -1.1620.61 | -23.36 | -14.49 |
| Tether | -4.540.18 | -2.58 0.10 | -2.261.88 | -1.281.07 | 0.06 | 0.04 |
| Average | 3.92 | 2.42 | 4.00 | 2.18 | -11.39 | -7.09 |
When analysing the results, one key consideration is that the test period overlaps with the COVID-19 pandemic and the subsequent post-COVID phase. Throughout this period, many financial and economic factors experienced extreme changes, resulting in noticeable instability across various aspects of the economy, including inflation, high-interest rates, and supply chain disruptions. Although these volatile conditions can inevitably influence the performance of the trading system, it is still important to investigate the robustness of our trading system during this period. It ensures that the trading system can not only survive but thrive in volatile financial conditions, eventually making it practical to be deployed by real-world traders. Additionally, the cryptocurrency market lacks extensive historical data, which makes excluding this turbulent period from our analysis impractical.
Considering our conservative trading strategy designed to mitigate the inherent risks of the cryptocurrency market , our agent generally performs well in generating positive results, particularly in challenging situations during the test period. Both RL agents mostly outperforms the Buy-and-Hold strategy. For instance, agent generates a higher ROI and annual ROI of 12.93% and 7.35%, respectively, for Binance Coin, compared to the Buy-and-Hold. Similarly, while the Buy-and-Hold strategy results in negative ROI for Ethereum, this RL agent manages to gain a positive ROI and annual ROI of 8.19% and 4.65%. Litecoin also produces positive ROI and annual ROI results of 5.13% and 3.88%. However, performs poorly with Ripple and Tether, generating negative ROI. Despite the negative returns, the agent’s losses are considerably lower than the Buy-and-Hold strategy for Ripple. On the other hand, the agent outperforms the Buy-and-Hold strategy. It generates higher ROIs for both Binance Coin and Ethereum, 14.59% and 10.46%, respectively. However, it does not perform well on Litecoin, Ripple, and Tether. Even with negative returns, the loss of investment of is still substantially lower than the Buy-and-Hold strategy.
From the information in Table 5, we can gain valuable insights into the performance comparison of PPO and DDPG RL algorithms. The RL agent implemented with DDPG algorithm achieves higher ROIs than the PPO agent for certain altcoins. However, the average ROIs for all altcoins remain positive for both agents, with the averages being close with no statistical significance. Moreover, the produces positive ROIs for three altcoins (Binance Coin, Ethereum, and Litecoin), and the DDPG agent generates positive results for two altcoins (Binance Coin and Ethereum). In particular, as seen in Figure 4, the demonstrates the highest annual ROI for Binance Coin among all models, at 8.30%. Furthermore, the DDPG agent outperforms the PPO agent for Ethereum, with a 5.59% annual ROI. However, the DDPG agent produces a negative annual ROI for Litecoin. In addition, both agents exhibit the same pattern for Ripple and Tether, generating negative ROIs; however, the agent mitigates losses to a greater extent compared to the other agent.
Table 5 shows the Buy-and-Hold strategy underperforms for most altcoins. New entrants often speculate on the cryptocurrency market, hoping for substantial gains over time. However, as these results show, employing the Buy-and-Hold strategy is generally ineffective for most altcoins. In particular, the market capitalisation decreased significantly from the end of 2021 to April 2023. It is worth reiterating that the cryptocurrency market, during this period, experienced highly volatile conditions, dropping by almost 50% (around 1.8 trillion US dollars), resulting in significant losses for many investors.
With the Buy-and-Hold strategy, Binance Coin is the only cryptocurrency to generate a positive annual ROI (3.44%). This positive performance indicates Binance Coin’s growth during the evaluation period. Conversely, the Buy-and-Hold strategy performs poorly with Ethereum, Litecoin, and Ripple, producing a negative annual ROI. Moreover, Tether maintains almost the same value, showing a slight positive annual ROI of 0.04%. One reason is that Tether is typically pegged to a stable asset, which maintains its value despite market fluctuations. However, this characteristic also means achieving significant profit through Tether trading might be challenging due to its limited price movements.
6.1 Analysing Decisions of CRN Agents
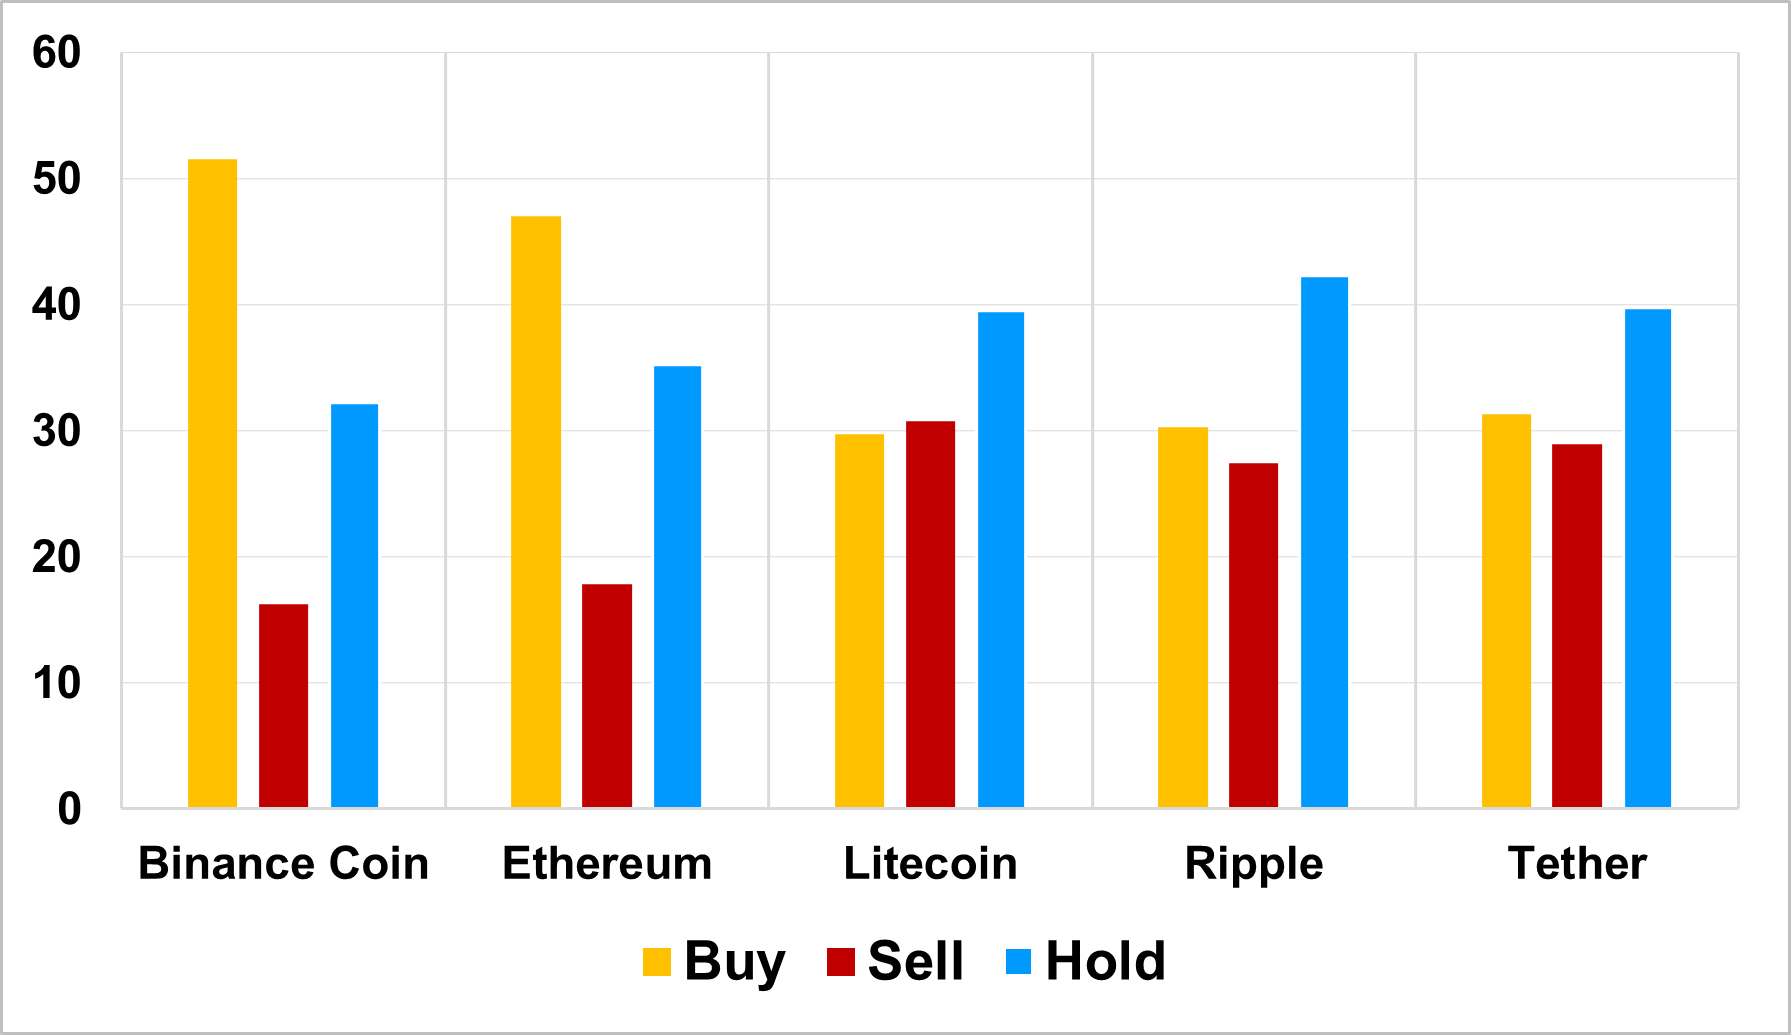
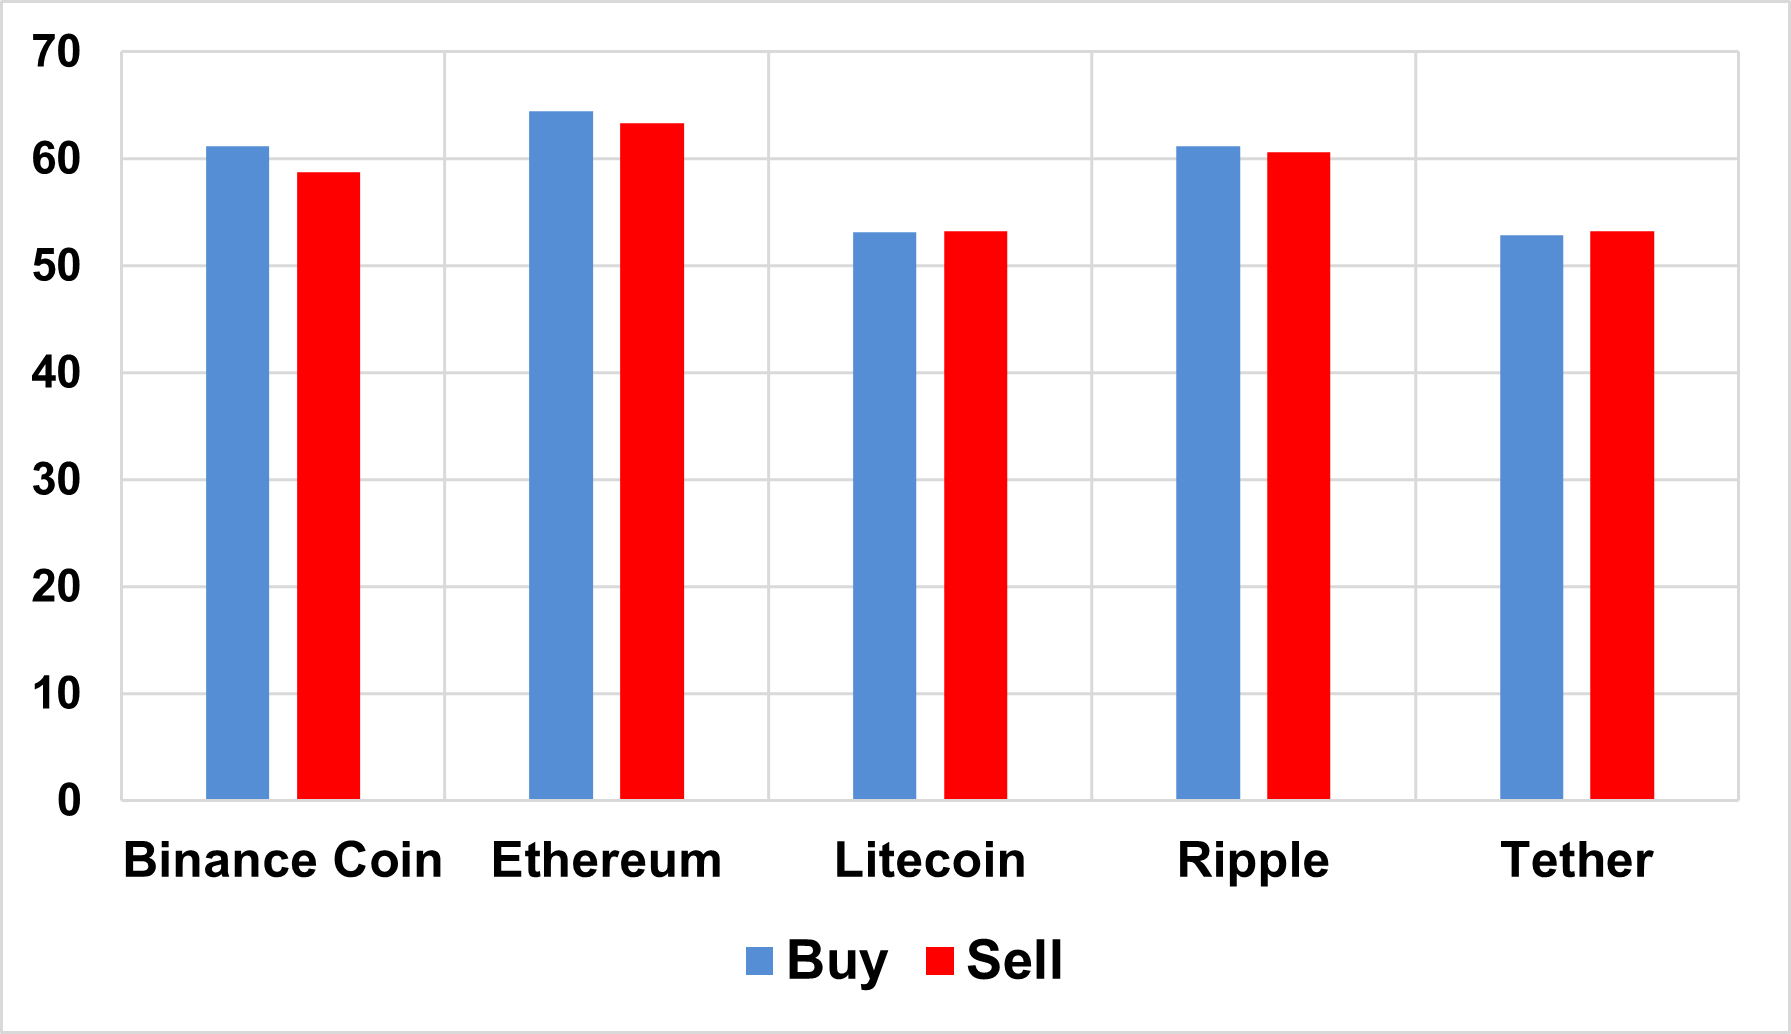
Table 6 and 7 provide detailed information about the decisions made by our and agents for each altcoin. These statistics provide an overview of the behaviour of the agents to explore the decision-making process of them. The ‘Number of Actions’ column indicates the frequency of the agent’s buy, sell, and hold actions. Moreover, the ‘Average Position Size’ column provides the average size of positions that the agent takes for buy and sell actions. It is worth reiterating that according to our strategy, the position size is between 40% and 60%. However, the position size can increase to 75% in strong Up or strong Down scenarios. The tables also present the DBN-generated predictions for each altcoin during the test period. The column labelled ‘Up’ shows the frequency in which the DBNs predict a price increase for the following day. On the other hand, the ‘Down’ column indicates the percentage of instances in which DBNs predict a daily price decrease.
| Number of Actions | Average Position Size | DBN Predictions | |||||
|---|---|---|---|---|---|---|---|
| Buy | Sell | Hold | Buy | Sell | Up | Down | |
| Binance Coin | 51.56 | 16.25 | 32.19 | 61.17 | 58.73 | 54.39 | 45.61 |
| Ethereum | 47.03 | 17.82 | 35.21 | 64.45 | 63.33 | 52.90 | 47.10 |
| Litecoin | 29.73 | 30.77 | 39.50 | 53.09 | 53.17 | 53.81 | 46.19 |
| Ripple | 30.27 | 27.46 | 42.28 | 61.12 | 60.58 | 50.16 | 49.84 |
| Tether | 31.30 | 28.95 | 39.75 | 52.88 | 53.22 | 40.13 | 59.87 |
As can be seen in Table 6, for Binance Coin and Ethereum, the agent demonstrates similar statistical behaviour. The agent mainly takes buy actions for these altcoins, accounting for 51.56% and 47.03% of its total actions, respectively. On the other hand, hold actions accounted for 32.19% and 35.21% of the agent’s actions for Binance Coin and Ethereum. This indicates that the agent chooses to hold onto these altcoins without making any trading decisions. Sell actions have a smaller percentage, 16.25% for Binance Coin and 17.82% for Ethereum. This suggests that the agent is relatively cautious in selling these altcoins, potentially waiting for more favourable price movements or market conditions before making decisions. Regarding the average position sizes, the PPO agent allocates a slightly higher percentage of available funds for buying compared to selling for both Binance Coin and Ethereum. The average position sizes for buy actions are 61.17% for Binance Coin and 64.45% for Ethereum, while the average position sizes for sell actions are 58.73% for Binance Coin and 63.33% for Ethereum. It indicates that the agent tends to invest a more significant portion of its available balance in these particular assets, indicating higher confidence in the profitability of buy actions.
Our agent demonstrates a relatively balanced allocation of buy and sell actions for Litecoin, with 29.73% and 30.77%. This suggests that the RL agent is actively engaged in both buying and selling Litecoin based on its market analysis. However, our agent still tends to perform more hold actions for Litecoin with 39.50%. Additionally, the average position size for buy and sell actions for Litecoin is very similar, with 53.09% and 53.17%. This indicates a more cautious approach to maintaining a balanced position in Litecoin.
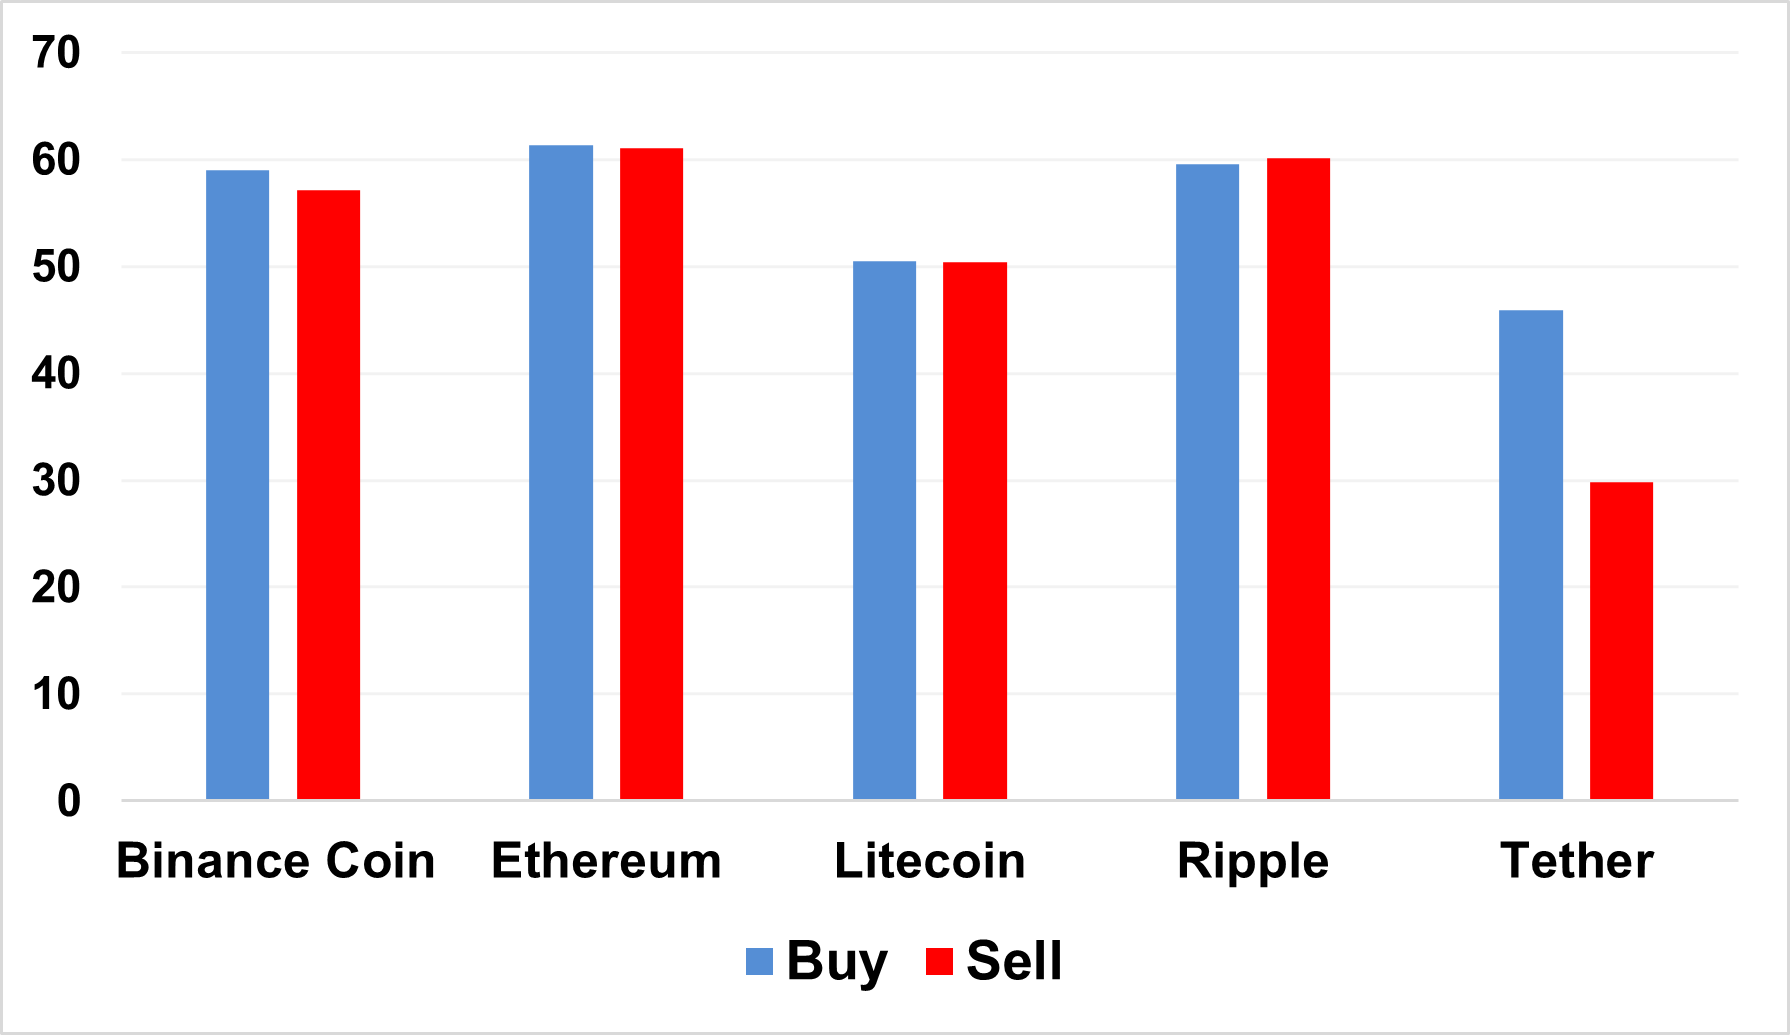
The agent’s behaviour demonstrates a preference for holding positions for Ripple. Our agent has the highest proportion of hold actions (42.28%) for Ripple among all altcoins. This indicates that the agent selects to maintain its investment in Ripple without actively buying or selling, possibly because the agent considers that the market conditions are not suitable for buying or selling. Moreover, the average position size for buy and sell actions is relatively similar, with 61.12% for buy actions and 60.58% for sell actions. The equal position sizes suggest that the agent aims to maintain a balanced portfolio by considering a longer-term investment strategy. Furthermore, Tether has the same pattern as Ripple. The buy and sell agent’s actions are almost evenly distributed, with buy actions of 31.30%, sell actions of 28.95%, and hold actions having the highest percentage of performed actions (39.75%). Furthermore, the average position size for buy and sell actions is also the same, with 52.88% and 53.22%. Figure 5 provides a visualisation of the decisions made by . The figure displays bar charts representing the number of actions and the average position size for each altcoin, which facilitates the comparison of the results across different altcoins. There are two notable observations. First, it is evident from Sub-figure 5(a) that the sell position has the lowest percentage in most altcoins concerning the number of actions. Second, the average sizes of the buy and sell positions are very close for each altcoin (Sub-figure 5(b).)
The comparison between the decisions of the RL agents and the DBNs’ predictions can provide valuable insights into the trading strategies of the agents.
It is important to note that the DBNs produce two predictions (Up and Down). However, the agent has the flexibility to choose among three actions (Buy, Sell, and Hold). This distinction makes the comparison more challenging; however, the analysis still reveals meaningful patterns for certain altcoins.
Considering the decisions of in Table 6, it is notable that the agent’s decisions tend to align with the predictions generated by the DBNs for Binance Coin and Ethereum. In particular, DBNs generate a higher frequency of Up predictions, signalling more potential buy opportunities, and correspondingly, the RL agent also executes a significantly greater number of buy actions. Moreover, as can be seen for Ripple, where the percentages of Up and Down predictions are nearly identical, indicating market uncertainty, the PPO agent also adopts a cautious strategy, holding its position rather than performing buy or sell actions.
| Number of Actions | Average Position Size | DBN Predictions | |||||
|---|---|---|---|---|---|---|---|
| Buy | Sell | Hold | Buy | Sell | Up | Down | |
| Binance Coin | 24.43 | 26.21 | 49.36 | 58.96 | 57.13 | 54.39 | 45.61 |
| Ethereum | 26.12 | 25.30 | 48.58 | 61.37 | 61.01 | 52.90 | 47.10 |
| Litecoin | 26.31 | 24.56 | 49.13 | 50.45 | 50.36 | 53.81 | 46.19 |
| Ripple | 23.53 | 24.56 | 51.92 | 59.53 | 60.08 | 50.16 | 49.84 |
| Tether | 53.45 | 15.69 | 30.86 | 45.87 | 29.83 | 40.13 | 59.87 |
Considering the decisions made by agent presented in Table 7, the hold action frequency is the highest among the three possible actions taken for Binance Coin, Ethereum, Litecoin, and Ripple (around 50%). Furthermore, the frequencies of buy and sell actions are nearly equal, suggesting a balanced trading approach for these cryptocurrencies. In contrast, the trading behaviour of the agent for Tether differs. The agent performs more buy action with a frequency of 53.45%, and the hold action is 30.86%. Moreover, while Binance Coin, Ethereum, Litecoin, and Ripple show relatively close average position sizes for both buying and selling, Tether has a different pattern. In particular, the average position size for buying Tether is noticeably larger at 45.87%, compared to its selling position size, which is considerably smaller at 29.83%. These differences between agents’ decisions for Tether and others can be attributed to the fact that Tether is a stablecoin, while other altcoins are mining-based cryptocurrencies. As observed, the agent adopts a distinctive trading strategy when interacting with Tether. These differences in agents’ decisions regarding Tether can be attributed to its nature as a stablecoin, which is inherently different from other altcoins that are mining-based cryptocurrencies. Figure 6 is provided to enhance understanding of the prior discussions regarding the decisions undertaken by the agent. Sub-figure 6(a) shows that the hold action clearly stands out as the dominant action for all altcoins except Tether. Additionally, the average percentage for buy and sell positions is almost the same for each, excluding Tether (Sub-figure 6(b)).
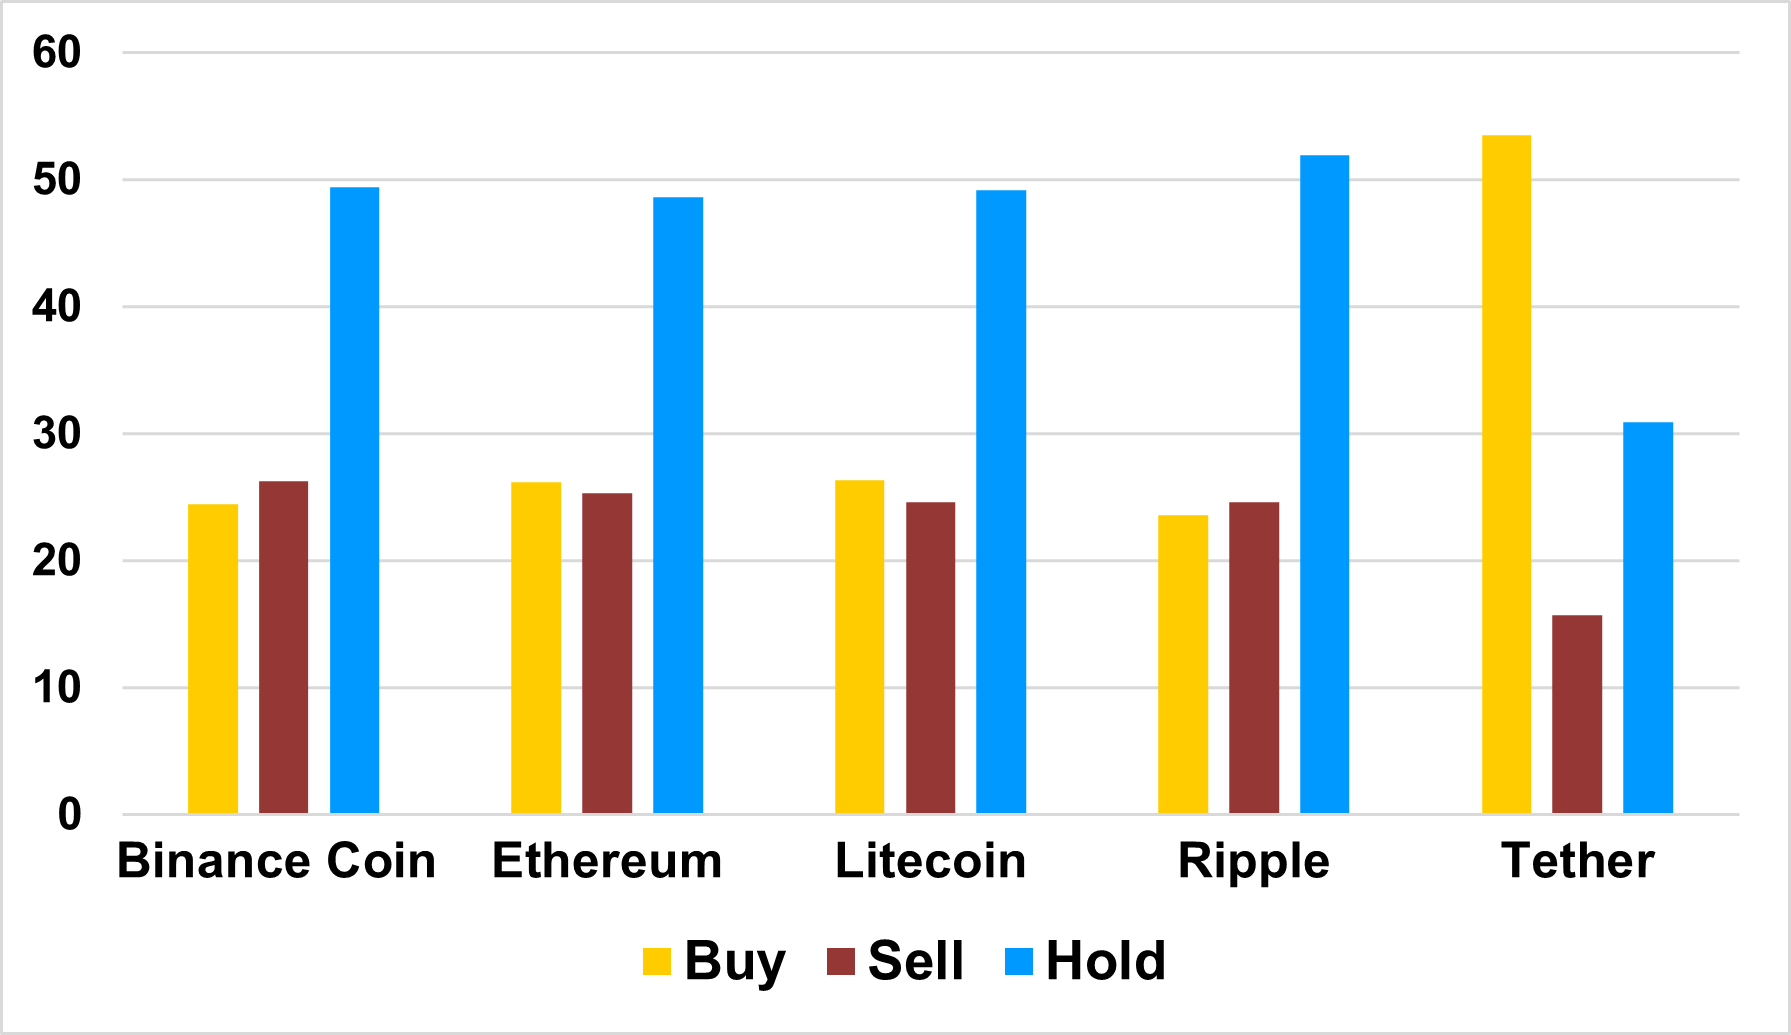
Comparing the action analysis (Table 7) and the predictions of the DBNs reveals an important observation that the agent is more conservative for all altcoins except Tether. In particular, while the DBNs generate more buy signals, the DDPG agent performs more hold action, which implies a conservative trading strategy that waits for stronger signals. On the other hand, despite a 59.87% prediction of Down, this agent executes more buy actions (53.45%) for Tether, suggesting it is employing a different approach for this stablecoin.
7 Conclusions and Future Work
This study aims to develop an algorithmic trading system specifically designed for five popular altcoins, namely, Binance Coin, Ethereum, Litecoin, Ripple, and Tether. We propose a framework named CausalReinforceNet, which serves as the foundational architecture of our trading system. The framework is designed to empower the RL agent through the integration of causal analysis. Utilising Bayesian networks, the framework identifies the most relevant features for each altcoin in the design of the RL agent’s state observations. Furthermore, to enhance the agent’s decision-making process and provide more accurate market information, we integrate dynamic Bayesian networks into our trading system and use its predictions. These predictions generate probabilistic buy and sell signals that guide the agent’s trading decisions. Moreover, we equip the RL agent with the capability to not only select trading actions but also determine the trade position sizes. Additionally, we create two RL agents based on different RL algorithms, Proximal Policy Optimisation and Deep Deterministic Policy Gradient, to investigate the influence of selecting the RL algorithm on the performance of our trading system. Furthermore, considering the high volatility and associated risks in the cryptocurrency market, we design our trading system with more conservative trading rules. This approach aims to mitigate potential risks and minimise exposure to large market fluctuations. In particular, we limit the position size of each trade to ensure that the agent does not take on excessive risk, thereby protecting our initial investment.
Even though they are part of the cryptocurrency market, each altcoin behaves differently and has its own specific ecosystem. Thus, one general conclusion cannot necessarily be drawn for all the altcoins together. Generally, both agents outperform the traditional benchmark model of the Buy-and-Hold. However, comparing the results from the agents based on two RL algorithms reveals similarities in terms of the return on investment as performance criteria. Despite varying performance levels, both RL agents perform well with Binance Coin and Ethereum, while they do not produce satisfactory results for Litecoin and Tether. The RL agents exhibit opposing results when trading with Ripple. Additionally, analysing their decisions helps to understand the decision-making patterns of the agents. Generally, the analysis discloses a relatively balanced distribution between sell and buy positions for both agents. Meanwhile, the hold action occurs as their preferred trading strategy, which signals market uncertainty and an absence of clear buy or sell signals.
The results and limitations observed in our study can be investigated in future research. One potential research direction is to explore higher trading frequencies such as hourly. Additionally, developing adaptable or parametric strategies to adjust the buy and sell lower and upper thresholds, including establishing the maximised threshold of the investment for buying or selling, dynamically can enhance the profitability of individual altcoins. Moreover, since the average ROIs for all altcoins of both agents in the analysis are positive, incorporating a portfolio strategy with our existing RL trading system represents a promising direction for future research. By considering all altcoins as a single investment basket, we can potentially diversify risk, balance rewards, and enhance the overall trading performance of the system.
Furthermore, exploring a broader set of RL algorithms other than Proximal Policy Optimisation and Deep Deterministic Policy Gradient presents another direction for future research. Algorithms such as Trust Region Policy Optimisation and Soft Actor-Critic, which operate in a continuous action space, can be particularly beneficial to investigate. Finally, extending the use of the CausalReinforceNet framework to other domains requiring decision support systems, each with its unique input features, is another important research direction. This approach can offer deeper insights into the robustness of the framework and the feasibility of using it as a foundational architecture for designing RL-based systems.
References
- AbdelKawy et al. [2021] Rasha AbdelKawy, Walid M Abdelmoez, and Amin Shoukry. A synchronous deep reinforcement learning model for automated multi-stock trading. Progress in Artificial Intelligence, 10(1):83–97, 2021.
- Akanksha et al. [2021] Eisha Akanksha, Neeraj Sharma, Kamal Gulati, et al. Review on reinforcement learning, research evolution and scope of application. In 2021 5th international conference on computing methodologies and communication (ICCMC), pages 1416–1423. IEEE, 2021.
- Alamad and Alamad [2019] Samir Alamad and Samir Alamad. An analysis of paper money and the concept of multi-genus banknotes. Financial and Accounting Principles in Islamic Finance, pages 49–73, 2019.
- Alonso-Monsalve et al. [2020] Saúl Alonso-Monsalve, Andrés L Suárez-Cetrulo, Alejandro Cervantes, and David Quintana. Convolution on neural networks for high-frequency trend prediction of cryptocurrency exchange rates using technical indicators. Expert Systems with Applications, 149:113250, 2020.
- Aloud and Alkhamees [2021] Monira Essa Aloud and Nora Alkhamees. Intelligent algorithmic trading strategy using reinforcement learning and directional change. IEEE Access, 9:114659–114671, 2021.
- Amirzadeh et al. [2022] Rasoul Amirzadeh, Asef Nazari, and Dhananjay Thiruvady. Applying artificial intelligence in cryptocurrency markets: A survey. Algorithms, 15(11):428, 2022.
- Ansari et al. [2022] Yasmeen Ansari, Sadaf Yasmin, Sheneela Naz, Hira Zaffar, Zeeshan Ali, Jihoon Moon, and Seungmin Rho. A deep reinforcement learning-based decision support system for automated stock market trading. IEEE Access, 10:127469–127501, 2022.
- Arai et al. [2018] Tomoyuki Arai, Yuichiro Toda, Iwasa Mutsumi, Shuai Shao, Ryuta Tonomura, and Naoyuki Kubota. Reinforcement learning based on state space model using growing neural gas for a mobile robot. In 2018 Joint 10th International Conference on Soft Computing and Intelligent Systems (SCIS) and 19th International Symposium on Advanced Intelligent Systems (ISIS), pages 1410–1413. IEEE, 2018.
- Cao et al. [2017] Qingxing Cao, Liang Lin, Yukai Shi, Xiaodan Liang, and Guanbin Li. Attention-aware face hallucination via deep reinforcement learning. In Proceedings of the IEEE Conference on Computer Vision and Pattern Recognition, pages 690–698, 2017.
- Chakole et al. [2021] Jagdish Bhagwan Chakole, Mugdha S Kolhe, Grishma D Mahapurush, Anushka Yadav, and Manish P Kurhekar. A q-learning agent for automated trading in equity stock markets. Expert Systems with Applications, 163:113761, 2021.
- Cho and Han [2022] SungHwan Cho and SangUk Han. Reinforcement learning-based simulation and automation for tower crane 3d lift planning. Automation in Construction, 144:104620, 2022.
- Conegundes and Pereira [2020] Leonardo Conegundes and Adriano C Machado Pereira. Beating the stock market with a deep reinforcement learning day trading system. In 2020 International Joint Conference on Neural Networks (IJCNN), pages 1–8. IEEE, 2020.
- Dang and Ishii [2022] Zhuoran Dang and Mamoru Ishii. Towards stochastic modeling for two-phase flow interfacial area predictions: A physics-informed reinforcement learning approach. International Journal of Heat and Mass Transfer, 192:122919, 2022.
- Datta et al. [2021] Shounak Datta, Yanjun Li, Matthew M Ruppert, Yuanfang Ren, Benjamin Shickel, Tezcan Ozrazgat-Baslanti, Parisa Rashidi, and Azra Bihorac. Reinforcement learning in surgery. Surgery, 170(1):329–332, 2021.
- De Bruyn et al. [2020] Arnaud De Bruyn, Vijay Viswanathan, Yean Shan Beh, Jürgen Kai-Uwe Brock, and Florian Von Wangenheim. Artificial intelligence and marketing: Pitfalls and opportunities. Journal of Interactive Marketing, 51(1):91–105, 2020.
- Di Cicco et al. [2022] Nicola Di Cicco, Emre Furkan Mercan, Oleg Karandin, Omran Ayoub, Sebastian Troia, Francesco Musumeci, and Massimo Tornatore. On deep reinforcement learning for static routing and wavelength assignment. IEEE Journal of Selected Topics in Quantum Electronics, 28(4):1–12, 2022.
- Gerig and Michayluk [2017] Austin Gerig and David Michayluk. Automated liquidity provision. Pacific-Basin Finance Journal, 45:1–13, 2017.
- Gort et al. [2022] Berend Jelmer Dirk Gort, Xiao-Yang Liu, Xinghang Sun, Jiechao Gao, Shuaiyu Chen, and Christina Dan Wang. Deep reinforcement learning for cryptocurrency trading: Practical approach to address backtest overfitting. arXiv preprint arXiv:2209.05559, 2022.
- Groth et al. [2014] Sven S Groth, Michael Siering, and Peter Gomber. How to enable automated trading engines to cope with news-related liquidity shocks? extracting signals from unstructured data. Decision Support Systems, 62:32–42, 2014.
- Harewood-Gill [2022] Douglas AE Harewood-Gill. Q-Routing for Enhanced Performance Within a SDN Controlled Network. PhD thesis, University of Bristol, 2022.
- Harm et al. [2016] Julianne Harm, Josh Obregon, and Josh Stubbendick. Ethereum vs. bitcoin. URL: www. economist. com, 2016.
- Hashemzadeh et al. [2018] Maryam Hashemzadeh, Reshad Hosseini, and Majid Nili Ahmadabadi. Exploiting generalization in the subspaces for faster model-based reinforcement learning. IEEE transactions on neural networks and learning systems, 30(6):1635–1650, 2018.
- Houben et al. [2004] Aerdt CFJ Houben, Jan Kakes, and Garry J Schinasi. Toward a framework for safeguarding financial stability, volume 4. International Monetary Fund Washington, DC, 2004.
- Huang et al. [2019] Boming Huang, Yuxiang Huan, Li Da Xu, Lirong Zheng, and Zhuo Zou. Automated trading systems statistical and machine learning methods and hardware implementation: a survey. Enterprise Information Systems, 13(1):132–144, 2019.
- Ikeda et al. [2022] Satoru Ikeda, Hitoshi Kono, Kaori Watanabe, and Hidekazu Suzuki. Body calibration: Automatic inter-task mapping between multi-legged robots with different embodiments in transfer reinforcement learning. In Actuators, volume 11, page 140. MDPI, 2022.
- Jaderberg et al. [2016] Max Jaderberg, Volodymyr Mnih, Wojciech Marian Czarnecki, Tom Schaul, Joel Z Leibo, David Silver, and Koray Kavukcuoglu. Reinforcement learning with unsupervised auxiliary tasks. arXiv preprint arXiv:1611.05397, 2016.
- Kegenbekov and Jackson [2021] Zhandos Kegenbekov and Ilya Jackson. Adaptive supply chain: Demand–supply synchronization using deep reinforcement learning. Algorithms, 14(8):240, 2021.
- Killian et al. [2020] Taylor W Killian, Haoran Zhang, Jayakumar Subramanian, Mehdi Fatemi, and Marzyeh Ghassemi. An empirical study of representation learning for reinforcement learning in healthcare. arXiv preprint arXiv:2011.11235, 2020.
- Kochliaridis et al. [2023] Vasileios Kochliaridis, Eleftherios Kouloumpris, and Ioannis Vlahavas. Combining deep reinforcement learning with technical analysis and trend monitoring on cryptocurrency markets. Neural Computing and Applications, pages 1–18, 2023.
- Koker and Koutmos [2020] Thomas E Koker and Dimitrios Koutmos. Cryptocurrency trading using machine learning. Journal of Risk and Financial Management, 13(8):178, 2020.
- Kong and So [2023] Minseok Kong and Jungmin So. Empirical analysis of automated stock trading using deep reinforcement learning. Applied Sciences, 13(1):633, 2023.
- Ladosz et al. [2022] Pawel Ladosz, Lilian Weng, Minwoo Kim, and Hyondong Oh. Exploration in deep reinforcement learning: A survey. Information Fusion, 85:1–22, 2022.
- Lai [2022] Yujun Lai. Towards Personalised Robotic Assessment and Response during Physical Human Robot Interactions. PhD thesis, 2022.
- Lee [2022] Woonghee Lee. Reward-based participant selection for improving federated reinforcement learning. ICT Express, 2022.
- Li and Bastos [2020] Audeliano Wolian Li and Guilherme Sousa Bastos. Stock market forecasting using deep learning and technical analysis: a systematic review. IEEE access, 8:185232–185242, 2020.
- Li et al. [2021] Jiawen Li, Tao Yu, Xiaoshun Zhang, Fusheng Li, Dan Lin, and Hanxin Zhu. Efficient experience replay based deep deterministic policy gradient for agc dispatch in integrated energy system. Applied energy, 285:116386, 2021.
- Li and Chen [2021] Yaoming Li and Yun Chen. Enhancing a stock timing strategy by reinforcement learning. IAENG Int. J. Comput. Sci, 48:1–10, 2021.
- Liang et al. [2016] Chen Liang, Jonathan Berant, Quoc Le, Kenneth D Forbus, and Ni Lao. Neural symbolic machines: Learning semantic parsers on freebase with weak supervision. arXiv preprint arXiv:1611.00020, 2016.
- Littman [2015] Michael L Littman. Reinforcement learning improves behaviour from evaluative feedback. Nature, 521(7553):445–451, 2015.
- Liu and Ma [2022] Ge Liu and Wenping Ma. A quantum artificial neural network for stock closing price prediction. Information Sciences, 598:75–85, 2022.
- Liu et al. [2021] Weiwen Liu, Feng Liu, Ruiming Tang, Ben Liao, Guangyong Chen, and Pheng Ann Heng. Balancing accuracy and fairness for interactive recommendation with reinforcement learning. arXiv preprint arXiv:2106.13386, 2021.
- Lucarelli and Borrotti [2019] Giorgio Lucarelli and Matteo Borrotti. A deep reinforcement learning approach for automated cryptocurrency trading. In Artificial Intelligence Applications and Innovations: 15th IFIP WG 12.5 International Conference, AIAI 2019, Hersonissos, Crete, Greece, May 24–26, 2019, Proceedings 15, pages 247–258. Springer, 2019.
- Lucarelli and Borrotti [2020] Giorgio Lucarelli and Matteo Borrotti. A deep q-learning portfolio management framework for the cryptocurrency market. Neural Computing and Applications, 32(23):17229–17244, 2020.
- Lv et al. [2019] Dongdong Lv, Shuhan Yuan, Meizi Li, Yang Xiang, et al. An empirical study of machine learning algorithms for stock daily trading strategy. Mathematical problems in engineering, 2019, 2019.
- Lyons et al. [2018] Mitchell B Lyons, David A Keith, Stuart R Phinn, Tanya J Mason, and Jane Elith. A comparison of resampling methods for remote sensing classification and accuracy assessment. Remote Sensing of Environment, 208:145–153, 2018.
- Ma et al. [2021] Cong Ma, Jiangshe Zhang, Junmin Liu, Lizhen Ji, and Fei Gao. A parallel multi-module deep reinforcement learning algorithm for stock trading. Neurocomputing, 449:290–302, 2021.
- Matharu [2018] Arvind Matharu. Understanding cryptocurrencies: The money of the future. Business Expert Press, 2018.
- Melo et al. [2021] Luckeciano C Melo, Dicksiano C Melo, and Marcos ROA Maximo. Learning humanoid robot running motions with symmetry incentive through proximal policy optimization. Journal of Intelligent & Robotic Systems, 102(3):54, 2021.
- Mendoza-Tello et al. [2019] Julio C Mendoza-Tello, Higinio Mora, Francisco A Pujol-López, and Miltiadis D Lytras. Disruptive innovation of cryptocurrencies in consumer acceptance and trust. Information Systems and e-Business Management, 17:195–222, 2019.
- Mirowski et al. [2016] Piotr Mirowski, Razvan Pascanu, Fabio Viola, Hubert Soyer, Andrew J Ballard, Andrea Banino, Misha Denil, Ross Goroshin, Laurent Sifre, Koray Kavukcuoglu, et al. Learning to navigate in complex environments. arXiv preprint arXiv:1611.03673, 2016.
- Nakamoto and Bitcoin [2008] Satoshi Nakamoto and A Bitcoin. A peer-to-peer electronic cash system. Bitcoin.–URL: https://bitcoin. org/bitcoin. pdf, 4(2), 2008.
- Păuna [2019] Cristian Păuna. A prediction model using the price cyclicality function optimized for algorithmic trading in financial market. International Journal of Computer and Information Engineering, 13(4):222–230, 2019.
- Sahu et al. [2023] Santosh Kumar Sahu, Anil Mokhade, and Neeraj Dhanraj Bokde. An overview of machine learning, deep learning, and reinforcement learning-based techniques in quantitative finance: Recent progress and challenges. Applied Sciences, 13(3):1956, 2023.
- Sattarov et al. [2020] Otabek Sattarov, Azamjon Muminov, Cheol Won Lee, Hyun Kyu Kang, Ryumduck Oh, Junho Ahn, Hyung Jun Oh, and Heung Seok Jeon. Recommending cryptocurrency trading points with deep reinforcement learning approach. Applied Sciences, 10(4):1506, 2020.
- Schulman et al. [2017] John Schulman, Filip Wolski, Prafulla Dhariwal, Alec Radford, and Oleg Klimov. Proximal policy optimization algorithms. arXiv preprint arXiv:1707.06347, 2017.
- Silver et al. [2014] David Silver, Guy Lever, Nicolas Heess, Thomas Degris, Daan Wierstra, and Martin Riedmiller. Deterministic policy gradient algorithms. In International conference on machine learning, pages 387–395. Pmlr, 2014.
- Srivastava et al. [2021] Praveen Ranjan Srivastava, Zuopeng Justin Zhang, and Prajwal Eachempati. Deep neural network and time series approach for finance systems: predicting the movement of the indian stock market. Journal of Organizational and End User Computing (JOEUC), 33(5):204–226, 2021.
- Swathi et al. [2022] T Swathi, N Kasiviswanath, and A Ananda Rao. An optimal deep learning-based lstm for stock price prediction using twitter sentiment analysis. Applied Intelligence, 52(12):13675–13688, 2022.
- Thinh et al. [2022] Pham Cong Thinh, Nguyen Tien Luan, and Lam Duc Khai. A hardware implementation for deep reinforcement learning machine. In 2022 RIVF International Conference on Computing and Communication Technologies (RIVF), pages 209–213. IEEE, 2022.
- Touzani et al. [2021] Samir Touzani, Anand Krishnan Prakash, Zhe Wang, Shreya Agarwal, Marco Pritoni, Mariam Kiran, Richard Brown, and Jessica Granderson. Controlling distributed energy resources via deep reinforcement learning for load flexibility and energy efficiency. Applied Energy, 304:117733, 2021.
- Tran et al. [2023] Minh Tran, Duc Pham-Hi, and Marc Bui. Optimizing automated trading systems with deep reinforcement learning. Algorithms, 16(1):23, 2023.
- Wang et al. [2023] Yuewei Wang, Xiaodao Chen, and Lizhe Wang. Deep reinforcement learning-based rescue resource distribution scheduling of storm surge inundation emergency logistics. IEEE Transactions on Industrial Informatics, 2023.
- Weng et al. [2020] Liguo Weng, Xudong Sun, Min Xia, Jia Liu, and Yiqing Xu. Portfolio trading system of digital currencies: A deep reinforcement learning with multidimensional attention gating mechanism. Neurocomputing, 402:171–182, 2020.
- Wu et al. [2021] Mu-En Wu, Jia-Hao Syu, Jerry Chun-Wei Lin, and Jan-Ming Ho. Portfolio management system in equity market neutral using reinforcement learning. Applied Intelligence, pages 1–13, 2021.
- Zhang et al. [2018] Shaomin Zhang, Lixin Li, Jiaying Yin, Wei Liang, Xu Li, Wei Chen, and Zhu Han. A dynamic power allocation scheme in power-domain noma using actor-critic reinforcement learning. In 2018 IEEE/CIC International Conference on Communications in China (ICCC), pages 719–723. IEEE, 2018.