SiamAF: Learning Shared Information from ECG and PPG Signals for Robust Atrial Fibrillation Detection
Abstract
Atrial fibrillation (AF) is the most common type of cardiac arrhythmia. It is associated with an increased risk of stroke, heart failure, and other cardiovascular complications, but can be clinically silent. Passive AF monitoring with wearables may help reduce adverse clinical outcomes related to AF. Detecting AF in noisy wearable data poses a significant challenge, leading to the emergence of various deep learning techniques. Previous deep learning models learn from a single modality – either electrocardiogram (ECG) or photoplethysmography (PPG) signals. However, deep learning models often struggle to learn generalizable features and rely on features that are more susceptible to corruption from noise, leading to sub-optimal performances in certain scenarios, especially with low-quality signals. Given the increasing availability of ECG and PPG signal pairs from wearables and bedside monitors, we propose a new approach, SiamAF, leveraging a novel Siamese network architecture and joint learning loss function to learn shared information from both ECG and PPG signals. At inference time, the proposed model is able to predict AF from either PPG or ECG and outperforms baseline methods on three external test sets. It learns medically relevant features as a result of our novel architecture design. The proposed model also achieves comparable performance to traditional learning regimes while requiring much fewer training labels, providing a potential approach to reduce future reliance on manual labeling.
Keywords Atrial fibrillation PPG ECG, photoplethysmography electrocardiogram convolutional neural network Siamese network resnet contrastive learning joint training
1 Introduction
Atrial fibrillation (AF) is the most prevalent form of cardiac arrhythmia affecting approximately 1-2% of the general population and up to 9% of individuals aged 65 years or older. [1, 2] AF contributed to over 183K deaths in the US alone in 2019 [3]. It is estimated to be present in 6-12 million people worldwide, and AF prevalence is projected to continuously increase in the next 30 years [4]. Paroxysmal AF episodes often present little to no symptoms – that patients do not usually notice immediately – that are crucial precursors to more serious health conditions, including ischemic stroke and congestive heart failure. Therefore, the detection of AF episodes has become imperative in the treatment and prevention of cardiovascular disease. AF detection has been transformed by the growing popularity of wearable devices with photoplethysmography (PPG) sensors, such as smartwatches. These devices are widely available, providing a non-invasive means for continuous heart rhythm monitoring in day-to-day ambulatory settings. The availability of smartwatch PPG data, as well as electrocardiogram (ECG) and PPG monitoring in hospital settings, has created an unprecedented surge in heart monitoring data availability. The sheer volume of data produced from wearable devices and bedside monitors has rendered manual reviewing of recorded signals intractable, leading to a growing demand for automated or assistive systems that can help clinicians detect AF. Therefore, there is a pressing demand for the development of algorithms capable of timely and precise detection of AF.
There have been numerous works leveraging machine learning [5, 6, 7, 8, 9, 10, 11] and specifically deep learning algorithms [12, 13, 14, 15, 16, 17, 18] for automating AF detection. These models were trained either using ECG or PPG signals, despite the availability of both modalities (PPG signals are usually labeled using ECG as the gold standard). Both ECG and PPG signals carry crucial information for detecting AF. Clinically, ECG signals reveal different types of arrhythmias that may present similarly in PPG; the addition of ECG signal features to PPG AF detection pipelines should thus improve detection performance. Moreover, if one of the signal modalities contains artifacts (e.g., motion artifacts, environmental lighting artifacts), the other can compensate for the loss of information. Although ECG and PPG use different collection mechanisms (i.e., ECG uses electrodes, PPG uses photodetectors) to measure the pulsatile changes, heart rate variability and other factors can be monitored by both signals. Therefore, we hypothesize it will be beneficial to leverage both signal modalities for AF detection.
In this work, we introduce a novel AF detection algorithm, SiamAF, which learns robust and medically relevant features from both ECG and PPG signals. As we will demonstrate, the model successfully learns the shared information between the two signal modalities through a novel model architecture and loss function.
This study has the following contributions:
-
•
To our knowledge, this is the first study leveraging shared information between ECG and PPG signals for AF detection. Our novel architecture and loss function design encourage the model to learn shared information and improve prediction robustness.
- •
-
•
We investigate the information learned by the model and verify the effectiveness of our proposed method through dimension reduction and visualizations of latent features.
-
•
Using only 1% of the training labels, the proposed method outperforms baseline methods. The proposed model learns signal features by learning shared information between ECG and PPG signals in a contrastive fashion in addition to learning to classify AF. The semi-supervised learning setup utilizes data more efficiently compared to previous traditional models learning from a single modality.
-
•
The proposed method learns a single model that can be used for AF detection on both ECG or PPG signals with no performance sacrifice for either modality.
2 Related Works
We consider related work in AF detection with hand-crafted features, deep learning for AF detection, and Siamese networks.
Hand-crafted features for AF detection. There have been multiple past works that developed hand-crafted features of the ECG or PPG input signals for training machine learning-based AF classifiers. These include the Root Mean Square of the Successive Difference of peak-to-peak intervals (RMSSD), Shannon entropy (ShE), spectral analysis, dynamic time warping for waveform shape analysis and template matching, as well as other statistical features such as mean, variance, standard deviation, skewness and kurtosis of input signals [5, 6, 7, 8, 9, 10, 11]. These features are fed into standard machine learning classification algorithms.
Most hand-crafted features rely on accurate peak detection in the raw signals, which is often unreliable, given poor signal qualities. These challenges have made the hand-crafted features approach difficult for widespread applications.
Deep learning for AF detection. Deep learning networks automatically learn and extract features from raw inputs. Deep convolutional neural networks (DCNN/CNN) have been popular as feature extractors for both images [20] and time series due to their unique ability to preserve useful information. There have been several CNN-based AF detection algorithms [12, 13, 14, 15, 16, 17, 18]. Some researchers convert the 1-D signals into 2-D images using the short-term Fourier transform (STFT) and stationary wavelet transform (SWT) [21, 22] for 2D-CNNs. Due to the time series nature of ECG and PPG signals, many researchers leverage recurrent neural networks (RNNs) for AF detection due to their ability to capture temporal relations and their flexibility with variable length inputs. Some of its variants, including the long short-term memory network (LSTM) and recurrent-convolutional neural network, have also been used for AF detection [23, 24, 25, 26, 27]. While deep neural networks are more adaptable than hand-crafted features-based machine learning methods, they require significantly more labeled data to achieve performance equivalent to the best AF detectors. Deep learning models are prone to overfitting, especially on trivial task-irrelevant features. This is often demonstrated through the sensitivity of deep neural nets to signals that are low quality and contain signal artifacts; we can expect worse performances of the trained models on these low-quality signals [28, 29]. Deep learning methods also suffer from a lack of interpretability. It is difficult, if not impossible, for humans to understand the discovered features and decision processes of the deep neural networks; combined with the susceptibility to overfitting, it leads to an increased risk of undetected failure in real-world applications when operating conditions change or the model fails to generalize [30, 31].
Two Modalities. Previous studies only trained their models using either ECG or PPG signals [5, 6, 7, 8, 9, 10, 11, 12, 13, 14, 15, 16, 17, 18, 32, 33, 34, 35, 23, 24, 25, 26, 27, 21, 22, 36], despite the availability of both modalities measured simultaneously on the same individuals. As we will show, both ECG and PPG signals carry crucial information for detecting AF; neither modality should be wasted during training.
Siamese networks. The Siamese network architecture (models with two branches or subnetworks) is useful for dual input scenarios. In recent years, Siamese networks have seen a rise in popularity due to their usefulness for self-supervised learning [37, 38, 39]. However, Siamese self-supervised networks are difficult to train and rely heavily on image augmentations.
3 Methods
The training data is denoted as . Our joint training framework takes a pair of time-synchronized ECG and PPG signals as input ( and ), and a binary label of AF/non-AF () generated automatically from the hospital alarm. The auto-generated labels contain a certain amount of noise. Our proposed framework learns by simultaneously maximizing the agreement between the latent projections of the ECG-PPG signal pairs, and minimizing the misclassification error of the classifications from the ECG and PPG signals. Our framework is a Siamese network with five major components:
-
•
A neural network encoder which takes both the ECG and PPG signals as inputs. The encoder extracts feature representations from the raw inputs. In theory, the architecture of the encoder can take any form, so future applications can choose a different architecture than the specific one used here. Here we use a 1-D version of the ResNet-34 [40] architecture for the encoder due to its effectiveness for physiological signals.
-
•
A multi-layer-perception projector with one hidden layer. The projector takes the feature outputs from the encoder as input. The projector will map the extracted features from the encoder to a latent space where we maximize the agreements between the features of ECG and PPG signals. The projected views are denoted as for an ECG input and for a PPG input. (Function is the same regardless of whether we translate ECG to PPG or vice versa.)
-
•
A multi-layer-perception predictor with no hidden layers. The predictor takes one of the projector’s outputs from the ECG-PPG pair, and further maps the projected views. We denote the predictor’s predictions as for an ECG input and for a PPG input. (Here the functions , , and are the same regardless of whether we translate ECG to PPG or vice versa and regardless of whether we predict for ECG or PPG.)
-
•
A supervised branch classification head , consists of one linear layer. It takes the output from the encoder as input, and produces logits of for an ECG input and for a PPG input.
-
•
A loss function combing both the agreement and classification objectives. The agreement objective is to maximize the cosine distance between the pair and between the pair. We formulate the agreement objective loss function as follows:
(1) Here is the -norm and is the inner product. To minimize the misclassification error, we employ the cross-entropy loss. By using a hyper-parameter , the final loss function is formulated as a weighted combination of the agreement loss and the classification loss; it is defined as follows:
(2)
In cases of incomplete ECG and PPG pairs (either ECG or PPG signals) in the training data, we can accommodate that in our framework by adding two additional loss terms, one for additional PPG data and one for additional ECG data:
| (3) | ||||
In addition to the previously introduced model information, Algorithm 1 illustrates the training algorithm of the proposed framework. After the training is complete, we discard the projector and predictor and keep the learned encoder and the classification head for future predictions. At test time, the learned network can work with either ECG or PPG signals without requiring an ECG-PPG pair.
4 Datasets
We used a large-scale dataset from Institution A (University of California San Francisco medical center) for training and three additional datasets for evaluation, including a dataset from Institution B (University of California Los Angeles medical center), as well as the Stanford dataset test split [18], and the Simband dataset [41].
4.1 Institution A dataset
The Institution A (University of California San Francisco medical center) dataset contains 28539 patients in hospital settings; the patients’ continuous ECG and PPG signals were recorded from the bedside monitors. The bedside monitor produced alarms for events including atrial fibrillation (AF), premature ventricular contraction (PVC), Tachy, Couplet, etc. This study focuses on AF, PVC, and normal sinus rhythm (NSR). The samples with PVC and NSR labels were combined into the Non-AF samples group, thus forming the AF vs Non-AF binary classification task. The continuous ECG and PPG signals were sliced into 30-second non-overlap segments sampled at 240Hz (each signal strip contains 7,200 timesteps). The 30-second segments were then down-sampled to 2,400 timesteps (80Hz sampling rate). During the pre-processing step, invalid samples (e.g., empty signals files, missing ECG or PPG signals) were also filtered out. There are four ECG channels in this dataset, we used the first ECG channel for our study due to its resemblance to wearable device outputs. The dataset was split into the train and validation splits by patient ids. The train split of the Institution A dataset contains 13,432 patients, 2,757,888 AF signal segments, and 3,014,334 Non-AF signal segments; the validation split contains 6,616 patients, 1,280,775 AF segments, and 1,505,119 Non-AF segments. Due to the automatic nature of bedside monitor-generated labels, the dataset likely contains label noise. For a detailed description of the alarm labeling process and the additional pre-processing steps please see our parallel work [29]. For detailed demographic information of patients who participated in this study, please refer to Tab.3. The data collection process followed strict guidelines and the study was approved by the Institutional Review Board (IRB number:14-13262). A waiver of informed patient consent was granted for this study, as the investigation solely involved the analysis of de-identified patient data.
4.2 Institution B dataset (Test set 1)
The Institution B (University of California Los Angeles medical center) dataset contains 126 patients in hospital settings and simultaneous continuous ECG and PPG signals were collected at Institution B. The patients have a minimum age of 18 and a maximum age of 95 years old and were admitted from April 2010 to March 2013. The continuous signals were sliced into 30-second non-overlapping segments and again downsampled to 80Hz sampling rate with 2,400 timesteps in each signal. The dataset contains 38,910 AF and 220,740 Non-AF segments. Board-certified cardiac electrophysiologists annotated all AF episodes in the Institution B datasets. Here the PPG signals are collected from the fingertips. The use of this dataset for the study was approved by the IRB (IRB approval number: 10-000545). A waiver of informed patient consent was obtained for this study.
4.3 Simband dataset (Test set 2)
The Simband dataset [41] contains 98 patients in ambulatory settings from Emory University Hospital (EUH), Emory University Hospital Midtown (EUHM), and Grady Memorial Hospital (GMH). The patients have a minimum age of 18 years old and a maximum age of 89 years old; patients were admitted from October 2015 to March 2016. The ECG signals were collected using Holter monitors, and the PPG signals were collected from a wrist-worn Samsung Simband. The signals used for testing were 30-second segments with 2,400 timesteps after pre-processing. This dataset contains 348 AF segments and 506 Non-AF segments. The signals in this dataset were reviewed and annotated by an ECG technician, physician study coordinator, and cardiologist. The data were collected with patient consent and IRB approval (IRB approval number: 00084629).
4.4 Stanford dataset (Test set 3)
The Stanford dataset [18] contains 107 AF patients, 15 paroxysmal AF patients, and 41 healthy patients. The 41 healthy patients also undergo an exercise stress test. All signals in this dataset were recorded in ambulatory settings. The ECG signals were collected from an ECG reference device, and the PPG signals were collected from a wrist-worn device. The signals were sliced into 25-second segments by the original author. In this study, we augmented the signal to 30 seconds by pasting the first 5 seconds of each signal to the end and re-sampled the signals to 2,400 timesteps. The dataset contains 52,911 AF segments and 80,620 Non-AF segments. In the evaluations, we use the test split generated by the authors of the Stanford dataset. The PPG signals in this dataset were manually annotated and reviewed by several cardiologists following computerized reference ECG signals.
5 Experiments and Evaluation Results
5.1 Performance comparison with baseline methods
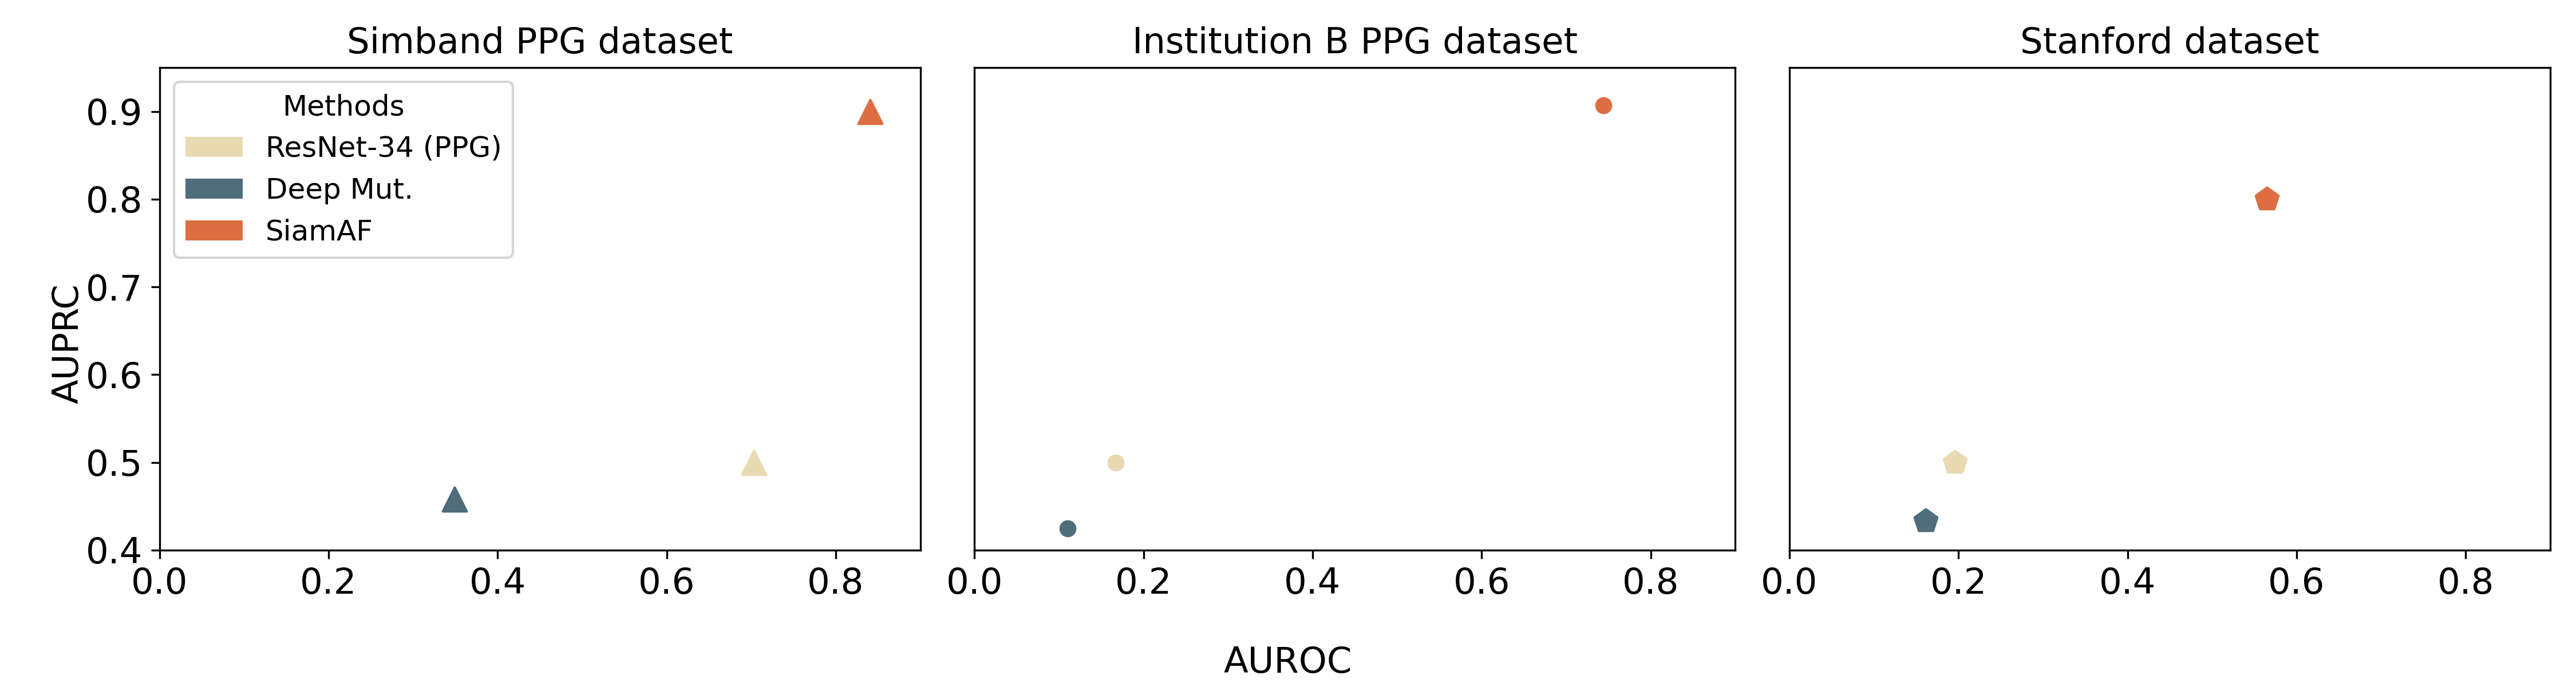
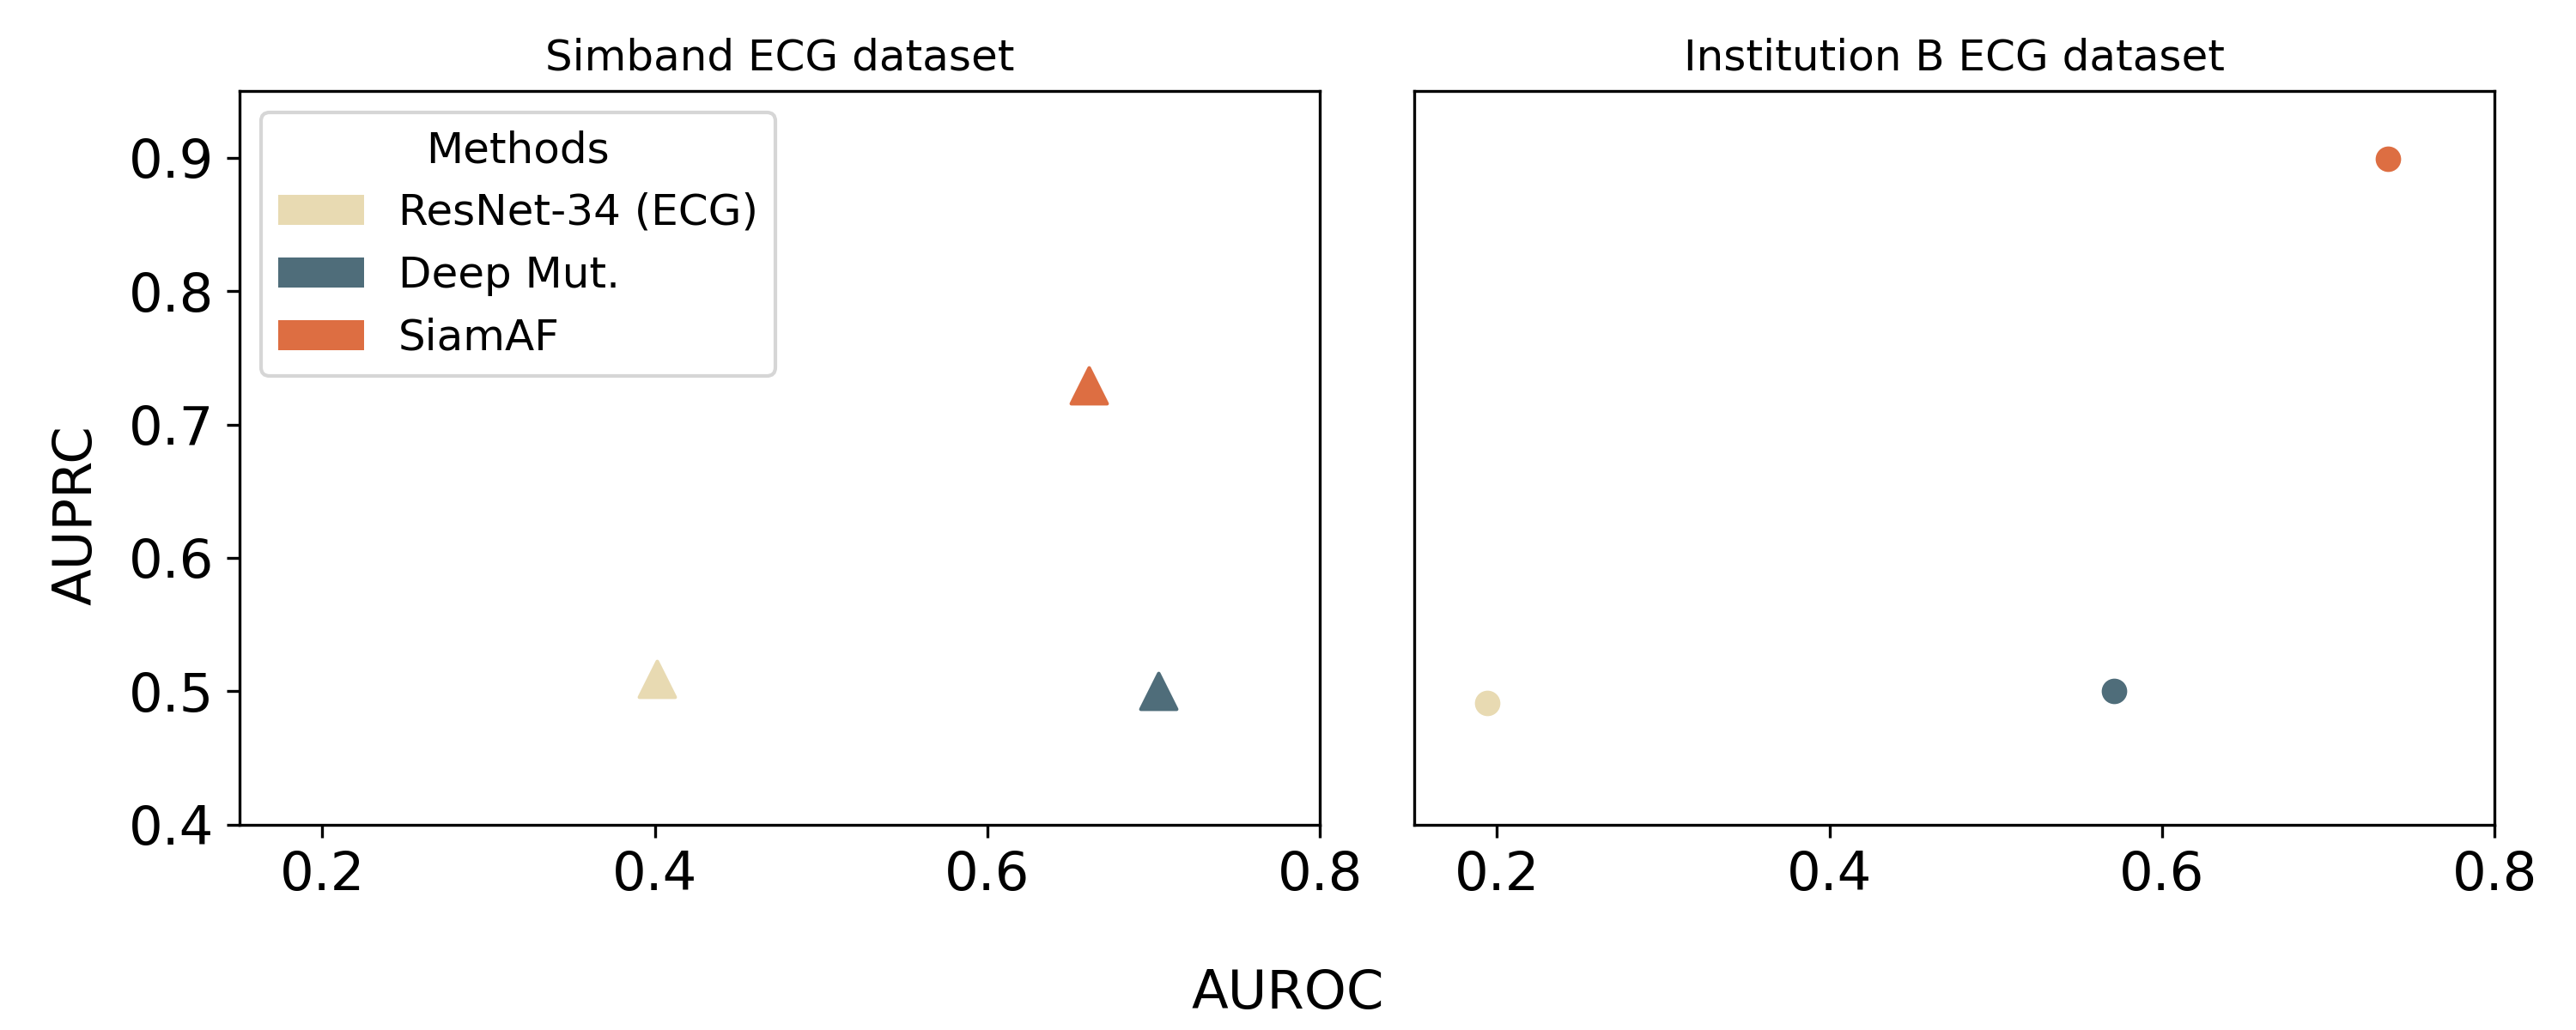
We verify our framework’s performance advantage by comparing it to three baseline methods: (1a) A ResNet-34 [40] classifier trained on only PPG data; (1b) A ResNet-34 [40] classifier trained on only ECG data; (2) A Deep Mutual Learning [19] (Deep Mut. for short) network using ResNet-34 as encoders; (3) The public DeepBeat model from the authors of [18]. The ResNet-34 baselines serve as representations of performance in previous deep learning AF detection studies, where convolutional neural networks appear as a popular choice [12, 13, 14, 15, 16, 17]. The Deep Mut. baseline is known for its ability to extract shared information from dual inputs through “mutual learning”; which could be suitable for our intended use. The performance of the models is evaluated on the three external datasets we introduced in Section 4. In this work, we do not compare against hand-crafted feature-based AF classifiers due to their lackluster performance compared to deep learning methods, demonstrated in previous works [18]. We trained two ResNet-34 baselines for the ECG and PPG signals. The Deep Mut. baseline contains two separate models for the two signal modalities. The Stanford DeepBeat baseline only operates on PPG signals. We will use both AUROC (area under the receiver-operator-characteristic curve) and AUPRC (area under the precision-recall curve) as evaluation metrics. We also conducted bootstrapping tests with 1000 bootstrapping samples for statistical significance comparisons.
The evaluation results are shown in Figure 2. In the PPG test sets, the proposed method SiamAF performs comparably or substantially better than the baseline methods; in the ECG test sets, our method outperforms the baseline methods by a significant margin. For detailed values and the description of the bootstrapping calculation, please refer to Section 11.1, Tables 4 and 5 in the appendix.
5.2 Exploration on learned representations and interpretability
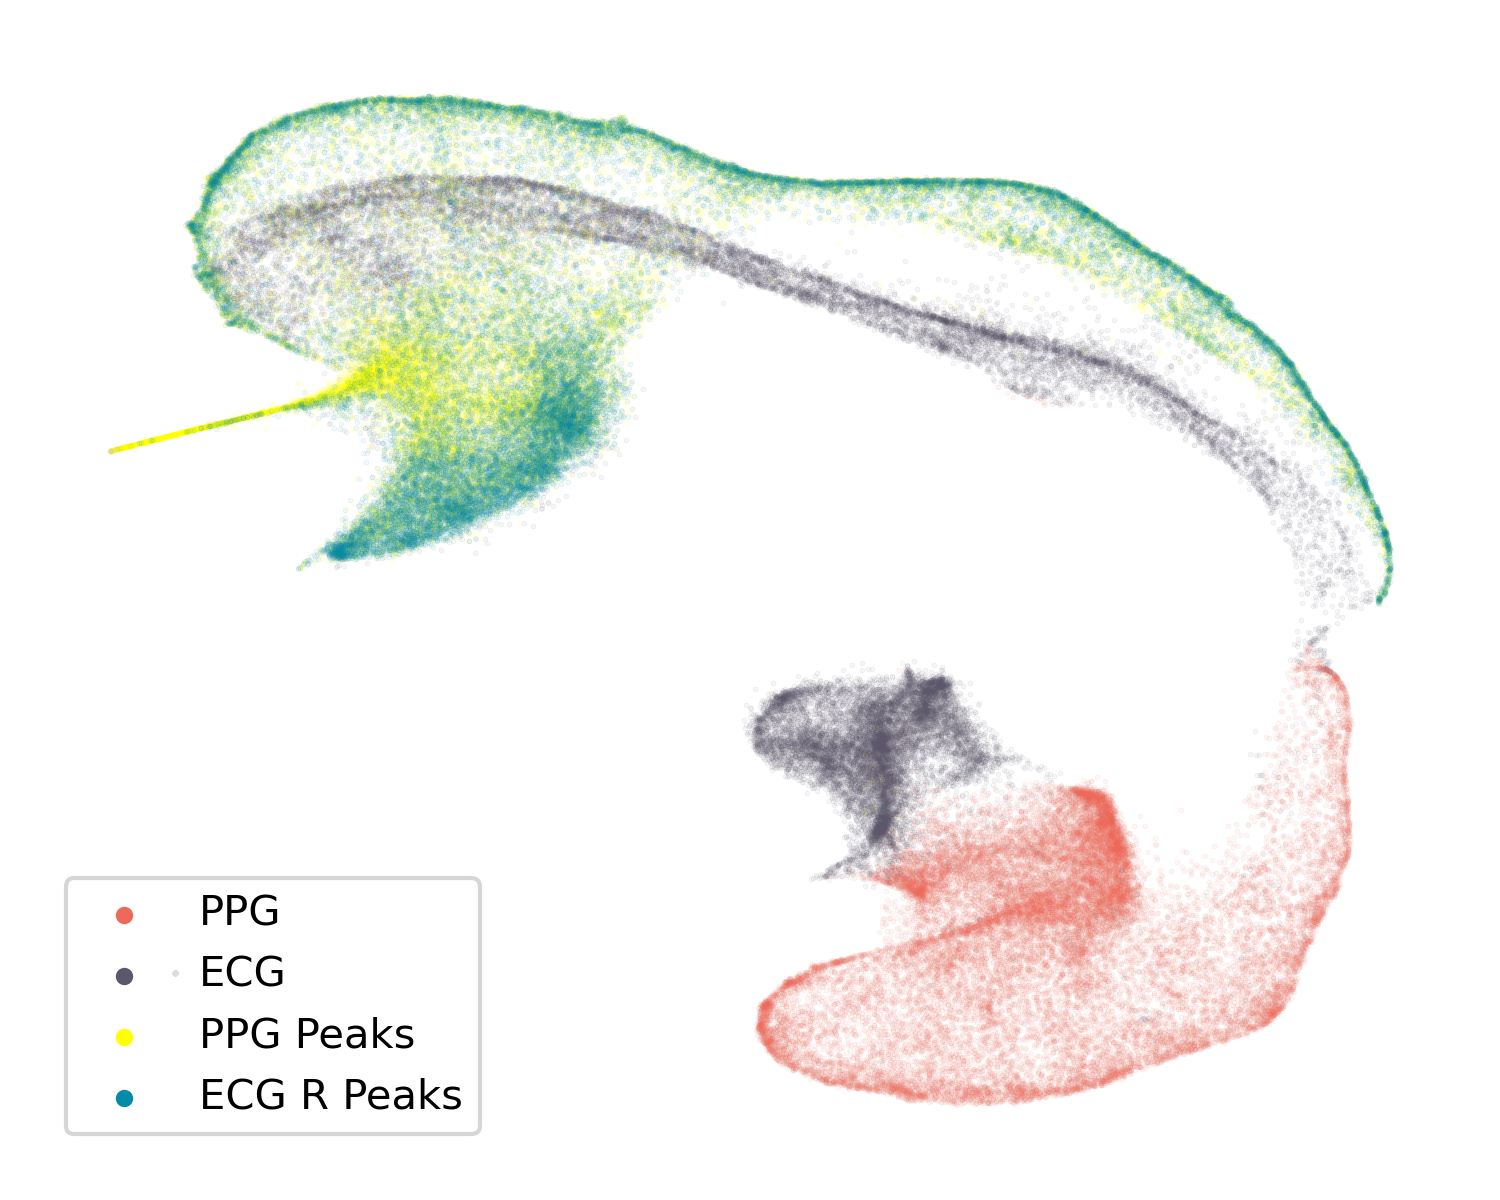
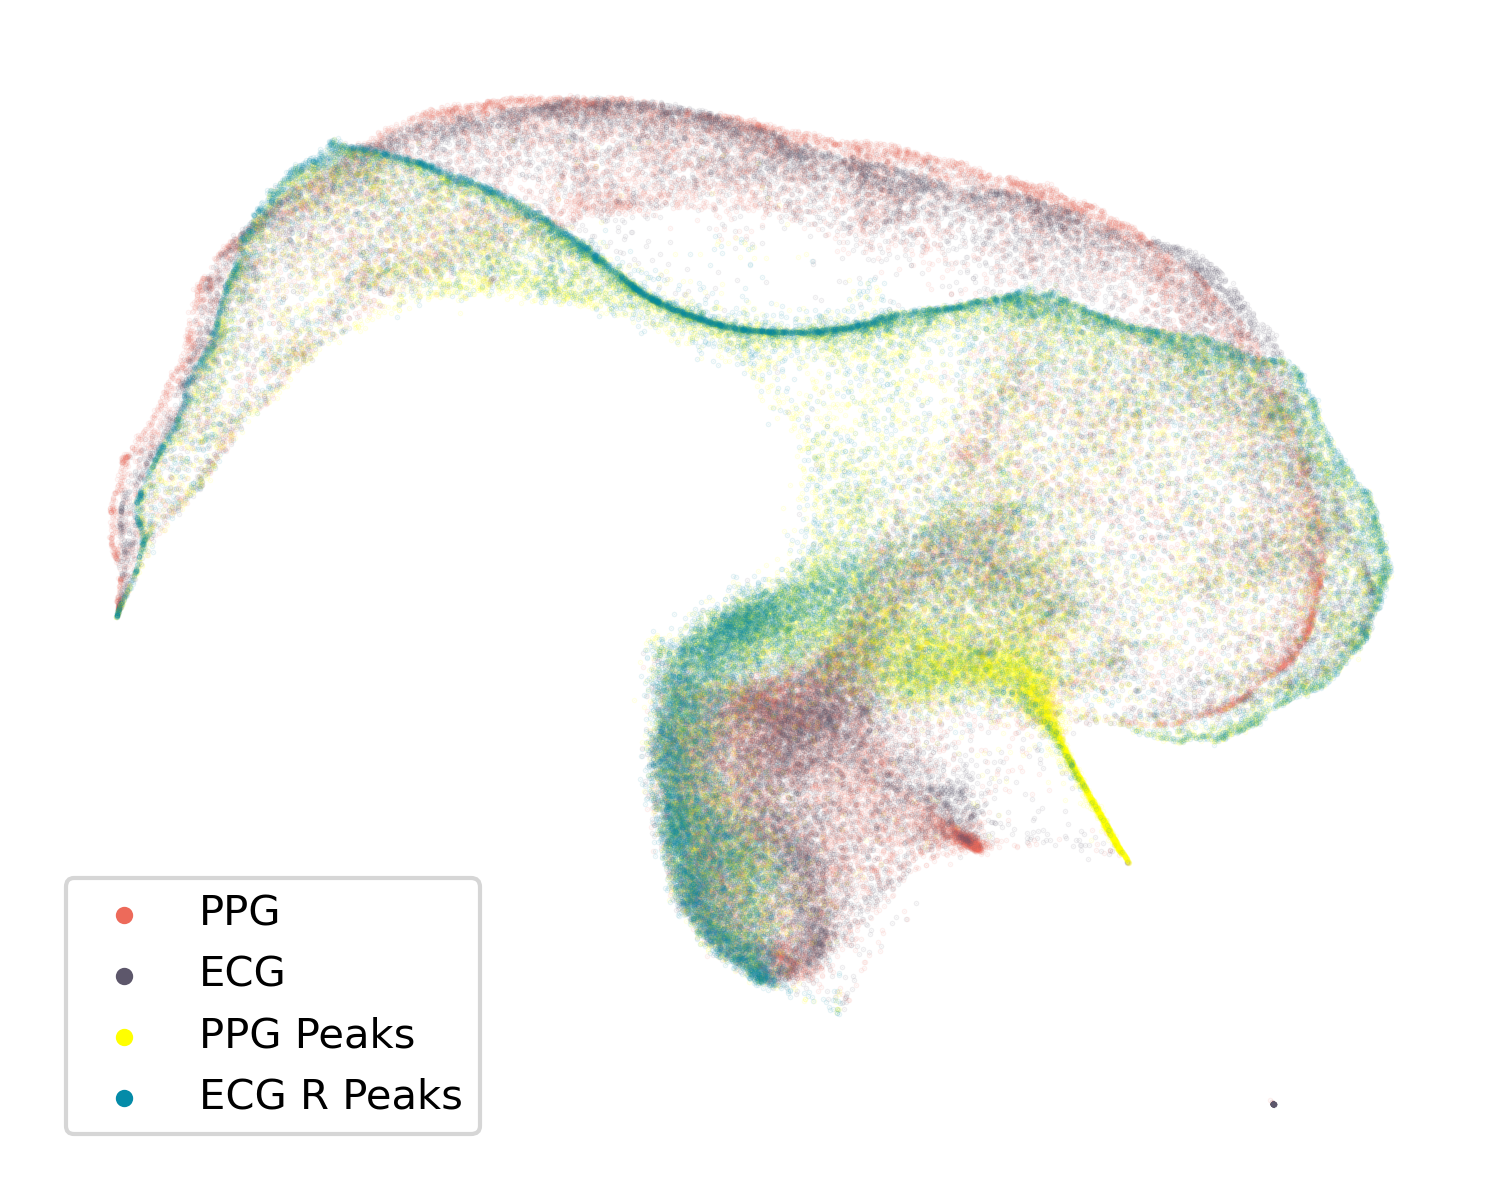
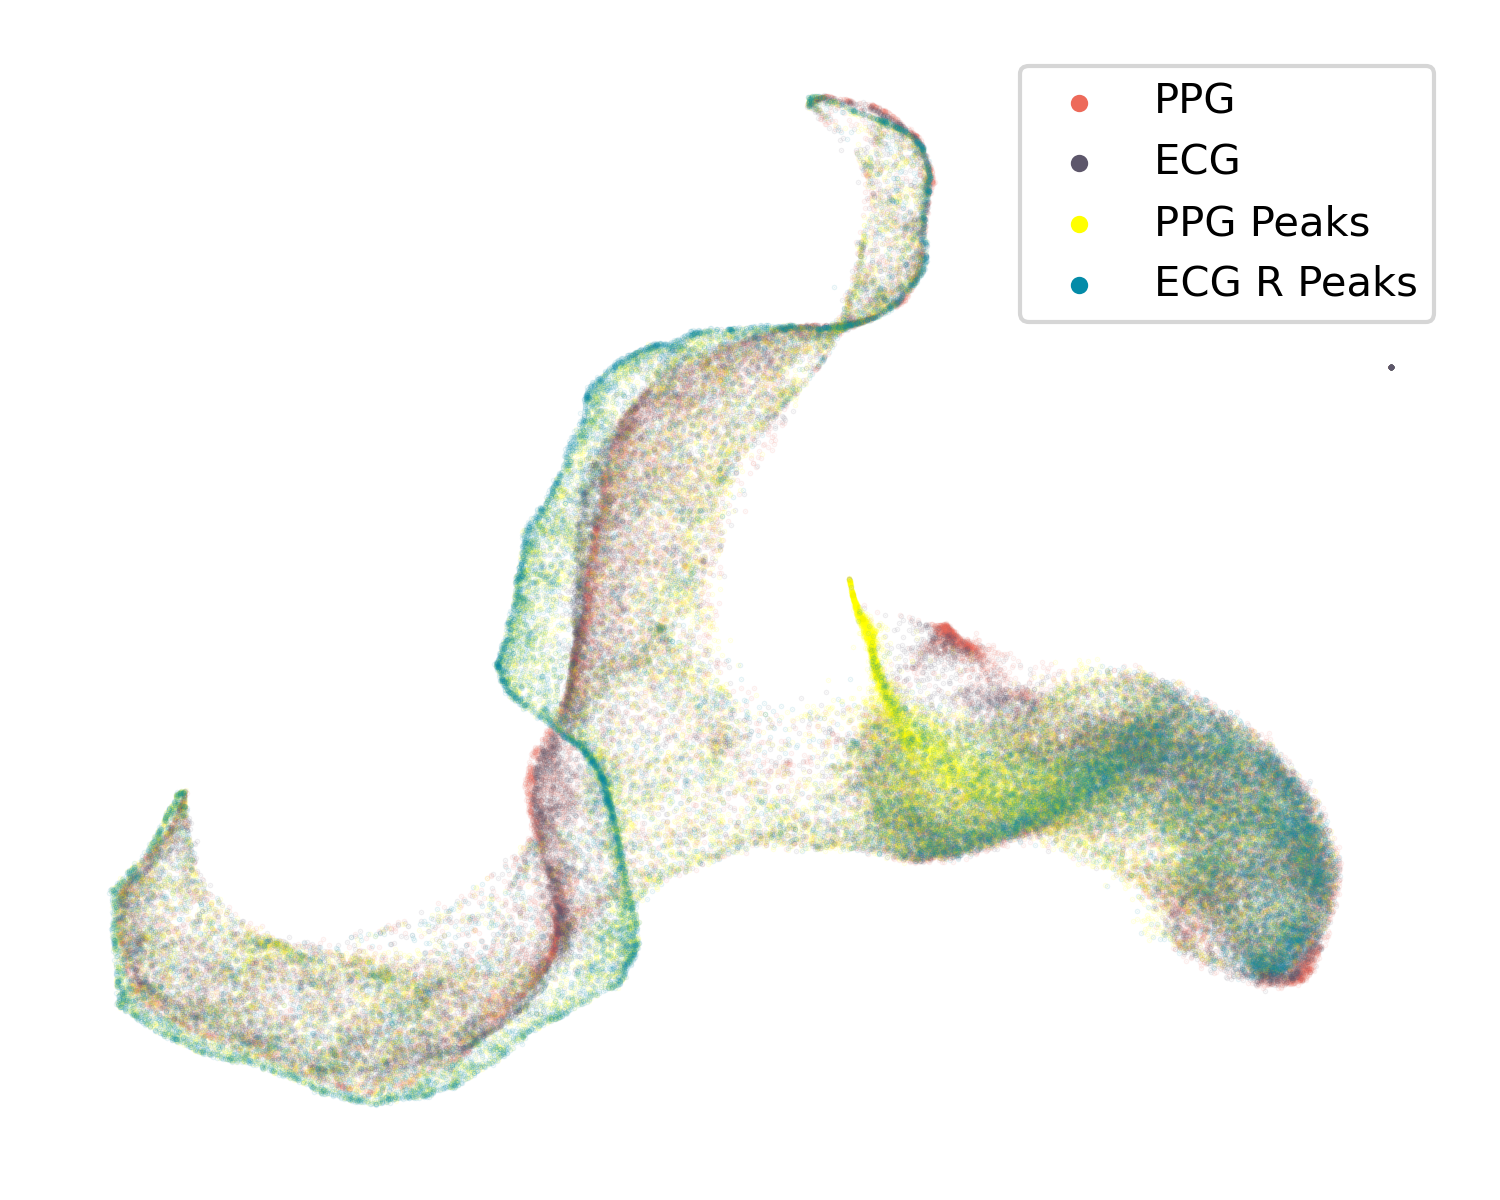
ECG and PPG signals contain similar data, including RR (heartbeat) intervals and peaks, which are important diagnostic indicators for AF by human experts. We designed our model based on these facts, by encouraging it to learn and exploit the shared information between the two modalities for AF detection. Ideally, our model should behave similarly to humans utilizing this shared information (e.g., RR intervals) for the AF detection task. To verify our design approach, we explore the learned representation of the encoder in our proposed framework through dimension reduction and visualization of the activations from layers in the network. For visualization purposes, we randomly sub-sampled 1% of the validation set and passed the samples through the learned ResNet-34 encoder in our proposed method.
Medically, signal peaks and peak intervals from the PPG and ECG signals are crucial information for AF detection. Naturally, in a robust model, peak information should likewise contribute substantially toward AF classification. For non-noisy data, the peaks are time-synchronized between PPG and ECG signals. By using only the peaks from the PPG signal, we can capture essential information for AF detection that is comparable to the information obtained from using the entire PPG signal. Likewise, the model should behave similarly when we retain only the peaks in ECG signals to when we retain the full ECG signal. Finally, the PPG and ECG signals contain similar information to each other, which means that for AF detection, they likely will map to the same neighborhood in the latent space.
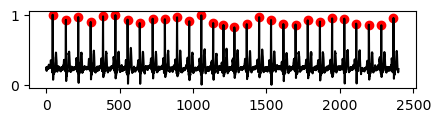
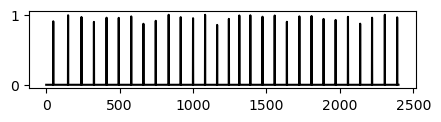
We can verify these expected behaviors through visualization of the latent space. To do so, we extract peak information from the PPG signals using the heartpy toolkit [42, 43] and the R peaks in the ECG signals with NeuroKit2 [44]. We create new peak-only PPG signals that are set to 0 everywhere except at the peaks and we do the same for ECG, preserving only all R-peaks. Figure 5 shows an example of the PPG detection and the peak-only signals. These peak-only signals allow us to feed the model only peak information and remove other waveform information. Thus we aim to verify whether (1) the peak-only PPG signals map to the same location in latent space as full PPG signals (and similarly for EEG) and (2) whether the PPG and EEG signals from the same time period of the same patient map to nearby locations in latent space.
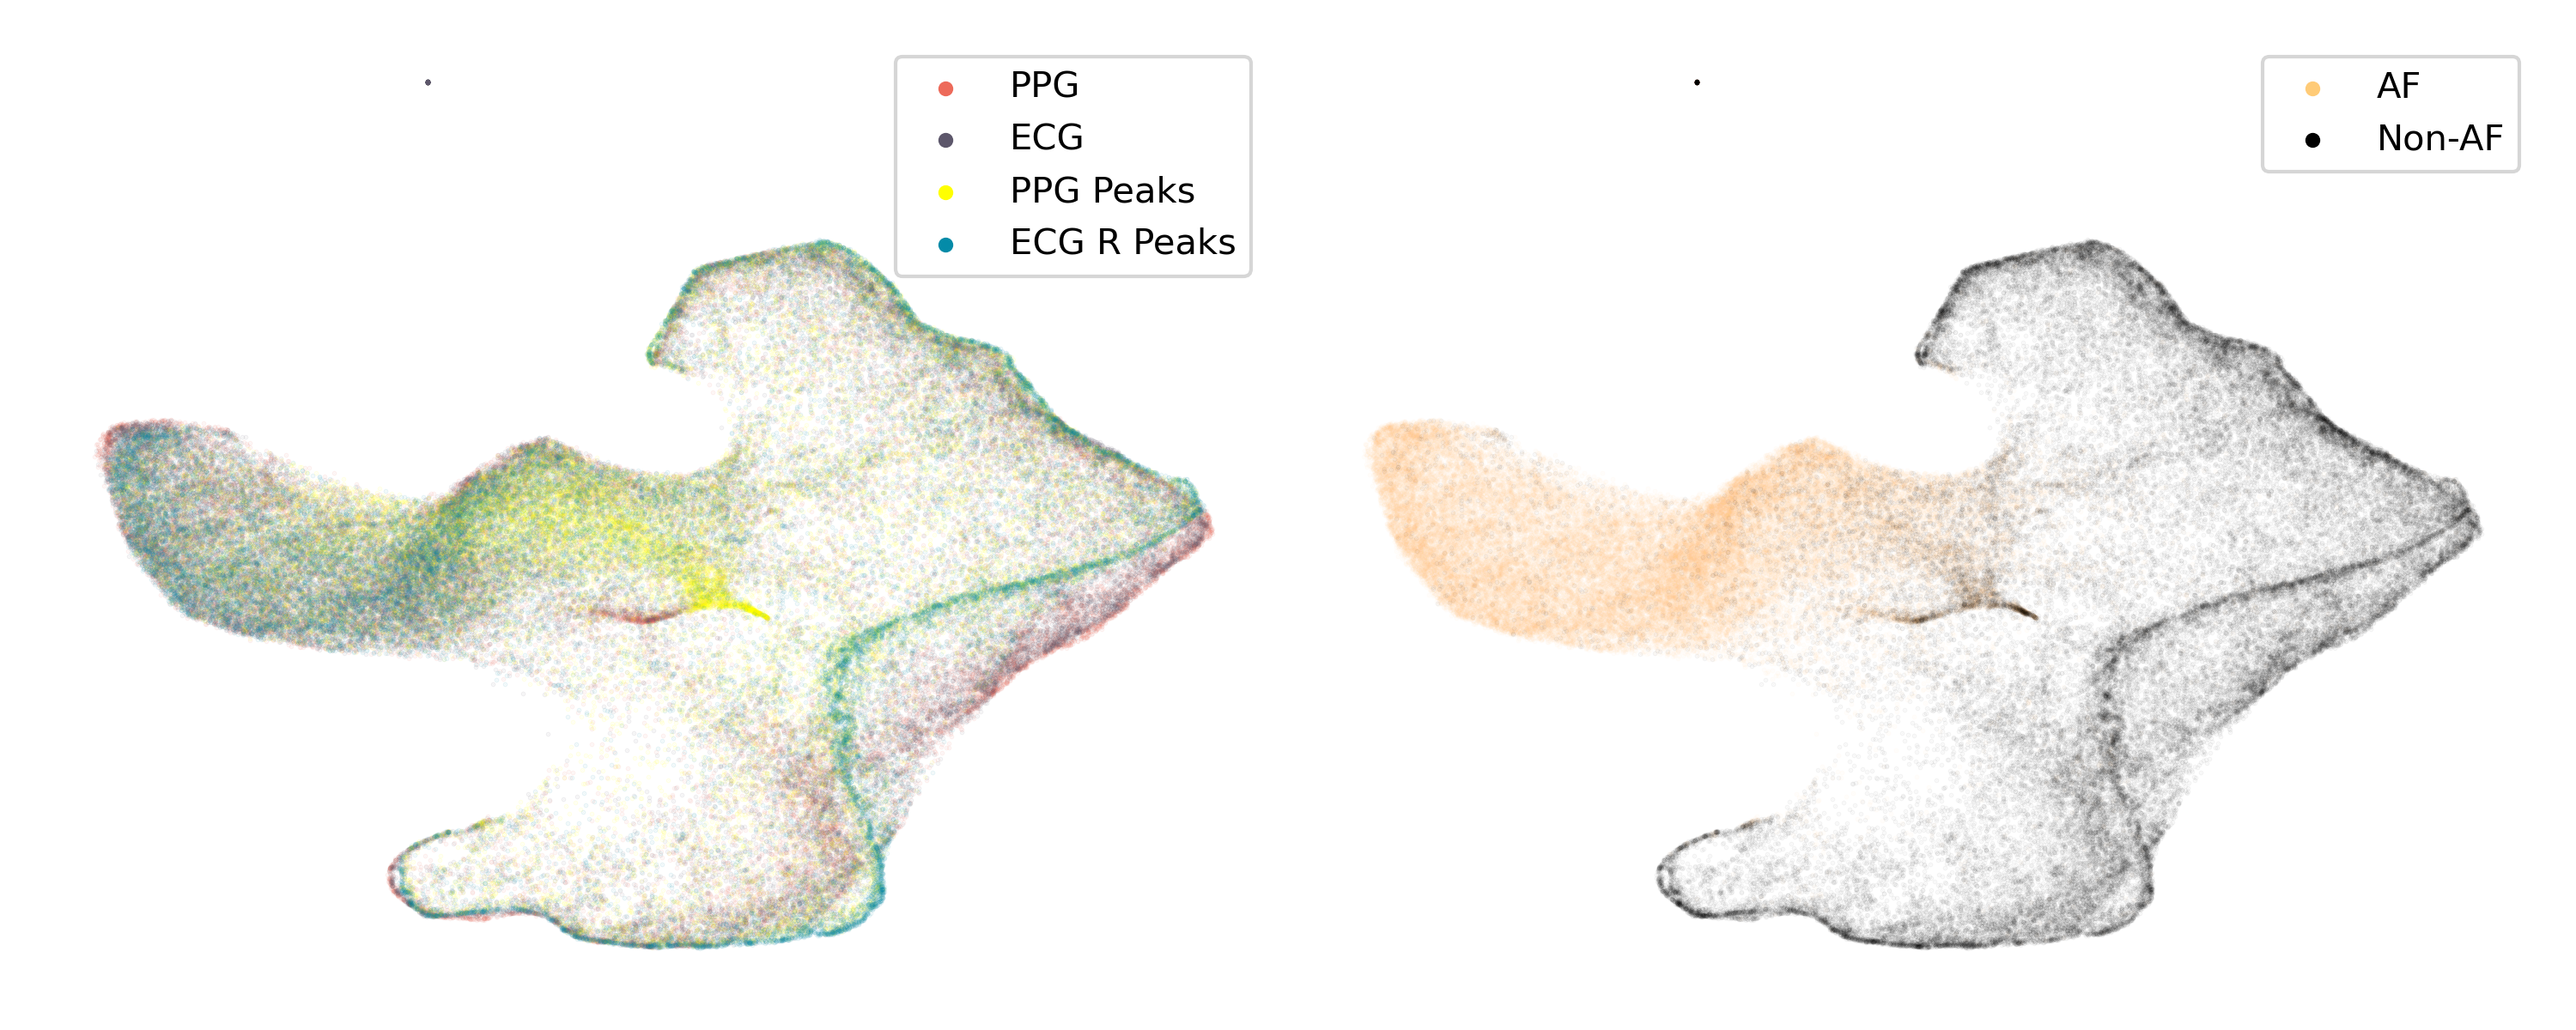
We use PaCMAP [45] to visualize the feature outputs of each pooling layer, shown in Figure 3. We also visualized feature outputs for both ECG and PPG-only and the Deep Mut. baseline models in Figure 4. It is obvious that at the later stage of the learned encoder in our proposed framework, both the PPG and ECG peak-only-signal features overlap almost perfectly with the original PPG and ECG-signal features. This verifies hypotheses (1) and (2) above. In contrast, Figure 4 shows that for the ResNet-34 and Deep Mut. approaches, the encoded peak-only features never overlap with the PPG and ECG features, even at the final stages of the models.
5.3 Extension to semi-supervised learning with limited training labels
Here, we adapt our framework to the case where we have our usual training set, but only a small fraction of the data are labeled. We use the Siamese network to ensure that unlabeled samples can contribute to the learning process by constraining their PPG and ECG features to map to the same locations in latent space. This constraint is applied through learning the we defined in Eq.1. Being able to learn from small labeled training sets is valuable since manual annotation is expensive. While we use auto-generated labels for our study, such labels may not be available for other tasks and applications. Thus, we eliminated 99% of the labels. The changes to the algorithm are minimal, we only need to ensure that during gradient descent, each mini-batch has at least some labeled training data; the easiest way to do this is to duplicate the 1% of labeled samples to use within each mini-batch. To compare with baseline methods, we trained them with 1% of the labeled samples using normal mini-batch training. As shown in Figure 6, the Deep Mut. and ResNet-34 (PPG) baseline failed to learn or achieve meaningful predictive performance, with AUC near 0.5 (random guessing). In contrast, the proposed method achieved reasonable performance; in fact, it achieved comparable performance to that of the ResNet-34 baseline trained with the fully labeled training set. (Recall that ResNet-34 performed worse than our method when both were trained on the fully labeled dataset). For detailed values, please refer to Tables 6 and 7 in the appendix.
5.4 Hyper-parameter selection
During training processes for all experiments, we used 30 training epochs; ResNet-34 baseline models used Adam as the optimizer and a learning rate of 0.0001; the proposed method was trained using the SGD optimizer, with the learning rate set to 0.1 and momentum set to 0.9. For the Deep Mut. baseline, the weight of the KL-divergence loss was set to 0.9. For our proposed method, the was set to 1. We also tested the effect of the hyper-parameter ’s value in our proposed method; test performances were insensitive to the value within the range of 0.2 to 1.2, in this study it was set to 1.0 by default.
6 Discussion
This paper provides a new framework to learn from simultaneous ECG and PPG signals for AF detection. The framework has several important benefits over other approaches: (1) it is more accurate for detecting AF; (2) its latent space reflects that it uses medically-relevant information for AF detection (namely the signal peaks); (3) it can detect AF from either ECG or PPG modalities using a single model; (4) it can be trained in a semi-supervised fashion, where using only 1% of the labels, it can attain performance as good as the baseline approaches that use 100% of the labels.
We make some observations beyond our direct results. First, it seems that learning from simultaneous PPG and ECG is better than learning from them asynchronously (or from either one alone). This can be seen because our method and the only baseline that uses simultaneous PPG/ECG (namely Deep Mut.) perform better than the other methods.
Second, there is a large gap in performance between Deep Mut. and our proposed approach. Since they both use simultaneous PPG/ECG, this gap is likely due to our proposed agreement loss, which directly encourages the encoder to learn coherent latent features between the two signal modalities. On the other hand, the Deep Mut. setup relies on minimizing the KL divergence between the two prediction probability distributions, which is a weaker target that does not incentivize the encoders to focus on shared characteristics that exist in both the ECG and PPG signals. In fact, the two encoders in the two branches of Deep Mut. could be vastly different and focus on less important features.
Third, The DeepBeat baseline performed worse on both Simband and Institution B datasets compared to other baseline methods; this indicates the poor generalizability of the DeepBeat model to finger-tip recorded PPG signals in the Institution B dataset and out-of-distribution data in the Simband dataset. That is, DeepBeat does not seem to generalize beyond the type of data it was trained on, indicating that it is not focusing on the correct aspects of the signal for generalization. It was trained on the Stanford training set, and performs well on the Stanford test set, but not on other datasets. In contrast, our proposed method is trained on data collected in a hospital, yet attained comparable performance to DeepBeat on the Stanford test set, which demonstrates our strong generalizability to ambulatory data.
Fourth, we consider the question of how much non-peak information might be valuable for AF detection. As we saw, other methods seem to be using information other than peaks to detect AF. And, as we also saw, that information does not seem to generalize across modalities (PPG/ECG) and across data collection modes (ambulatory vs. hospital setting). By experimenting with peak-only signals, it appears that, at least in our approach, largely the peak information is used; the model determined this was the important shared information between ECG and PPG signals to retain.
Fifth, we discuss the value and need for labels compared to the value of the agreement loss. Large labeled datasets are expensive to obtain, particularly for medical applications. Our approach performed as well as some of the baselines, even using only 1% of the training labels, meaning that the agreement loss provided quite a lot of information to steer the learning algorithms toward the correct information.
7 Limitations and future works
While it is useful to have training sets that contain noisy signals, in our case, the labels are also noisy, which could hurt the performance of the model. We may need to investigate a robust learning algorithm in future work to improve model performance.
In the experiment in Sec.5.2, we showed that the projection of the peak-only-signal feature highly overlaps with ECG and PPG signal projections. However, it is not a complete overlap, thus we hypothesize that the model still leverages other potential morphological features (e.g., the presence of the P-wave in ECG) for AF classification. Future work should also focus on developing more interpretable networks, which can provide explicit explanations for information used for classification.
In future work, we may consider examining other heart conditions than AF. AF is a prominent heart condition, but many other tasks are worth investigating. It is possible that our framework will assist with those tasks as well. Future studies should also expand the signal modalities beyond ECG and PPG. In this study, ECG and PPG could be framed as augmented measurements of the original heartbeat, augmented through the human body and the collection process. Another direction for future work is data augmentation. As usual, if we knew the transformations of the data that are invariant to AF detection, we could build those into our data, yielding more robust AF detection.
8 Conclusion
In this study, we proposed a new approach for AF detection, SiamAF. The proposed approach leverages a Siamese network architecture and a novel loss function, simultaneously learning from both ECG and PPG signal modalities. By learning common features between the two modalities (namely peaks), our proposed model achieves superior AF detection performance compared to previous studies. Our findings offer a promising avenue for improving AF detection and could potentially benefit patients with known AF, and patients who did not previously know they had AF.
9 Acknowledgements
The present work is partially supported by NIH grants R01HL166233, K23HL125251, and R01HL155711.
10 Reproducibility
All development code for this study is available publicly at https://github.com/chengstark/SiamAF. The retrospective use of the Institution A dataset in this study is conducted according to the terms of a data use agreement between UCSF and Emory University. As a result, the dataset is not available for public use without additional institutional approvals. Similarly, the Institution B dataset is not available for public use. To obtain access to the private datasets utilized in this study, please contact the corresponding author. Requests will undergo evaluation in accordance with the data use agreement established between institutions and may necessitate escalation to the relevant institutional data governance committee(s). The remaining external datasets used for evaluation in this study are publicly available.
References
- [1] S. Colilla, A. Crow, W. Petkun, D. E. Singer, T. Simon, and X. Liu. Estimates of current and future incidence and prevalence of atrial fibrillation in the U.S. adult population. Am J Cardiol, 112(8):1142–1147, Oct 2013.
- [2] Mohammed Salih, Osama Abdel-Hafez, Ramzi Ibrahim, and Rajiv Nair. Atrial fibrillation in the elderly population: Challenges and management considerations. Journal of arrhythmia, 37(4):912–921, 2021.
- [3] Centers for Disease Control and National Center for Health Statistics Prevention. About multiple cause of death, 1999–2019. cdc wonder online database website. https://wonder.cdc.gov/mcd-icd10.html. Accessed: 2021-02-1.
- [4] Giuseppe Lippi, Fabian Sanchis-Gomar, and Gianfranco Cervellin. Global epidemiology of atrial fibrillation: An increasing epidemic and public health challenge. International journal of stroke : official journal of the International Stroke Society, 16(2):217—221, February 2021.
- [5] Lian Krivoshei, Stefan Weber, Thilo Burkard, Anna Maseli, Noe Brasier, Michael Kühne, David Conen, Thomas Huebner, Andrea Seeck, and Jens Eckstein. Smart detection of atrial fibrillation. EP Europace, 19(5):753–757, 2017.
- [6] Valentina D A Corino, Rita Laureanti, Lorenzo Ferranti, Giorgio Scarpini, Federico Lombardi, and Luca T Mainardi. Detection of atrial fibrillation episodes using a wristband device. Physiological Measurement, 38(5):787, Apr 2017.
- [7] Sung-Chun Tang, Pei-Wen Huang, Chi-Sheng Hung, Shih-Ming Shan, Yen-Hung Lin, Jiann-Shing Shieh, Dar-Ming Lai, An-Yeu Wu, and Jiann-Shing Jeng. Identification of atrial fibrillation by quantitative analyses of fingertip photoplethysmogram. Scientific reports, 7:45644, April 2017.
- [8] Mohit Kumar, Ram Bilas Pachori, and U. Rajendra Acharya. Automated diagnosis of atrial fibrillation ecg signals using entropy features extracted from flexible analytic wavelet transform. Biocybernetics and Biomedical Engineering, 38(3):564–573, 2018.
- [9] Roshan Joy Martis, U. Rajendra Acharya, Hojjat Adeli, Hari Prasad, Jen Hong Tan, Kuang Chua Chua, Chea Loon Too, Sharon Wan Jie Yeo, and Louis Tong. Computer aided diagnosis of atrial arrhythmia using dimensionality reduction methods on transform domain representation. Biomedical Signal Processing and Control, 13:295–305, 2014.
- [10] L. M. Eerikainen, A. G. Bonomi, F. Schipper, L. R. C. Dekker, H. M. de Morree, R. Vullings, and R. M. Aarts. Detecting Atrial Fibrillation and Atrial Flutter in Daily Life Using Photoplethysmography Data. IEEE Journal of Biomedical and Health Informatics, 24(6):1610–1618, Jun 2020.
- [11] Shih-Ming Shan, Sung-Chun Tang, Pei-Wen Huang, Yu-Min Lin, Wei-Han Huang, Dar-Ming Lai, and An-Yeu Andy Wu. Reliable ppg-based algorithm in atrial fibrillation detection. In 2016 IEEE Biomedical Circuits and Systems Conference (BioCAS), pages 340–343, 2016.
- [12] Jibin Wang. A deep learning approach for atrial fibrillation signals classification based on convolutional and modified elman neural network. Future Generation Computer Systems, 102:670–679, 2020.
- [13] Bambang Tutuko, Siti Nurmaini, Alexander Edo Tondas, Muhammad Naufal Rachmatullah, Annisa Darmawahyuni, Ria Esafri, Firdaus Firdaus, and Ade Iriani Sapitri. Afibnet: an implementation of atrial fibrillation detection with convolutional neural network. BMC Medical Informatics and Decision Making, 21(1):216, Jul 2021.
- [14] Serkan Kiranyaz, Turker Ince, and Moncef Gabbouj. Real-time patient-specific ecg classification by 1-d convolutional neural networks. IEEE Transactions on Biomedical Engineering, 63(3):664–675, 2016.
- [15] Supreeth Prajwal Shashikumar, Amit J. Shah, Qiao Li, Gari D. Clifford, and Shamim Nemati. A deep learning approach to monitoring and detecting atrial fibrillation using wearable technology. In 2017 IEEE EMBS International Conference on Biomedical & Health Informatics (BHI), pages 141–144, 2017.
- [16] Maxime Voisin, Yichen Shen, Alireza Aliamiri, Anand Avati, Awni Hannun, and Andrew Ng. Ambulatory atrial fibrillation monitoring using wearable photoplethysmography with deep learning. In Proceedings of the 25th ACM SIGKDD International Conference on Knowledge Discovery & Data Mining, pages 1909–1916, 2019.
- [17] Ming-Zher Poh, Yukkee Cheung Poh, Pak-Hei Chan, Chun-Ka Wong, Louise Pun, Wangie Wan-Chiu Leung, Yu-Fai Wong, Michelle Man-Ying Wong, Daniel Wai-Sing Chu, and Chung-Wah Siu. Diagnostic assessment of a deep learning system for detecting atrial fibrillation in pulse waveforms. Heart, 104(23):1921–1928, 2018.
- [18] Jessica Torres-Soto and Euan A. Ashley. Multi-task deep learning for cardiac rhythm detection in wearable devices. npj Digital Medicine, 3(1):116, Sep 2020.
- [19] Ying Zhang, Tao Xiang, Timothy M. Hospedales, and Huchuan Lu. Deep mutual learning. In Proceedings of the IEEE Conference on Computer Vision and Pattern Recognition (CVPR), June 2018.
- [20] Syed Muhammad Anwar, Muhammad Majid, Adnan Qayyum, Muhammad Awais, Majdi Alnowami, and Muhammad Khurram Khan. Medical image analysis using convolutional neural networks: A review. Journal of Medical Systems, 42(11):226, Oct 2018.
- [21] Abdul Qayyum, Fabrice Meriaudeau, and Genevieve C Y Chan. Classification of atrial fibrillation with pre-trained convolutional neural network models. In 2018 IEEE-EMBS Conference on Biomedical Engineering and Sciences (IECBES), pages 594–599, 2018.
- [22] Yong Xia, Naren Wulan, Kuanquan Wang, and Henggui Zhang. Detecting atrial fibrillation by deep convolutional neural networks. Computers in Biology and Medicine, 93:84–92, 2018.
- [23] Rasmus S. Andersen, Abdolrahman Peimankar, and Sadasivan Puthusserypady. A deep learning approach for real-time detection of atrial fibrillation. Expert Systems with Applications, 115:465–473, 2019.
- [24] Xiaomao Fan, Qihang Yao, Yunpeng Cai, Fen Miao, Fangmin Sun, and Ye Li. Multiscaled Fusion of Deep Convolutional Neural Networks for Screening Atrial Fibrillation From Single Lead Short ECG Recordings. IEEE journal of biomedical and health informatics, 22(6):1744–1753, 2018.
- [25] Shu Lih Oh, Eddie Y.K. Ng, Ru San Tan, and U. Rajendra Acharya. Automated diagnosis of arrhythmia using combination of cnn and lstm techniques with variable length heart beats. Computers in Biology and Medicine, 102:278–287, 2018.
- [26] Chen Chen, Zhengchun Hua, Ruiqi Zhang, Guangyuan Liu, and Wanhui Wen. Automated arrhythmia classification based on a combination network of cnn and lstm. Biomedical Signal Processing and Control, 57:101819, 2020.
- [27] Igor Gotlibovych, Stuart Crawford, Dileep Goyal, Jiaqi Liu, Yaniv Kerem, David Benaron, Defne Yilmaz, Gregory Marcus, and Yihan Li. End-to-end deep learning from raw sensor data: Atrial fibrillation detection using wearables. In KDD 2018 Deep Learning Day, 2018.
- [28] Xue Ying. An overview of overfitting and its solutions. Journal of Physics: Conference Series, 1168(2):022022, feb 2019.
- [29] Cheng Ding, ZhiCheng Guo, Amit Shah, Gari Clifford, Cynthia Rudin, and Xiao Hu. Cluster consistency: Simple yet effect robust learning algorithm on large-scale photoplethysmography for atrial fibrillation detection in the presence of real-world label noise, 2022.
- [30] John R. Zech, Marcus A. Badgeley, Manway Liu, Anthony B. Costa, Joseph J. Titano, and Eric Karl Oermann. Variable generalization performance of a deep learning model to detect pneumonia in chest radiographs: A cross-sectional study. PLOS Medicine, 15(11):1–17, 11 2018.
- [31] Emma Beede, Elizabeth Baylor, Fred Hersch, Anna Iurchenko, Lauren Wilcox, Paisan Ruamviboonsuk, and Laura M. Vardoulakis. A human-centered evaluation of a deep learning system deployed in clinics for the detection of diabetic retinopathy. In Proceedings of the 2020 CHI Conference on Human Factors in Computing Systems, CHI ’20, page 1–12, New York, NY, USA, 2020. Association for Computing Machinery.
- [32] Awni Y. Hannun, Pranav Rajpurkar, Masoumeh Haghpanahi, Geoffrey H. Tison, Codie Bourn, Mintu P. Turakhia, and Andrew Y. Ng. Cardiologist-level arrhythmia detection and classification in ambulatory electrocardiograms using a deep neural network. Nature Medicine, 25(1):65–69, Jan 2019.
- [33] G. Sannino and G. De Pietro. A deep learning approach for ecg-based heartbeat classification for arrhythmia detection. Future Generation Computer Systems, 86:446–455, 2018.
- [34] Bahareh Pourbabaee, Mehrsan Javan Roshtkhari, and Khashayar Khorasani. Deep convolutional neural networks and learning ecg features for screening paroxysmal atrial fibrillation patients. IEEE Transactions on Systems, Man, and Cybernetics: Systems, 48(12):2095–2104, 2018.
- [35] Min-Gu Kim and Sung Bum Pan. Deep learning based on 1-d ensemble networks using ecg for real-time user recognition. IEEE Transactions on Industrial Informatics, 15(10):5656–5663, 2019.
- [36] Geoffrey H. Tison, José M. Sanchez, Brandon Ballinger, Avesh Singh, Jeffrey E. Olgin, Mark J. Pletcher, Eric Vittinghoff, Emily S. Lee, Shannon M. Fan, Rachel A. Gladstone, Carlos Mikell, Nimit Sohoni, Johnson Hsieh, and Gregory M. Marcus. Passive Detection of Atrial Fibrillation Using a Commercially Available Smartwatch. JAMA Cardiology, 3(5):409–416, 05 2018.
- [37] Ting Chen, Simon Kornblith, Mohammad Norouzi, and Geoffrey Hinton. A simple framework for contrastive learning of visual representations. In Proceedings of the 37th International Conference on Machine Learning, ICML’20. JMLR.org, 2020.
- [38] Jean-Bastien Grill, Florian Strub, Florent Altché, Corentin Tallec, Pierre Richemond, Elena Buchatskaya, Carl Doersch, Bernardo Avila Pires, Zhaohan Guo, Mohammad Gheshlaghi Azar, Bilal Piot, koray kavukcuoglu, Remi Munos, and Michal Valko. Bootstrap your own latent - a new approach to self-supervised learning. In H. Larochelle, M. Ranzato, R. Hadsell, M.F. Balcan, and H. Lin, editors, Advances in Neural Information Processing Systems, volume 33, pages 21271–21284. Curran Associates, Inc., 2020.
- [39] Xinlei Chen and Kaiming He. Exploring simple siamese representation learning. In Proceedings of the IEEE/CVF conference on computer vision and pattern recognition, pages 15750–15758, 2021.
- [40] Kaiming He, Xiangyu Zhang, Shaoqing Ren, and Jian Sun. Deep residual learning for image recognition. In Proceedings of the IEEE conference on computer vision and pattern recognition, pages 770–778, 2016.
- [41] Supreeth Prajwal Shashikumar, Amit J. Shah, Qiao Li, Gari D. Clifford, and Shamim Nemati. A deep learning approach to monitoring and detecting atrial fibrillation using wearable technology. In 2017 IEEE EMBS International Conference on Biomedical & Health Informatics (BHI), pages 141–144, 2017.
- [42] Paul van Gent, Haneen Farah, Nicole van Nes, and Bart van Arem. Analysing noisy driver physiology real-time using off-the-shelf sensors: Heart rate analysis software from the taking the fast lane project. Journal of Open Research Software, Oct 2019.
- [43] Paul van Gent, Haneen Farah, Nicole van Nes, and Bart van Arem. Heartpy: A novel heart rate algorithm for the analysis of noisy signals. Transportation Research Part F: Traffic Psychology and Behaviour, 66:368–378, 2019.
- [44] Dominique Makowski, Tam Pham, Zen J. Lau, Jan C. Brammer, François Lespinasse, Hung Pham, Christopher Schölzel, and S. H. Annabel Chen. NeuroKit2: A python toolbox for neurophysiological signal processing. Behavior Research Methods, 53(4):1689–1696, feb 2021.
- [45] Yingfan Wang, Haiyang Huang, Cynthia Rudin, and Yaron Shaposhnik. Understanding how dimension reduction tools work: An empirical approach to deciphering t-sne, umap, trimap, and pacmap for data visualization. 22(1), Jan 2021.
- [46] Elizabeth R DeLong, David M DeLong, and Daniel L Clarke-Pearson. Comparing the areas under two or more correlated receiver operating characteristic curves: a nonparametric approach. Biometrics, pages 837–845, 1988.
- [47] Xu Sun and Weichao Xu. Fast implementation of delong’s algorithm for comparing the areas under correlated receiver operating characteristic curves. IEEE Signal Processing Letters, 21(11):1389–1393, 2014.
11 Appendix
11.1 Bootstrap by patient calculations
We conducted bootstrapping tests with samples to calculate the confidence interval for statistical significance comparisons. Each bootstrap sample is constructed by randomly sampling patients with replacements from each test set (i.e., random patients from each test set, where the test set contains unique patients). For each bootstrap sample, AUROC and AUPRC scores were calculated and collected. We calculated the 95% confidence interval (CI) using ; here is the mean of the collected bootstrap samples’ AUPRC or AUROC scores, is the standard deviation of the collected bootstrap samples’ AUPRC or AUROC scores, and is the number of bootstrap samples.
11.2 Statistical significance test results
This section contains the p-values of the pairwise statistical significance tests between SiamAF and other tested models. For comparing the AUROC scores between any two models, we used the pairwise Delong test [46] and the Python FastDelong package [47]. For comparing the AUPRC scores between any two models, we used the pairwise t-test. After adjusting the threshold value with Bonferroni correction (), all pairwise comparisons are statistically significant except when comparing the proposed method and DeepBeat’s AUPRC scores on the Standford dataset – in this case, our proposed model performed comparably to the DeepBeat baseline on DeepBeat’s in-distribution test set. The tables below show the p-value results.
| Compared Model | ||
|---|---|---|
| Simband PPG dataset | ||
| ResNet-34(PPG) | 0.00 | 0.00 |
| Deep Mut. | 0.00 | 0.00 |
| DeepBeat | 0.00 | 0.00 |
| Institution B PPG dataset | ||
| ResNet-34(PPG) | 0.00 | 0.00 |
| Deep Mut. | 0.00 | 0.00 |
| DeepBeat | 0.00 | 0.00 |
| Stanford test set | ||
| ResNet-34(PPG) | 0.00 | 0.00 |
| Deep Mut. | 0.00 | 0.00 |
| DeepBeat | 0.00 | 0.0046 |
| Simband ECG dataset | ||
| ResNet-34(ECG) | 0.00 | 0.00 |
| Deep Mut. | 0.00 | 0.00 |
| Institution B ECG dataset | ||
| ResNet-34(ECG) | 0.00 | 0.00 |
| Deep Mut. | 0.00 | 0.00 |
| Compared Model | ||
|---|---|---|
| Simband PPG dataset | ||
| ResNet-34(PPG) | 0.00 | 0.00 |
| Deep Mut. | 0.00 | 0.00 |
| Institution B PPG dataset | ||
| ResNet-34(PPG) | 0.00 | 0.00 |
| Deep Mut. | 0.00 | 0.00 |
| Stanford test set | ||
| ResNet-34(PPG) | 0.00 | 0.00 |
| Deep Mut. | 0.00 | 0.00 |
| Simband ECG dataset | ||
| ResNet-34(ECG) | 0.00 | 0.00 |
| Deep Mut. | 0.00 | 0.00 |
| Institution B ECG dataset | ||
| ResNet-34(ECG) | 0.00 | 0.00 |
| Deep Mut. | 0.00 | 0.00 |
11.3 Dataset participants demographic information
In this section, we display the demographic information of the datasets used in this study in detail.
Demographic Category Patient Counts Percentage Gender Male 15,330 53.7% Female 13,203 46.2% Others 6 0% Age <22 years 3,925 13.8% 22-39 years 2,715 9.5% 40-54 years 4,372 25.3% 55-64 years 5,370 18.8% 65 years 12,157 42.6% Race White or Caucasian 15,890 55.7% Black or African American 2,159 7.4% Asian 4,364 15.0% Native Hawaiian or Other Pacific Islander 426 1.46% American Indian or Alaska Native 212 0.7% Unknown/Declined 1,149 4% Others 4,913 16.9%
11.4 Performance comparisons and values
This section includes the detailed evaluation results.
Dataset/AUROC ResNet-34 (PPG) ResNet-34 (ECG) Deep Mut. DeepBeat Proposed Simband (ECG) N/A 0.724 [0.722 0.727] 0.721 [0.718 0.723] N/A 0.747 [0.744 0.75] Simband (PPG) 0.879 [0.878 0.881] N/A 0.891 [0.889 0.892] 0.870 [0.868 0.871] 0.914 [0.913 0.916] Institution B (ECG) N/A 0.89 [0.887 0.893] 0.905 [0.902 0.908] N/A 0.927 [0.925 0.929] Institution B (PPG) 0.918 [0.916 0.92] N/A 0.92 [0.918 0.922] 0.872 [0.87 0.875] 0.924 [0.922 0.925] Stanford test set 0.763 [0.761 0.764] N/A 0.764 [0.763 0.766] 0.883 [0.882 0.884] 0.877 [0.876 0.878]
Dataset/AUPRC ResNet-34 (PPG) ResNet-34 (ECG) Deep Mut. DeepBeat Proposed Simband (ECG) N/A 0.621 [0.617 0.625] 0.675 [0.671 0.679] N/A 0.732 [0.729 0.736] Simband (PPG) 0.841 [0.838 0.843] N/A 0.847 [0.844 0.845] 0.799 [0.796 0.803] 0.865 [0.863 0.868] Institution B (ECG) N/A 0.726 [0.72 0.732] 0.749 [0.743 0.755] N/A 0.765 [0.759 0.772] Institution B (PPG) 0.768 [0.762 0.774] N/A 0.778 [0.772 0.784] 0.607 [0.601 0.614] 0.773 [0.768 0.779] Stanford test set 0.582 [0.577 0.586] N/A 0.613 [0.609 0.617] 0.726 [0.723 0.73] 0.726 [0.722 0.729]
| Dataset/AUROC | ResNet-34 (PPG) | ResNet-34 (ECG) | Deep Mut. | Proposed |
|---|---|---|---|---|
| Simband (ECG) | N/A | 0.509 [0.509 0.51] | 0.5 [0.5 0.5] | 0.729 [0.726 0.732] |
| Simband (PPG) | 0.5 [0.5 0.5] | N/A | 0.458 [0.456 0.459] | 0.9 [0.898 0.901] |
| Institution B (ECG) | N/A | 0.491 [0.49 0.492] | 0.5 [0.5 0.5] | 0.899 [0.897 0.902] |
| Institution B (PPG) | 0.5 [0.5 0.5] | N/A | 0.425 [0.423 0.426] | 0.907 [0.905 0.909] |
| Stanford test set | 0.5 [0.5 0.5] | N/A | 0.433 [0.432 0.434] | 0.8 [0.799 0.801] |
| Dataset/AUROC | ResNet-34 (PPG) | ResNet-34 (ECG) | Deep Mut. | Proposed |
|---|---|---|---|---|
| Simband (ECG) | N/A | 0.401 [0.393 0.41] | 0.703 [0.702 0.705] | 0.661 [0.658 0.665] |
| Simband (PPG) | 0.703 [0.702 0.705] | N/A | 0.349 [0.345 0.352] | 0.841 [0.838 0.844] |
| Institution B (ECG) | N/A | 0.194 [0.19 0.198] | 0.571 [0.57 0.572] | 0.736 [0.731 0.742] |
| Institution B (PPG) | 0.167 [0.164 0.171] | N/A | 0.11 [0.109 0.112] | 0.744 [0.739 0.749] |
| Stanford test set | 0.196 [0.193 0.2] | N/A | 0.161 [0.159 0.163] | 0.565 [0.56 0.569] |