Galactic Gamma-Ray Diffuse Emission at TeV energies with HAWC Data
Abstract
The Galactic gamma-ray diffuse emission (GDE) is emitted by cosmic rays (CRs), ultra-relativistic protons and electrons, interacting with gas and electromagnetic radiation fields in the interstellar medium. Here we present the analysis of TeV diffuse emission from a region of the Galactic Plane over the range in longitude of , using data collected with the High Altitude Water Cherenkov (HAWC) detector. Spectral, longitudinal and latitudinal distributions of the TeV diffuse emission are shown. The radiation spectrum is compatible with the spectrum of the emission arising from a CR population with an ”index” similar to that of the observed CRs. When comparing with the DRAGON base model, the HAWC GDE flux is higher by about a factor of two. Unresolved sources such as pulsar wind nebulae and TeV halos could explain the excess emission. Finally, deviations of the Galactic CR flux from the locally measured CR flux may additionally explain the difference between the predicted and measured diffuse fluxes.
1 Introduction
Cosmic rays (CRs) are highly energetic hadrons and electrons that fill the Galaxy and carry in the Solar neighbourhood as much energy per unit volume as the average Galactic electromagnetic fields and the thermal and turbulent gas phase, namely about 1 eV/cm3. CR secondary data suggest that for rigidities around 1 GV cosmic protons and nuclei diffuse in the magnetic fields for a timescale of the order of years before escaping the Galaxy (Berezinskii et al., 1984). At higher energies, CRs are confined for a shorter time in the Galaxy, as evidenced by energy-dependent measurements of the Galactic abundances. The electrically charged nature of cosmic rays does not allow them to travel through space without scattering, absorption, or deflection in the magnetic fields. Thus these particles redistribute diffusively in the Galaxy contributing to the bulk of Galactic CRs known as background CRs or CR sea.
Direct measurements of the spectra of all CR species have recently reached unprecedented quality (Yoon et al., 2017; Adriani et al., 2011; Aguilar et al., 2015; Ahn et al., 2010; Adriani et al., 2019). Until a few years ago the CR energy spectrum below PeV energies was thought to follow a simple power-law (SPL) with a soft index between -2.7 and -2.8. A more complex picture, however, has emerged since PAMELA (Adriani et al., 2011) and AMS (Aguilar et al., 2015) found a hardening (Alemanno et al., 2021) in the spectra of CR proton, helium and other primary nuclear species at about 300 (GeV per nucleon) . Above that energy, a combined fit of PAMELA, AMS and CREAM (Ahn et al., 2010; Yoon et al., 2017) – the latter probing energies between 1 TeV/n and TeV/n (n being the atomic mass number) – yields a value very close to -2.6 for the proton spectral index (Lipari, 2018). This finding has been confirmed by the CALET experiment which measured the proton spectrum between 50 GeV and 10 TeV (Adriani et al., 2019). A softening of the spectrum has been recently revealed by DAMPE above few tens of TeV for both proton and helium spectra (An et al., 2019; Alemanno et al., 2021).
Since the direct measurements of CR spectra are necessarily restricted to the proximity of the Earth, or for the Voyager measurements (Stone et al., 2013) to the proximity of the Solar System, the distribution of CRs in other regions of the Galaxy is not known. It is strongly debated whether the CR sea is homogeneously distributed along the Galactic plane or it shows a gradient towards the inner Galaxy, believed to be produced by a spatial dependence of the transport properties (Evoli et al., 2017, 2008). It is also not clear whether the spectral hardening of the primary CR spectra (at 300 GeV/n) measured at Earth is representative of the entire CR Galactic population or it is a local effect, originated by the contribution of one or a few nearby CR sources (see, e.g., (Thoudam & Horandel, 2012)). These alternative scenarios can be tested by measuring the diffuse gamma-ray emission from the Galactic Plane from GeV to TeV energies.
The Galactic diffuse gamma-ray emission originates from the interactions of the background CRs (hadrons and electrons) with the interstellar medium (ISM) gas and interstellar radiation field (ISRF). CR hadrons interact with matter, producing neutral pions (), which in turn decay into gamma rays, while CR electrons produce high-energy gamma-rays via inverse Compton (IC) scattering onto the ISRF photons. At GeV energies, gamma rays are emitted through bremsstrahlung processes when electrons collide with interstellar medium gas.
So far, the diffuse emission of the Galaxy has been primarily investigated in the tens of MeV to hundreds of GeV energy range with orbital detectors such as COS-B (Strong et al., 1988), EGRET111https://heasarc.gsfc.nasa.gov/docs/cgro/egret/ (Strong & Mattox, 1996; Hunter et al., 1997) and Fermi-Large Area Telescope (LAT)222https://fermi.gsfc.nasa.gov/. The first analysis of diffuse Galactic emission using Fermi-LAT data generally yielded a good agreement between the local CR spectrum and the CR spectrum in the Galaxy (Ackermann, 2012). Recent works (Acero et al., 2016; Yang et al., 2016; Pothast et al., 2018) extract the gamma-ray emissivity in Galactocentric rings and report a hardening and an enhancement of the emissivity in the inner Galactic rings, with a maximum at a distance of 4 kpc from the Galactic Center.
Measurements of the diffuse emission at TeV energies by HEGRA-IACT have determined an upper limit on the ratio of the diffuse photon flux to the hadronic CR flux < 2.0 near the inner Galaxy at 54 TeV (Aharonian et al., 2002). The GDE measured with Milagro at a median energy of 15 TeV for Galactic longitudes between 30∘ and 110∘ and between 136∘ and 216∘ and for Galactic latitudes between -10∘, and +10∘ is consistent with the predictions of GALPROP optimized model everywhere except for the Cygnus region (Abdo et al., 2008). Measurements of the diffuse emission at TeV energies by the ARGO-YBJ detector have yielded a soft gamma-ray spectrum with index -2.9 0.3 within the region 40∘ < < 100∘ and < 5∘ in Galactic longitude and latitude, respectively (Bartoli et al., 2015). Measurements with the H.E.S.S. instrument favor a significant contribution of -decay to the total signal of the diffuse emission at TeV energies from the Galactic Plane (Abramowski et al., 2014). A recent study of the diffuse radiation from the Galaxy at 100 TeV by the Tibet AS-Gamma Collaboration shows that CRs are accelerated beyond PeV energies in our Galaxy and spread over the Galactic disk. The hadronic diffuse component is likely the dominant component of this sub-PeV emission (Amenomori, 2021). Very recently PeV diffuse radiation has been detected by LHAASO (Cao et al., 2023).
The High Altitude Water Cherenkov (HAWC) Gamma-Ray Observatory333https://www.hawc-observatory.org/, located in Mexico, is well-designed to study CRs and gamma rays at energies between 300 GeV to above 100 TeV. The detector observes the Cherenkov lights in the water produced by the charged secondary particles. Thanks to its large field-of-view, it monitors two-thirds of the sky daily with duty cycle (Abeysekara et al., 2017, 2023).
We here present the analysis of the HAWC data above 300 GeV and up to 100 TeV within the region of interest (ROI) spanning in longitude and in latitude (see section 3). The spectra and profiles of the GDE are measured and shown within specific portions of the Galactic Plane included in ROI (namely , , and ). Future analysis will extend the range in longitude to cover the entire part of the sky visible to HAWC. Finally, we compare the measured gamma-ray diffuse emission spectra as well as its latitudinal and longitudinal profiles with those obtained with a reference CR transport model implemented with the DRAGON code (Evoli et al., 2008, 2017).
The paper is organized as follows. The analysis of the diffuse emission from the Galactic Plane is described in details in section 2. Section 3 presents, discusses, and compares the HAWC results with other measurements. Section 4 contains the conclusions. The differential flux profiles are presented in Appendix A, and the comparative analysis between ARGO-YBJ measurements and DRAGON prediction is delineated in Appendix B. The DRAGON code is also introduced in Appendix C.
2 Analysis
2.1 Data Set
The analysis presented in this study is based on a data set accumulated over 1,347 days by HAWC from 2015 to 2019. Standard reconstructed data generated by the HAWC production of Pass 4 (Abeysekara et al., 2017) is used. The data are categorized into 9 energy bins corresponding to the fraction (fractional hit) of PMTs triggered based on the sum of the active PMTs (Abeysekara et al., 2017). In Table 1, the column represents the median energy of the simulated gamma-ray photons in the different analysis bins for a Crab-Nebula-like source (dec and for an energy spectrum ). By choosing bins in the analysis, an energy range between 300 GeV to more than 100 TeV, (Abeysekara et al., 2017) is considered.
| Properties of the analysis bins | |||
| (%) | (∘) | (TeV) | |
| 1 | 6.7 – 10.5 | 1.03 | 0.7 |
| 2 | 10.5 – 16.2 | 0.69 | 1.1 |
| 3 | 16.2 – 24.7 | 0.50 | 1.8 |
| 4 | 24.7 – 35.6 | 0.39 | 3.5 |
| 5 | 35.6 – 48.5 | 0.30 | 5.6 |
| 6 | 48.5 – 61.8 | 0.28 | 12 |
| 7 | 61.8 – 74.0 | 0.22 | 15 |
| 8 | 74.0 – 84.0 | 0.20 | 21 |
| 9 | 84.0 – 100.0 | 0.17 | 51 |
2.2 Analysis Regions
The analysis of the diffuse emission reported here is focused on a region of interest (ROI) restricted to a portion of the Galactic Plane within the intervals in longitude and in latitude, as defined in the Galactic coordinate system. The analysis is carried out by dividing the longitudinal range of the ROI into three sub-regions, namely , and , each region being defined in such a way that no significance excess larger than five ( >5) is located on the borders of the regions. Hence, none of the regions shares a source.
2.3 Event and Background Maps
In HAWC the data analysis is based on the production of maps of the events and background. The background is estimated with a method known as “direct integration”, which is used to fit the isotropic distribution of events that pass the gamma-ray event selection (Atkins et al., 2003). The event maps are simple histograms of the reconstructed events , that pass gamma/hadron cuts (Abeysekara et al., 2017), where is the event count in the pixel of the bin, is the background events in the pixel of the bin, and is the expected number of gamma rays from the source in the pixel of the bin (Data = background + signal).
For the present analysis, the maps are produced using HEALPix pixelization (Hanisch et al., 2001). The map pixelization is performed with Nside = 1024 for a mean spacing between pixel centers of about 0.05∘, which is small compared to the typical point spread function (PSF) of the reconstructed events as shown in Table 1 (the column represents the 68% containment angle of the PSF, for a source similar to the Crab Nebula).
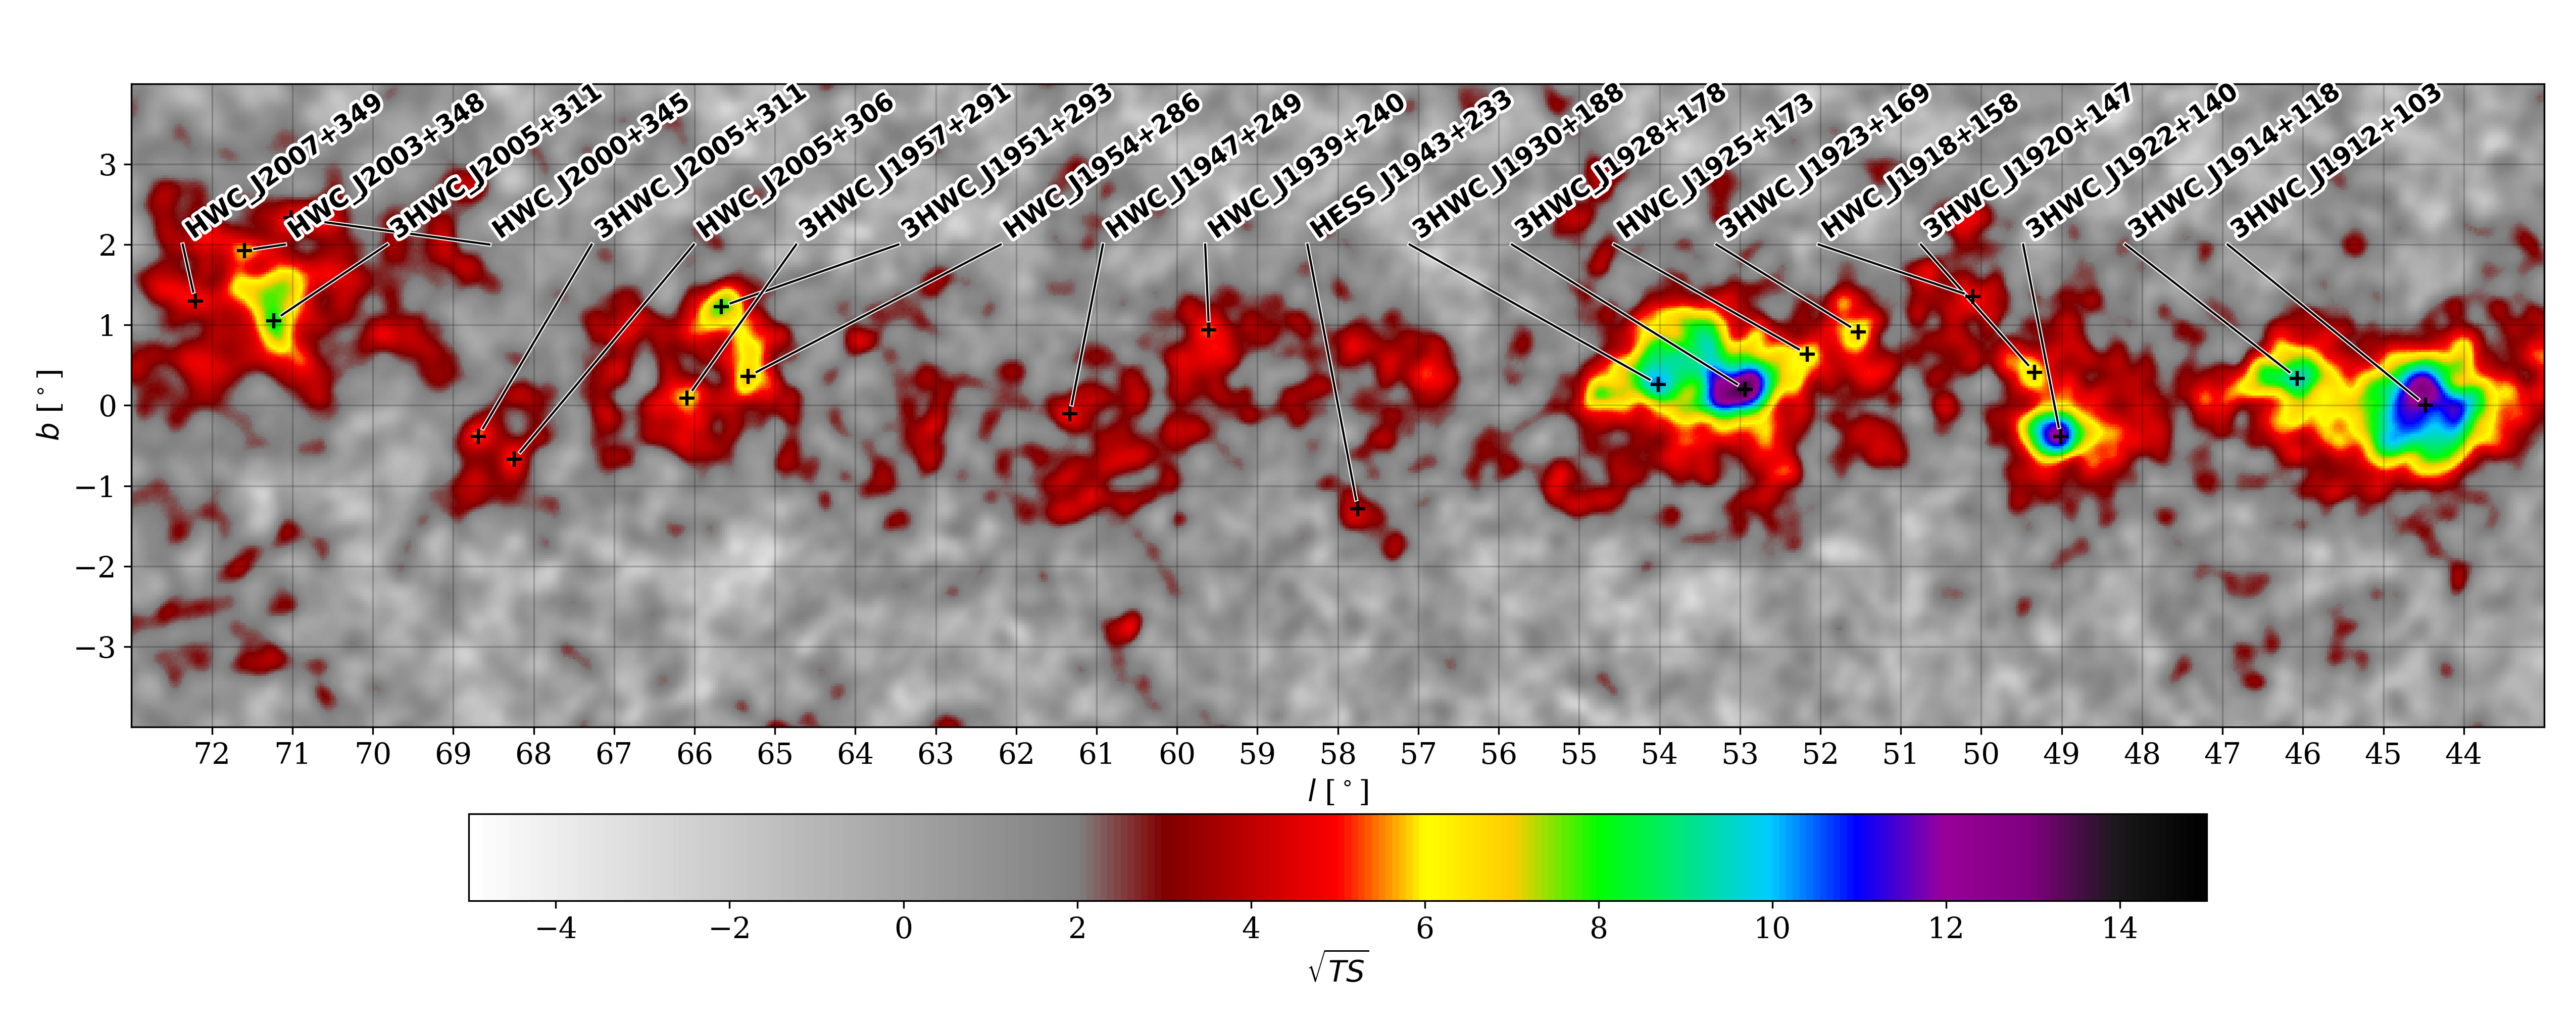
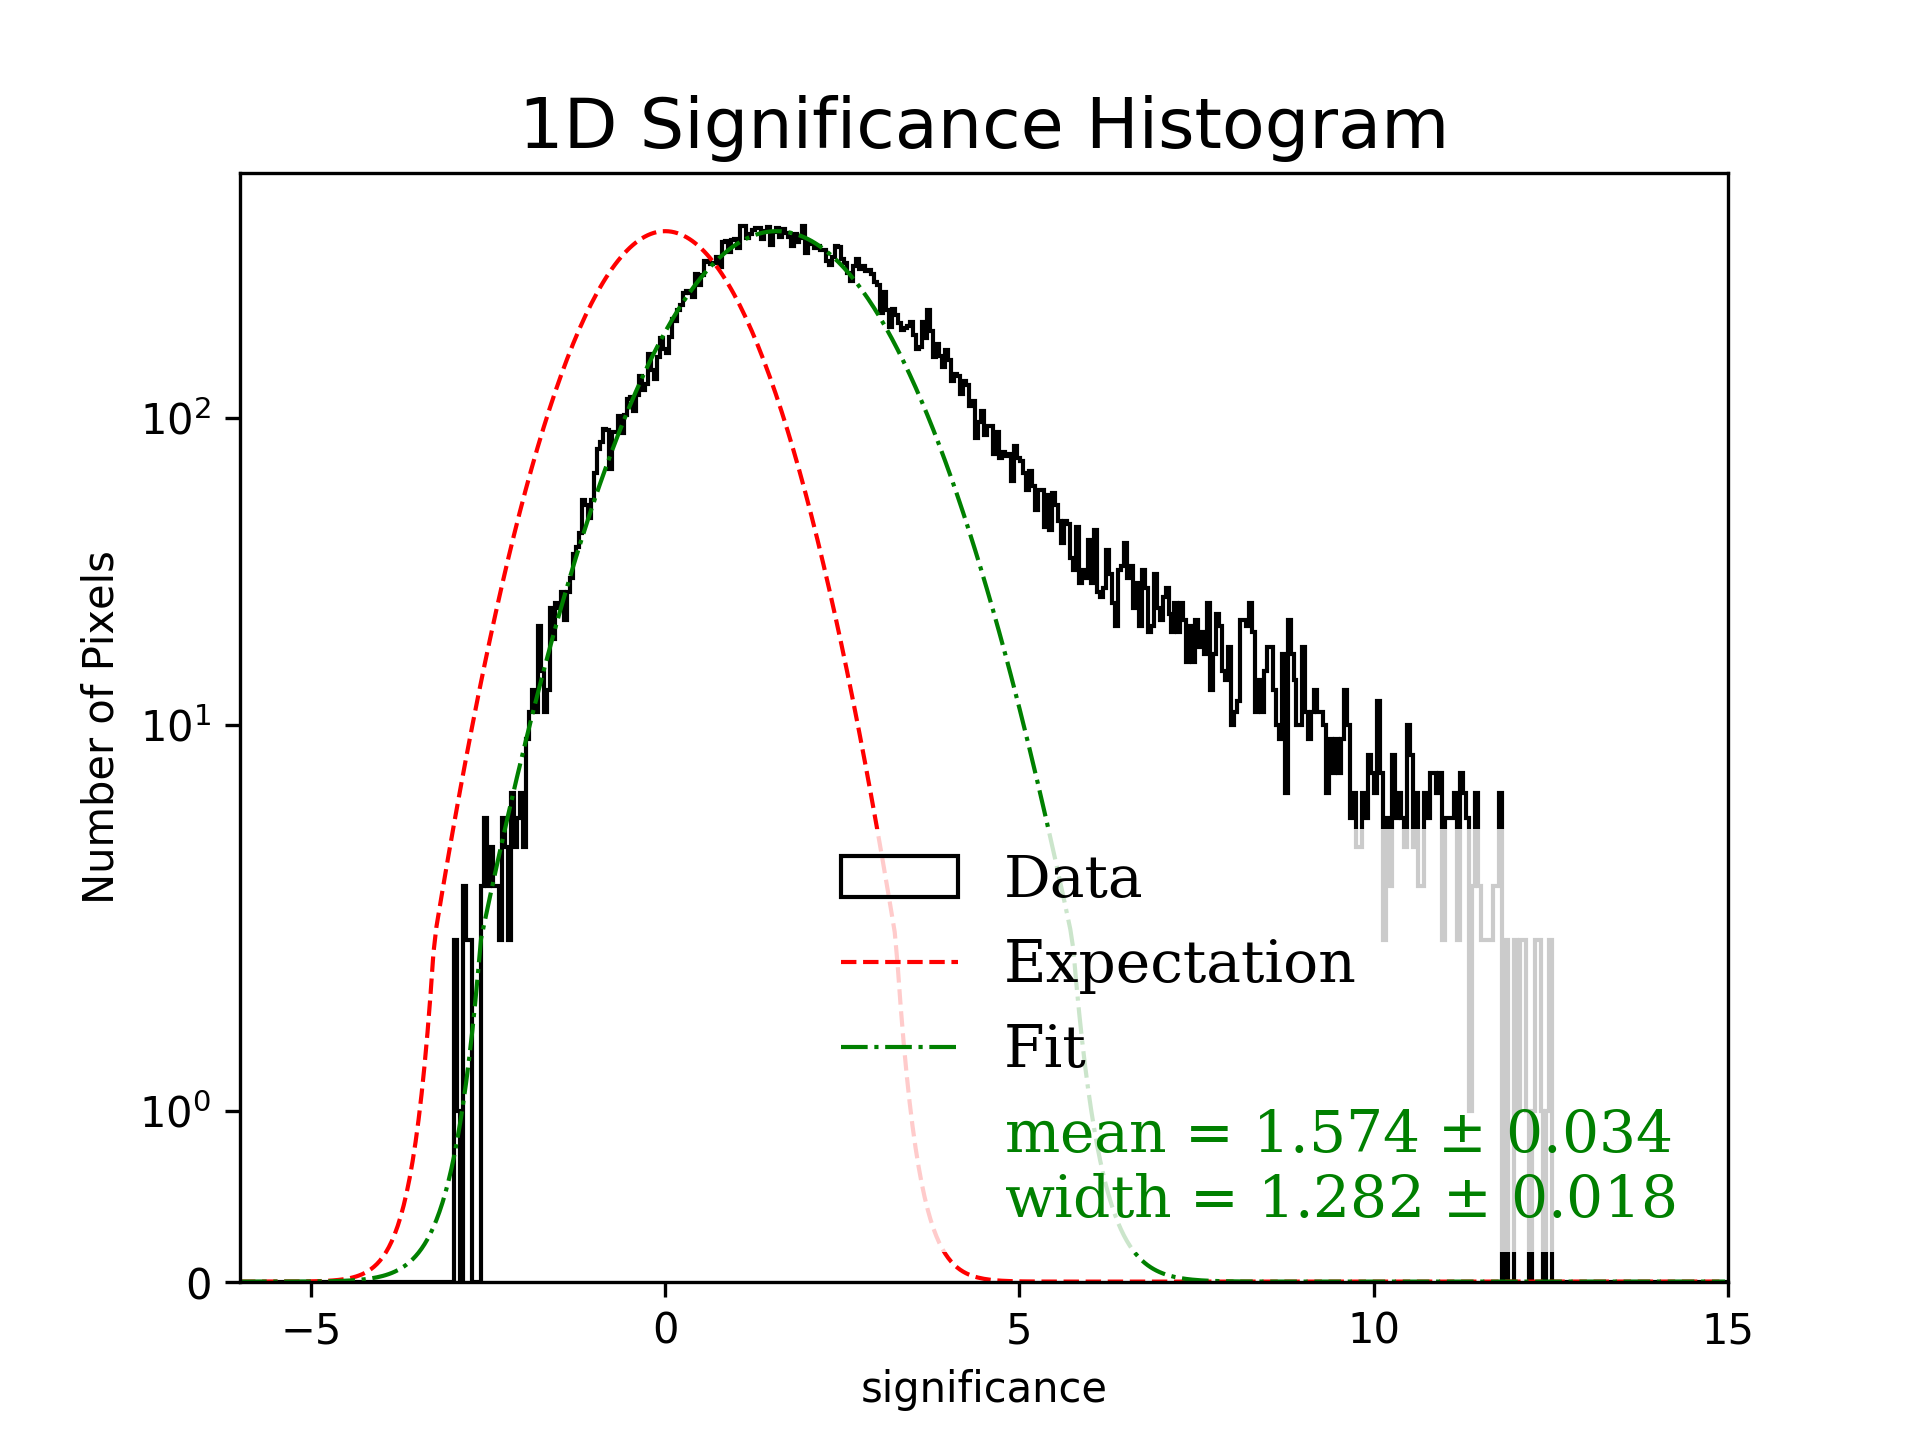
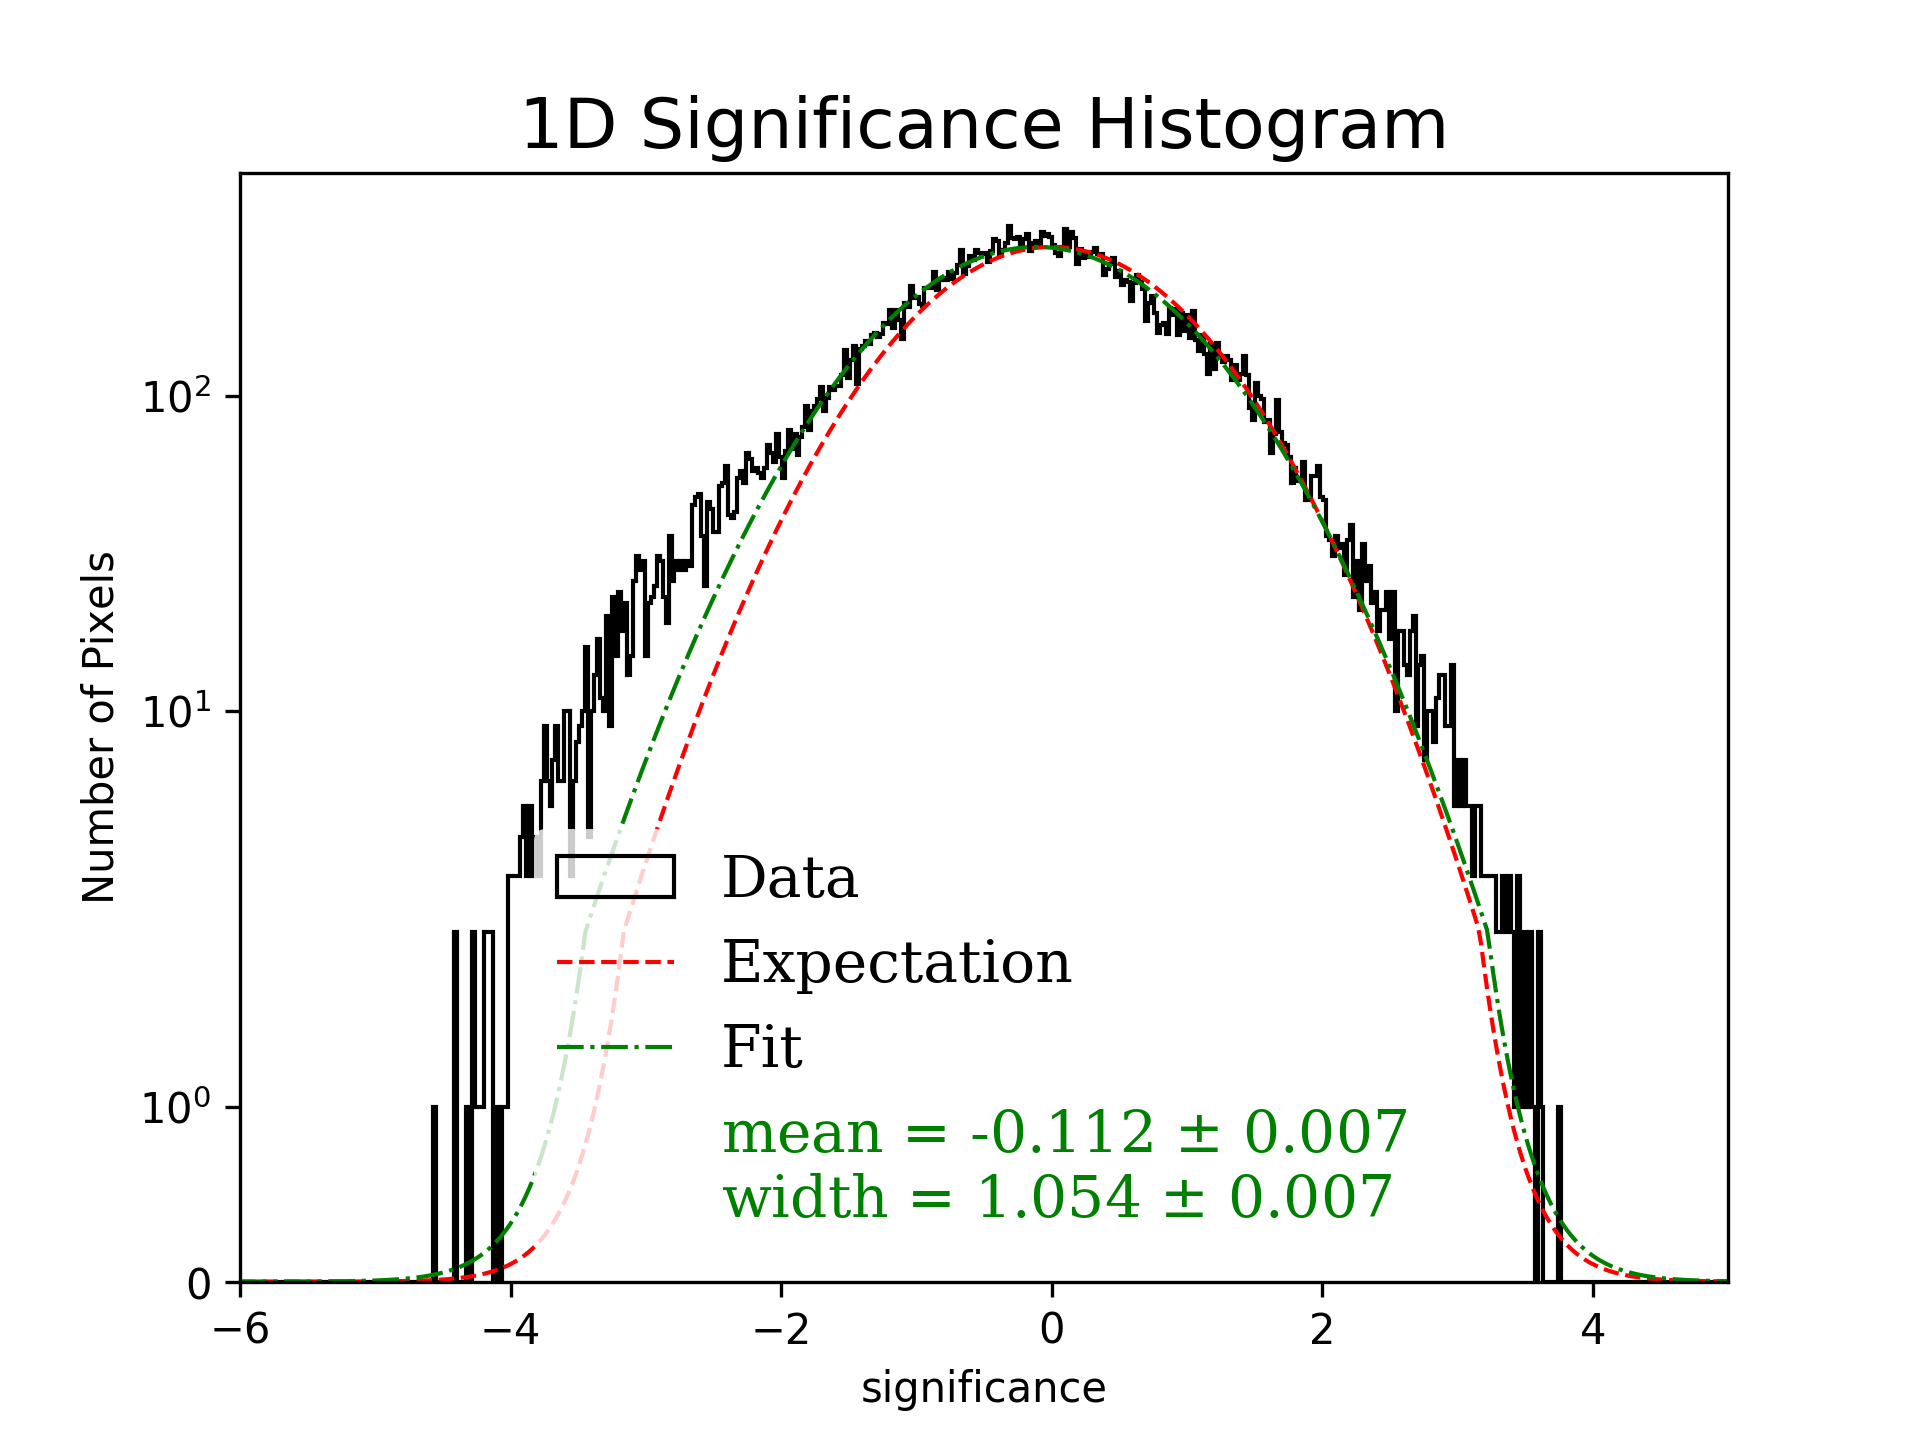
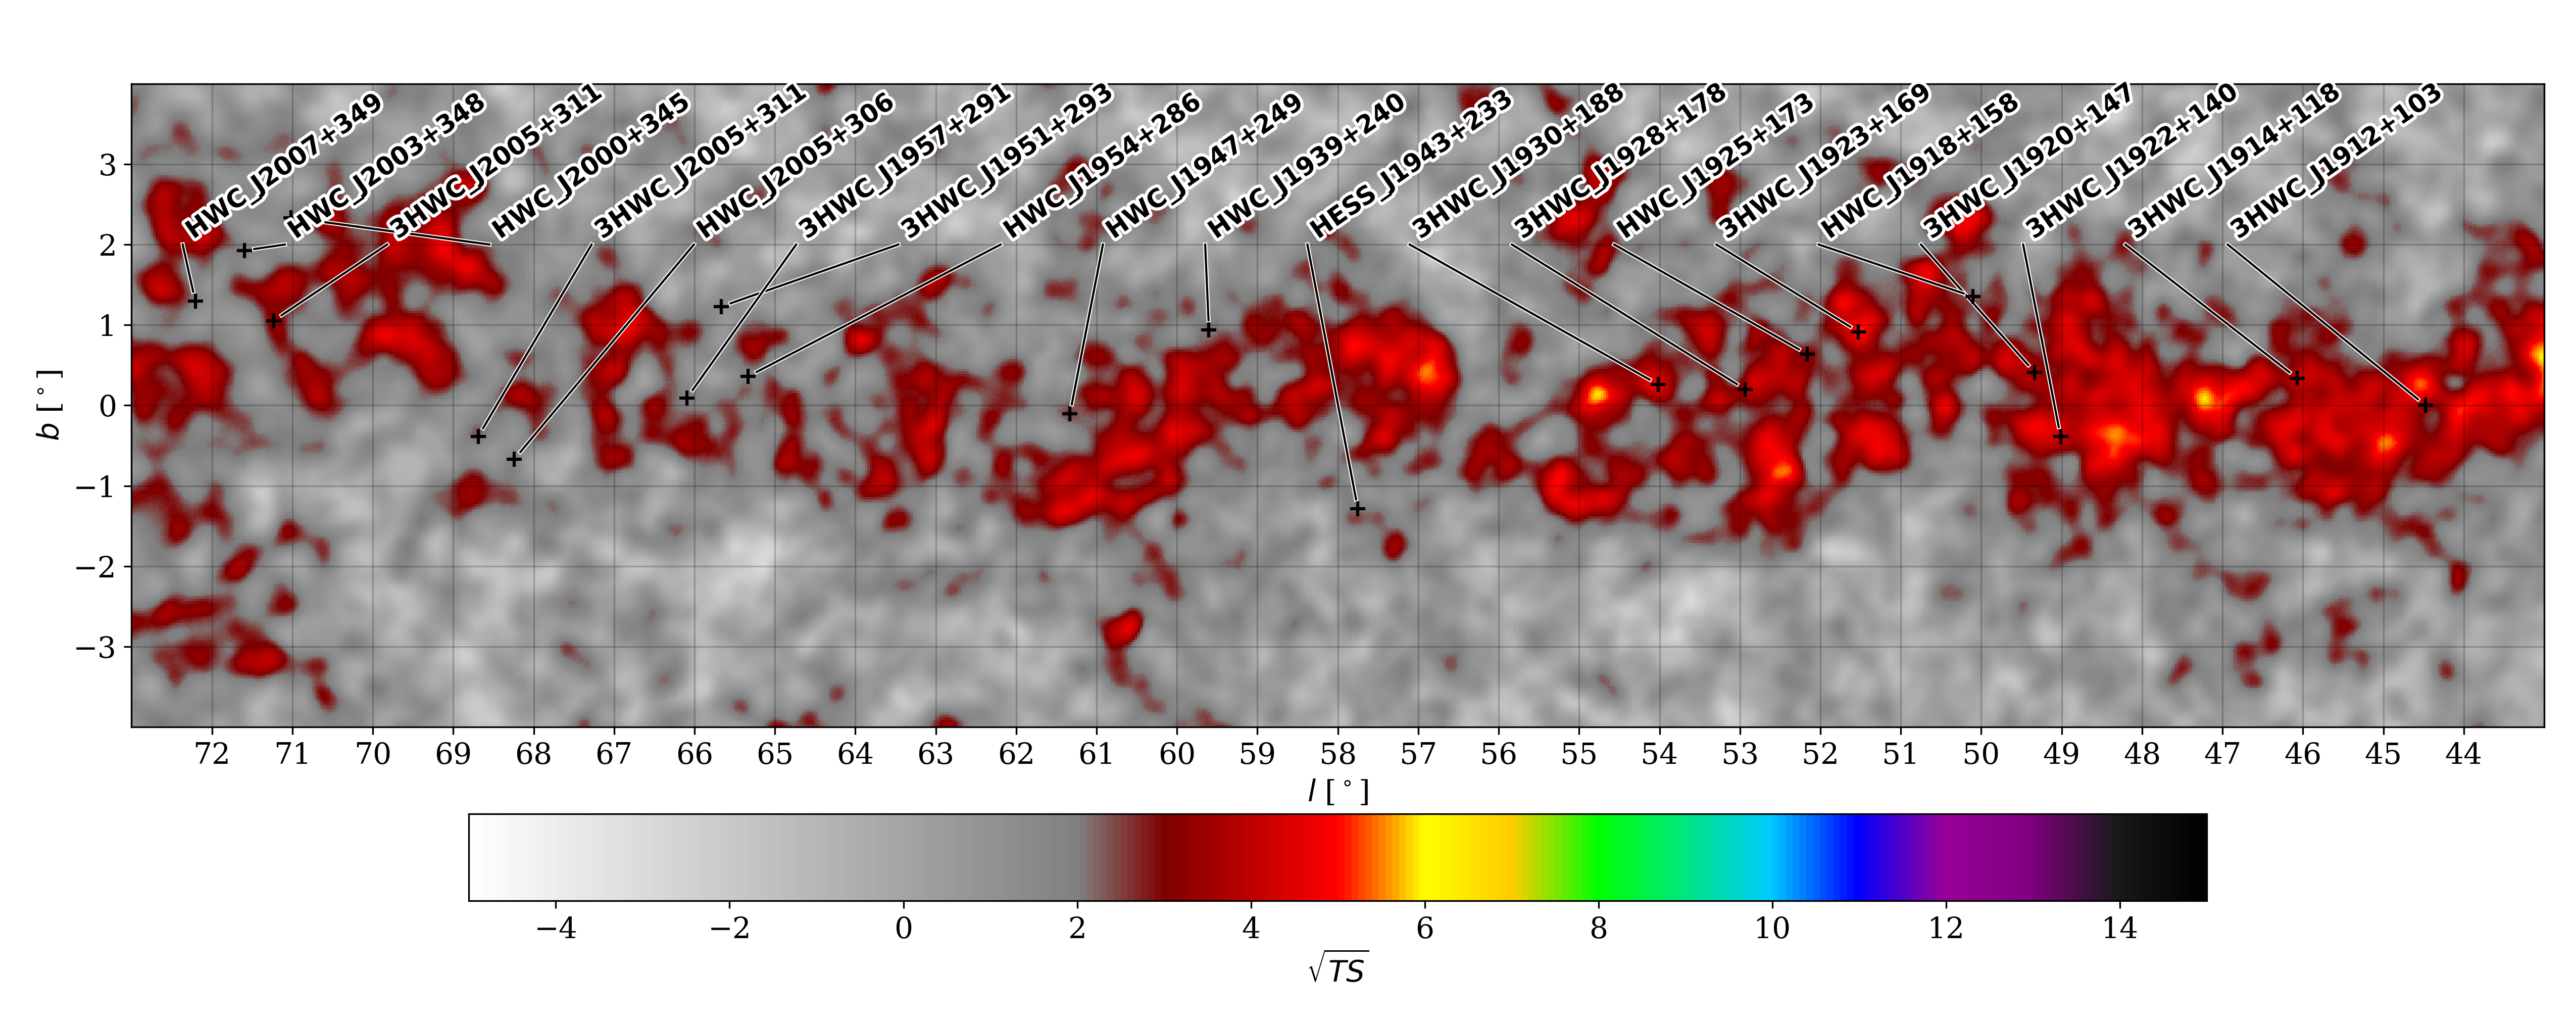
In Figure 1, the significance map444 The maps are computed using a SPL model with a spectral index of -2.7 for a point source search map. of the data measured by HAWC from the Galactic Plane (hereafter called “original map”) is shown, and the corresponding 1D significance histogram is presented in Figure 2. We do not show the maps beyond as the radiation is not significant at higher latitudes.
2.4 Analysis of the GDE
The radiation measured by HAWC from the Galactic Plane, shown in Figure 1 (“original map”), is the sum of different contributions: GDE, produced by background CR protons and electrons, and emission from point-like and extended gamma-ray sources. The total flux measured by HAWC from the Galactic Plane, , can thus be written as:
| (1) |
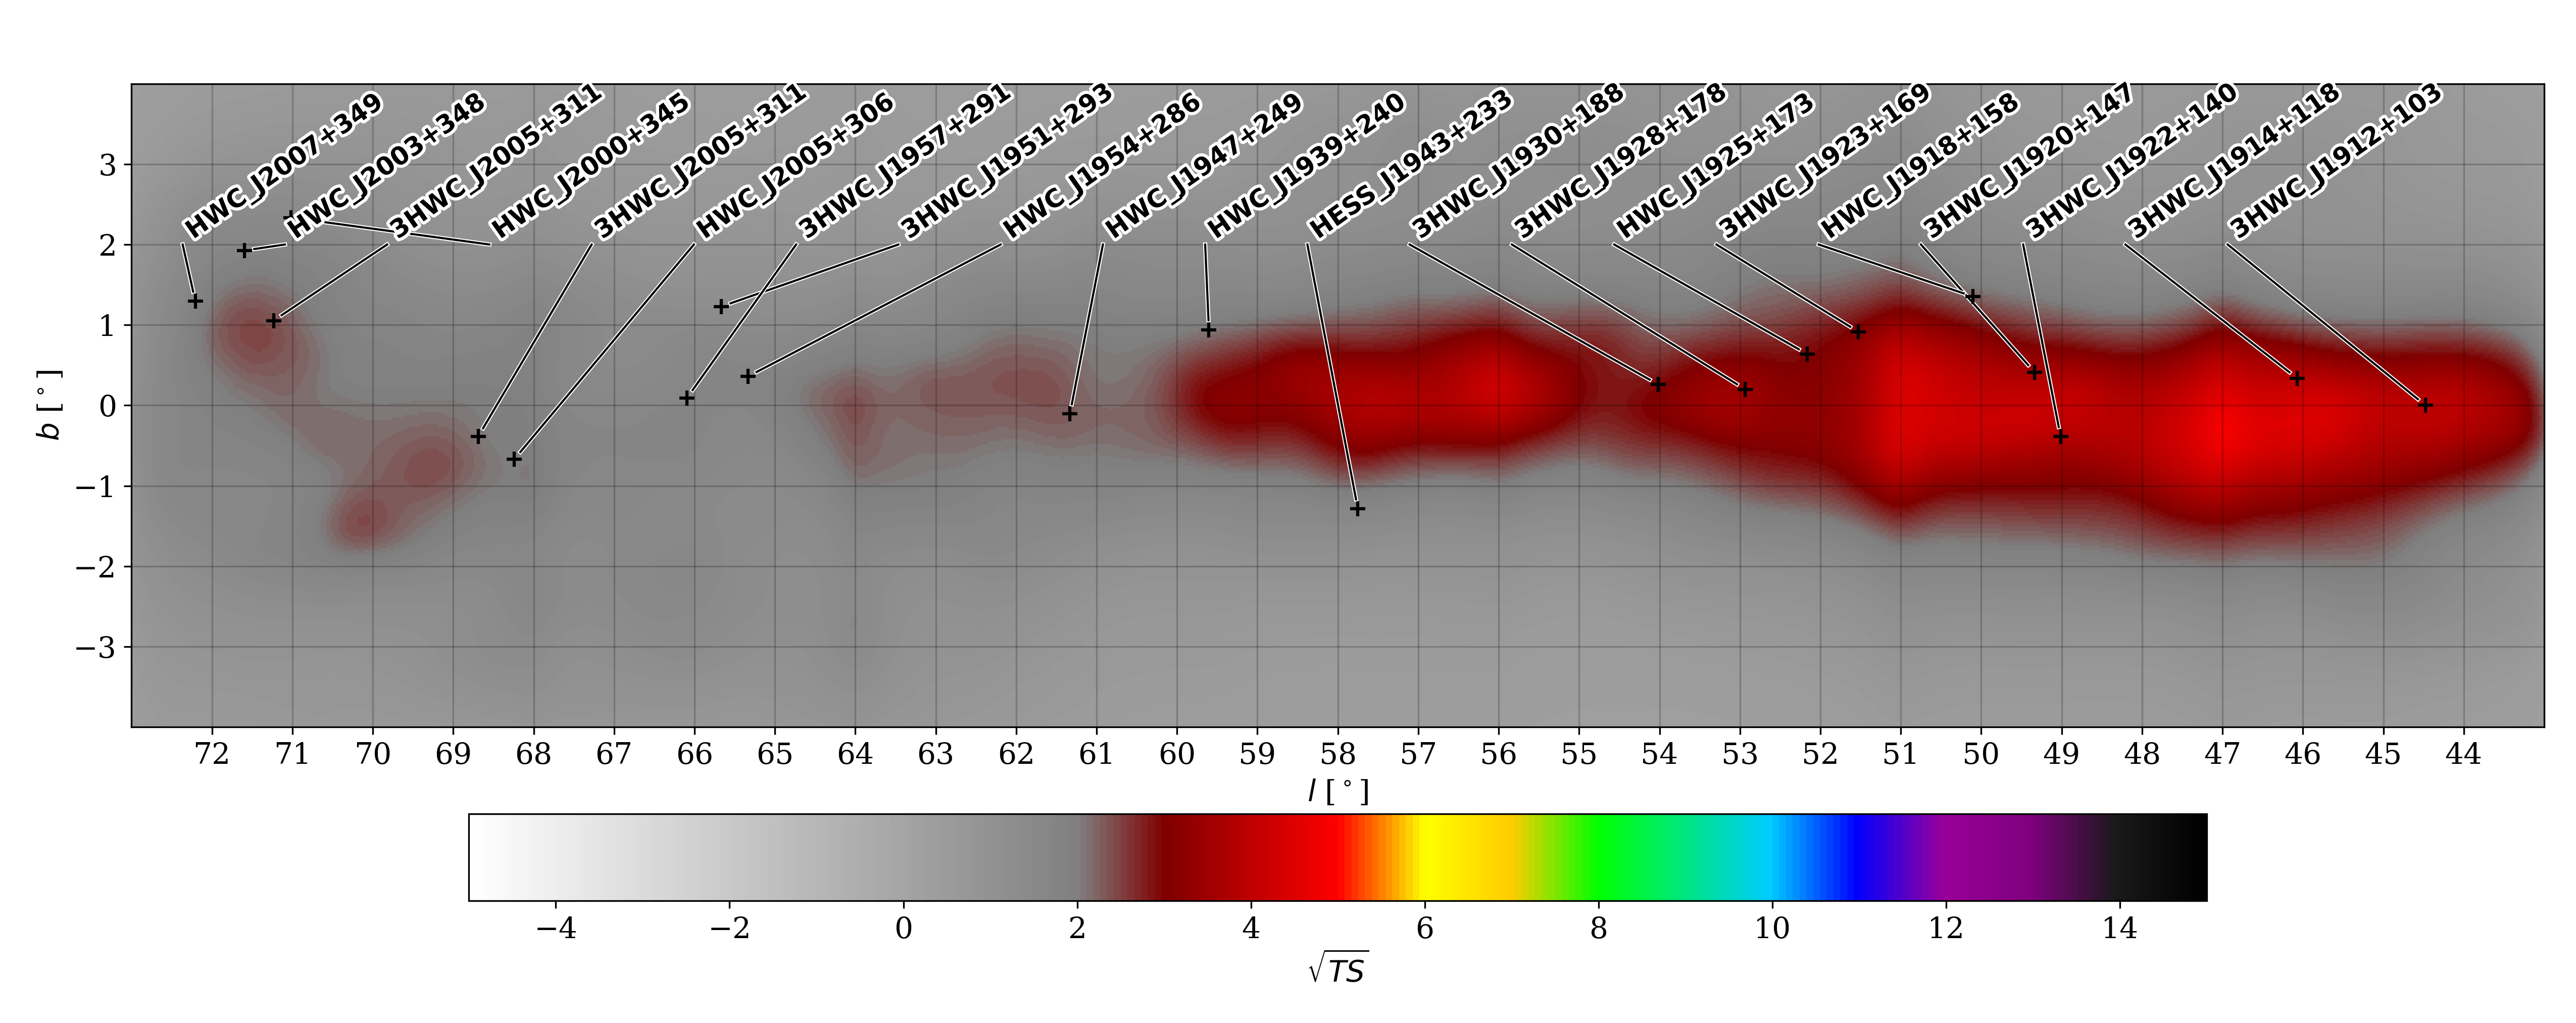
where is the flux produced by all sources ( ), and is the flux corresponding to the GDE. The “original map” is the starting point of the analysis of the GDE, which will be carried out essentially in two steps. In the first step, a map of the source-emission will be obtained and then subtracted from the measured HAWC map (“original map”, Figure 1). In this way, a “source-subtracted” map, which in principle should contain only GDE radiation, will be generated. In the second step, the analysis of the source-subtracted map will yield the spectral, longitudinal, and latitudinal features of the GDE emission.
The contribution of source emission to the total emission is obtained by a multiple-source fitting process, in which a model for the total radiation, including point-like or extended gamma-ray sources resolved by HAWC and the GDE (treated as an extended source), is fitted to the “original map”.
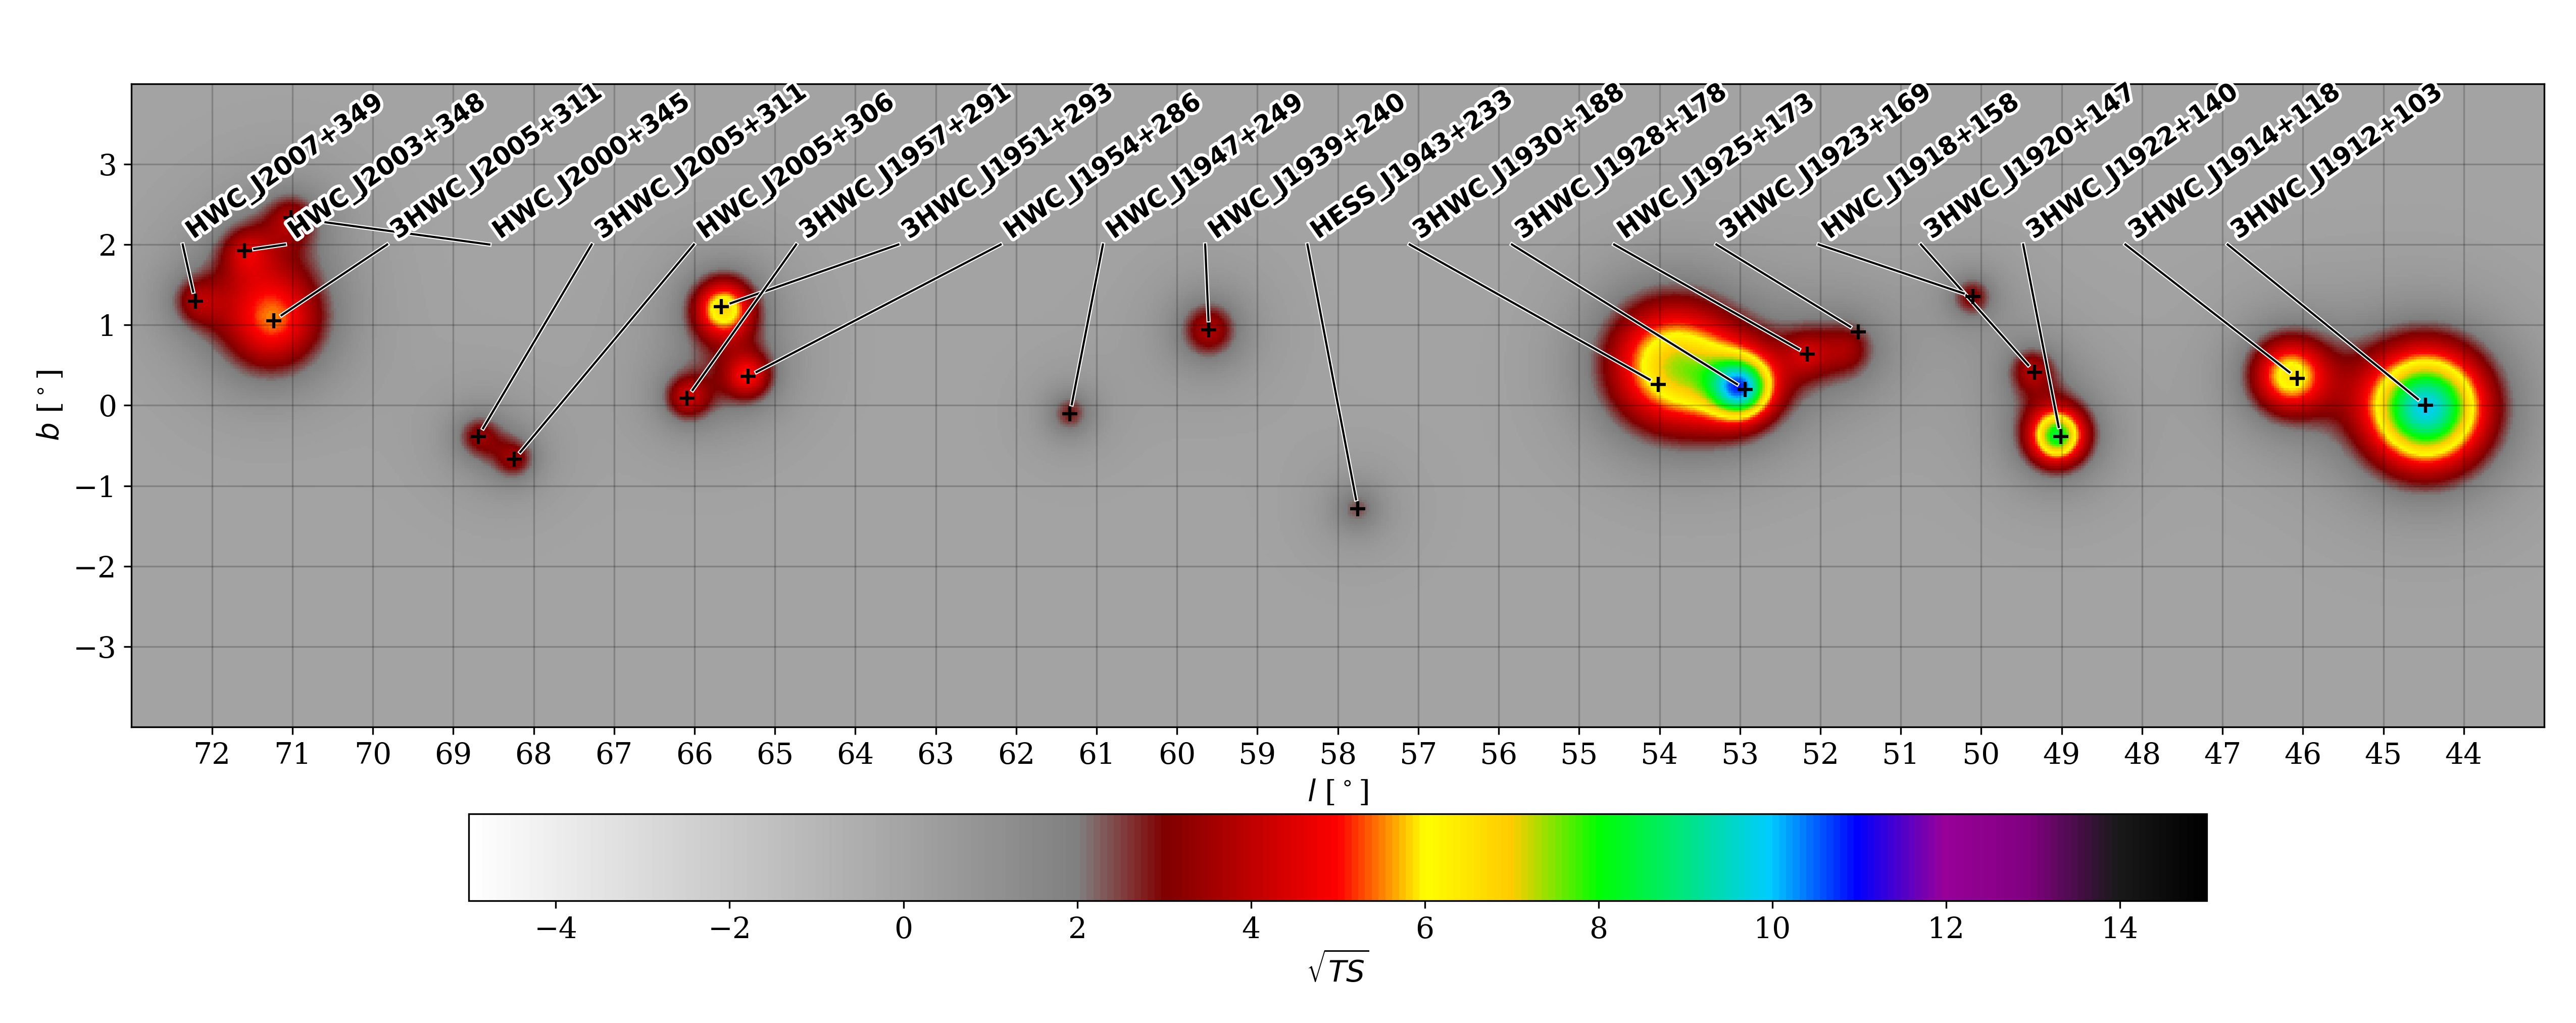
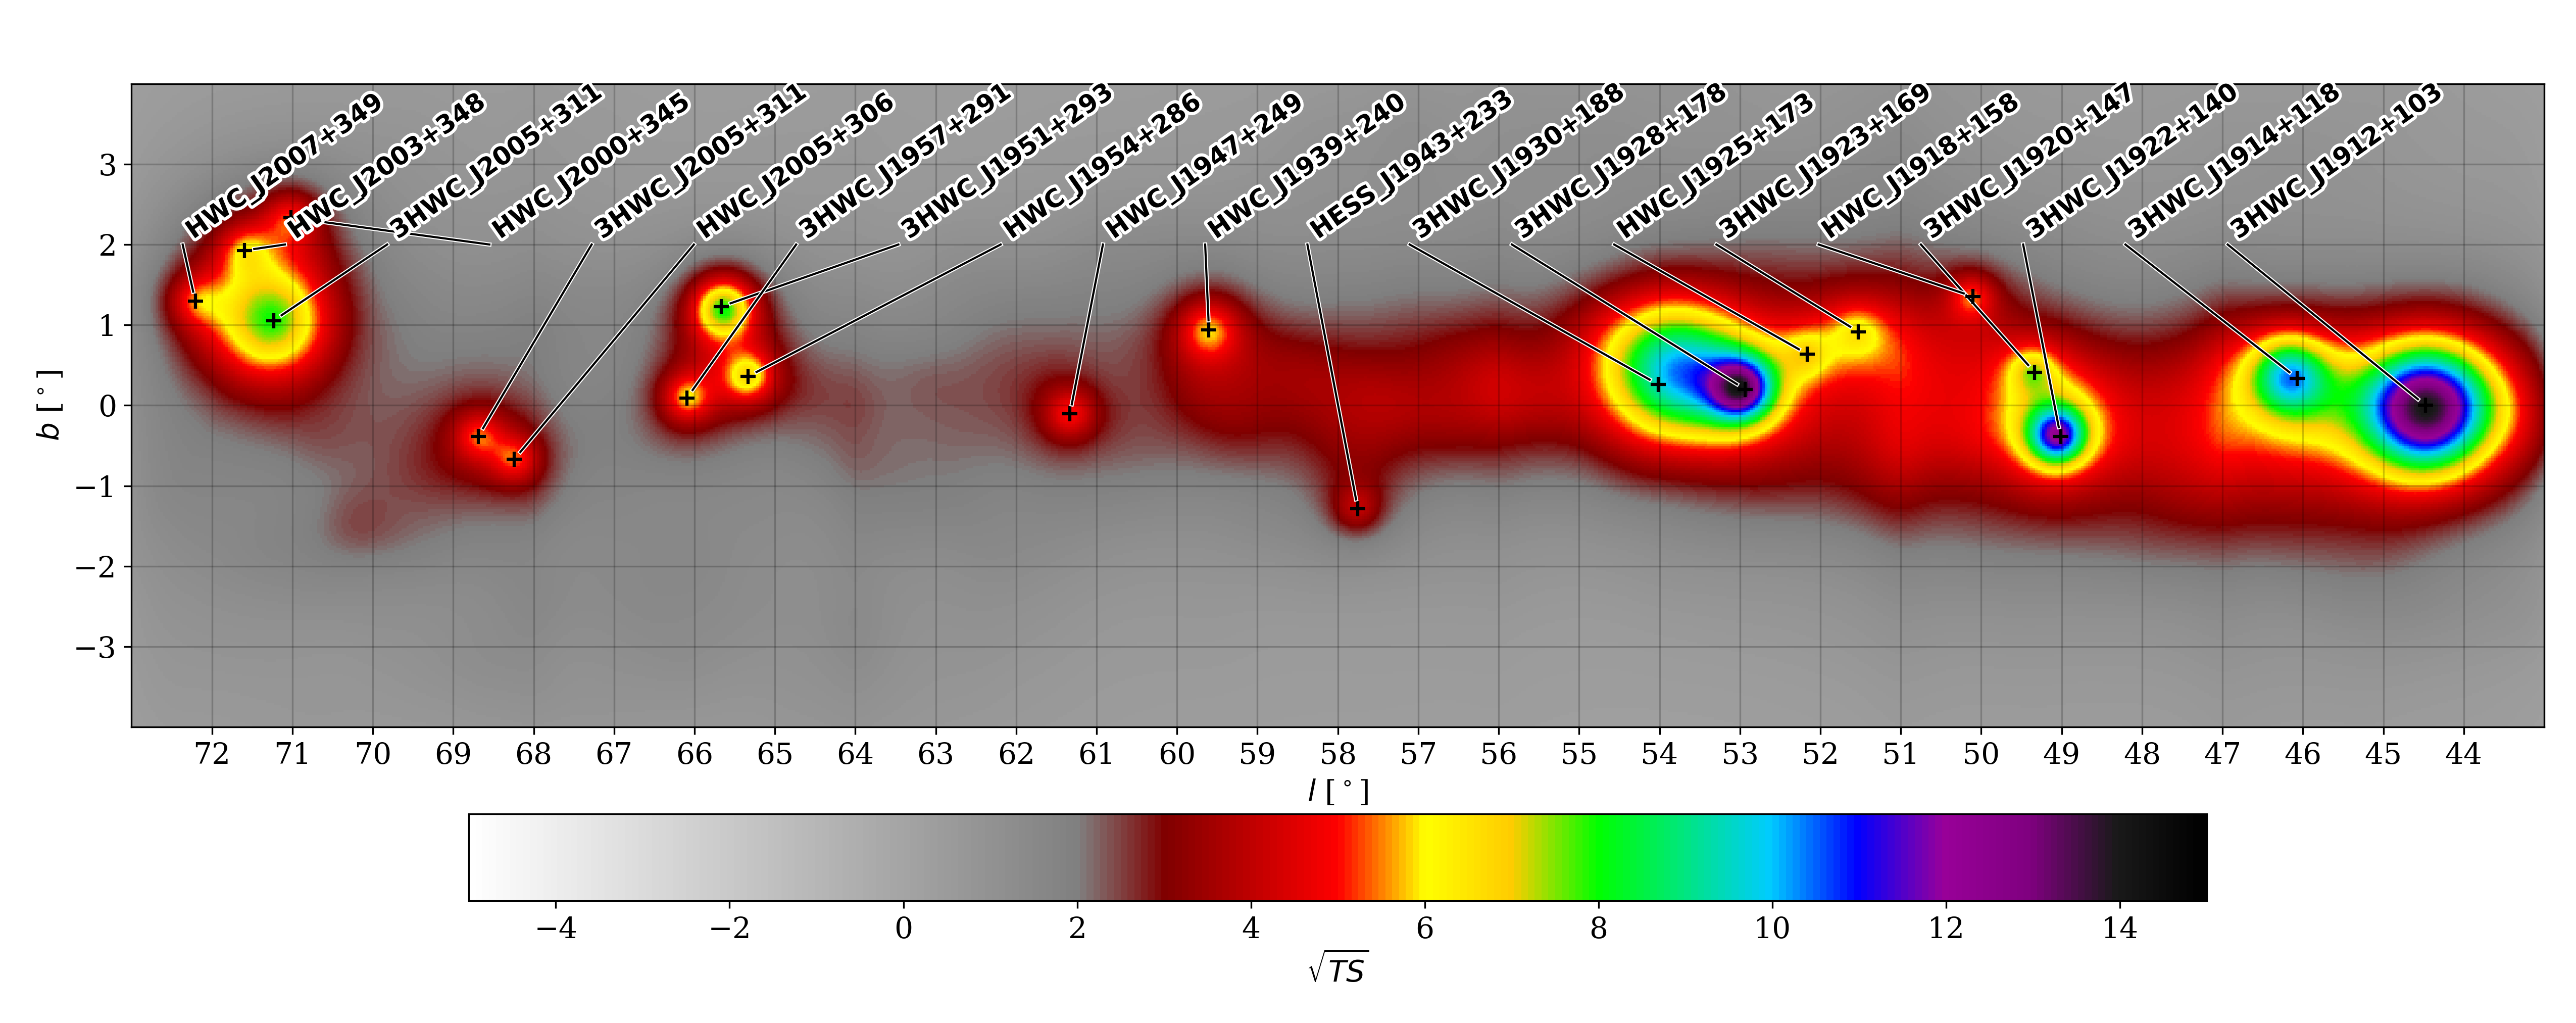
The best fit for the hotspots — characterized as significance excess larger than three (>3) — in the “original map”, results in 21 (either point-like or extended) sources, as labeled in Figure 3 555Spectral parameters and extension (in the case of extended sources) of sources labeled in significance maps differ from those in the catalogs (H.E.S.S. (Abdalla et al., 2018), HAWC (Albert et al., 2020)), since they are based on a model fitting including a GDE model in the analysis.
The present study proposes a model in which the spectral distributions of the 21 sources are assumed to follow power-law spectra with exponential cutoffs, while the spectral distribution for the diffuse emission is represented by a simple power-law (SPL). Furthermore, the morphological shape of extended sources in the model is approximated by a Gaussian distribution. To incorporate the morphological features of the GDE, a 2-dimensional morphological template is included in the model, which is obtained by summing the contributions of -decay and Inverse Compton (IC) from the DRAGON code (see Appendix C).
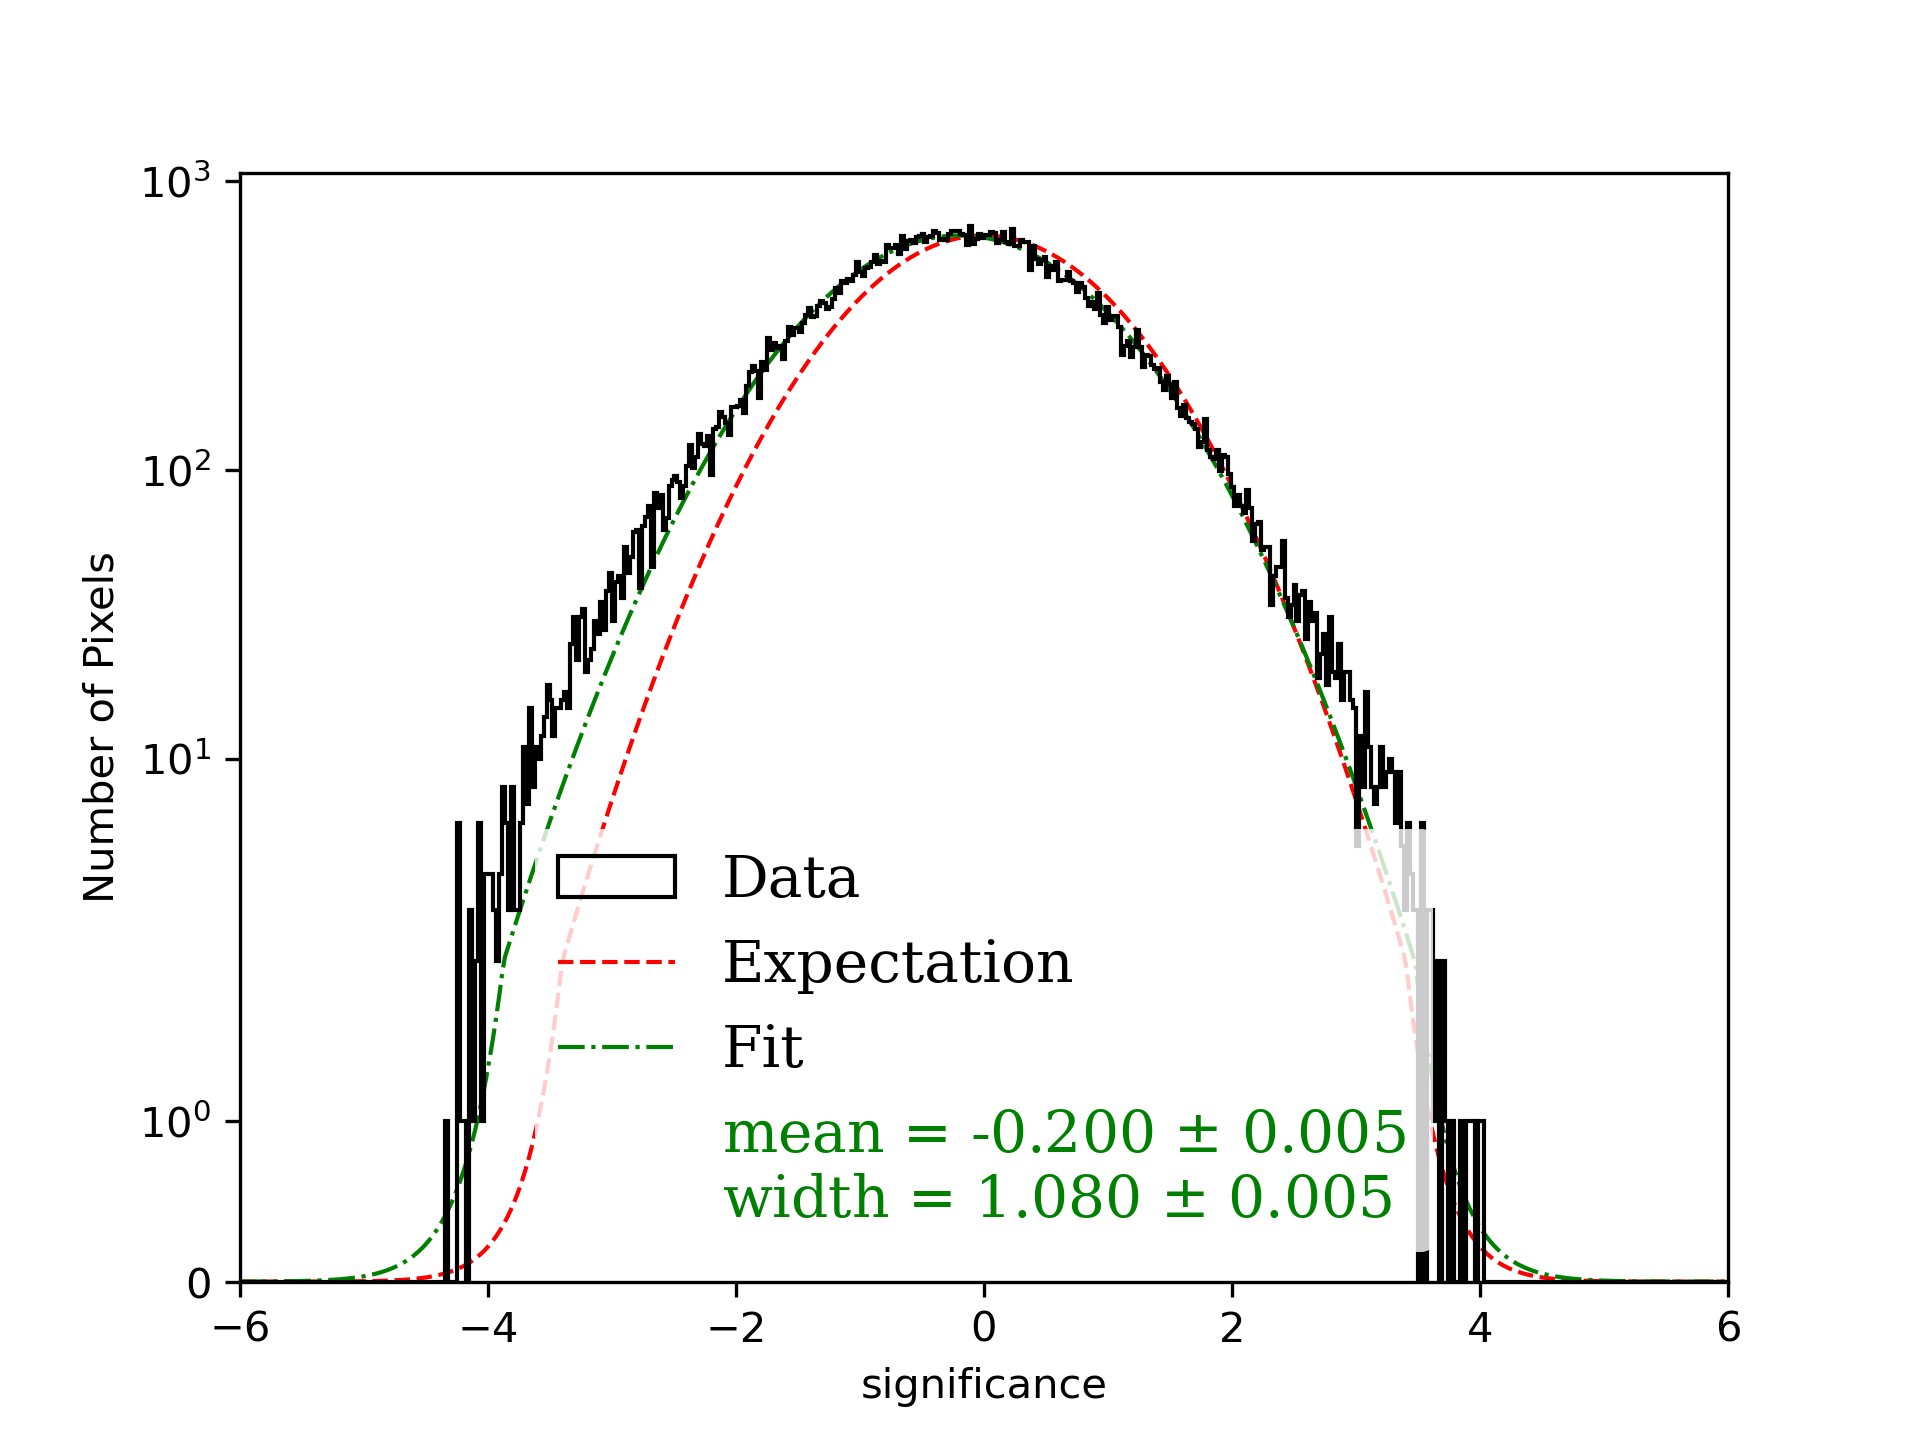
The spectral parameters of both the GDE and the sources, as well as the size of extended sources, are considered as free parameters allowed to vary and be fitted. The fitting procedure is performed using a likelihood method based on the Multi-Mission Maximum Likelihood (3ML) framework (Vianello et al., 2015). The objective is to identify the best-fitting model that characterizes the spectral and morphological properties of all 21 sources in the Galactic Plane. To assess the optimal model, a residual map and significance histogram are obtained by subtracting the model for sources and GDE (Figure 3, bottom) from the “original map”. This procedure is repeated many times until the optimal model, for which the residual map shows no significant additional hotspots is obtained. The residual or background map is shown in Figure 4.
The multi-source fitting yields thus the best possible fit for the spectrum and morphology of all sources and therefore, the total flux due to all sources (). Figure 3 (top) shows the map of the fitted source flux. The GDE reference model used in the fitting procedure is plotted in the middle panel, while the model of GDE + sources is shown in the bottom panel.

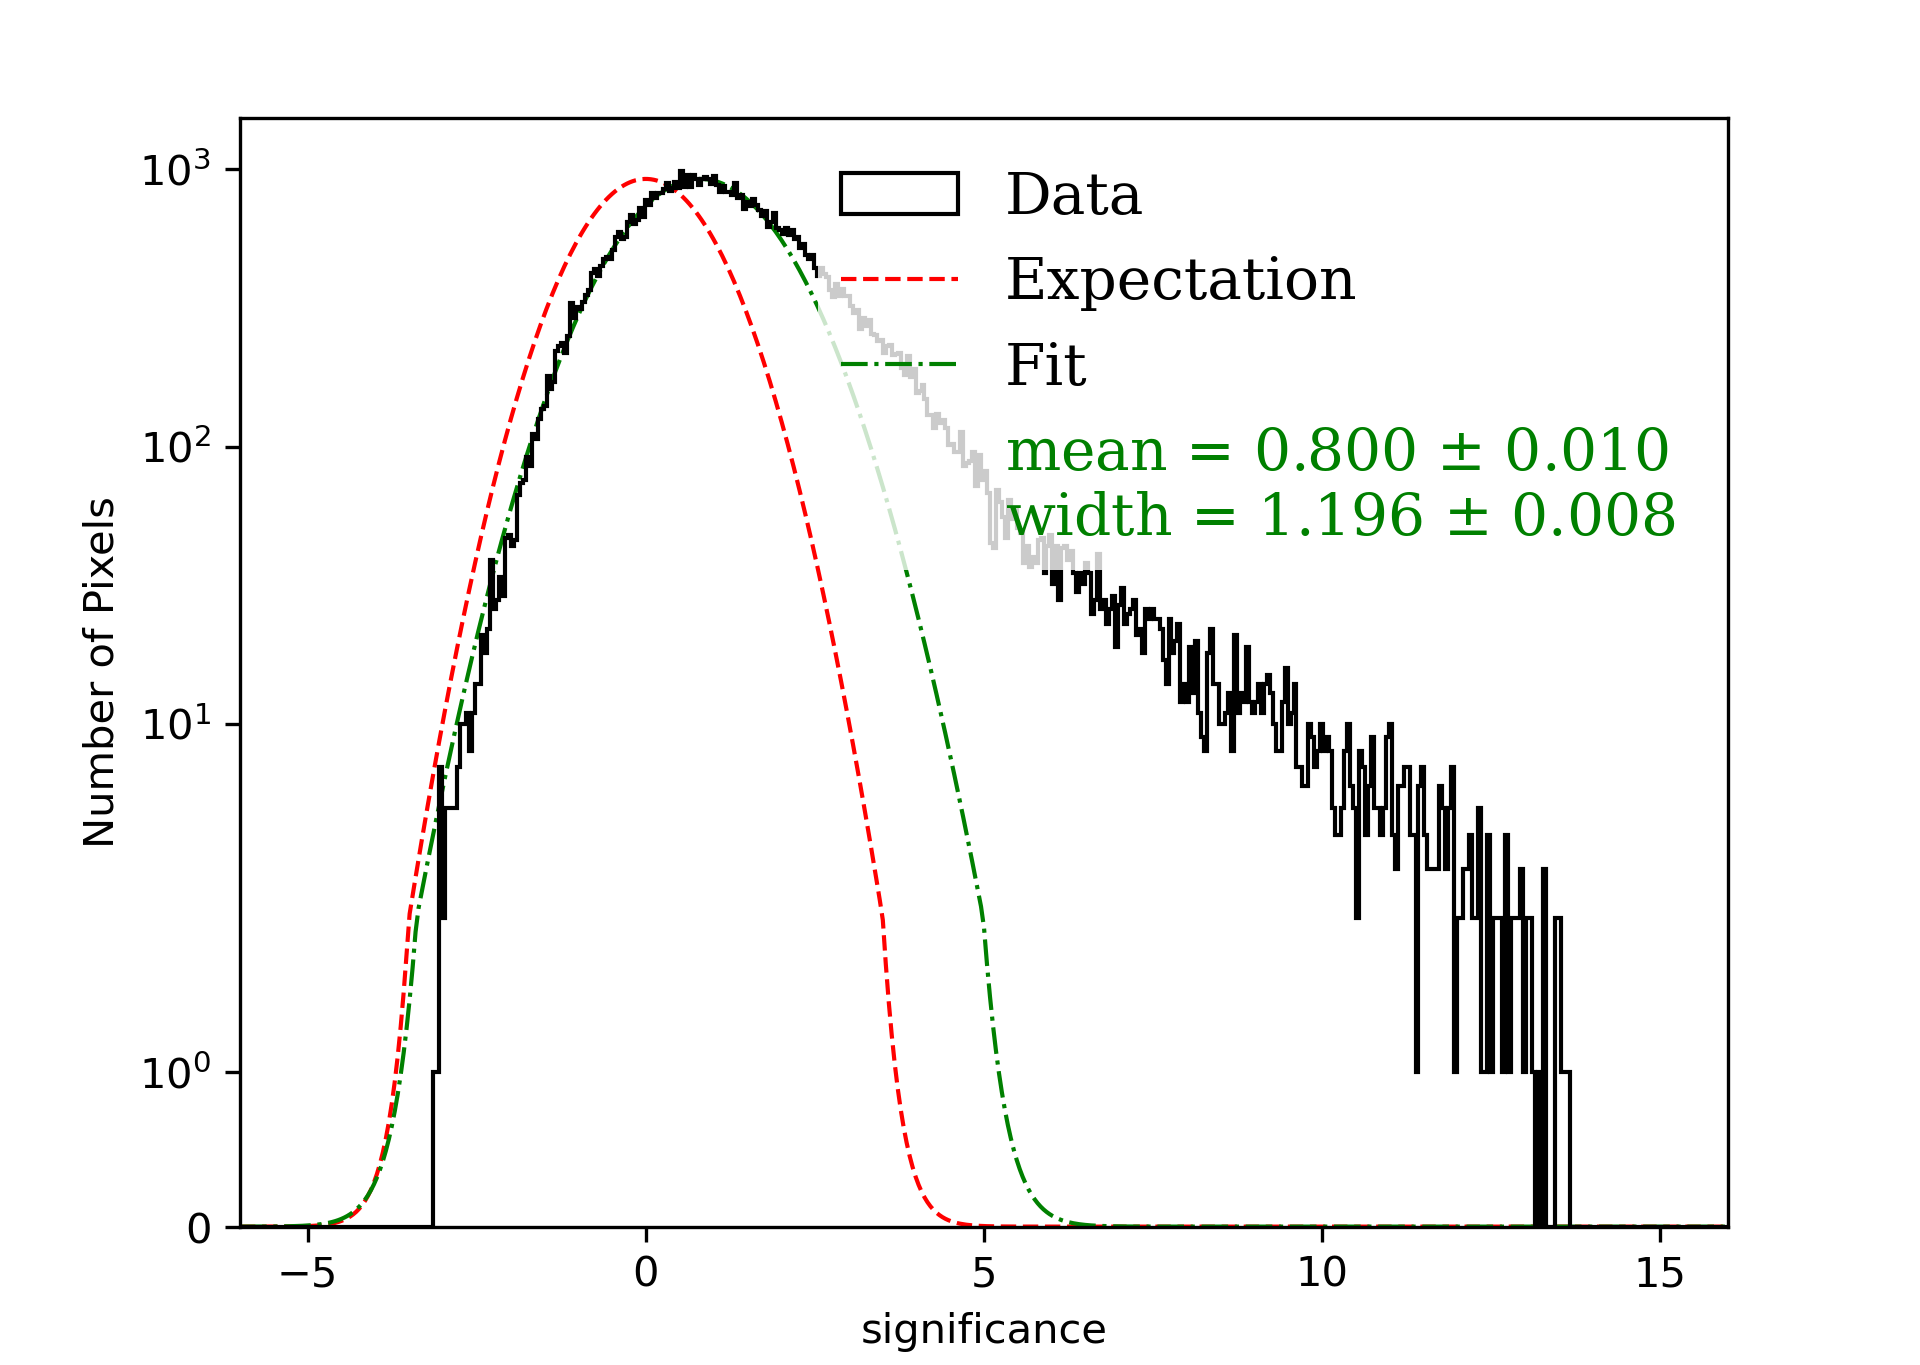
In Figure 5 the significance histogram of the residual map in the region restricted to and to is presented. The residual map, which shows no excess above 5 sigmas, helps test the goodness of the models assumed for sources and GDE.
We subtract the model of the sources in Figure 3 (top) from the “original map” (Figure 1) to obtain a “source-subtracted map” (GDE map) shown in Figure 6, (), which is used to determine the GDE spectral properties in the final step of the analysis.
3 Results
3.1 Galactic Diffuse Emission Spectrum
The GDE distribution is reported in Table 2 for the regions of the Galactic Plane over latitude ranges of < 2∘ and < 4∘. The contribution of the GDE flux with respect to the total flux measured with HAWC is computed for two energy ranges and reported as f10 and f100666 , where and are GDE flux and total HAWC flux respectively.. f10 is the fractional contribution of the GDE flux to the total flux for energies between 300 GeV and 10 TeV, while f100 is the fractional contribution of the GDE flux to the total flux up to 100 TeV.
As shown in Table 2 the contribution of the GDE flux (both f10 and f100) varies between 67.2% and 88.1%, which implies that the GDE contributes significantly to the total emission of TeV gamma-rays from the Galactic Plane. The average GDE flux (per sr) over latitudes < 2∘ is greater than the average GDE flux in the broader regions with < 4∘. In the regions closer to the center of the Galactic disk (b = 0), the GDE is in fact expected to be brighter (see Figures 8). On the other hand both fractional contributions, f10 and f100, show that the GDE is less dominant for < 2∘ (see Table 2). In the outer Galaxy the emission from identified sources contributes less, as expected.
| < | Index | f10 | f100 | |||
|---|---|---|---|---|---|---|
| (∘) | (∘) | (∘) | (TeV-1 s-1cm-2sr-1) | % | % | |
| 43 | 73 | 2 | 8.89 0.37 | -2.61 0.03 | 72.7 | 71.8 |
| 43 | 73 | 4 | 5.45 0.25 | -2.60 0.03 | 76.1 | 75.3 |
| 43 | 56 | 2 | 9.9 0.6 | -2.70 0.04 | 68.8 | 67.4 |
| 43 | 56 | 4 | 5.8 0.4 | -2.69 0.05 | 73.1 | 71.7 |
| 56 | 64 | 2 | 8.9 0.7 | -2.58 0.06 | 86.4 | 86.6 |
| 56 | 64 | 4 | 5.2 0.5 | -2.60 0.07 | 87.9 | 88.1 |
| 64 | 73 | 2 | 7.8 0.7 | -2.48 0.07 | 67.2 | 67.2 |
| 64 | 73 | 4 | 5.5 0.45 | -2.51 0.06 | 73.7 | 73.4 |
The average spectral index over the region 43∘ < < 73∘ varies from for latitudes < 2∘ to < 4∘. Assuming that the GDE is mostly contributed by hadronic interactions, from the spectral feature of the GDE, we can deduce the spectral feature of the CR population producing this emission. The spectral index of the Galactic background CR population over an energy range between 1- TeV, which has a value very close to , well agrees with the results obtained by (Lipari, 2018). On the other hand our result disagrees with previous studies of the CR spectrum below PeV energies that assumed the spectrum to follow an SPL with a soft index between and (Abdo et al., 2008). While the contribution of unresolved sources to the GDE and its relevant effect on the average spectral index should be taken into account (more discussion on this in the section 4), yet the spectral index of the GDE measured with HAWC reveals that the CR population producing GDE along the Galactic Plane has (on average) spectral index compatible with the spectral index of the locally measured CR population up to tens of TeV (see section 1). The harder spectral indices of the GDE of some sub-regions (as shown in table 2) are likely due to the contribution of unresolved sources.
3.2 Profile Generation
Galactic longitudinal and latitudinal profiles provide valuable information on the distribution of the GDE along the Galactic Plane.
The longitudinal profile is created by averaging the energy flux (see Equation 2) within 10 bins, each defined in a 3-degree longitudinal range, over a latitude range of < 2∘. The resulting bins collectively span the entire longitudinal range of analysis, covering 30 degrees in total. Conversely, the latitudinal profile is generated by averaging the energy flux over the entire longitude range within 9 bins, each defined in a 1-degree latitudinal range. This approach enabled us to cover the latitude range of < 4.5∘.
The energy flux (Equation 2) is computed over the energy range between 300 GeV and 100 TeV777 In table 2, the energy flux is also computed up to 10 TeV. ,
| (2) |
where , as is a reference energy, is the differential flux at and is the spectral index. Profiles are computed for both the “original map” (Figure 1) and the GDE map (Figure 6); therefore, it is possible to compare the level of the energy flux
of the total flux measured by HAWC, , (red line) with those parameters of the diffuse emission (blue line) along the Galactic Plane.
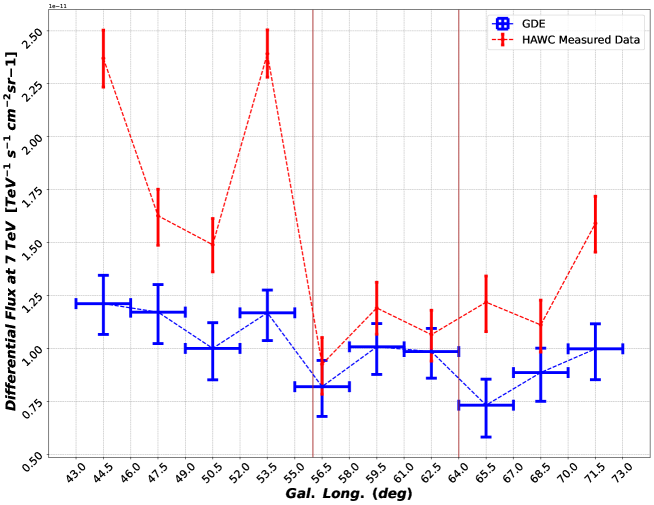
In the profiles, vertical error bars represent the statistical error, and horizontal error bars show the width of each bin that GDE parameters are calculated in it. The brown lines in longitudinal profiles indicate the sub-regions as explained in Table 2.
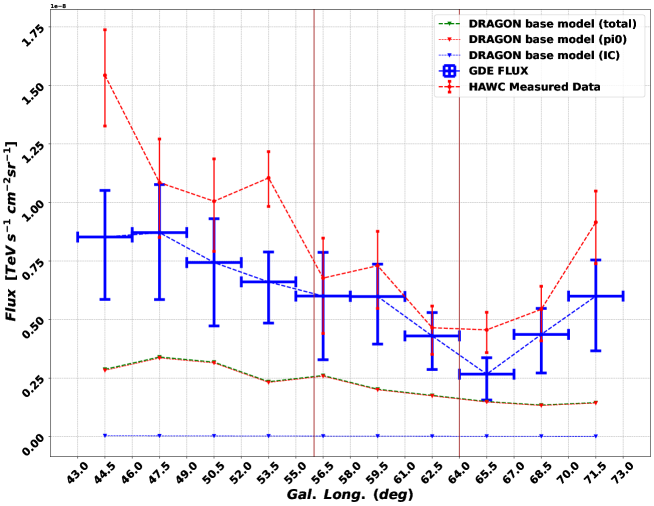
In the longitudinal profiles in the range between 56∘ < < 64∘ (Figure 7), no bright sources were identified in our analysis; the difference between the GDE and the total emission (represented by the blue and red lines, respectively) reaches a minimum value. The f100 is 88.1% (see Table 2) and the spectrum of the total emission is similar to the GDE spectrum.
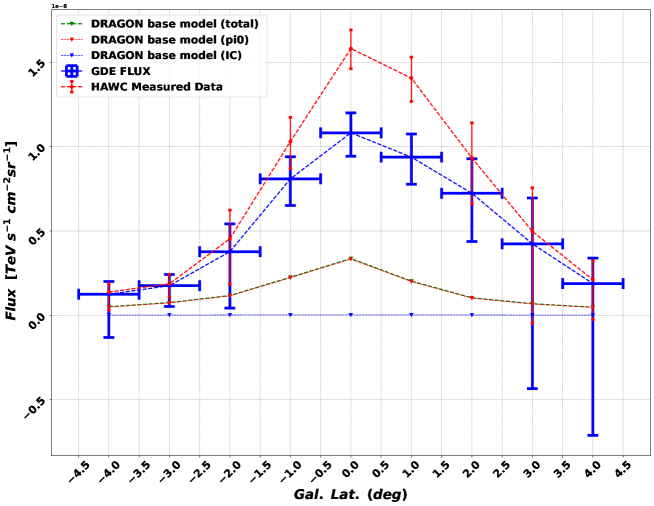
Figure 8 represents the latitude profile of the total energy flux measured by HAWC (red), GDE flux (blue), and DRAGON estimation for the -decay, and IC production mechanisms. The error bars increase on the edge of the latitude profiles due to the lack of statistics in these regions.
3.3 Comparison with other observations of the GDE
The observations of TeV Galactic diffuse gamma-ray emission, performed by different experiments such as Milagro (Abdo et al., 2008), LHAASO-KM2A (Cao et al., 2023),
HEGRA-IACT (Aharonian et al., 2001) and ARGO-YBJ (Bartoli et al., 2015) are shown in Figure 9.
The Milagro points for longitudes and are obtained at 15 TeV (Abdo et al., 2008) energies. An upper limit was set by HEGRA-IACT at 1 TeV with 99% confidence level (C.L.) (Aharonian et al., 2001).
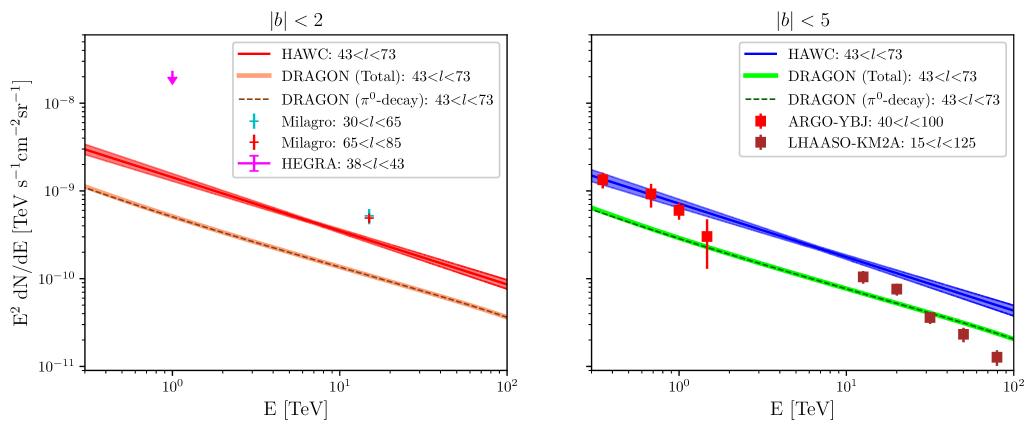
When compared with the results obtained with Milagro, the findings of this study reveal a smaller level of the GDE as measured by HAWC data. This disparity can be attributed to the utilization of a model (see section 2.4) that more effectively accounts for source emissions, leading to a better fit of the data and improved estimation of the true level of GDE. As a consequence, the HAWC study reaches a lower threshold for the true GDE compared to the previous work by Milagro. LHAASO reported the energy spectrum of the GDE within the energy range of 10 TeV to 1 PeV. The observed spectrum, found in the inner region (, < 5∘), follows a power-law function with an index of -2.99 0.04.
HEGRA-IACT (Figure 9) reported an upper limit for GDE above 1 TeV (99% C.L.) with a presumed spectral index of -2.6 (Aharonian et al., 2001). As shown in Figure 9, the HAWC measurement is below HEGRA’s upper limit; this excess suggests a significant contribution of unresolved sources in GDE measured by HEGRA-IACT, likely due to the non-ideal modeling for the sources in the HEGRA-IACT analysis. Moreover, HEGRA-IACT has measured the GDE in a narrow region closer to the Galactic center (lower Galactic longitude), which is expected to have a more significant diffuse emission (as it can be seen in Figure 6). In Figure 9, the estimated spectra of DRAGON for the -decay mechanism, and total diffuse emission (which is a sum of -decay and IC) are shown. The IC contribution modelled with DRAGON is negligible. In Figure 9 we also include a comparison with the ARGO-YBJ measurements. However, we remark that a comparison of HAWC findings with the ARGO-YBJ results is difficult. ARGO-YBJ reported the GDE emission from higher longitudes (further away from the Galactic center), with energies ranging from 350 GeV to 2 TeV.
4 Discussion and Conclusion
We have presented the first analysis of the spectral and angular distribution of the diffuse gamma-ray emission measured by HAWC above 1 TeV over a portion of the Galactic Plane between longitude and latitude of and , respectively. We have determined both the longitudinal and latitudinal profiles of this emission and its spectrum in several sub-regions.
We have found that the spectrum of the emission is well fitted by an SPL model with index (see table 2). Such a spectral index well agrees with the emission being generated by population of background CR protons and heavier nuclei, whose spectral shape very closely mimics the spectral shape of the CR spectrum probed by experiments near the Earth (see section 1). Our results support the picture in which the CR spectral hardening found by PAMELA and AMS at the rigidity of about 300 GV is a large-scale feature as also suggested by the AMS measurements of secondary CR nuclei spectra (Aguilar et al., 2018).
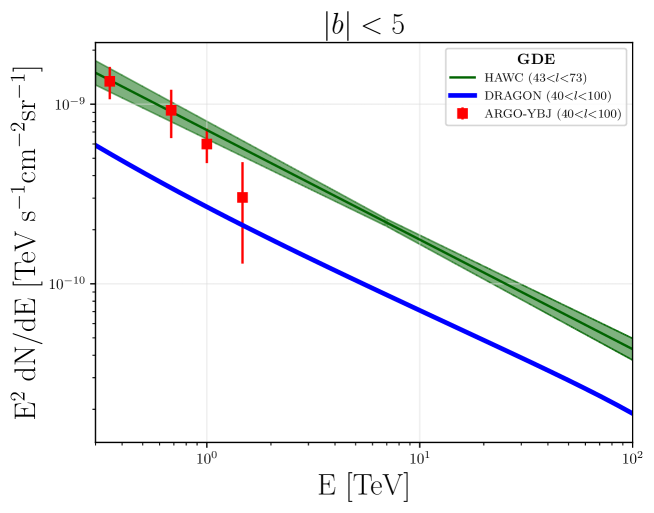
In this study, we compared the predictions of a reference model, known as the base model, implemented using the DRAGON code, with the measured spectral shape of the GDE in the sky-window observed by the HAWC. The base DRAGON model solves CR propagation in the Galaxy assuming standard CR transport properties, namely a CR diffusion coefficient as obtained from measurements of secondary CR ratios. The CR spectra over the whole Galaxy are then convolved with the gas distribution. The spectral properties of the DRAGON base model agreed well with the GDE measurements. The model under-predicted the GDE measured by HAWC by a factor of 2, averaged over the entire region (see Figure 9).
This discrepancy may be attributed to a variety of factors, including potential underestimation of the density of CRs or gas, as well as uncertainties related to their respective distributions, particularly in the case of CRs which are still largely unknown. In addition, the contribution from unresolved sources cannot be overlooked, as it has been shown that up to 90 of the diffuse radiation at TeV energies can originate from such sources (Cataldo et al., 2020; Steppa & Egberts, 2020). Another limitation that cannot be ignored is the non-ideal model for sources used in this study, which causes the GDE to include emission from sources left in the source-subtracted map. Furthermore, the TeV halos of pulsar wind PWNe are also expected to make a significant contribution to the emission at both GeV and TeV energies (Vecchiotti et al., 2022). In this sense, our measurement of the GDE can be seen as an upper limit to the truly diffuse emission. Also, it should be kept in mind that systematic errors (angular and energy resolution) restrict the analysis precision (Abeysekara et al., 2017).
Future HAWC analyses using higher-quality data, such as Pass 5 data, will be necessary to further elucidate the difference between the measured and predicted diffuse fluxes. Very recently LHAASO published a measurement of the diffuse emission from a large region of the Galactic Plane, 15∘ < < 125∘ and -5∘ < < 5∘, by excluding large portions of the Galactic Plane, and reported a significantly lower level for the diffuse emission with respect to HAWC (Cao et al., 2023). The analysis of TeV diffuse emission will be a major scientific objective for future gamma-ray observatories, such as the SWGO observatory (Abreu et al., 2019) and the Cherenkov Telescope Array (Consortium et al., 2017), which will benefit from improved sensitivity and angular resolution.
Appendix A Differential Flux Profiles
As formerly discussed in section 3.2, longitudinal and latitudinal profiles are used to study the distribution of GDE along the Galactic Plane. This appendix presents the longitudinal and latitudinal profiles for the differential flux of the GDE emission at E0 = 7 TeV. The longitudinal profile is obtained by averaging the differential flux over a range in latitude < 2∘. The latitudinal profile is obtained by averaging the differential flux over a range in longitude , which covers the latitude range of < 4.5∘.
The longitudinal profile of the differential flux (Figure 10), as discussed in section 3.2, exhibits a minimum difference between the GDE and total emission, represented by the blue and red lines, respectively, in the range of 56∘ < < 64∘. In addition, Figure 11 shows the latitudinal profile of the differential flux of the GDE and the total emission measured by HAWC (within the same bins).

Appendix B Comparison with ARGO-YBJ measurements
The measurement of the diffuse emission by ARGO-YBJ (Bartoli et al., 2015) at Galactic longitudes and Galactic latitudes < 5∘ and for an energy range from 350 GeV to 2 TeV is shown in Figure 12. The measured flux at three median energies, 350 GeV, 680 GeV, and 1.47 TeV (with uncertainties of about 30%) is above the DRAGON estimations of GDE. Additional flux from unresolved sources and from PWNe halos might explain the discrepancy between the ARGO-YBJ results and the DRAGON predictions. The spectral index of the GDE as measured by ARGO-YBJ is -2.90.31, which is softer than HAWC spectral index. For comparison, we show also the HAWC flux measured in and Galactic latitudes < 5∘, which is however measured from an inner region of the Galactic Plane.
Appendix C DRAGON
The DRAGON code (Evoli et al., 2008, 2017) solves the CR transport equation accounting for diffusion, re-acceleration, advection, energy losses and spallation onto the interstellar gas. A conventional approach in which the diffusion coefficient is assumed to be isotropic in the whole Galaxy and homogeneous in the Galactic Plane is chosen here. The reference set-up (base model) is presented in (Fornieri et al., 2020) where it was shown to reproduce the CR proton, helium and electron spectra measured by AMS and, at larger energies relevant here, CREAM (Yoon et al., 2017) as well as CALET (Adriani et al., 2019) results.
As mentioned in the introduction, this requires a spectral hardening in the primary nuclei spectra at an energy . For the same model, DRAGON predicts both the spatial and energy distribution in the whole Galaxy for all relevant CR species which are, then, convolved with the proper cross sections and target gas/radiation distributions to determine the line-of-sight integrated gamma-ray fluxes due to decay, IC and bremsstrahlung at each point of the sky.
For the H2 and HI, HII and helium gas components the same distributions adopted in the GALPROP code (Vladimirov et al., 2011) are assumed. The H2 is based on the observed CO emission maps in several Galactocentric rings (Bronfman et al., 1988) after multiplication by a radial dependent CO-to-H2 conversion factor which, following (Gaggero et al., 2015), is assumed to be for Galactocentric radii smaller (larger) than 7.5 kpc.
The lower value is in agreement with several astrophysical measurements (Bolatto et al., 2013) while the larger value at large radii provides an effective compensation of the otherwise too steep longitude profile of the gamma-ray diffuse emission (gradient problem) as assumed in other related works (see e.g. (Strong & Mattox, 1996)).
The base model is tuned to reproduce the morphology and
the spectrum of the diffuse emission
originated by CRs as measured by AMS in the sky-window under consideration.
References
- Abdalla et al. (2018) Abdalla, H., Abramowski, A., Aharonian, F., et al. 2018, Astronomy & Astrophysics, 612, A1, doi: 10.1051/0004-6361/201732098
- Abdo et al. (2008) Abdo, A. A., Allen, B., Aune, T., et al. 2008, The Astrophysical Journal, 688, 1078, doi: 10.1086/592213
- Abeysekara et al. (2023) Abeysekara, A., Albert, A., Alfaro, R., et al. 2023, Nuclear Instruments and Methods in Physics Research Section A: Accelerators, Spectrometers, Detectors and Associated Equipment, 1052, 168253, doi: https://doi.org/10.1016/j.nima.2023.168253
- Abeysekara et al. (2017) Abeysekara, A. U., Albert, A., Alfaro, R., et al. 2017, The Astrophysical Journal, 843, 39, doi: 10.3847/1538-4357/aa7555
- Abeysekara et al. (2017) Abeysekara, A. U., Albert, A., Alfaro, R., et al. 2017, ApJ, 843, 40, doi: 10.3847/1538-4357/aa7556
- Abeysekara et al. (2017) Abeysekara, A. U., Albert, A., Alfaro, R., et al. 2017, The Astrophysical Journal, 841, 100, doi: 10.3847/1538-4357/aa729e
- Abeysekara et al. (2019) —. 2019, The Astrophysical Journal, 881, 134, doi: 10.3847/1538-4357/ab2f7d
- Abramowski et al. (2014) Abramowski, A., Aharonian, F., Ait Benkhali, F., et al. 2014, Physical Review D, 90, doi: 10.1103/physrevd.90.122007
- Abreu et al. (2019) Abreu, P., Albert, A., Alfaro, R., et al. 2019, The Southern Wide-Field Gamma-Ray Observatory (SWGO): A Next-Generation Ground-Based Survey Instrument for VHE Gamma-Ray Astronomy. https://arxiv.org/abs/1907.07737
- Acero et al. (2016) Acero, F., Ackermann, M., Ajello, M., et al. 2016, The Astrophysical Journal Supplement Series, 223, 26, doi: 10.3847/0067-0049/223/2/26
- Ackermann (2012) Ackermann, M. e. a. 2012, ApJ, 750, 3, doi: 10.1088/0004-637X/750/1/3
- Adriani et al. (2011) Adriani, O., et al. 2011, Science, 332, 69, doi: 10.1126/science.1199172
- Adriani et al. (2019) —. 2019, Phys. Rev. Lett., 122, 181102, doi: 10.1103/PhysRevLett.122.181102
- Aguilar et al. (2015) Aguilar, M., Aisa, D., Alpat, B., et al. 2015, Phys. Rev. Lett., 115, 211101, doi: 10.1103/PhysRevLett.115.211101
- Aguilar et al. (2018) Aguilar, M., et al. 2018, Phys. Rev. Lett., 120, 021101, doi: 10.1103/PhysRevLett.120.021101
- Aharonian et al. (2002) Aharonian, F., et al. 2002, Astropart. Phys., 17, 459, doi: 10.1016/S0927-6505(01)00175-X
- Aharonian et al. (2001) Aharonian, F. A., Akhperjanian, A. G., Barrio, J. A., et al. 2001, A&A, 375, 1008, doi: 10.1051/0004-6361:20010898
- Ahn et al. (2010) Ahn, H. S., et al. 2010, Astrophys. J., 714, L89, doi: 10.1088/2041-8205/714/1/L89
- Albert et al. (2020) Albert, A., Alfaro, R., Alvarez, C., et al. 2020, 3HWC: The Third HAWC Catalog of Very-High-Energy Gamma-ray Sources. https://arxiv.org/abs/2007.08582
- Alemanno et al. (2021) Alemanno, F., An, Q., Azzarello, P., et al. 2021, Phys. Rev. Lett., 126, 201102, doi: 10.1103/PhysRevLett.126.201102
- Amenomori (2021) Amenomori, M. e. a. 2021, Phys. Rev. Lett., 126, 141101, doi: 10.1103/PhysRevLett.126.141101
- An et al. (2019) An, Q., Asfandiyarov, R., Azzarello, P., et al. 2019, Science Advances, 5, eaax3793, doi: 10.1126/sciadv.aax3793
- Atkins et al. (2003) Atkins, R., Benbow, W., Berley, D., et al. 2003, The Astrophysical Journal, 595, 803, doi: 10.1086/377498
- Bartoli et al. (2015) Bartoli, B., Bernardini, P., Bi, X. J., et al. 2015, The Astrophysical Journal, 806, 20, doi: 10.1088/0004-637x/806/1/20
- Berezinskii et al. (1984) Berezinskii, V. S., Bulanov, S. V., Ginzburg, V. L., Dogel, V. A., & Ptuskin, V. S. 1984, Astrophysics of cosmic rays. (Izdatel’stvo Nauka)
- Bolatto et al. (2013) Bolatto, A. D., Wolfire, M., & Leroy, A. K. 2013, Ann. Rev. Astron. Astrophys., 51, 207, doi: 10.1146/annurev-astro-082812-140944
- Bronfman et al. (1988) Bronfman, L., Cohen, R. S., Alvarez, H., May, J., & Thaddeus, P. 1988, ApJ, 324, 248, doi: 10.1086/165892
- Cao et al. (2023) Cao, Z., Aharonian, F., An, Q., et al. 2023, arXiv e-prints, arXiv:2305.05372, doi: 10.48550/arXiv.2305.05372
- Cao et al. (2023) Cao, Z., Aharonian, F., An, Q., et al. 2023, Measurement of ultra-high-energy diffuse gamma-ray emission of the Galactic plane from 10 TeV to 1 PeV with LHAASO-KM2A. https://arxiv.org/abs/2305.05372
- Cataldo et al. (2020) Cataldo, M., Pagliaroli, G., Vecchiotti, V., & Villante, F. L. 2020, ApJ, 904, 85, doi: 10.3847/1538-4357/abc0ee
- Consortium et al. (2017) Consortium, T. C. T. A., :, Acharya, B. S., et al. 2017, Science with the Cherenkov Telescope Array. https://arxiv.org/abs/1709.07997
- Evoli et al. (2008) Evoli, C., Gaggero, D., Grasso, D., & Maccione, L. 2008, Journal of Cosmology and Astroparticle Physics, 2008, 018, doi: 10.1088/1475-7516/2008/10/018
- Evoli et al. (2017) Evoli, C., Gaggero, D., Vittino, A., et al. 2017, Journal of Cosmology and Astroparticle Physics, 2017, 015, doi: 10.1088/1475-7516/2017/02/015
- Fornieri et al. (2020) Fornieri, O., Gaggero, D., & Grasso, D. 2020, JCAP, 2002, 009, doi: 10.1088/1475-7516/2020/02/009
- Gaggero et al. (2015) Gaggero, D., Grasso, D., Marinelli, A., Urbano, A., & Valli, M. 2015, The Astrophysical Journal, 815, L25, doi: 10.1088/2041-8205/815/2/l25
- Hanisch et al. (2001) Hanisch, R. J., Farris, A., Greisen, E. W., et al. 2001, A&A, 376, 359, doi: 10.1051/0004-6361:20010923
- Hunter et al. (1997) Hunter, S. D., Bertsch, D. L., Catelli, J. R., et al. 1997, ApJ, 481, 205, doi: 10.1086/304012
- Lipari (2018) Lipari, P. 2018, Astropart. Phys., 97, 197, doi: 10.1016/j.astropartphys.2017.11.008
- Pothast et al. (2018) Pothast, M., Gaggero, D., Storm, E., & Weniger, C. 2018, Journal of Cosmology and Astroparticle Physics, 2018, 45, doi: 10.1088/1475-7516/2018/10/045
- Steppa & Egberts (2020) Steppa, C., & Egberts, K. 2020, A&A, 643, A137, doi: 10.1051/0004-6361/202038172
- Stone et al. (2013) Stone, E. C., Cummings, A. C., McDonald, F. B., et al. 2013, Science, 341, 150, doi: 10.1126/science.1236408
- Strong & Mattox (1996) Strong, A. W., & Mattox, J. R. 1996, A&A, 308, L21
- Strong et al. (1988) Strong, A. W., Bloemen, J. B. G. M., Dame, T. M., et al. 1988, A&A, 207, 1
- Thoudam & Horandel (2012) Thoudam, S., & Horandel, J. R. 2012, Mon. Not. Roy. Astron. Soc., 421, 1209, doi: 10.1111/j.1365-2966.2011.20385.x
- Vecchiotti et al. (2022) Vecchiotti, V., Pagliaroli, G., & Villante, F. L. 2022, Communications Physics, 5, 161, doi: 10.1038/s42005-022-00939-7
- Vianello et al. (2015) Vianello, G., Lauer, R. J., Younk, P., et al. 2015, The Multi-Mission Maximum Likelihood framework (3ML). https://arxiv.org/abs/1507.08343
- Vladimirov et al. (2011) Vladimirov, A., Digel, S., Jóhannesson, G., et al. 2011, Computer Physics Communications, 182, 1156–1161, doi: 10.1016/j.cpc.2011.01.017
- Wilks (1938) Wilks, S. S. 1938, The annals of mathematical statistics, 9, 60
- Yang et al. (2016) Yang, R., Aharonian, F., & Evoli, C. 2016, Physical Review D, 93, doi: 10.1103/PhysRevD.93.123007
- Yoon et al. (2017) Yoon, Y. S., Anderson, T., Barrau, A., et al. 2017, The Astrophysical Journal, 839, 5, doi: 10.3847/1538-4357/aa68e4