Constraining the AGN luminosity function from JWST with the X-ray Background
Abstract
We predict the X-ray background (XRB) expected from the population of quasars detected by the JWST spectroscopic surveys over the redshift range . We find that the measured UV emissivities imply a times higher unresolved X-ray background than constrained by current experiments. We illustrate the difficulty of simultaneously matching the faint-end of the quasar luminosity function and the X-ray background constraints. We discuss possible origins and consequences of this discrepancy.
1 Introduction
The recent James Webb Space Telescope (JWST) photometric and spectroscopic surveys have discovered a large number of active galactic nuclei (AGN) candidates over the redshifts , especially helping to bridge the gap of missing faint AGN with (Matsuoka et al., 2023). The AGN candidates are identified based on X-ray, broad , and high ionization lines. A large number of faint AGN have also been identified at (e.g., Onoue et al., 2023; Kocevski et al., 2023; Übler et al., 2023; Harikane et al., 2023; Maiolino et al., 2023a; Matthee et al., 2023), with steeper faint ends in their luminosity functions than expected from extrapolating previous results. Such candidates are also detected out to higher redshifts, (Fudamoto et al., 2022; Larson et al., 2023; Goulding et al., 2023; Maiolino et al., 2023b). Recently, the EPOCHS survey covering the JWST PEARLS and Early Release Observations (ERO) fields identified nine new AGN in the redshift range (Juodžbalis et al., 2023), and the UNCOVER survey used the JWST NIRSpec to provide the UV luminosity functions from 15 AGN candidates over (Greene et al., 2023). The UV luminosity functions (UV LFs) measured at wavelengths 912 Å and 1450 Å are about factors of greater than the faintest UV-selected quasars observed previously.
The measured bolometric luminosities of the AGN are used to derive the properties of their central supermassive black holes (e.g., Pacucci et al., 2023; Maiolino et al., 2023a; Larson et al., 2023; Kocevski et al., 2023; Natarajan et al., 2023). AGN at identified in JWST and previous literature have bolometric luminosities covering a wide range and inferred black hole masses of . Many of the derived black-hole to stellar mass ratios are about 10 to a 100 times greater than expected from the local population (e.g., Pacucci et al., 2023; Yue et al., 2023; Stone et al., 2023), with one candidate black hole (Bogdan et al., 2023) also showing evidence for being as massive as the stellar host.
A population of black holes at high redshifts would contribute to a copious production of X-ray photons with energies , where is the neutral hydrogen fraction in the intergalactic medium (IGM; Dijkstra et al., 2004). Here, represents the energy above which the IGM becomes optically thin to photons over a Hubble length. Following the redshifting of these photons without absorption, they would be observed today as the present-day X-ray background (XRB) in the relevant energy regime (measured with, e.g., the Swift, INTEGRAL and Chandra surveys; e.g., Ajello et al., 2008; Moretti et al., 2012; Churazov et al., 2007; Cappelluti et al., 2017). Previous theoretical and observational studies (Shen et al., 2020; Haiman & Loeb, 1999; Dijkstra et al., 2004; Faucher-Giguère, 2020) have found that the current constraints on the quasar population saturate the unresolved component of the measured XRB (Moretti et al., 2012; Cappelluti et al., 2017).
In this paper, we predict the level of the XRB implied by the measured AGN UV LFs from the recent JWST surveys over . We find that the JWST measurements – used in combination with recent findings connecting the UV emissivity to the XRB – would oversaturate the Swift XRT/Chandra constraints on the unresolved XRB by about an order of magnitude. In so doing, we illustrate the difficulty of simultaneously matching both the UV LF and the XRB constraints. We discuss the possible reasons and consequences for the discrepancy.
2 Relevant equations
The data compilation of Shen et al. (2020) allows for a characterization of the bolometric quasar luminosity function from observations in the rest-frame IR, B, UV, soft and hard X-ray wave bands, covering redshifts . A best-fitting quasar spectral energy density (SED) model is constructed to convert the luminosities across various bands and fitted to the data. The bolometric quasar luminosity function, describing the comoving number density of quasars as a function of luminosity over all wavebands, is found to be well-modeled by a double-power-law (Shen et al., 2020) form. The same functional form is found to describe the luminosity function in specific wave bands (of rest frequencies with corresponding luminosities and number densities ):
| (1) |
with the best-fitting parameters and being matched to observations, both separately at each redshift and globally across the range of redshifts considered. The best-fitting form of the luminosity function for the UV (ultraviolet) regime (with rest wavelength 912 Å) over is found to be in good agreement with multiband observational data. The total emissivity of the AGN in this regime at a given redshift is found by integrating over the luminosity function above a minimum value :
| (2) |
and has units of ergs s -1 Hz-1 Mpc-3.
Using the best-fitting SED template of the AGN emission, the above emissivity can be converted from the UV regime into the X-ray wave band(s). This can be done in various ways, e.g., in Shen et al. (2020), it is done by normalizing a power-law X-ray SED template over the soft (0.5-2 keV) and hard (2-10 keV) X-ray regimes using the nonlinear conversion factor. From this, the comoving X-ray emissivity can be computed as a function of redshift and used to define the cosmic XRB (Shen et al., 2020; Faucher-Giguère, 2020)
| (3) |
with units erg (or keV) cm-2 s-1 sr-1 Hz-1, and in which and are the minimum and maximum redshifts under consideration. In the above, the differential comoving volume element is denoted by
| (4) |
and , are the angular diameter and luminosity distances respectively to redshift . The overall redshift-dependent factor in Eq. (3) thus reduces to . The can equivalently be expressed as a function of the energy of emission corresponding to the rest frequency . The unresolved component of the above background, amounting to about 8-9% (Cappelluti et al., 2017) is constrained to originate from sources above (Haardt & Salvaterra, 2015).
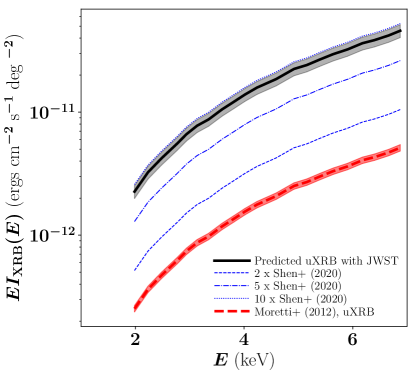
The above formalism can be compared to recent measurements of the XRB (e.g., Cappelluti et al., 2017), specifically its unresolved component which is constrained from the Swift XRT and Chandra data (Moretti et al., 2012). This is plotted as the red dashed line in Fig. 1, with the shaded region representing the uncertainty in the latest unresolved XRB measurements, of the order of 5.5 - 6% (Cappelluti et al., 2017).
3 X-Ray Background from JWST measurements of AGN LF
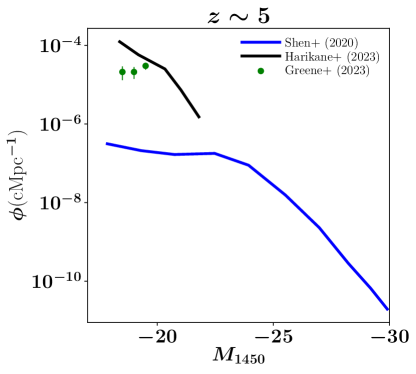
The quasar UV LF at compiled from the JWST ERO, PEARLS and CEERS surveys (Matthee et al., 2023; Maiolino et al., 2023a; Harikane et al., 2023; Greene et al., 2023) all indicate faint-end values of about a factor of 10 above those expected from extrapolating the fits in the literature (as shown in Fig. 2 for the case of the UV LF measured at rest wavelength 1450 Å at ).
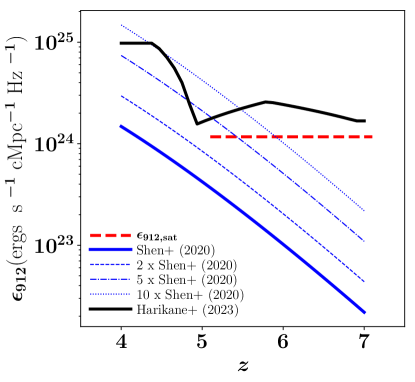
We can use the measurements of Harikane et al. (2023) together with the inferences of Haardt & Salvaterra (2015) to predict the unresolved XRB from the JWST emissivity in the 912 Å wave band. As an intermediate step, we compare the inferred emissivities from the results of the JWST (Harikane et al., 2023) to the best-fitting form of Shen et al. (2020):
| (5) |
where ergs s-1 Hz-1 Mpc-3, , , , . This function is shown in the regime by the blue solid line in Fig. 3, compared to the JWST measurements shown by the black line.111Note that the Shen et al. (2020) results assume a 100% escape fraction, while those of Harikane et al. (2023) assume 50%. Hence, the results from Harikane et al. (2023) have been scaled by factor 2 for comparison on the same plot. As can be seen from Eq. (3), the integral under the emissivity curve, weighted by the redshift-dependent factor from Eq. (4), is proportional to the unresolved XRB implied by the corresponding UV measurement.
Haardt & Salvaterra (2015) inverted the above analysis to set an upper limit on the (assumed constant for ) comoving emissivity at 912 Å which, along with an X-ray and UV spectral indices consistent with current data (Ueda et al., 2014; Masters et al., 2012) including corrections for obscured sources, saturates the unresolved XRB measured by Moretti et al. (2012).222The normalization of this unresolved component [which is used to set the upper limit on the emissivity by Haardt & Salvaterra (2015)] is found to be consistent with later measurements (e.g., Cappelluti et al., 2017). This is shown by the dashed red horizontal line in Fig. 3.
Measuring the area under the curve of the JWST emissivity (shown by the black jagged line in Fig. 3), weighted by the redshift-dependent factor (see discussion following Eq. (4)) and comparing it to that under the red dashed line weighted by the same factor, allows us to predict the enhancement in the unresolved XRB expected from the JWST. This is shown by the black solid line in Fig. 1, and found to be about an order of magnitude higher than the constraints from using the Swift XRT and Chandra observations (Moretti et al., 2012).
An estimate of the uncertainty in this result, shown by the gray shaded band, is made by invoking the scatter in the relation converting X-ray to UV luminosity (Shen et al., 2020). The relation is usually fitted using two prefactors and , with . The updated quasar observations are consistent with the prefactor values measured from Steffen et al. (2006), and . The derived uncertainties are found to be consistent with the dispersion of the X-ray to UV ratio in quasars, constrained to (Chiaraluce et al., 2018), of which about 56% is contributed by intrinsic variability.
We can restate these findings in an equivalent manner by illustrating how the emissivity at 912 Å measured by JWST is discrepant with that required to saturate the current XRB limits. To quantify this discrepancy, we use the 912 Å emissivity inferred by Shen et al. (2020), shown by the solid blue line in Fig. 3, as an intermediary to illustrate the scaling of the results. The values of the Cressie-Read statistic (and its associated -value) are computed between the and quantities, which denote the ‘observed’ (Harikane et al., 2023) and ‘expected’ (Shen et al., 2020) emissivities, and where tracks redshift in the interval . We also measure the between the Harikane et al. (2023) emissivities and those obtained by multiplying the Shen et al. (2020) emissivities by factors of , and respectively (shown by the dashed, dashed-dotted and dotted blue lines respectively in Figure 3). The value of the statistic for each case is plotted in the top panel of Figure 4. Assuming a -value of greater than for the curves to be deemed comparable, we find that the higher value comes closest to consistency with the JWST emissivity curve (with -value 0.0101).
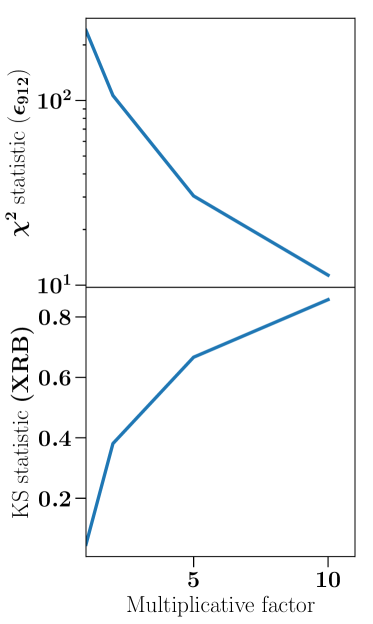
The comparison to the unresolved X-ray background data, however, runs in sharp contrast to the above behaviour for the emissivity. This is illustrated by predicting the XRB expected from the emissivity enhanced by the factors above (by scaling the redshift-weighted areas under each of the blue curves to that of the red dashed line in Fig. 3) and comparing the results to the prediction from the red dashed line, viz the Moretti et al. (2012) best-fitting curve in Fig. 1. The expected backgrounds for the , and multiplicative factors are illustrated by the dashed, dashed-dotted and dotted blue lines respectively in Figure 1. The corresponding values of the two-dimensional Kolmogorov-Smirnov (KS) test statistic [-value, which measures the deviation between the predicted XRB and that measured by Moretti et al. (2012)] is plotted in the lower panel of Fig. 4 as a function of the multiplicative factor (a higher -value indicates larger deviation, with a value of unity ruling out the model). The associated -value of the 10 enhancement is , reiterating the difficulty of simultaneously satisfying the JWST constraints on the 912 Å emissivity over , and the XRB measurements.
4 Discussion
We have explored the implications of the UV luminosity functions constrained by recent JWST AGN detections over , for the unresolved cosmic XRB. Using recent results connecting the UV emissivity to the intensity of the unresolved XRB, we have found that the high number densities of quasars at the faint end of the luminosity function are likely disfavored by the XRB observations. The inferred XRB produced by this population would oversaturate the measured limits by about 1 order of magnitude.
The approach of Haardt & Salvaterra (2015) assumes an X-ray obscuration consistent with recent findings (Ueda et al., 2014; Masters et al., 2012). For any level of dust obscuration, however, the UV (which is detected) is more heavily suppressed than the X-rays (e.g., Masters et al., 2012). This implies that the observed UV luminosity function provides a lower limit on the X-ray luminosity function. The hard X-rays, originating in the compact corona of the AGN (e.g., Reis & Miller, 2013), are also expected to be less collimated than the optical/UV that originates from the accretion disk. Thus, the results obtained here provide a conservative lower bound to the unresolved XRB expected from the JWST detections.333 A more distant explanation could be an intrinsically low X-ray/UV luminosity ratio in these objects (with an as-yet unknown physical cause), at a much higher level than the observationally-constrained scatter in the SED which is expected to be 0.2 dex (Chiaraluce et al., 2018; Shen et al., 2020).
The JWST UV LF is systematically higher than that measured at with the SHELLQs survey (Matsuoka et al., 2023). At least 23 of the candidate AGN thus far have reported spectroscopic confirmations with NIRSpec (Pacucci et al., 2023). However, classical diagnostics alone have been deemed insufficient to confirm secure AGN detections since the NIRSpec resolutions are borderline ( compared to the required ), which could also contribute to the source of the discrepancy (Übler et al., 2023). Other possibilities include biases from faint lines which, when corrected, may bring down the number densities of the AGN by factors of (Matthee et al., 2023). Newer studies with JWST NIRSpec find comparable or higher UV LFs for the AGN at than at (Fujimoto et al., 2023), with a 10-15% AGN fraction in galaxies. Forthcoming spectroscopic census of AGN will help reveal the presence of other factors such as star-formation driven outflows that may make a dominant contribution to the luminosity (Matthee et al., 2023; Zhang et al., 2023; Ferrara et al., 2023) or objects such as brown dwarfs which may account for up to a third of the AGN candidate sample (Greene et al., 2023; Langeroodi et al., 2023).
Acknowledgements
HP’s research is supported by the Swiss National Science Foundation via Ambizione Grant PZ00P2_179934. The work of AL is supported in part by the Black Hole Initiative, which is funded by grants from the JTF and GBMF. We thank Richard Ellis, Andrea Ferrara and Pascal Oesch for comments on an earlier version of the manuscript, and the referee for a helpful report.
References
- Ajello et al. [2008] Ajello, M., Greiner, J., Sato, G., et al. 2008, ApJ, 689, 666, doi: 10.1086/592595
- Bogdan et al. [2023] Bogdan, A., Goulding, A., Natarajan, P., et al. 2023, arXiv e-prints, arXiv:2305.15458, doi: 10.48550/arXiv.2305.15458
- Cappelluti et al. [2017] Cappelluti, N., Li, Y., Ricarte, A., et al. 2017, ApJ, 837, 19, doi: 10.3847/1538-4357/aa5ea4
- Chiaraluce et al. [2018] Chiaraluce, E., Vagnetti, F., Tombesi, F., & Paolillo, M. 2018, A&A, 619, A95, doi: 10.1051/0004-6361/201833631
- Churazov et al. [2007] Churazov, E., Sunyaev, R., Revnivtsev, M., et al. 2007, A&A, 467, 529, doi: 10.1051/0004-6361:20066230
- Dijkstra et al. [2004] Dijkstra, M., Haiman, Z., & Loeb, A. 2004, ApJ, 613, 646, doi: 10.1086/422167
- Faucher-Giguère [2020] Faucher-Giguère, C.-A. 2020, MNRAS, 493, 1614, doi: 10.1093/mnras/staa302
- Ferrara et al. [2023] Ferrara, A., Pallottini, A., & Dayal, P. 2023, MNRAS, 522, 3986, doi: 10.1093/mnras/stad1095
- Fudamoto et al. [2022] Fudamoto, Y., Inoue, A. K., & Sugahara, Y. 2022, ApJ, 938, L24, doi: 10.3847/2041-8213/ac982b
- Fujimoto et al. [2023] Fujimoto, S., Wang, B., Weaver, J., et al. 2023, arXiv e-prints, arXiv:2308.11609, doi: 10.48550/arXiv.2308.11609
- Goulding et al. [2023] Goulding, A. D., Greene, J. E., Setton, D. J., et al. 2023, ApJ, 955, L24, doi: 10.3847/2041-8213/acf7c5
- Greene et al. [2023] Greene, J. E., Labbe, I., Goulding, A. D., et al. 2023, arXiv e-prints, arXiv:2309.05714, doi: 10.48550/arXiv.2309.05714
- Haardt & Salvaterra [2015] Haardt, F., & Salvaterra, R. 2015, A&A, 575, L16, doi: 10.1051/0004-6361/201525627
- Haiman & Loeb [1999] Haiman, Z., & Loeb, A. 1999, ApJ, 521, L9, doi: 10.1086/312177
- Harikane et al. [2023] Harikane, Y., Zhang, Y., Nakajima, K., et al. 2023, arXiv e-prints, arXiv:2303.11946, doi: 10.48550/arXiv.2303.11946
- Juodžbalis et al. [2023] Juodžbalis, I., Conselice, C. J., Singh, M., et al. 2023, MNRAS, 525, 1353, doi: 10.1093/mnras/stad2396
- Kocevski et al. [2023] Kocevski, D. D., Barro, G., McGrath, E. J., et al. 2023, ApJ, 946, L14, doi: 10.3847/2041-8213/acad00
- Langeroodi et al. [2023] Langeroodi, D., Hjorth, J., & Zhang, Z. 2023, arXiv e-prints, arXiv:2308.10900, doi: 10.48550/arXiv.2308.10900
- Larson et al. [2023] Larson, R. L., Finkelstein, S. L., Kocevski, D. D., et al. 2023, ApJ, 953, L29, doi: 10.3847/2041-8213/ace619
- Maiolino et al. [2023a] Maiolino, R., Scholtz, J., Curtis-Lake, E., et al. 2023a, arXiv e-prints, arXiv:2308.01230, doi: 10.48550/arXiv.2308.01230
- Maiolino et al. [2023b] Maiolino, R., Scholtz, J., Witstok, J., et al. 2023b, arXiv e-prints, arXiv:2305.12492, doi: 10.48550/arXiv.2305.12492
- Masters et al. [2012] Masters, D., Capak, P., Salvato, M., et al. 2012, ApJ, 755, 169, doi: 10.1088/0004-637X/755/2/169
- Matsuoka et al. [2023] Matsuoka, Y., Onoue, M., Iwasawa, K., et al. 2023, ApJ, 949, L42, doi: 10.3847/2041-8213/acd69f
- Matthee et al. [2023] Matthee, J., Naidu, R. P., Brammer, G., et al. 2023, arXiv e-prints, arXiv:2306.05448, doi: 10.48550/arXiv.2306.05448
- Moretti et al. [2012] Moretti, A., Vattakunnel, S., Tozzi, P., et al. 2012, A&A, 548, A87, doi: 10.1051/0004-6361/201219921
- Natarajan et al. [2023] Natarajan, P., Pacucci, F., Ricarte, A., et al. 2023, arXiv e-prints, arXiv:2308.02654, doi: 10.48550/arXiv.2308.02654
- Onoue et al. [2023] Onoue, M., Inayoshi, K., Ding, X., et al. 2023, ApJ, 942, L17, doi: 10.3847/2041-8213/aca9d3
- Pacucci et al. [2023] Pacucci, F., Nguyen, B., Carniani, S., Maiolino, R., & Fan, X. 2023, ApJ, 957, L3, doi: 10.3847/2041-8213/ad0158
- Reis & Miller [2013] Reis, R. C., & Miller, J. M. 2013, ApJ, 769, L7, doi: 10.1088/2041-8205/769/1/L7
- Shen et al. [2020] Shen, X., Hopkins, P. F., Faucher-Giguère, C.-A., et al. 2020, MNRAS, 495, 3252, doi: 10.1093/mnras/staa1381
- Steffen et al. [2006] Steffen, A. T., Strateva, I., Brandt, W. N., et al. 2006, AJ, 131, 2826, doi: 10.1086/503627
- Stone et al. [2023] Stone, M. A., Lyu, J., Rieke, G. H., & Alberts, S. 2023, ApJ, 953, 180, doi: 10.3847/1538-4357/acebe0
- Übler et al. [2023] Übler, H., Maiolino, R., Curtis-Lake, E., et al. 2023, A&A, 677, A145, doi: 10.1051/0004-6361/202346137
- Ueda et al. [2014] Ueda, Y., Akiyama, M., Hasinger, G., Miyaji, T., & Watson, M. G. 2014, ApJ, 786, 104, doi: 10.1088/0004-637X/786/2/104
- Yue et al. [2023] Yue, M., Eilers, A.-C., Simcoe, R. A., et al. 2023, arXiv e-prints, arXiv:2309.04614, doi: 10.48550/arXiv.2309.04614
- Zhang et al. [2023] Zhang, Y., Ouchi, M., Nakajima, K., et al. 2023, arXiv e-prints, arXiv:2306.07940, doi: 10.48550/arXiv.2306.07940