Simulations of galaxy cluster mergers with velocity-dependent, rare and frequent self-interactions
Abstract
Self-interacting dark matter (SIDM) has been proposed to solve small-scale problems in cosmology. In previous work, constraints on the self-interaction cross-section of dark matter have been derived assuming that the self-interaction cross-section is independent of velocity. However, a velocity-dependent cross-section is more natural in most theories of SIDM. Using idealized -body simulations, we study merging clusters, with velocity-dependent SIDM. In addition to the usual rare scattering in the isotropic limit, we also simulate these systems with anisotropic, small-angle (frequent) scatterings. We study the qualitative features of the mergers and we find that the effects of velocity-dependent cross-sections are observed when comparing early-time and late-time oscillation amplitude of the brightest cluster galaxy (BCG). Finally, we also extend the existing upper bounds on the velocity-independent, isotropic self-interaction cross-section to the parameter space of rare and frequent velocity-dependent self-interactions by studying the central densities of dark matter only isolated haloes. For these upper-bound parameters, we find that the offsets just after the first pericentre to be . On the other hand, because of BCG oscillations, we speculate that the distribution of BCG offsets in relaxed cluster to be a statistically viable probe. Therefore, this motivates further studies of BCG off-centering in cosmological simulations.
keywords:
astroparticle physics – methods: numerical – system: galaxy clusters – dark matter1 Introduction
Cold dark matter (CDM) is a fundamental component of the standard cosmology. It plays a vital role in explaining the formation of the large-scale structure of the universe and the anisotropies in the cosmic microwave background. While cosmological -body simulations within have successfully reproduced many observations of the large-scale structure, there seem to be discrepancies between observations and simulations on small scales (see. Bullock & Boylan-Kolchin (2017) for a review of the small-scale problems). A solution to the small-scale problems was proposed by Spergel & Steinhardt (2000) via a model of DM, where DM particles can non-gravitationally scatter off each other. Constraints on the self-interaction cross-section can be obtained by studying different astrophysical systems. In particular, relaxed galaxy clusters (e.g. Sagunski et al., 2021; Andrade et al., 2021) have provided the most stringent constraint on the cross-section. We also have constraints from galaxy cluster mergers (Randall et al., 2008; Harvey et al., 2015). For a review on astrophysical constraints on self-interacting dark matter (SIDM) see Adhikari et al. (2022).
Velocity-dependent anisotropic cross-sections are natural in most theories of SIDM (for a review of SIDM models see Tulin & Yu, 2018). Examples include light mediator models (Tulin et al., 2013; Ackerman et al., 2009), atomic DM (Cline et al., 2014), strongly interacting DM (Boddy et al., 2014). Moreover, velocity-dependent cross-sections are also well motivated observationally. Most constraints on the self-interaction cross-section per unit mass of DM particle ( in the literature, have been derived assuming velocity-independent and isotropic scattering. For example, Sagunski et al. (2021) quote an upper limit of at cluster scales and at group scales. On the galactic scales, Ren et al. (2019) find that in the range, is required to explain the observed diversity in the rotation curves in the SPARC dataset. Similarly, Sankar Ray et al. (2022) quote an upper-bound of . At the scale of dwarf galaxies, there is no concrete upper bound on the cross-section. A cross-section with is favoured by the observed central densities of Milky Way’s dwarf spheroidal galaxies (Correa, 2021). Elbert et al. (2015) find that can be as large as at these scales and still be consistent with observations. These considerations highlight the viability of velocity-dependent cross-sections.
Observationally probing the angular dependence is a daunting task. One reason being that the effects of angular dependence are not strong enough when studying the evolution of systems that do not have a preferred direction. For example, Robertson et al. (2017b); Fischer et al. (2021) simulated isolated haloes using -body simulations and found that there is no big difference in the evolution of core-sizes between isotropic and anisotropic cross-sections for a given choice of parameters. Moreover, simulating differential cross-sections which peak for tiny scattering angles, using conventional SIDM implementations (e.g. Rocha et al., 2013) is prohibitively expensive. This type of interaction will be called frequent self-interactions (as introduced in Kahlhoefer et al. (2014)) as opposed to rare self-interactions corresponding to large-angle scattering. Frequently self-interacting dark matter (fSIDM) is natural in the massless mediator limit of light mediator models. The scattering of DM particles in this regime can be modelled as a drag force, where the drag force depends not on the total cross-section but on the momentum transfer cross-section given by Kahlhoefer et al. (2017); Robertson et al. (2017b)
| (1) |
Frequent self-interactions have previously been studied by Kahlhoefer et al. (2014); Kummer et al. (2018, 2019); Fischer et al. (2021, 2022) assuming velocity independence.
Mergers of galaxy clusters are interesting test beds for models of SIDM since the mass distribution of the system could be measured through lensing. The gas and galaxies can be probed through their direct emission in various wavelengths. The existence of offsets between the DM component and galaxies may hint at DM self-interactions (Randall et al., 2008). Moreover, mergers are sensitive to both velocity and angular dependence of the scattering cross-section. Firstly, as the haloes undergo many pericentre passages, the collisional velocity changes with time. Scattering velocities are the largest at the first pericentre passage and, subsequently, the haloes slow down with every passage. The self-interactions at the pericentre passages are mainly responsible for an increase in the offset. Thus, the evolution is sensitive to the parameters of velocity-dependent cross-section. Secondly, mergers unlike isolated haloes also have a preferred direction, i.e. the merger axis. Fischer et al. (2022) find that offsets are larger for frequent self-interactions with a given , when compared to rare self-interactions of the same . They also showed that small-angle scattering can produce larger offsets than the maximal possible offset from isotropic scattering.
There have been earlier studies that have simulated mergers. For example, studies with velocity-independent isotropic cross-sections have been done by Kim et al. (2017) who simulated equal-mass mergers ; Robertson et al. (2017a) simulated a bullet cluster like system. Fischer et al. (2021, 2022) studied equal and unequal-mass mergers with, both, isotropic and anisotropic velocity-independent cross-section. Robertson et al. (2017b) looked at mergers until just after the first pericentre passage. They used velocity-dependent isotropic cross-section and a velocity-dependent cross-section that corresponds to Yukawa scattering under the Born approximation. It is unknown as to how the merger evolution is affected at late stages by velocity-dependent self-interactions. Similarly, mergers in the fSIDM regime with velocity dependence are yet to be studied.
In this work, we aim to (i) study the qualitative differences in merger simulations between velocity-dependent and independent cross-sections, (ii) extend the upper bound on constant cross-section quoted by Sagunski et al. (2021) to the parameter space of velocity-dependent cross-section, (iii) find the maximum offsets between DM and the brightest cluster galaxy (BCG) with velocity-dependent cross-section parameters that are consistent with upper bound parameters. To this end, we simulate the full evolution of galaxy cluster mergers and isolated haloes with, both, rare and frequent self-interactions. In a companion paper (Fischer et al., prep), cosmological simulations are studied with velocity-dependent fSIDM. The paper is presented as follows. In section 2 we briefly describe our numerical scheme and the SIDM models that are considered. In section 3 we present our simulation results, which illustrate the qualitative differences between velocity-dependent and velocity-independent cross-section simulations. In section 4, we describe the simulations of mergers with cross-section parameters that correspond to the 95% C.L. limits provided in Sagunski et al. (2021). In section 5, we summarize our results and conclude. Additional details are provided in the appendices A and B.
2 Methods
In this section, we describe the numerical setup of our simulations and we discuss our choice for the self-interaction cross-section that is used in the simulations.
2.1 Numerical method
For our simulations, we use the cosmological -body simulation code gadget-3, adapted for frequent self-interactions using the implementation given in Fischer et al. (2021). In this section, we briefly describe the implementation of, both, rare and frequent self-interactions. The numerical scheme for the self-interactions of rarely self-interacting dark matter (rSIDM) follows Fischer et al. (2021), which is similar to the method described in Rocha et al. (2013). In this scheme, the probability that a numerical particle with mass scatters off another numerical particle with mass is given by,
| (2) |
where is the relative velocity between the numerical particles , , is the time step used in the simulation, is the kernel overlap integral, is the total cross-section per unit mass of DM particle. For more details on the implementation and the choice for the kernel, see appendix A and B of Fischer et al. (2021). A collection of kernels used in other modern implementations of SIDM within body simulations can be found in Adhikari et al. (2022, eq. 11-15).
The drag force of frequent self-interactions is based on the relation derived in Kahlhoefer et al. (2014), which describes the deceleration rate experienced by a particle as it travels through a constant background density of DM,
| (3) |
is the velocity of the particle, is the background density, is the momentum transfer cross-section defined in equation (1). We can also see that the deceleration rate captures the rate of change of the parallel component of the velocity. Therefore, the above expression can then be cast into an expression for drag force for the physical particles. The drag force as experienced by the numerical particles in the -body code is given as (Fischer et al., 2021),
| (4) |
which is proportional to the momentum transfer cross-section .
The implementation of the velocity-dependent self-interactions into the SIDM module has been described in detail by Fischer et al. (prep). To ensure numerically stable results, a novel time-step criterion has been added. This criterion is based on the velocity at which self-interactions are strongest, i.e. on the maximum of , instead of the velocity distribution that an individual particle encountered in the previous time step. In principle, such a scheme guarantees that the simulation time step is always sufficiently small to account for for any .
2.2 Initial conditions and simulation parameters
In this work, we simulate, both, DM-only isolated haloes and galaxy cluster merger with two different merger mass ratios (MMR). Firstly for the isolated DM-only haloes, they have a virial mass of and are initialized with an NFW density profile Navarro et al. (1996), i.e.
| (5) |
DM positions are sampled from a probability density function such that the density profile follows the NFW profile. Given the virial mass of the halo and the critical density , of the universe, the parameters of the NFW profile are determined as follows: (i) the concentration parameter, , is determined using the concentration-mass relation given in Dutton & Macciò (2014), (ii) characteristic density is computed using from the earlier step (using Eq.2 of Navarro et al., 1996), (iii) scale radius is computed using its definition . The NFW parameters thus obtained are given in Table 1. Using the resulting density profile, the initial velocity dispersion is obtained by integrating the Jeans equation (Binney & Tremaine, 2008). Then, initial velocities in each radial bin are drawn from a Gaussian distribution with the variance . The isolated DM halo simulations use the same NFW parameters as the main halo of the merger for initial conditions (ICs). We simulate mergers with MMR . The barycentre of the clusters are initially apart and they are put on course towards each other with a relative velocity of as summarized in Table 2.
In the galaxy cluster used in the merger simulations, the cluster has three particle species: DM, galaxy and BCG. Galaxies and BCG are approximated to be collisionless, while DM is collisional with self-interaction characterized by its cross-section. An equal number of DM and galaxy particles is used in the simulation. A sufficient number of galaxy particles are chosen to ensure that it is easier to find the peak position of the galaxies. The main halo has a virial mass of and both species initially follow an NFW profile. The particle masses are as follows: for DM, , for galaxies, . In addition, the brightest cluster galaxy (BCG) is represented by a single particle at the centre of the halo with a mass . As the BCG is approximated to be a point particle, the effects of gravitational scattering become strong if the mass is large, therefore the BCG particle is taken to be less massive than the observed BCGs. This choice is adopted from earlier studies (e.g. Fischer et al., 2022; Kim et al., 2017). We use a fixed gravitational softening length of = for all particles. For, both, mergers and isolated haloes we use an adaptive kernel size for the DM self-interactions, such that the number of neighbours within each particles’ kernel, is equal to 64. This choice follows from Fischer et al. (2021).
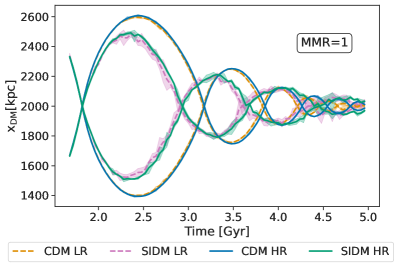
All simulations have been performed with a resolution of particles. For certain cross-section parameters, the simulations were rerun at a higher resolution of particles to validate the lower resolution runs (see Appendix A).
| M | ||||
|---|---|---|---|---|
| 1009878 | 1 | |||
| 194.76 | 181319 | 1 |
| Merger mass ratios | ||
|---|---|---|
2.3 Dark matter cross-section model
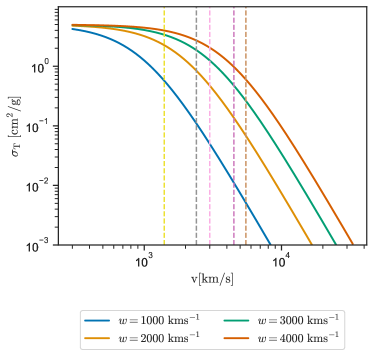
We assume a fairly generic form for the self-interaction momentum transfer cross-section for rare and frequent self-interactions, parameterized as follows (Gilman et al., 2021; Yang et al., 2023),
| (6) |
where is the relative velocity of the DM particles. We furthermore assume that the total cross section has the same velocity dependence as the momentum transfer cross section, such that
| (7) |
This assumption is automatically satisfied if the differential cross-section is a separable function, i.e. it is of the following form,
| (8) |
where is a normalization constant, captures the angular dependence and . However, even for non-separable cross-sections, such as Rutherford scattering, the assumption in equation (7) gives a useful approximation.
Depending on the choice of and , the above cross-section can correspond to either frequent or rare self-interactions. In this work, we consider isotropic scattering for the case of rare self-interactions, such that is simply a number. The total cross-section to calculate the scattering probability in equation (2) is then given by , see equation (1). For frequent self-interactions, on the other hand, is strongly peaked for small angles. The normalization, , is then chosen such that the momentum transfer cross-section given in equation (6) is recovered, which is used in the simulations to compute the drag force experienced by the particles, see equation (4).
For the rest of the paper, the term cross-section will always refer to the momentum transfer cross-section, , unless specified otherwise. To run the simulations, the parameters and must be chosen, where . In this paper, we are interested in studying the qualitative differences in the evolution of galaxy cluster mergers between the different regions of parameter space. A priori, it is conceivable that there are degeneracies in this parameter space, such that different parameter combinations lead to very similar merger observables. Such a degeneracy was found by Yang et al. (2023) (see their figure 8) when analysing the rotation curve of LSB dwarf galaxy UGC 128 and found a degeneracy. In other words, it was possible to compensate a change in by an appropriate change in . We refer to a prescription to determine the cross section normalisation for a given velocity dependence (determined by ) as matching. In the following, we will explore different matching procedures.
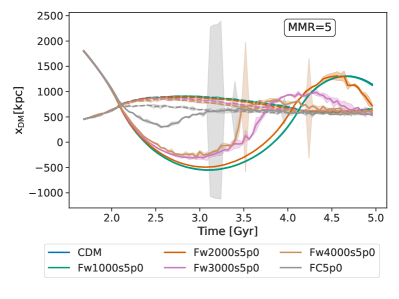
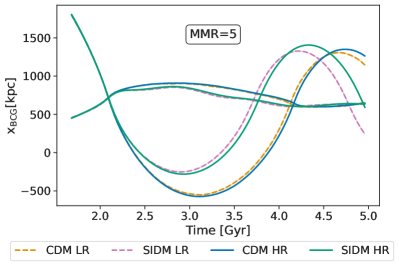
The choice for follows from the typical relative velocity scales. These scales can be estimated by running CDM simulations. The observed values are displayed as dashed lines in Figure 1. The largest observed scales are the relative velocities of the infalling BCGs shown as the last two lines corresponding to MMR 5,1 respectively. The average scattering velocity with which DM particles scatter off each other, within around the barycentre at the first pericentre passage, is shown in grey (MMR = 5) and pink (MMR = 1) colours. Finally, the average relative velocity within a particular halo is given in yellow and it is approximately . This implies that for any value of larger than , the self-interactions within the halo will be in the weakly velocity-dependent regime. Therefore, the following choice for is made, .
We have analysed cluster mergers with chosen according to two matching procedures: The first is to choose the same value of for all chosen values of , the second is to choose such that the evolution of the central density of the isolated haloes for different values of is similar. These procedures will be explained further in the following sections.
2.4 Analysis Methods
In order to find the peak position of any component, i.e. DM, or galaxies, we use the peak finding method based on the gravitational potential, see Fischer et al. (2022). In the simulations, all particles have a unique particle ID assigned to them. Using the ID, particles belonging to a given halo can be identified. Then, the gravitational potential in each cell in a grid is computed. The cell with the lowest potential corresponds to the position of the peak. Fischer et al. (2022) also propose the isodensity-based peak finding algorithm. In this algorithm, the peaks are identified as the cell in the merger plane with the highest projected density. This method is closer to observations where, for example, gravitational shear measurements can be used to infer mass densities. We find that gravitational potential based peak finding is more reliable when the simulation is run with low resolution. Hence, this is our choice for finding peaks. To find the errors on the peak position, we bootstrap the particle distribution 20 times and determine 20 such peaks. Then we estimate the error, by finding the standard deviation in the obtained peak positions.
We define offsets as the distance between the peaks of two different species of the same cluster. For example, is the distance between the DM and BCG peak of a given cluster.
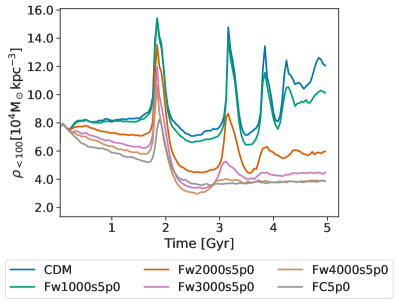
3 Varying only
In this scheme, the same value of is used for different values of the parameter . Even though it is a very simple choice, it is easier to observe the qualitative difference introduced by velocity-dependent cross-sections. To make the differences stand out, we use a large value of . We confirmed the results to be qualitatively similar but less pronounced for smaller values of . The names for the individual runs shown in the plots are tabulated in Table 3.
| Simulation name | ||
|---|---|---|
| [] | [] | |
| FC5p0 | 5 | |
| Fw1000s5p0 | 5 | 1000 |
| Fw2000s5p0 | 5 | 2000 |
| Fw3000s5p0 | 5 | 3000 |
| Fw4000s5p0 | 5 | 4000 |
.
3.1 DM peak position
The plots of the peak positions of DM against time for equal and unequal-mass mergers are given in Figure 2. The peaks of the main halo are marked by dotted lines, while those of subhalo are indicated by solid lines. Firstly, we observe that for constant cross-sections, the drag force from self-interaction is strong enough to stop the DM component in their tracks and they coalesce at the first pericentre passage. For the same , the DM peak positions in the velocity-dependent SIDM runs are closer to the CDM run for smaller values of . This observation matches our expectation that for fixed , increasing increases the effective self-interaction strength.
The separation of the peaks at the first apocentre is largest for CDM and decreases with increasing self-interaction strength. This can be attributed to the fact that DM particles experience a drag force and thus stay closer to the centre-of-mass of the system.
The first pericentre passage occurs at different times for different parameter combinations. Albeit being a small effect, self-interactions tend to increase the time taken to reach the first pericentre passage. Then the second passage occurs earlier for increasing self-interaction strength. For example, we see that the first pericentre passage occurs slightly later for the constant cross-section one. This could be understood as self-interactions generating pressure that resists the infall, thus slowing the halo down. The difference is large for constant cross-section because the effective self-interaction strength of the velocity-dependent ones is much smaller than the constant cross-section one at early stages, as is small for .
At later stages of the evolution, the scenario changes. For example, at the third apocentre, we see that the oscillation in the DM peak for has an amplitude that is greater than that of CDM. At late stages, the oscillation amplitude is smaller for all the cases that we have simulated and the dark matter peaks are closer. That is, at late stages, the dark peaks spend more time within about the barycentre. During these stages, the central density of the haloes are lower for SIDM simulations since the average scattering velocity of DM particles decrease with time. Therefore, the oscillation within the are less dampened by dynamical friction for SIDM simulations.
For the unequal-mass mergers, the subhalo dissolves faster, making it difficult to identify the DM peaks during later stages of the evolution. Both, equal and unequal mass mergers have identical initial separation and initial relative velocity Therefore, in unequal mass merger, the less massive cluster traverses more distance than the massive one and this leads to fewer oscillations. For instance, in Figure 2, we see that within 5 billion years, the subhalo in MMR:5 system has undergone fewer pericentre passages than the equal-mass merger.
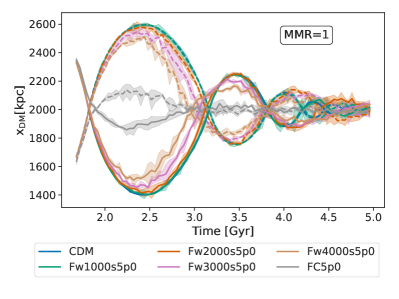
3.2 BCG peak position
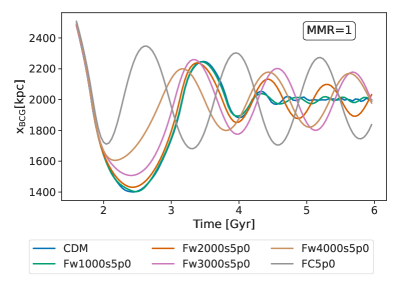
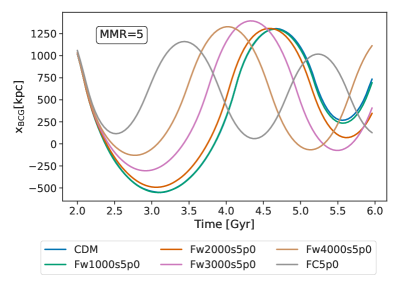
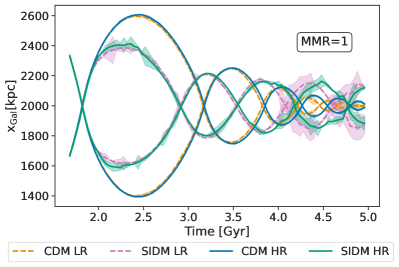
The BCG positions for subhaloes are given in Figure 3, the upper panel corresponds to the equal-mass merger system, while the lower panel corresponds to the unequal-mass merger. The main feature of BCG oscillations is that they oscillate for longer periods of time in simulations with SIDM compared to CDM. This general feature has already been observed in earlier work (Fischer et al., 2022, 2021; Kim et al., 2017). This could be explained by noting that the merger remnants have a cored density distribution at the centre owing to the self-interactions. On the other hand, merger remnants in CDM simulations have larger central densities. As a result, the oscillations dampen out faster in CDM due to dynamical friction.
In the equal-mass merger, we observe that the peak positions of subhalo BCGs are closer to the CDM for smaller values of at the early stages of the merger evolution. At later stages, around 5 billion years, the BCG oscillations in the CDM simulation have dampened considerably. On the other hand, the oscillations approximately stay constant for the constant cross-section simulation for the period billion years, as shown in Figure 3. The position of the BCG in velocity-dependent simulations start deviating from CDM with time. For example, let’s consider the simulation, (i) we see that the curve is initially close to the CDM simulation (ii) during the period billion years the oscillations have approximately a constant amplitude and they have significantly deviated from the CDM simulation. This can be understood by looking at the typical velocities of the system at various stages of the evolution. The haloes have a larger relative velocity initially when compared to later stages. Therefore, from Figure 1 we see that for and , the cross-section is less than , whereas for the cross-section is larger than . Thus, merger remnants experience larger self-interactions at later stages, leading to more cored distributions and lesser dynamical friction. Cumulatively, this leads to steady oscillations at later stages.
The distance travelled by the BCGs at the first apocentre is observed to become smaller with increasing values of . This can be understood by looking at the DM peaks. For example, the DM haloes coalesce at the first pericentre passage for the constant cross-section simulation. As a result, the BCG experiences a larger gravitational force due to the coalesced DM distribution at the barycentre. This accumulation of DM at the barycentre reduces with decreasing since the average interaction strength reduces with . This effectively leads to smaller amplitudes at the first apocentre in, both, equal and unequal-mass mergers. Immediately after the second pericentre passage, the amplitude of the velocity-dependent SIDM and CDM curves have decreased significantly due to dynamic friction. While for the constant cross-section, the DM peaks have come to rest and the merger remnants start coring. This leads to the persistence of the BCG oscillation amplitude.
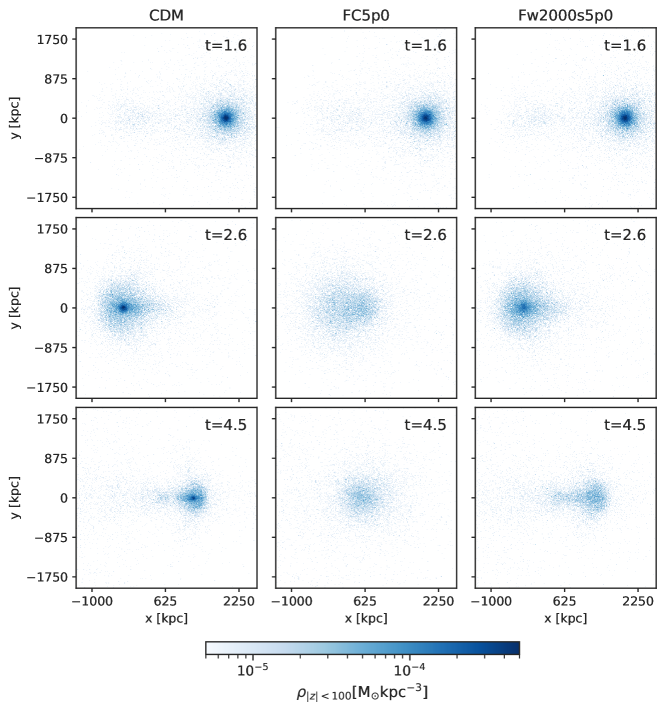
3.3 Morphology
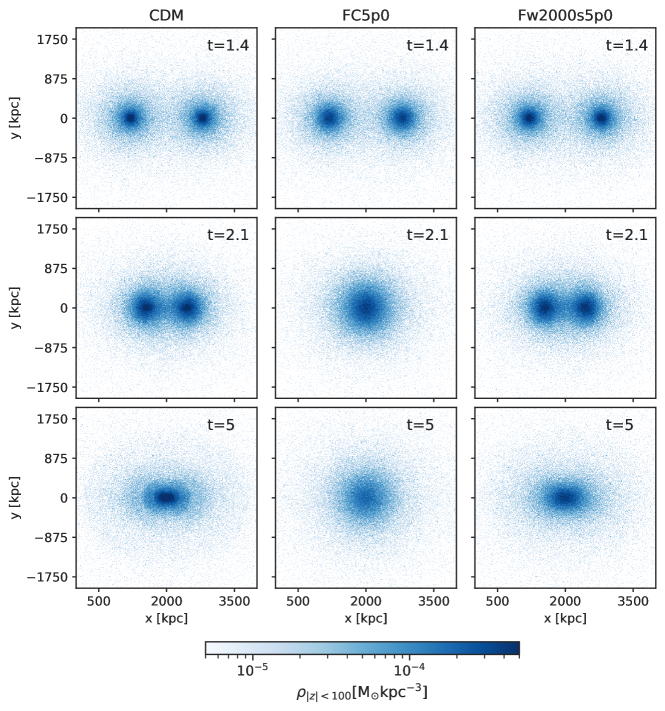
In Figure 4, we show the physical density of DM within the slice is projected on the merger plane. There are three columns, each correspond to a DM model and each row corresponds to a particular simulation time. First we look at time , before the first pericentre passage. Both haloes in the constant cross-section simulation (column 2) have lower central densities than in the CDM (column 1) and velocity-dependent simulations (column 3). The second row shows results at a time , which is just after the first pericentre passage. Owing to the large self-interaction strength, the haloes in the constant cross-section simulation have coalesced, while for CDM and velocity-dependent self-interactions the DM haloes pass through each other. At later stages, , the merger remnant in the constant cross-section simulation has a lower central density. While for the velocity-dependent simulations, the effects of velocity-dependence slowly becomes relevant as the system slows down. Thus, this leads to more cored distribution at the centre of the merger remnant when compared to the one from CDM simulation. This feature essentially leads to the persistent BCG oscillations at late stages. In Figure 4 we have a similar plot displaying only the subhalo’s projected density for MMR:5. Independent of the self-interaction cross-section, the subhaloes are observed to evaporate with time. With self-interactions, the evaporation is more pronounced. At , the subhalo experiencing constant cross-section has its core dissolved significantly and come to rest, for CDM the core has remained relatively intact. Finally, in the velocity-dependent simulation the core has dissolved, but the merger remnant seems to be oscillating even at these stages. In addition, in the CDM simulation we see shell-like features. These features are missing in the constant cross-section simulation since the haloes have coalesced.
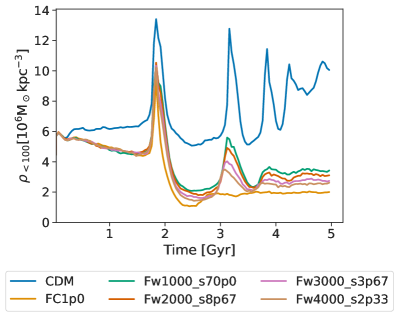
4 Central Density matched cross-section
In this section, we explore a more refined matching procedure based on simulations of isolated haloes. In this matching scheme, parameters are chosen such that different parameter combinations lead to similar central density evolution. We will refer to parameters matched according to this scheme as CD-matched. To avoid performing multiple simulations to find the matched parameter set, we make use of the self-similar nature of the gravothermal fluid equations of an isolated halo (Balberg et al., 2002; Essig et al., 2019). This allows us to obtain the central density evolution without running a suite of simulations. In Balberg et al. (2002), they assume that the cross-section is velocity independent. In order to illustrate the rescaling, consider two constant cross-section parameters . Then, the central density evolution obeys the following scaling relation:
| (9) |
where correspond to the evolution time of the isolated haloes simulated with parameters .
Velocity-dependent cross-sections contain two parameters and it is not immediately clear how the central densities can be rescaled. Yang & Yu (2022) propose an effective cross-section to model the halo evolution. For a differential cross-section , the effective cross-section is given by
| (10) |
In the expression given above, is the relative velocity of DM particles, is the characteristic velocity dispersion of the halo. Yang & Yu (2022) show that the evolution of central density in a simulation with the differential cross-section can be mimicked by a constant cross-section simulation with the same . They also note that the equivalence holds well when the halo is in short-mean-free-path regime. In the long-mean-free-path regime, does not capture the effects of self-scattering accurately. However, it provides a reasonable approximation to the halo evolution. Therefore, we extend the rescaling procedure given in equation (9) to any differential cross-section by using the corresponding effective cross-section .
Integrating the angular part of equation (10), we get
| (11) |
where,
| (12) |
is the viscosity cross-section.
Thus, for a given , . In other words, rescaling by is equivalent to rescaling by for the same . We verify this method by performing tests with some parameter combinations, see Appendix B.
In order to find the value given a , such that the evolution of the central density matches that of a target simulation with parameter set, we follow the procedure given below.
-
1.
Simulate an isolated halo with the target parameter set. Find the evolution of the central density from the simulation snapshots.
-
2.
Simulate an isolated halo with the parameter set , followed by the estimation of the evolution of central density, from the simulation data.
-
3.
To obtain the evolution corresponding to the parameter set , rescale the time axis of the simulation A, i.e.,
(13) -
4.
Repeat the previous step with different values of until matches .
Thus, we have obtained the CD-matched for the given .
To make a guess for the value of for one of our chosen values of , we solve,
| (14) |
To this end, we need a value for . In Yang & Yu (2022), they propose to use the velocity dispersion in the central region of the halo at the maximal core expansion stage for the characteristic dispersion . Using semi-analytic modelling, Outmezguine et al. (2023) show that the 1D velocity dispersion is at the maximal core expansion phase. Using for our NFW parameters, we find . On the other hand, we observe in our simulations. Thus, we find consistency between our simulations and the semi-analytic result.
We calculate the initial guess for rare self-interactions and use the same for frequent self-interactions. For this calculation, we use the differential cross-section given in subsection 2.3.
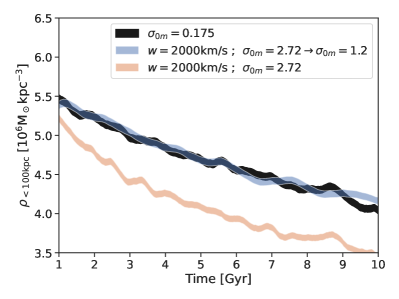
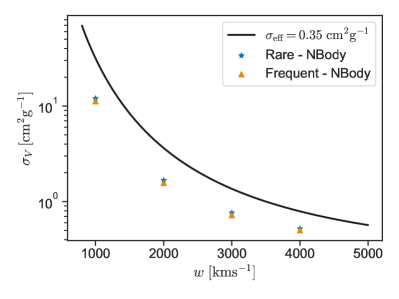
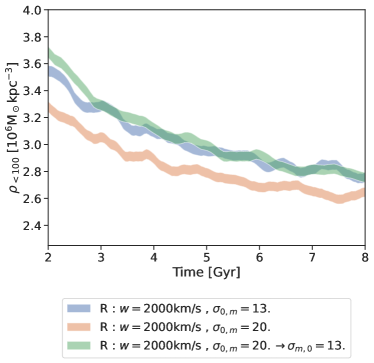
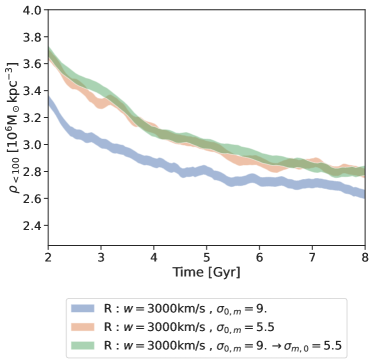
We choose the target set to correspond to the values quoted in Sagunski et al. (2021). They quote a 95% upper bound on the total cross-section of , assuming isotropy and velocity independence. Therefore, this value translates to for rare self-interactions (because ). In other words, we choose the target set . In Figure 6, we show an example for the matching procedure in detail. The black band corresponds to the target central density of constant cross-section with . The orange band corresponds to a simulation with . This value for is our initial guess calculated using equation (14). After rescaling by trial and error, the desired value of is found to be . This procedure can be extended to all chosen values of and the obtained results are tabulated in Table 5. The inferred values of at different values of can then be used to calculate the corresponding viscosity cross-section . This is shown in Figure 7. The orange triangles, and blue stars represent the values of , obtained using the inferred values of from -body simulations for rare and frequent self-interactions, respectively. Similarly, the solid line corresponds to the calculated from the values of inferred by solving equation (14). The fact that the results obtained from , -body simulations are different can be attributed to the fact that the isolated halo is in the long-mean-free-path regime. This was already noted in Yang & Yu (2022).
The evolution of an isolated halo has a feature that, as long as it is in the core expansion phase, at any given time the central density is monotonically decreasing with . This implies that for a given value of , and at a given time in the evolution of the halo, core-size is larger for larger values of . Sagunski et al. (2021); Andrade et al. (2021); Eckert et al. (2022) constrain using the observed core-size in clusters. Hence, for every value of , there is a value of that produces core sizes, or central densities, similar to the current upper bound. Increasing any further would increase the core size to values larger than what is observed. Thus, this matching procedure can be used to extend the bounds from constant cross-section to different values of .
When matched using or central density evolution, we observe that the ratio between the ’s of rare and frequent is approximately 0.64 at every chosen values of . This can be understood from the definition of . From equation (11), we have for any , for rare self-interactions,
| (15) | ||||
| (16) |
Here, . Now from equation (6), for rare self-interactions we have , which implies that
| (17) |
For frequent self-interactions, we consider a differential cross-section of the form given in equation (8) with the function having support only for values of close to 0. A simple choice for is a step-function that is non-zero in the interval , where is some small number. Therefore, is given as
| (18) | ||||
| (19) |
where in the second equality we have Taylor-expanded and retained only the leading order in in the angular integrand. Similarly, for the momentum transfer cross-section we have
| (20) | ||||
| (21) |
Thus, for frequent self-interactions, we have
| (22) |
Now for matching with or the central density we require . Upon using equation (17) and equation (22), this requirement leads to the matching condition as seen in Table 5.
4.1 Central density matched simulations – qualitative features
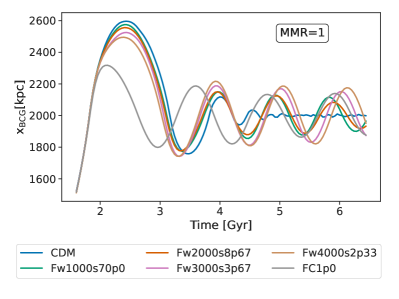
In this subsection, we look at the qualitative differences in mergers when parameters are chosen according to the central density matching procedure. Again, as in section 3, we only simulate frequent self-interactions. We choose the target set to be , the matched parameters are given in Table 4. For brevity, we show only the BCG oscillations in Figure 8. We see that the BCG oscillations of velocity-dependent simulations all have similar amplitudes at early stages. Only at a later stages they start to deviate. This similarity stems from the fact that the parameters are CD-matched. Similar to what was explained in subsection 3.2, at early times the DM particles have a large relative velocity. As a result, most of the velocity-dependent cross-sections have a small effective self-interaction strength. At later stages, the system slows down and and the effective self-interaction strength increases. In addition, the internal evolution around a DM peak is similar for all the cross-section parameters chosen, since they are CD-matched. See appendix C for the evolution of the central density of the main halo.
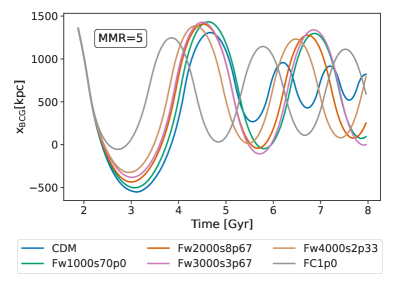
| Label | ||
|---|---|---|
| 1000 | 70.0 | Fw1000s70p0 |
| 2000 | 8.67 | Fw2000s8p67 |
| 3000 | 2.33 | Fw3000s2p33 |
| 4000 | 3.67 | Fw4000s3p67 |
| 1.0 | FC1p0 |
4.2 Central density matched upper bound simulations
In the previous subsection, the conservative upper bounds were obtained using the central density matching scheme. Values are tabulated in Table 5. We run merger simulations for this set of parameters and estimate the offsets . For velocity-independent cross-sections up to , Fischer et al. (2021) found that the DM-BCG and DM-Galaxy offsets increase with increasing values of . By running merger simulations at the upper bound values of the cross-section parameters, we estimate the order of magnitude of the largest possible offsets allowed by current bounds.
| Frequent | Rare | |||
| Label | Label | |||
| 1000 | 5.6 | Fw1000s5p6 | 9.0 | Rw1000s9p0 |
| 2000 | 0.78 | Fw2000s0p78 | 1.25 | Rw2000s1p25 |
| 3000 | 0.36 | Fw3000s0p36 | 0.57 | Rw3000s0p57 |
| 4000 | 0.25 | Fw4000s0p25 | 0.39 | Rw4000s0p39 |
| 0.11 | FC0p11 | 0.175 | RC0p175 | |
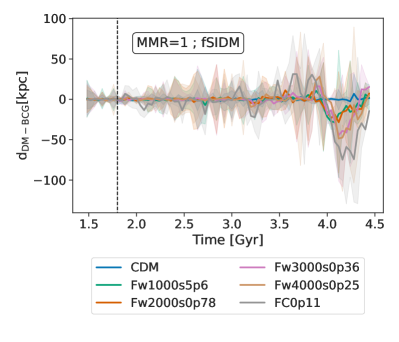
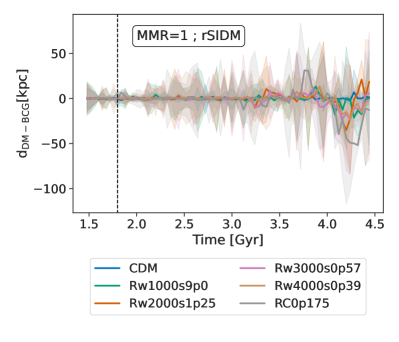
In Figure 9, we show the DM-BCG offset at the first pericentre passage for the equal mass merger. The offset is , while the offsets after the third pericentre passage ( billion years) start increasing. The effective self-interaction strength is not large enough to produce an observable offset at the first pericentre. Hence, it might be difficult to find such an offset in real observations. We do not show the offsets for unequal mass merger because, the offsets just after the first pericentre are smaller than the ones of equal mass merger. In addition, at later stages due to the evaporation of halo, we do not have reliable peak positions. We can also see from Figure 9 that the offsets produced by fSIDM are larger than that of rSIDM, and this is due to the fact that mergers are sensitive to the angular dependence.
5 Conclusions
In this section, we first discuss the assumptions made in the paper before we conclude.
The first assumption that we make is that we use idealised initial conditions. Still, it is informative to study them to find the appropriate features to look out for in more realistic simulations and observations. One example is the amplitude of BCG oscillation at late stages, which is seen to depend on the velocity-dependent cross-section parameters. Therefore, it is instructive to simulate cosmological boxes with velocity-dependent cross-section at higher resolution in order to estimate the distribution of DM-BCG offsets. Later, this could be compared to observations (e.g. Cross et al., 2023; Lauer et al., 2014). For example, Harvey et al. (2019) studied the DM-BCG offsets in the BAHAMAS–SIDM suite of cosmological simulations and placed constraints on assuming velocity-independent isotropic SIDM.
In addition, we have modelled the BCG and galaxies as collisionless point particles. A more realistic treatment of BCG’s could change the oscillation pattern. Furthermore, we neglect the effect of galaxies having their own DM halo (Kummer et al., 2018). In reality, approximately 10% of the mass of clusters is made up by the intracluster medium (ICM), which is not included in our simulations. Merger studies that include the ICM, such as Robertson et al. (2017a), find that the DM-galaxy offset is not significantly affected by the presence of the ICM. Fischer et al. (2023) also finds similar results. Therefore, we argue that the absence of an ICM component does not affect most of our conclusions.
As mentioned in subsection 2.3, we have assumed that the angular and velocity dependence of the differential cross-sections can be separated into two functions. This assumption has to be dropped when dealing with realistic SIDM models (Tulin et al., 2013; Feng et al., 2009). There are other SIDM models leading to different effects that are not included in our studies. For example, in addition to elastic scattering, inelastic scattering could be included (O’Neil et al., 2023). We leave the study of such models to future work.
On the observation side, all observed DM-BCG offsets are inferred to be just after pericentre passage and have uncertainties that make them consistent with zero (Bradač et al., 2008; Dawson et al., 2012; Dawson, 2013; Jee et al., 2014; Jee et al., 2015). Similarly, estimating DM-galaxy offsets are difficult due to shot noise arising from the smaller galaxy count. In our simulations we had galaxy particles, but in reality we observe at most of them. On the other hand, Lauer et al. (2014) find a median offset of , with the offset measured between BCG and cluster centre, the latter being identified by X-ray observations. Their sample comprised 433 BCGs that are located in Abell galaxy clusters. The DM-BCG offset distribution could be compared to predictions of cosmological simulations. Overall, the situation with observations is expected to improve with forthcoming surveys, such as SuperBIT (Romualdez et al., 2016) and Euclid (Laureijs et al., 2011).
In this paper, we have simulated idealized, isolated haloes and galaxy cluster mergers with equal and unequal merger mass ratios with velocity-dependent, frequent and rare self-interactions. Mergers are interesting astrophysical probes since the system is sensitive to self-interaction cross-sections with, both, angular and velocity dependencies. Therefore, we focused on understanding the qualitative effects that arise from velocity dependence in mergers. On the quantitative side, we also investigate the maximum offsets that can be observed given the current bounds on .
-
•
Independent of the matching procedure used in the paper, the effects of velocity-dependent cross-sections can be observed on galaxy cluster mergers by comparing the early time and late time oscillations of BCG. In particular, the degeneracy in the cross-section parameters when studying the evolution of central density in isolated haloes is broken when studying mergers. This is due to the fact that the relative velocities of the merging clusters change with time.
-
•
The evolution of central densities of isolated haloes are similar between rare and frequent self-interaction, when the momentum transfer cross-section of fSIDM is chosen to be of rSIDM. The factor 2/3 follows from matching the angular dependence of fSIDM and rSIDM with viscosity cross-section, as seen in Figure 7.
-
•
We extend the existing upper bounds on the constant cross-section to the parameter space of velocity-dependent, rare and frequent self-interactions.
-
•
In the equal-mass merger simulations with upper-bound cross-section parameters, we find that the offsets after the first pericentre is approximately . In particular, the offsets are the largest in the constant cross-section simulation. As the system evolves further, offsets grow. After the third pericentre passage, due to the oscillations of BCG, and the galactic component the offsets are . Thus, mergers in their late stages are interesting to test and constrain SIDM.
Acknowledgements
We thank all participants of the Darkium SIDM Journal Club for helpful discussions. This work is funded by the Deutsche Forschungsgemeinschaft (DFG, German Research Foundation) under Germany’s Excellence Strategy – EXC 2121 “Quantum Universe” – 390833306, Germany’s Excellence Strategy – EXC-2094 “Origins” – 390783311 and the Emmy Noether Grant No. KA 4662/1-2. Preprint numbers: DESY-23-153, TTP23-043.
Data Availability
The data underlying this article will be shared on reasonable request to the corresponding author.
References
- Ackerman et al. (2009) Ackerman L., Buckley M. R., Carroll S. M., Kamionkowski M., 2009, PhRvD, 79, 023519
- Adhikari et al. (2022) Adhikari S., et al., 2022, Astrophysical Tests of Dark Matter Self-Interactions (arXiv:2207.10638)
- Andrade et al. (2021) Andrade K. E., Fuson J., Gad-Nasr S., Kong D., Minor Q., Roberts M. G., Kaplinghat M., 2021, MNRAS, 510, 54
- Balberg et al. (2002) Balberg S., Shapiro S. L., Inagaki S., 2002, ApJ, 568, 475
- Binney & Tremaine (2008) Binney J., Tremaine S., 2008, Galactic Dynamics: Second Edition. Princeton University Press
- Boddy et al. (2014) Boddy K. K., Feng J. L., Kaplinghat M., Tait T. M. P., 2014, PhRvD, 89, 115017
- Bradač et al. (2008) Bradač M., Allen S. W., Treu T., Ebeling H., Massey R., Morris R. G., von der Linden A., Applegate D., 2008, ApJ, 687, 959
- Bullock & Boylan-Kolchin (2017) Bullock J. S., Boylan-Kolchin M., 2017, ARA&A, 55, 343
- Cline et al. (2014) Cline J. M., Liu Z., Moore G. D., Xue W., 2014, PhRvD, 89, 043514
- Correa (2021) Correa C. A., 2021, MNRAS, 503, 920
- Cross et al. (2023) Cross D., et al., 2023, Examining the Self-Interaction of Dark Matter through Central Cluster Galaxy Offsets (arXiv:2304.10128)
- Dawson (2013) Dawson W. A., 2013, PhD thesis, University of California, Davis, https://ui.adsabs.harvard.edu/abs/2013PhDT.......211D
- Dawson et al. (2012) Dawson W. A., et al., 2012, ApJ, 747, L42
- Dutton & Macciò (2014) Dutton A. A., Macciò A. V., 2014, MNRAS, 441, 3359
- Eckert et al. (2022) Eckert D., Ettori S., Robertson A., Massey R., Pointecouteau E., Harvey D., McCarthy I. G., 2022, A&A, 666, A41
- Elbert et al. (2015) Elbert O. D., Bullock J. S., Garrison-Kimmel S., Rocha M., Oñorbe J., Peter A. H. G., 2015, MNRAS, 453, 29
- Essig et al. (2019) Essig R., McDermott S. D., Yu H.-B., Zhong Y.-M., 2019, PhRvL, 123, 121102
- Feng et al. (2009) Feng J. L., Kaplinghat M., Tu H., Yu H.-B., 2009, JCAP, 2009, 004
- Fischer et al. (2021) Fischer M. S., Brüggen M., Schmidt-Hoberg K., Dolag K., Kahlhoefer F., Ragagnin A., Robertson A., 2021, MNRAS, 505, 851
- Fischer et al. (2022) Fischer M. S., Brüggen M., Schmidt-Hoberg K., Dolag K., Ragagnin A., Robertson A., 2022, MNRAS, 510, 4080
- Fischer et al. (2023) Fischer M. S., Durke N.-H., Hollingshausen K., Hammer C., Brüggen M., Dolag K., 2023, MNRAS, 523, 5915
- Fischer et al. (prep) Fischer M. S., Kasselmann L., Brüggen M., Dolag K., Kahlhoefer F., Ragagnin A., Robertson A., Schmidt-Hoberg K., in prep., arXiv e-prints
- Gilman et al. (2021) Gilman D., Bovy J., Treu T., Nierenberg A., Birrer S., Benson A., Sameie O., 2021, MNRAS, 507, 2432
- Harvey et al. (2015) Harvey D., Massey R., Kitching T., Taylor A., Tittley E., 2015, Sci, 347, 1462
- Harvey et al. (2019) Harvey D., Robertson A., Massey R., McCarthy I. G., 2019, MNRAS, 488, 1572
- Jee et al. (2014) Jee M. J., Hughes J. P., Menanteau F., Sifón C., Mandelbaum R., Barrientos L. F., Infante L., Ng K. Y., 2014, ApJ, 785, 20
- Jee et al. (2015) Jee M. J., et al., 2015, ApJ, 802, 46
- Kahlhoefer et al. (2014) Kahlhoefer F., Schmidt-Hoberg K., Frandsen M. T., Sarkar S., 2014, MNRAS, 437, 2865
- Kahlhoefer et al. (2017) Kahlhoefer F., Schmidt-Hoberg K., Wild S., 2017, JCAP, 2017, 003
- Kim et al. (2017) Kim S. Y., Peter A. H. G., Wittman D., 2017, MNRAS, 469, 1414
- Kummer et al. (2018) Kummer J., Kahlhoefer F., Schmidt-Hoberg K., 2018, MNRAS, 474, 388
- Kummer et al. (2019) Kummer J., Brüggen M., Dolag K., Kahlhoefer F., Schmidt-Hoberg K., 2019, MNRAS, 487, 354
- Lauer et al. (2014) Lauer T. R., Postman M., Strauss M. A., Graves G. J., Chisari N. E., 2014, ApJ, 797, 82
- Laureijs et al. (2011) Laureijs R., et al., 2011, Euclid Definition Study Report (arXiv:1110.3193)
- Navarro et al. (1996) Navarro J. F., Frenk C. S., White S. D. M., 1996, ApJ, 462, 563
- O’Neil et al. (2023) O’Neil S., et al., 2023, MNRAS, 524, 288
- Outmezguine et al. (2023) Outmezguine N. J., Boddy K. K., Gad-Nasr S., Kaplinghat M., Sagunski L., 2023, MNRAS, 523, 4786
- Randall et al. (2008) Randall S. W., Markevitch M., Clowe D., Gonzalez A. H., Bradač M., 2008, ApJ, 679, 1173
- Ren et al. (2019) Ren T., Kwa A., Kaplinghat M., Yu H.-B., 2019, PhRvX, 9, 031020
- Robertson et al. (2017a) Robertson A., Massey R., Eke V., 2017a, MNRAS, 465, 569
- Robertson et al. (2017b) Robertson A., Massey R., Eke V., 2017b, MNRAS, 467, 4719
- Rocha et al. (2013) Rocha M., Peter A. H. G., Bullock J. S., Kaplinghat M., Garrison-Kimmel S., Oñorbe J., Moustakas L. A., 2013, MNRAS, 430, 81
- Romualdez et al. (2016) Romualdez L. J., et al., 2016, The Design and Development of a High-Resolution Visible-to-near-UV Telescope for Balloon-Borne Astronomy: SuperBIT (arXiv:1608.02502)
- Sagunski et al. (2021) Sagunski L., Gad-Nasr S., Colquhoun B., Robertson A., Tulin S., 2021, JCAP, 2021, 024
- Sankar Ray et al. (2022) Sankar Ray T., Sarkar S., Kumar Shaw A., 2022, JCAP, 2022, 011
- Spergel & Steinhardt (2000) Spergel D. N., Steinhardt P. J., 2000, PhRvL, 84, 3760
- Tulin & Yu (2018) Tulin S., Yu H.-B., 2018, PhR, 730, 1
- Tulin et al. (2013) Tulin S., Yu H.-B., Zurek K. M., 2013, PhRvD, 87, 115007
- Yang & Yu (2022) Yang D., Yu H.-B., 2022, JCAP, 2022, 077
- Yang et al. (2023) Yang S., Du X., Zeng Z. C., Benson A., Jiang F., Nadler E. O., Peter A. H. G., 2023, ApJ, 946, 47
Appendix A Validating lower resolution simulations
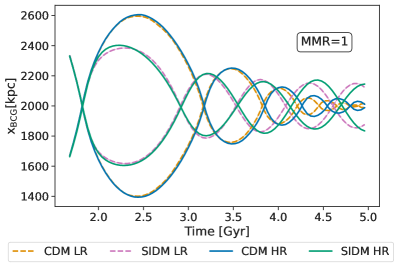
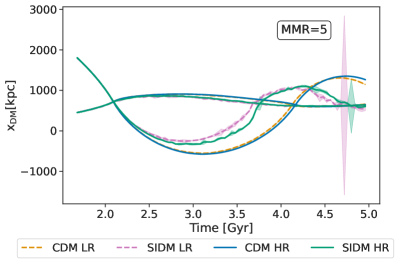
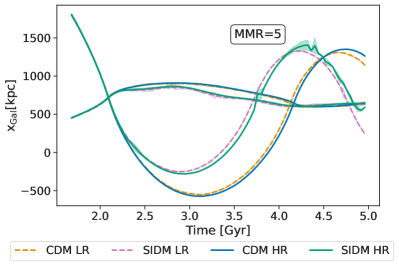
In this section, we compare the peak positions of DM, galaxy and BCG components between low resolution and high resolution simulations. The low- and the high-resolution simulation use the NFW parameters given in Table 1 for generating the haloes. The only difference being that the DM and galaxy particles in the high-resolution simulation have a resolution of particles instead of particles. Both of them also use the same initial conditions as given in Table 2. The DM component is simulated with and without self-interactions. For the SIDM case, we simulate with frequent self-interactions with a velocity-independent cross-section. The momentum transfer cross-section used in the simulations is . We observe that the peak positions evolve almost identically independent of the resolution up until 5 billion years. See Figure 10 and 11.
Appendix B Testing rescaling
We test the rescaling by for a given with rare self-interactions. Figure 12 shows the evolution of central density of an isolated halo for two values of , , in the left and right panel, respectively. For example, in the left panel, after rescaling of simulation by a factor 20/13, the evolution is similar to the simulation with .
Appendix C Central density evolution in Merger
In Figure 13, we show the evolution of the central density around the DM peak of the main halo. The curves correspond to simulations where the cross-section parameters are CD-Matched. Similarly, in Figure 14 we show the central densities for cases when the cross-section parameters have the same , but with varying .