Deep Learning based Systems for Crater Detection: A Review
Abstract
Craters are one of the most prominent features on planetary surfaces, used in applications such as age estimation, hazard detection, and spacecraft navigation. Crater detection is a challenging problem due to various aspects, including complex crater characteristics such as varying sizes and shapes, data resolution, and planetary data types. Similar to other computer vision tasks, deep learning-based approaches have significantly impacted research on crater detection in recent years. This survey aims to assist researchers in this field by examining the development of deep learning-based crater detection algorithms (CDAs). The review includes over research works covering diverse crater detection approaches, including planetary data, craters database, and evaluation metrics. To be specific, we discuss the challenges in crater detection due to the complex properties of the craters and survey the DL-based CDAs by categorizing them into three parts: (a) semantic segmentation-based, (b) object detection-based, and (c) classification-based. Additionally, we have conducted training and testing of all the semantic segmentation-based CDAs on a common dataset to evaluate the effectiveness of each architecture for crater detection and its potential applications. Finally, we have provided recommendations for potential future works.
Index Terms:
DEM, Optical image, Automatic Crater Detection, Deep Learning, Semantic Segmentation, Object Detection.I Introduction
Craters are one of the prominent topographic features on most planetary surfaces. Several missions have been carried out over the last few decades to explore the planetary surfaces, which helps to understand the physical properties of planetary surfaces and how impact rates vary over time [1, 2, 3, 4, 5]. The spatial and size-frequency distribution of craters is critical for understanding the impactor population as well as collisional and evolutionary events in the solar system, which helps to derive the impact flux of the solar system [6, 7, 8, 9]. Most notably, impact craters are studied to understand impactor energy, angle, mechanical properties of a target’s regolith, projectile type, size, and other factors that influence the morphologies of these craters, such as material strength and gravity [10, 11, 12]. Additionally, it is also used in applications of space probes like landform selection and spacecraft navigation [13].
With the continuous advancement of technology, high-resolution data is now available, and identifying a wide size range of craters is possible. A crater can be detected either manually or automatically. In the manual approach, domain experts visually inspect data to annotate craters. Some previous works, such as Robbins et al. [14] and Head et al. [15], use a manual approach to mark the craters. However, manual marking is cumbersome, time-consuming, and prone to error. Robbins et al. [16] stated that a discrepancy exists in marking craters among experts. Therefore, most studies followed the automatic approach for crater detection to reduce human time and biases in manual marking.
Many researchers have widely considered the automatic crater detection approach to develop an efficient and accurate detection algorithm. The developed automatic crater detection algorithms (CDAs) can be divided into two types: traditional and deep learning (DL) based methods. Traditional CDAs (e.g. [17, 18, 19, 20, 21, 22]) typically first extracted the handcrafted features such as edge, contour, and depression and then utilized these features to detect the craters. For example, Kim et al. [17] extracted the edge features and then used the template matching to find the final craters. However, traditional crater detection methods are not generalizable to larger surface areas and a wide diameter range [23, 24].
Recently deep learning has been successful in various computer vision tasks such as object detection [25, 26, 27, 28] and semantic segmentation [29, 30, 31, 32]. In contrast to traditional machine-learning models that rely on handcrafted features, deep learning models have the ability to learn and identify features on their own. As a result, in the last few years, most crater detection works have followed deep learning-based approaches.
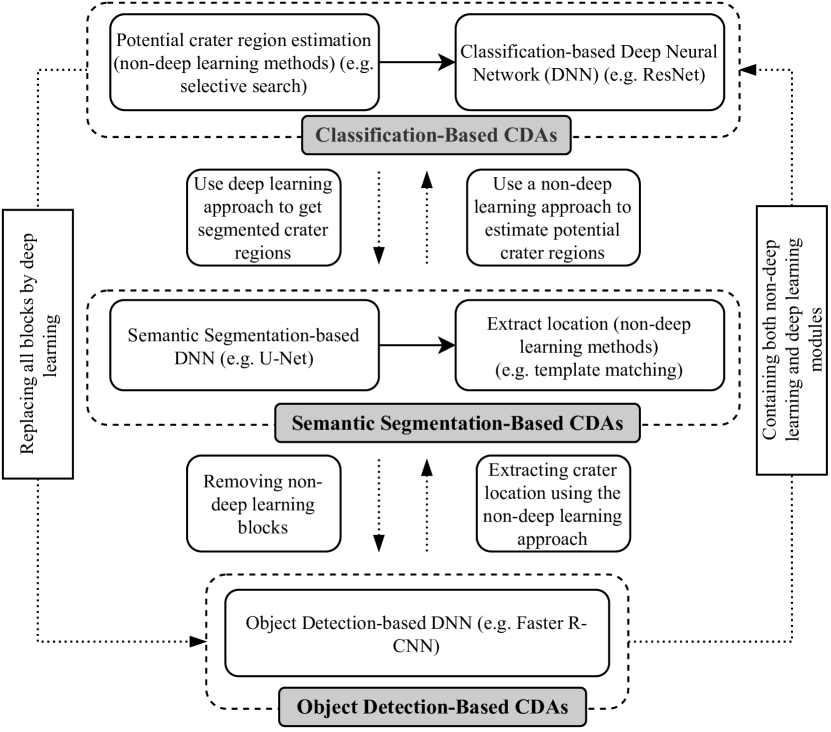
In this work, we comprehensively review the important aspects of existing deep learning-based crater detection algorithms (CDAs) and mention some recent advancements in the field. Based on computer vision tasks, we categorized deep learning-based CDAs based on their approach into three types: semantic segmentation-based, object detection-based, and classification-based (Figure 2). In semantic segmentation-based CDAs, semantic segmentation-based deep neural networks (DNNs) are used to categorize each pixel in the image as crater or non-crater. Then, a non-deep learning (DL) method, such as template matching is used to extract the location and size of the craters. Object detection-based CDAs directly provide the craters’ location and size information by utilizing the object detection frameworks such as Faster R-CNN [25]. In classification-based CDAs, features are extracted using traditional methods (i.e., non-deep learning techniques) and subsequently classified into the crater and non-crater categories using DNNs. We discuss the significance of various CDAs that can be further utilized in research. Therefore, this study tries to understand and analyze a more holistic approach to provide a stronger foundation for developing crater detection algorithms (CDAs). Also, describe the challenge due to variation of crater features, dataset description for crater detection, and finally, explain some key points that need to be cognizant for future crater detection work.
II Scope and Aim
Based on the most recent development trend of deep learning (DL) based CDA, the performance of the algorithms is continuously improving to meet the demand of various scientific applications. This paper aims to examine the evolution of deep learning-based automatic crater detection algorithms (CDAs). Also, we re-implement the semantic segmentation-based CDAs on a generated benchmark dataset to understand their effectiveness in terms of accuracy and speed. The major contributions of our research are as follows:
-
•
Based on the computer vision task, we categorize the deep learning-based crater detection method and summarize its main characteristics, research approaches, and limitations.
-
•
Different existing works utilize data and catalogs based on their accessibility and convenience. All existing semantic segmentation-based crater detection works are trained, evaluated, and analyzed on common data, catalog, and diameter range to understand the effectiveness of the deep learning framework. It will help scientists determine which architecture to employ for their application.
-
•
We have presented a detailed description of the CDAs dataset and catalog to assist researchers in determining which ones best suit their requirements and objectives. Specifically, we have provided information on each dataset and catalog used in CDAs, such as resolution, coverage area, and detected crater diameter range.
-
•
We have provided the challenges and problems encountered in the crater detection field, such as the complexity of crater features and the lack of labeled data. Further, a set of promising future works and recommendations are provided that could determine the direction of forthcoming developments and advancements of CDAs.
A number of papers on crater detection have been published, including both manual and automatic methods. This work focuses on papers that use deep learning-based crater detection approaches and have been published in peer-reviewed journals before February 2022. In order to find pertinent publications in google scholar, we combined several keywords, including "crater counting", "crater detection algorithm", "convolutional neural network", and "deep learning." We sincerely apologize to the authors whose works were based on crater detection but are not included in this review.
The remaining paper is organized as follows. Section III provides a comparison with previous review work. Section IV discusses the challenges associated with crater detection. Section V is divided into three major sub-sections, each focusing on a different type of deep learning-based CDAs. The first Section V-A discusses the semantic segmentation-based crater detection methods. It is followed by a comparative analysis of frameworks, dataset preparation, implementation details, results, and discussions. In the second Section V-B, a brief background on object detection-based CDAs and terms frequently used in object detection are provided. This section contains definitions and a review of the proposed methods. Finally, Section V-C describes the classification-based crater detection method. Section VI describes the various benchmark datasets. Section VII examines the future trends and provides further research directions, while Section VIII concludes the paper.
III Comparison With Previous Review
Currently, there is only one survey paper for the deep learning-based crater detection methods, published in 2019 by DeLatte et al. [33]. Our work has numerous enhancements in contrast with their paper. First, we also included papers published after , and more than papers are cited in this review. Second, to the best of our knowledge, this is the first literature review paper that benchmark semantic segmentation-based crater detection frameworks on a common dataset. The result obtained by comparing the effectiveness of the different automatic CDAs on a common dataset aids in gaining insight into each algorithm’s key features, comprehending how they differ from one another, and also help researchers in selecting the best automatic CDA architecture suited to their needs and application. Third, this review paper clarifies the similarity and differences between different deep learning frameworks used for crater detection. Furthermore, we have provided a tabular representation of the key features and characteristics of different deep learning-based crater detection methods given in Table I and a detailed description of the data and catalog used in previous work given in Table VI and Table VII, respectively.
IV Challenges for crater detection
The planetary bodies will continue to be an important object of study because of recent advances in space exploration. Space exploration is used for many scientific studies with the primary goals of searching for evidence of water on the planetary bodies, understanding the origin of the Moon, Mars, or any other planetary bodies through mineral and chemical composition studies, mapping the planetary bodies’ surface in greater detail and detecting and identifying the presence of atomic species in the planetary bodies’ atmosphere [35, 36, 37, 38]. As we expand our exploration of space and the solar system, the planetary bodies could serve as a repository for fuel, oxygen, and other critical raw materials [39]. For this purpose, craters are among the most studied geomorphic features because they can be utilized for studying past and present geological processes, the relative ages of craters, the energy source surrounding it, surface mineralogy, and chemical compositions [40, 41, 42, 43]. The crater’s characteristics, such as variation in size, shape, floor structures, terrain properties, degree of degradation, and widely disparate distributions present several challenges for crater detection. Some of these challenges are described below:
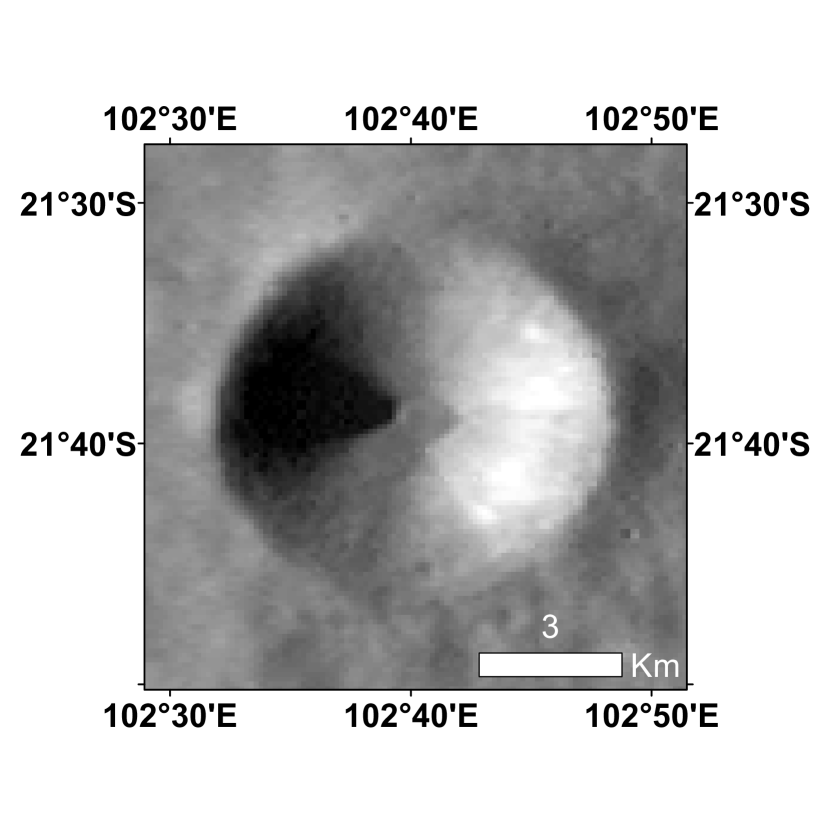
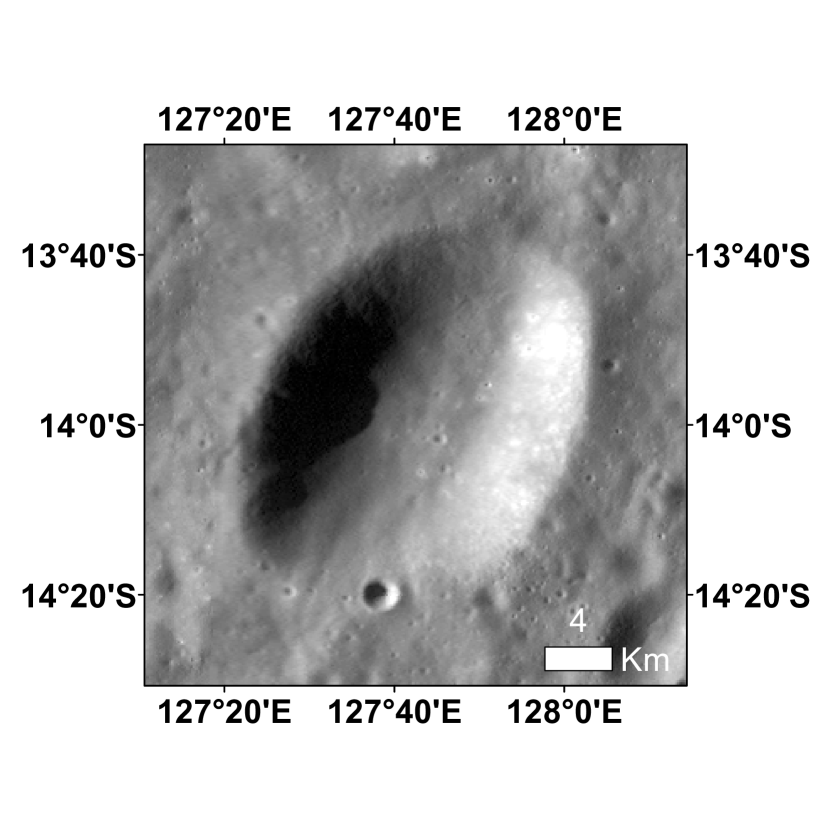
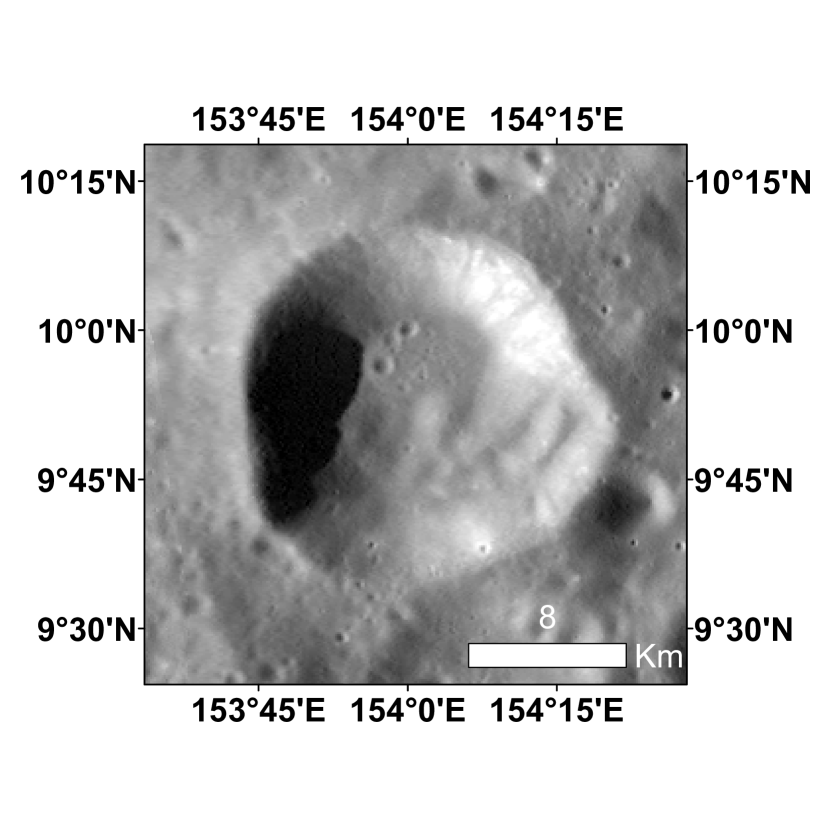
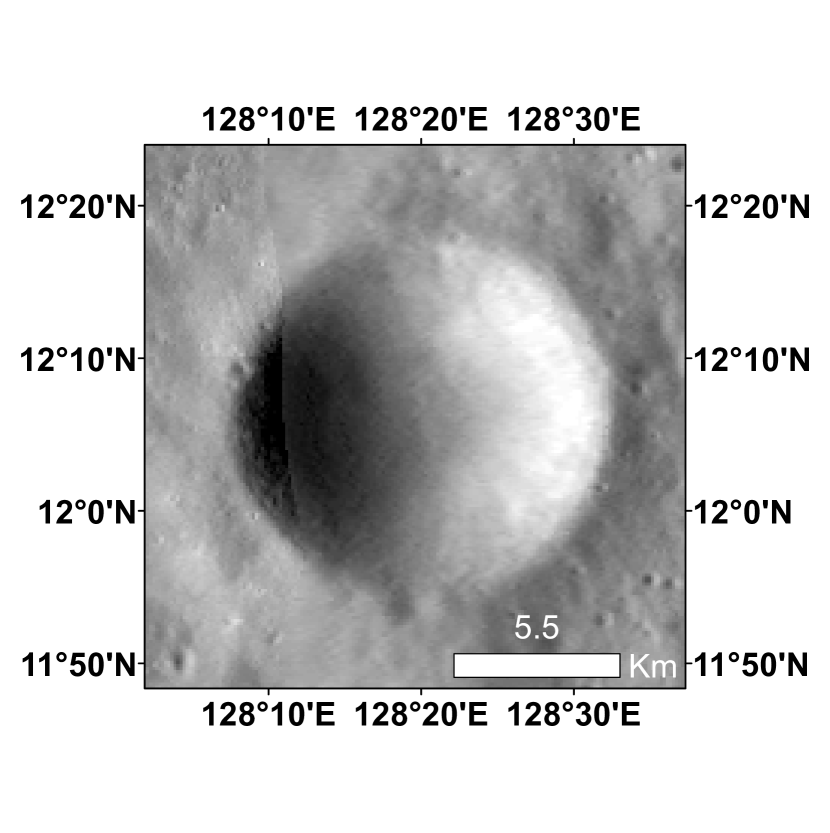
IV-A Size variation
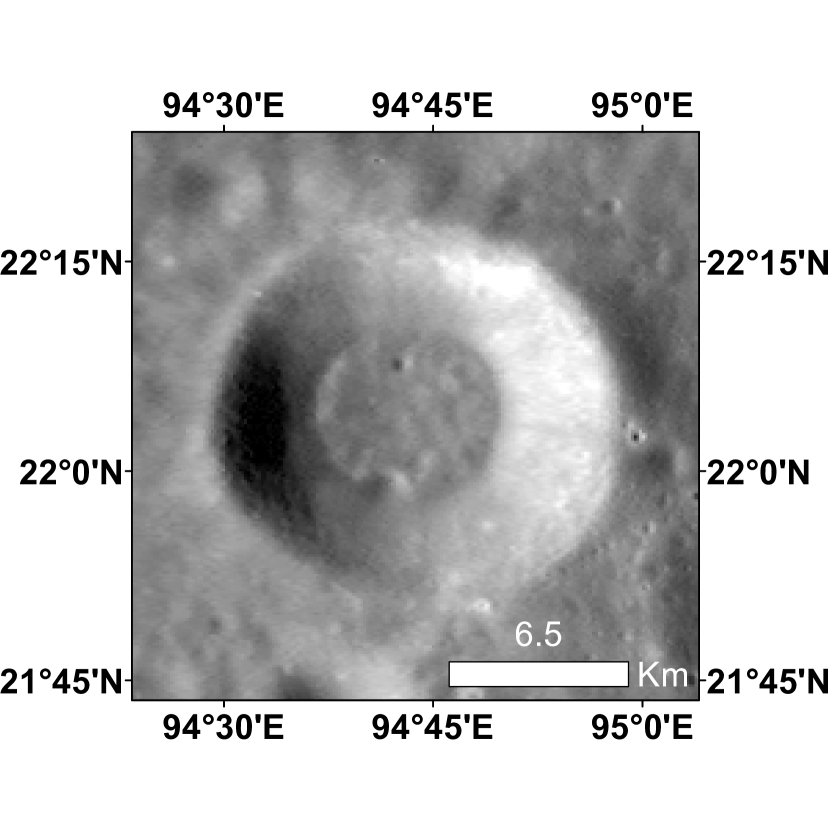
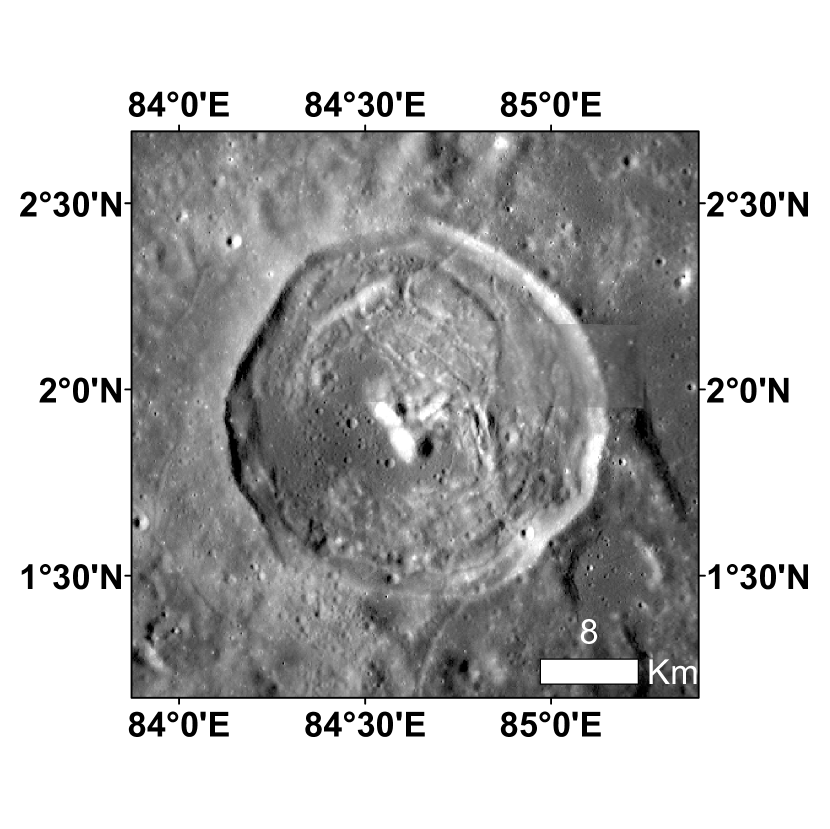
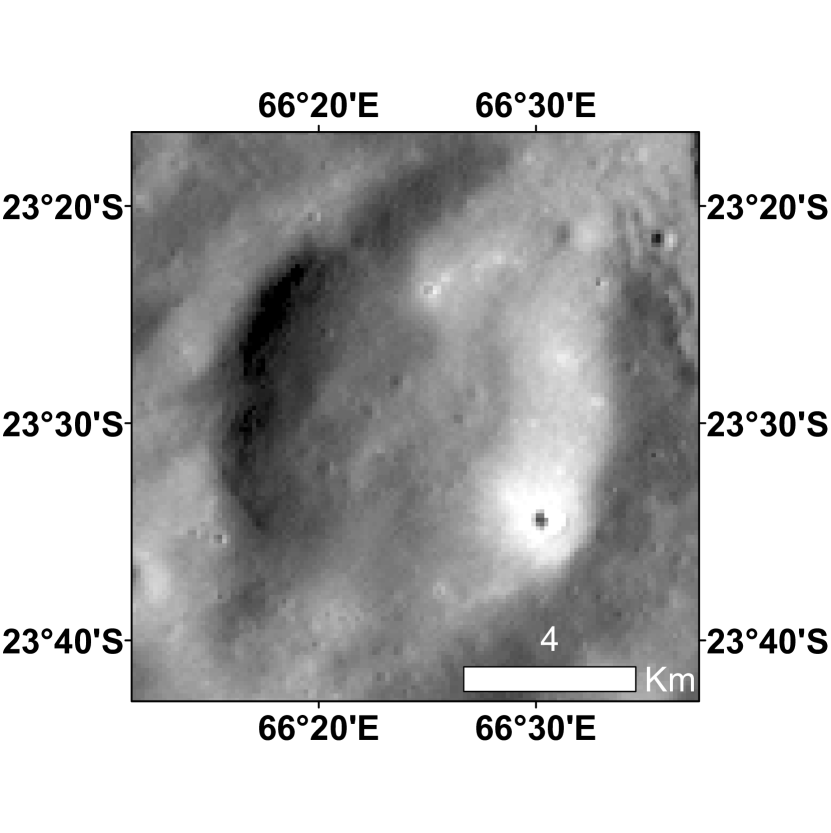
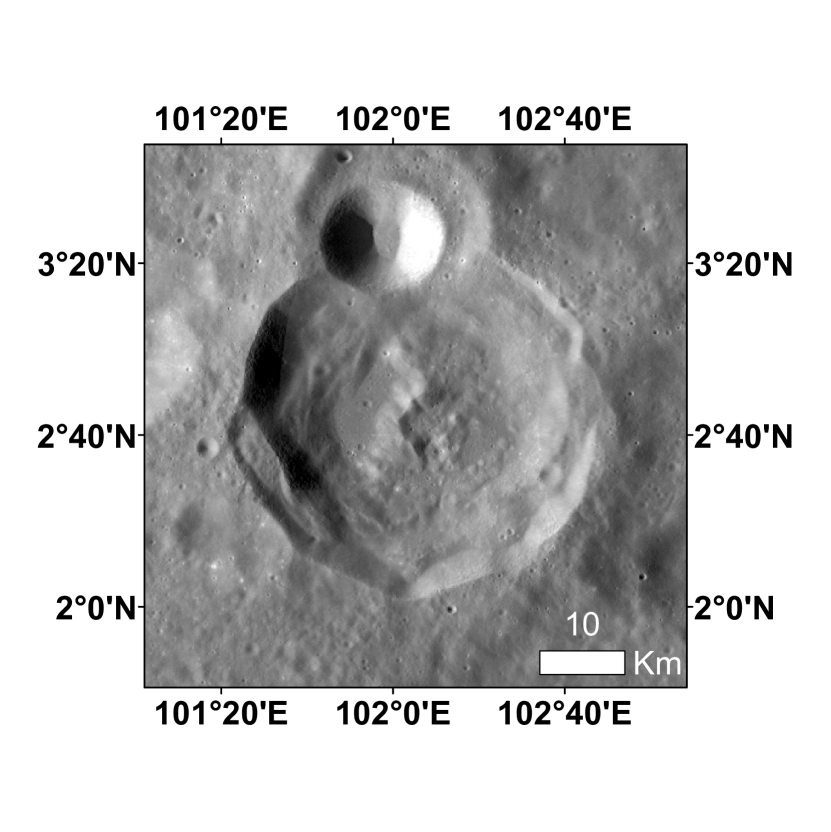
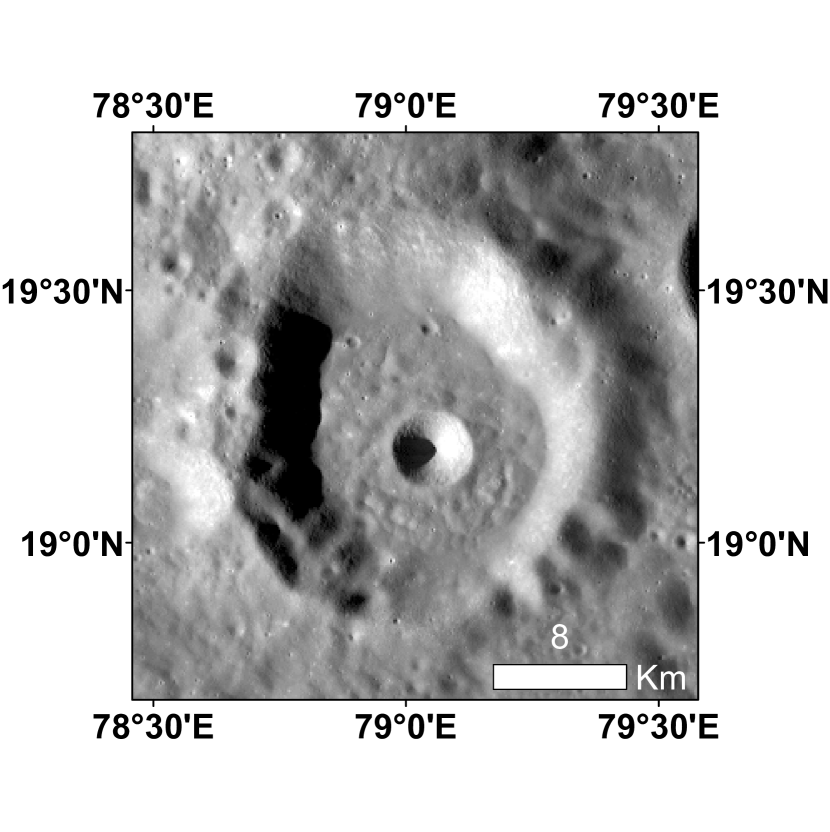
Impact craters’ size depends on various factors, such as the impactor’s size, velocity, and surface properties of the impact site. These factors lead to huge variability of craters’ size from hundreds of meters to kilometers [44]. Some of the craters with different sizes are shown in Figure 1. The wide range of craters’ sizes makes it difficult to detect them all automatically. For example, if a low-resolution image is utilized for the automatic crater detection method, in this scenario, detecting small craters may not be possible since the number of pixels representing smaller craters will be significantly less. If a high-resolution image is utilized, then the detection of larger craters may not be possible due to limitations in computational power.
IV-B Shape variation
The crater shape can vary due to the impact angle, solar wind weathering, degradation, and differences in the crater-formation process. Most crater detection methods treat craters as circular shapes. However, as shown in Figure 1, craters can be elliptical, irregular, or overlapping. Due to this, detecting all shapes of the craters using a single crater detection algorithm is challenging.
IV-C Terrain variation
Different planetary bodies exhibit various surface properties. For example, the Moon’s surface has highlands and lowlands, mountains, and volcanoes [45], whereas the Martian surface is rocky with canyons, volcanoes, and dry lake beds, and most of its surface is covered with dust [46, 47]. As a result, CDA trained on images from one planetary surface, such as the Moon, may not be as effective at detecting craters on another planetary surface, such as Mars. Additionally, the surface characteristics of planets may vary in terms of their location—for instance, the maria and highland areas on the Moon exhibit different surface properties. The maria are comparatively fresh areas on the Moon that resulted from huge impacts that pierced the Moon’s crust and excavated basins [48]. Later, volcanic eruptions brought liquid magma to the surface, filling the basins, which generated the big flat expanses we can still see once it cooled and solidified. As a result, the maria region has a flat surface with few craters. However, lunar highlands are older because they did not experience structural disruption due to volcanoes [49]. As a result, they have a more complex surface, such as mountains, and contain more impact craters than the maria. Therefore, a single crater detection algorithm may not work on a different region of the planetary surface.
IV-D Degree of degradation
The variation in the degree of impact crater degradation can be used to analyze the surface properties and estimate the crater age. The processes such as weathering, lava flows, impacting, and downslope material movement can cause craters to erode continuously. To understand how a crater degradation process takes place in the top few meters of the regolith (surface material), they can be grouped into different classes. For example, It can be divided into three categories: fresh craters, moderately degraded, and highly degraded craters [50, 51]. Fresh craters are the least degraded, with sharp rims and bowl-shaped interiors; moderately degraded craters have rims that are lower than fresh craters but more bowl-shaped than highly degraded craters; highly degraded craters have no rims and shallow, funnel-shaped profiles [52]. These aid in determining the rate of crater degradation. Also, sometimes due to erosion, craters blend into the surface.
These different degradation stages make it difficult for a single crater detection algorithm to detect all such craters.
IV-E Different data-type
The planetary data mainly used for crater detection are digital orthophoto maps (DOMs), digital elevation maps (DEMs), and near IR images. These data’s characteristics differ from one another, such as DOMs and infrared images are affected by sun angle and cause highlight and shadow patterns. In contrast, DEMs are unaffected but lack complex terrain information [53, 54]. Due to differences in data type characteristics, CDAs trained on one type of data do not detect craters effectively on another data type. However, the unique characteristics of the different data lead to complementary information that can be useful for better CDA. Hence, some research works, such as Tewari et al. [55] and Mao et al. [56], used data fusion techniques to detect craters. However, existing methods that train CDAs on image fusion to improve the features available to the CNN are not applicable in all scenarios. For example, if we want to train CDA on another region using a data fusion technique, it is possible that some of the data types in a specific resolution may be unavailable, posing yet another challenge.
V Categorization of Deep learning based method for crater detection
In computer vision, deep learning-based methods outperform traditional methods; therefore, recently, researchers followed the deep learning-based crater detection method for better generalization and performance. We divided the deep learning-based crater detection methods based on their approach into three categories: semantic segmentation-based, object detection-based, and classification-based (Figure 2). The details are provided in the following sections. In addition, we have provided the highlights and properties of each CDA in Table I, which will assist researchers in understanding the key features of each CDA.
| Author, Year | Title | Highlights and properties | |||||||||
| Semantic Segmentation based Crater Detection | |||||||||||
|
Lunar crater identification via deep learning |
|
|||||||||
|
Automated crater detection on Mars using deep learning |
|
|||||||||
|
|
|
|||||||||
|
|
|
|||||||||
|
Automated crater detection with human level performance |
|
|||||||||
|
|
|
|||||||||
|
|
|
|||||||||
|
|
|
|||||||||
| Object Detection based Crater Detection | |||||||||||
|
|
|
|||||||||
|
Lunar impact crater identification and age estimation with Chang’E data by deep and transfer learning |
|
|||||||||
|
|
|
|||||||||
|
|
|
|||||||||
|
|
|
|||||||||
|
|
|
|||||||||
|
|
|
|||||||||
|
|
|
|||||||||
| Classification based Crater Detection | |||||||||||
|
|
|
|||||||||
V-A Semantic Segmentation Based CDAs
A semantic segmentation network is used to categorize each pixel in the image using predefined labels. For crater detection, each pixel is categorized as crater or non-crater. Since the network does not provide the location and size information of craters, the output of the segmentation network is further needed to process. It can be accomplished with the help of techniques such as the Hough transform and template matching. However, the majority of the semantic segmentation-based crater detection work employed a template matching algorithm. Following their footsteps, we also utilized the template matching algorithms in our work.
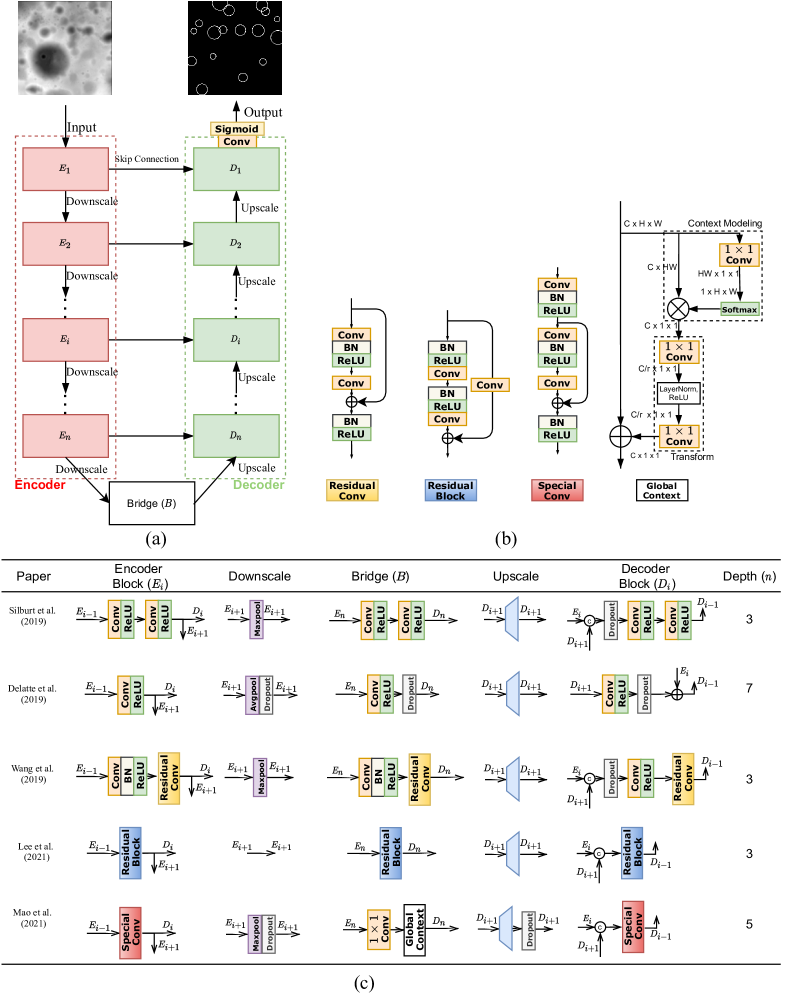
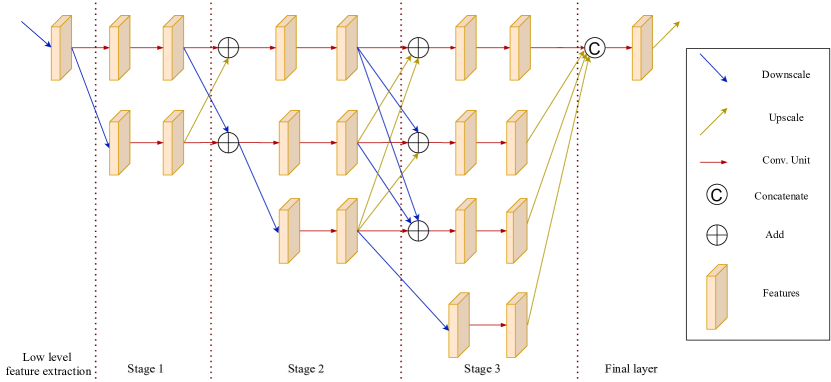
Most of the semantic segmentation-based CDAs followed the encoder-bridge-decoder structure. Research works [23, 60, 61, 58, 62, 56] are explained using encoder-bridge-decoder structure shown in Figure 3. The encoder and decoder network consist of multiple encoder and decoder blocks. The encoder block received input from the downsampled output of , and its outputs were passed to the and . Similarly, the decoder block received input from the and an upsampled version of the , and its output was sent to the . The number of encoder or decoder blocks determines the depth () of the architecture. As shown in Figure 3(a), the encoder network is on the left side of the figure. It performs the feature extractor function by using a series of encoder blocks and learns abstract patterns from the input image. The encoder network reduces the spatial dimension of features while increasing the number of feature channels to obtain high semantic information.
A downscale operation is performed after every encoder block to reduce the spatial dimension of the input and learn the feature representation at multiple levels. In existing CDAS, It comprises either a 22 max pooling layer with a dropout, an average pooling with a dropout, or a 22 max pooling layer. Similarly, the decoder network is present on the right side of the architecture. It consist of series of decoder blocks . The decoder network aids in increasing the spatial dimension of the features while decreasing the number of feature channels used to extract the high-dimensional feature representation for better localization.
An upscale operation is performed after each decoder block using UpSampling2D or Conv2DTranspose available at TensorFlow Keras. UpSampling2D, by default, does nearest neighbor interpolation, whereas Conv2DTranspose is a convolution operation that learns up-sample features. Research works [23, 60, 62] used UpSampling2D whereas [61, 56] used Conv2DTranspose to perform the upscale operation. Each encoder block () feature is passed to the respective decoder block () using a skip connection. These skip connections efficiently transfer spatial and semantic information throughout the network by improving gradient flow during back-propagation and allowing the network to learn better representation. The bridge () connects the last encoder and first decoder block, completing the information flow. Finally, the segmented mask of craters is produced from the final decoder output after it has undergone a convolution with a sigmoid activation function.
Few researchers borrowed the idea of a residual connection from He et al. [81] and proposed a residual block named Residual Conv [61], Residual Block [62], and Special Conv [56] are shown in Figure 3(b). The detail of each architecture encoder block, decoder block, bridge, downscale, and upscale information is provided in Figure 3(c). In Figure 3(b) and Figure 3(c), ‘Conv’ define a convolution layer with kernel size of , ‘BN’ define a batch normalization operation and ‘ReLU’ define a rectified linear unit [82] activation function.
Many researchers, including those working on crater detection and classification domain, were intrigued when the U-Net architecture [29] was proposed. As a result, Silburt et al. [23], DeLatte et al. [60], and Lee et al. [58] used the U-Net architecture to detect the craters. However, their architectures differ from the original U-Net architecture [29] primarily in terms of the number of filters, kernel size, and depth.
The U-Net is inefficient in fusing multi-scale information and fails to adequately explore the high-resolution information from the input image effectively. Hence, we require an architecture that can enhance the learning of various scale features and strengthen feature transmission across the network so that small and overlapping craters can easily be detected with high accuracy. As a result, researchers began attempting to create numerous U-Net variants in order to obtain more accurate segmentation results.
For example, Wang et al. [61] proposed an effective residual U-Net (ERU-Net) architecture for crater detection by replacing a convolution block in U-Net with a residual block named “Residual Conv” and it is shown in Figure 3(b) and Figure 3(c). They were inspired by He et al. [81], who proposed a deep residual framework that used identity mapping by shortcut connection to ease the training and overcome the degeneration issue in deep neural network training. Similarly, Lee et al. [62] used the ResUnet [63] architecture, which also uses residual connections in U-Net to enhance the network’s learning ability. The residual block used in the architecture is named “Residual Block” and it is shown in Figure 3(b) and Figure 3(c).
As discussed in Section IV, DEM and optical image each have their own set of benefits and drawbacks, and using only one type of data may limit the insufficient crater feature extraction. Therefore to utilize the complimentary information of DEMs and optical images, Mao et al. [56] proposed a dual path convolutions neural network that integrates the features of DEMs and optical images. Similar to other CDAs, i.e., Wang et al. [61] and Lee et al. [62], it also replaces the plain convolution block in U-Net with a residual block named ‘Special Conv’ in Figure 3(b) and Figure 3(c). In the encoder network, DEM and optical image features are extracted independently. The extracted features of DEM and optical images in the bridge network are integrated. Finally, the decoder network with the attention mechanism enlarges the features to optimize the feature information further and obtain the segmented output.
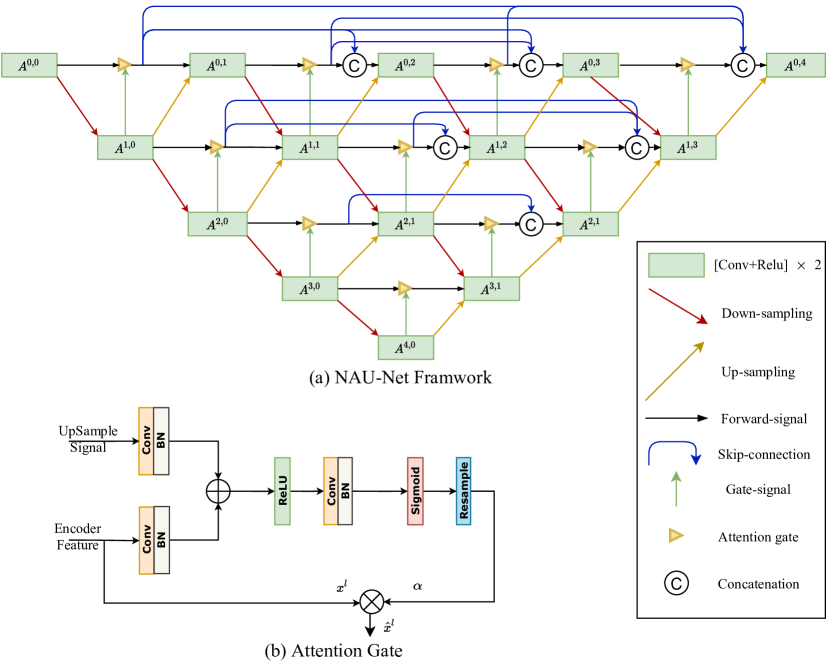
In the general encoder-decoder architecture, each encoder block is connected to the decoder block with a skip connection to reduce the loss of high-level features due to downsampling in the encoder. However, in Jia et al. [64], the skip connections are replaced by nested dense connections to better preserve high-level features for detecting smaller craters. The author proposed another variant of the U-Net architecture called NAU-Net, which combines the U-Net [29] and attention gates [66] with a nested dense connection (Figure 4). The attention gate used in the architecture helps to improve feature extraction ability in order to detect overlapping craters.
Chen et al. [67] used the HRNet [30] framework (Figure 5) to detect craters and rilles on the lunar surface. To detect craters on the lunar surface, the HRNet was first trained on the large dataset generated by Silburt et al. [23], then fine-tuned on the smaller manually annotated dataset containing images of the lunar surface. HRNet has overcome the limitations of the U-Net framework by preserving the high-resolution input data information in deeper layers and learning the comprehensive representation of input by multi-scale fusion. It consists of four stages, which have multiple residual blocks [81] to extract features of different sizes. After each stage: the features are down-sampled by a factor of two, the number of channels is increased, and multiple up-sampling and down-sampling operations are performed for multi-scale fusion.
V-A1 Limitations
The main issue with the semantic segmentation-based CDAs is that they detect craters in two asynchronous steps. The semantic segmentation framework is GPU-based, and location and size extraction methods, such as template matching, are CPU based, resulting in an imbalanced runtime comparison. The template matching algorithm is slow, which causes high time complexity, and a fixed threshold in template matching may not be optimal for complex and incomplete segmentation.
V-A2 Implementation
Dataset Preparation
We have utilized the DEM data from Tewari et al. [55], having a resolution of m/pixel. The DEM mosaic was obtained through LRO’s lunar orbiter laser altimeter (LOLA) and the SELENE terrain camera (TC) ([83]). In the data generation process, DEMs of size are cropped from the mosaic using a raster method, with adjacent images overlapping by . The overlapping strategy used while cropping the image ensures that many of the craters cropped in that image will have a chance to appear in the adjacent image. The cropped DEMs are resized to pixels. The provided DEMs have a simple cylindrical projection. In our work, we have converted it into an orthographic projection to reduce image distortion.
For each DEM, we have constructed the target image of size pixels. The target image is a binary image, where the crater rim is marked as a ring with a thickness of pixels. The craters centers and radius from the catalog [57] are used for marking craters in the target image. Povilaitis et al.[57] catalog contains craters of diameter size to km. This catalog is conservative since it only includes craters that are highly certain to be a crater. The study area spans longitude from - to and latitude . The training region contains longitude from - to and latitude , and the testing region spans longitude range from to and latitude . The total number of training, validation, and testing patches are , , and , respectively, with , , and craters.
Setting
In our experiment, learning rate=, batch size=, epochs=, and Adam optimizer [84] is used. The loss function is binary cross entropy. The model with the lowest validation loss is chosen to predict craters. The data, code, and extracted craters location information will be provided in the following link 111https://github.com/Ataltewari/Review-Work. We utilized the open-source code of the following papers: [23, 60, 58, 62, 67], for training and testing on our generated dataset. For training and testing the Jia et al. [64] crater detection method, code from the following link 222https://github.com/rizalmaulanaa/Robustness_of_Prob_U_Net is utilized. As the code is unavailable in Mao et al. [56] and Wang et al. [61] paper, we implemented it using the information provided in their respective papers. Mao et al. [56] proposed framework utilized both optical and DEM data for training the deep neural network; however, in our work, we have only used DEM to maintain data type uniformity with other frameworks.
Crater extraction
The segmentation network output is further processed to get the craters’ location and size. The segmented output value varies between to . It is converted to a binary image with a threshold, . If the value is greater than , it is set to ; otherwise, it is set to . The binary image is used at the input of the template matching algorithm to extract the craters’ location and size information. The template matching algorithm’s radius range varies from to . The function of the algorithm is to calculate a match probability for circles of radius varying from to for each pixel in an image. If the probability value is above a threshold , that ring is marked as a crater.
Following Silburt et al. [23], duplicate removal is done on a pixel scale for craters detected in each DEM using the following equations:
| (1) | ||||
| (2) |
where () is the center location and is the radius of the crater in pixels. and are tunable hyperparameters. |a| represent the absolute value of a.
The predictions with maximum template matching probability are retained during duplicate removal for all the architectures. We evaluated post-CNN metrics on the validation data in the Silburt et al. [23], over the following hyperparameters range:
The best -score was obtained for , , , .
Post processing
The dataset contains images with overlap; each crater may appear in two or three images. It improves the probability of detecting craters, but the same crater may be detected in multiple images. Such duplicate detection is undesirable and needs to be filtered. Therefore we convert the pixel coordinates to degrees and kilometers coordinates and remove the duplicate craters. The conversion is done by the following equations as provided in DeepMoon [23]:
| (3) | ||||
| (4) | ||||
| (5) | ||||
| (6) |
where, in pixel coordinates, (x,y) is the central location and r is the radius. In degree and kilometer coordinates, and are longitude and latitude in degree, and is the radius in km. Subscript defines the center of the DEM. and are the pixel and latitude extent of the DEM. is the kilometer to degree conversion factor, and is the moon’s radius in km.
Now, we removed the duplicate craters that satisfy the following equations,
| (7) | ||||
| (8) |
where, =. and are post processing hyperparameters that are tuned on validation set, for the following range:
Results and Discussion
All existing semantic segmentation-based CDA models were trained and tested under identical conditions, such as the same training and testing region, data type, and diameter range. The comparison results of all CDA models are shown in Table II. The following metrics are used to evaluate the CDA’s performance: precision, recall, -score, -score, median fractional latitude error, median fractional longitude error, and median fractional radial error. In addition, we compared the training and inference time, total training parameters, model size, and total detection.
| Existing Works |
|
|
|
|
|
|
|
|
|
|
|
|
|||||||||||||||||||||||||||||
|---|---|---|---|---|---|---|---|---|---|---|---|---|---|---|---|---|---|---|---|---|---|---|---|---|---|---|---|---|---|---|---|---|---|---|---|---|---|---|---|---|---|
| Silburt et al. [23] | 62.46 | 92.96 | 74.71 | 84.68 | 4.62 | 6.12 | 4.13 | 10.28 | 39 | 75.06 | 123.4 | 12,160 | |||||||||||||||||||||||||||||
| DeLatte et al. [60] | 64.56 | 91.27 | 75.63 | 84.30 | 4.80 | 6.34 | 4.23 | 0.73 | 2.37 | 11.34 | 8.9 | 11,521 | |||||||||||||||||||||||||||||
| Wang et al. [61] | 70.89 | 91.31 | 79.82 | 86.33 | 4.49 | 6.00 | 4.44 | 23.74 | 73.88 | 136.73 | 285.2 | 10,480 | |||||||||||||||||||||||||||||
| Lee et al. [62] | 66.92 | 90.05 | 76.78 | 84.22 | 4.60 | 5.99 | 5.06 | 8.30 | 18.71 | 29.27 | 99.9 | 10,903 | |||||||||||||||||||||||||||||
| Mao et al. [56] | 63.76 | 92.92 | 75.62 | 85.13 | 4.69 | 6.06 | 4.51 | 10.03 | 13.16 | 32.47 | 120.9 | 11,855 | |||||||||||||||||||||||||||||
| Jia et al. [64] | 70.14 | 90.20 | 78.91 | 85.32 | 5.01 | 6.19 | 4.33 | 11.98 | 46.91 | 91.9 | 144.5 | 10,334 | |||||||||||||||||||||||||||||
| Chen et al. [67] | 65.63 | 93.15 | 77.00 | 85.94 | 4.79 | 6.06 | 3.99 | 9.52 | 46.82 | 67.25 | 115.4 | 11,345 |
Table II shows that Wang et al. [61] (ERU-Net) has the best precision (), -score (), and -score () compared to other works. Also, recall () is better than Jia et al. [64], DeLatte et al. [60], and Lee et al. [62], indicating reliable detection of most impact craters. However, the training and inference time, training parameters, and memory acquired by the model are very high compared to other CDAs. Whereas Jia et al. [64] has less space-time complexity, its precision and -score are comparable to Wang et al. Therefore, Jia et al. [64] will be a better option than Wang et al. [61] for applications requiring high precision and limited computational resource with less time complexity.
Chen et al. [67] (HRNet) has the best recall (); it may be due to the preservation of high-level features. Silburt et al. [23] and Mao et al. [56] have comparable recall with respect to Chen et al. [67]. However, Chen et al. [67] also has less number of parameters and model size compared to Silburt et al. [23] and Mao et al. [56]. Hence, Chen et al. [67] is the best option for applications that require high recall, such as crater counting and hazard detection.
DeLatte et al. [60] has the lowest space-time complexity. It has times fewer parameters and model size than the other CDAs. In addition, the recall is better than [62] (ResUnet), [64] (NAU-Net), and comparable with [61] (ERU-Net). One interesting fact is that the recall of DeLatte et al. [60] is better than that of much more complex architectures such as NAUNet [64] and ResUnet [62], which utilize residual and dense connections. DeLatte et al. will be the best choice for applications requiring both accuracy and space-time complexity, such as spacecraft landing.
Wang et al. [61] and Lee et al. [62] replace standard convolution with residual convolution; however, the recall is suboptimal. It signifies that may be replacing standard convolution with residual convolution is not sufficient to extract all the craters.
| Total Detected Craters | |||||||||||
|---|---|---|---|---|---|---|---|---|---|---|---|
| CDAs Detection | Precision (%) | Recall (%) | -Score (%) | -Score (%) |
|
|
Total | ||||
| All CDAs | 51.73 | 97.18 | 67.52 | 82.65 | 7546 | 7041 | 14587 | ||||
| >1 CDAs | 58.88 | 95.93 | 72.97 | 85.20 | 7449 | 5202 | 12651 | ||||
| >2 CDAs | 63.63 | 94.84 | 76.16 | 86.36 | 7364 | 4209 | 11573 | ||||
| >3 CDAs | 67.68 | 93.61 | 78.56 | 86.95 | 7269 | 3471 | 10740 | ||||
| >4 CDAs | 71.53 | 91.65 | 80.35 | 86.77 | 7117 | 2833 | 9950 | ||||
| >5 CDAs | 75.46 | 89.22 | 81.77 | 86.08 | 6928 | 2253 | 9181 | ||||
| >6 CDAs | 80.54 | 84.87 | 82.65 | 83.97 | 6590 | 1592 | 8182 | ||||
Wang et al. [61], Lee et al. [62], and Chen et al. [67] have the lowest fractional latitude (%), longitude (%), and radial error (%), respectively. The fractional errors of all CDAs are approximately the same, ranging from 4.49 to 6.34; this may be because all are using the same labels for training the DL framework, and the same parameters are used in the template matching algorithm. Also, we found out that the fractional errors of Silburt et al. [23] calculated in our work are significantly less than the errors they mentioned in their paper. It may be due to resizing operation (resizing multiple size DEM to fix size) in their data generation process causes high positional distortion and leads to high fractional errors.
Each CDA architecture has a unique design. For instance, ERU-Net [61] utilizes residual connections for better training and tackling the vanishing gradient problem. HRNet [67] utilizes multiple upsampling, downsampling, and multi-scale fusion operations to minimize information loss due to downsampling and extract high-level semantic information. CraterUNet [60] has used a larger depth and less number of filters per layer to provide much better space-time complexity. The feature extraction ability of each CDA framework is different; hence, the crater that one CDA might have missed can be found by another CDA. We combine the detection results of all architectures and eliminate the duplicate craters (Table III). The recall of this combined detection is , which is the highest recall of any automated catalog generated using the Povilaitis catalog [57] for training. The unmarked craters in the catalog cause low precision (i.e., ).
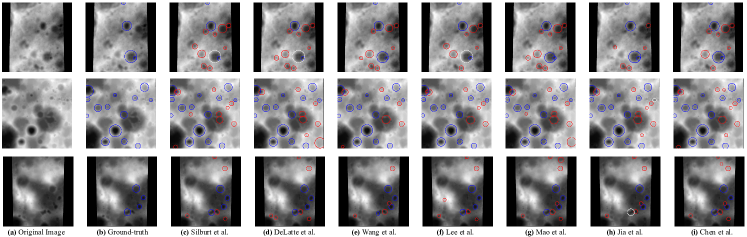
The detected craters that are not present in the Povilaitis et al. catalog [57] can be new craters or false positives. The craters detected by more than one CDA will have high certainty to be new craters. Table III shows that craters, which are not in the Povilaitis et al. catalog [57], are detected by more than one CDA, and craters are detected by all CDAs. Hence, these craters can be considered highly certain and can be added to the catalog. Also, for the few test images visual results are shown in Figure 6.
Overlapping Craters
The surface of the lunar is covered with craters of varying sizes and shapes, and there can be a scenario in which craters occur in such a way that sufficient separation is not present between two craters; this leads to the formation of overlapping craters [85]. The study of overlapping craters can give insight into surface erosion and degradation patterns and provide information about which part of the planetary surface is older since there is a higher density of overlapping craters forming on older surfaces, as seen on the highlands on the lunar [86, 49]. One of the challenges in detecting craters is that they degrade over time. With increasing degradation, at some point, the crater may eventually become indistinguishable from the surface. The overlapping craters, if sufficiently degraded, may visually resemble a elliptical crater, and this causes a significant problem for crater detection. Catalogs such as Robbins et al. [14] and Head et al. [15] have considered such craters as two separate craters instead of one long elliptical crater. If a crater appears significantly elongated but has a visible cusp in the middle and visually recognizable rims at the ends. In that case, the probability of being correct will be higher if we consider such a feature to be two separate craters instead of one elliptical crater.
Most traditional methods do not perform well in detecting complex features in craters, such as overlapping craters [87, 74]. However, the deep learning-based method works better than traditional methods. To understand the effectiveness of existing semantic segmentation-based CDAs in overlapping cases, we extracted the overlapping crater from the ground truth (Povilaitis et al. [57]) using the equation provided in Ali-Dib et al. [68] as follows.
| (9) |
Where, () and () are the centers and and are the radius of the two craters.
We obtained 808 overlapping craters from ground truth in the test region. In Table IV, we have shown the performance of different CDAs in detecting overlapping craters. It is evident that all methods can detect craters more than 84% from the ground truth. Silburt et al. and Mao et al. perform best, where Silburt et al. can detect 727, and Mao et al. can detect 728 craters out of 808 overlapping craters in the ground truth.
| Existing works |
|
Recall (%) | |
|---|---|---|---|
| Silburt et al. [23] | 727 | 89.97 | |
| DeLatte et al. [60] | 693 | 85.77 | |
| Wang et al. [61] | 701 | 86.76 | |
| Lee et al. [62] | 680 | 84.16 | |
| Mao et al. [56] | 728 | 90.10 | |
| Jia et al. [64] | 703 | 87.00 | |
| Chen et al. [67] | 707 | 87.50 |
V-B Object Detection Based CDAs
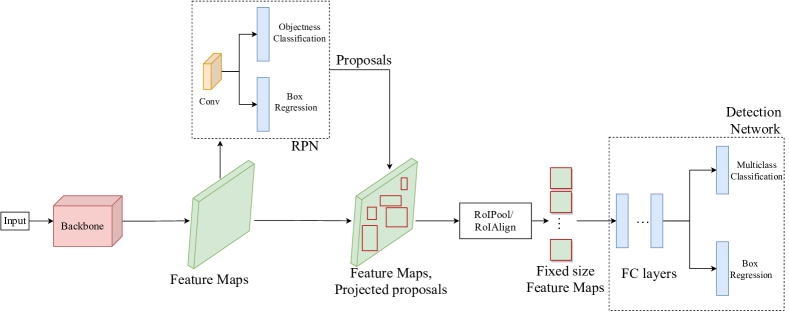
Object detection aims to detect objects of predefined categories. Most existing object detection-based methods can be divided into one-stage methods [88, 89, 90] and two-stage methods [25, 71, 69]. In a one-stage method, regional proposal extraction and detection will happen simultaneously. In a two-stage method, first region proposals are extracted, then extracted region proposals are used for detection. Two-stage methods typically perform better, whereas single-stage methods have faster inference speed. Most of the existing crater detection methods are based on a two-stage method. One widely used two-stage object detection method is Faster R-CNN [25]. The overview of two-stage object detection is shown in Figure 7. In this, the first features of the image are extracted using convolutional backbone architecture. The extracted features from the backbone are passed to the region proposal network (RPN) to obtain the region proposals, i.e., potential craters’ location. This region proposal in the feature map is passed through ROIPool/ROIAlign to get the fixed-sized feature map. Then these proposals are sent to the detection network to get the location and size of the craters. The details of object detection frameworks can be found in the following review works: [91, 92, 93, 94].
V-B1 Common terminology used in object detection
Bounding box:
A rectangular box to define a certain feature in the image (e.g., crater). It is typically represented as (), where () is top-left corner and () is bottom-right corner. It is a predefined bounding box used in RPN in two-stage object detection and detection network in one-stage object detection to indicate possible objects of different scales and aspect ratios.
Anchor
It is a predefined bounding box that indicates possible objects of different scales and aspect ratios, utilized in RPN in two-stage object detection and detection network in one-stage object detection.
Backbone
This part is used to extract the features from the input images.
Region Proposal Network (RPN)
It is used in two stage object detection networks to extract the region proposals (potential objects) from the extracted features using the backbone.
Detection Network
It includes a classifier and regressor to get the bounding box and class of the objects.
V-B2 Object detection based method for crater detection
Ali-Dib et al. [68] used Mask-RCNN [69] to detect craters and extract the shape of the craters. The extracted crater shape was further used to analyze the crater’s ellipticity distribution and morphological parameters.
Crater R-CNN with two-teachers self-training with noise (TTSN) was proposed by Zang et al. [73]. The contribution of this work is two-fold. First, inspired by Faster R-CNN [25] and Mask R-CNN [69], Crater R-CNN is proposed. Second, to handle the incompleteness of the data, two-teachers self-training with noise (TTSN) is proposed. In Crater R-CNN, ResNet with a modified feature pyramid network (FPN) is used in the backbone. In the FPN [95], addition is replaced by concatenation in upsampling layers to fuse high semantic features with high-resolution features. Similar to Mask R-CNN, ROIAlign is used to generate the fixed-size feature map. In TTSN, the incomplete training dataset is first divided into training sets, i.e., and , and then Gaussian noise is added to both datasets. Crater R-CNN is then trained on training set to produce teacher model and on training set to produce teacher model . Teacher model is used to perform prediction training set , and teacher model is used to perform prediction training set . To create a complete dataset, predicted craters with a confidence score greater than are combined with incomplete data. Finally, the complete training data set was used to train the student model, and performance was assessed using test data.
Hsu et al. [72] integrated the geospatial knowledge into the deep learning process. For crater detection, a Faster-RCNN [25] is used as the baseline. For the feature extractor (backbone), ResNet50 [81] with FPN [95] is used. Each image and its Hough-transform applied counterpart are parallelly fed into this feature extractor. The output feature maps of the image and Hough transform counterpart are concatenated by convolution. Then the resultant feature map is then given to the region proposal network, which gives potential crater locations of different scales. This output is sent to the scale-aware classifier, which calculates the probability and weight of the craters. The scale-aware classifier learns two weights to indicate whether the crater is large or small. The weighted sum of category-wise confidence scores is the final score calculated for each crater. This score lies between and , and if it is , the network is fully confident of the detected crater being an actual crater. A threshold of 0.5 is chosen, and if the score is above, the detection is considered a valid crater.
To address the problem of insufficient feature information from a single data source, Yang et al. [70] and Jia et al. [74] fused the optical image and DEM data for crater detection. Yang et al. [70] used R-FCN [71] DL framework to detect craters. Jia et al. [74] used a novel split-attention network with self-calibrated convolution (SCNeSt) with FPN to extract features in the R-FCN DL framework. Also, Jia et al. replaces position-sensitive ROIPool with position-sensitive ROIAlign. SCNeSt modified the ResNest [75] by replacing the second convolution layer of the ResNest block with the self-calibration convolution of the SCNet [76] to enhance the diversity of the features. Also, global pooling in the split attention radix group of ResNest is replaced by combining average pooling and max pooling, which obtain better texture and informative features.
To efficiently detect small-size craters, a deep neural network called a high-resolution feature pyramid network (HRFPNet) was proposed by Yang et al. [77]. In this, first, an adaptive anchor calculation and label assignment (AACLA) algorithm is proposed to collect a sufficient number of anchors for small craters in training; then, these anchors are used in the proposed DL framework, i.e., HRFPNET, to detect the location and size of the craters. In AACLA, the first anchors are estimated using the particle swarm optimization algorithm [96], which collects more training samples of small craters. Then, the label assignment algorithm collects more positive samples of small craters. The HRFPNet consists of a ResNet [81] branch and a high-resolution branch. ResNet branch is used to obtain global features. The high-resolution branch can better detect smaller craters since the feature maps resolution does not decrease with an increase in network depth; however, it lacks global features. To handle this feature aggregation module (FAM) is proposed to enhance the global and contextual features. Finally, the ResNet branch output is densely connected with the FAM output to get the final feature maps on multiple scales. A total of five feature maps are generated. These are sent to a region proposal network (RPN) and detection network for classification and regression. A focal loss is used for classification, and a balanced regression loss is used for regression. The final predictions from the detection network are filtered using the NMS algorithm to get the size and location of the craters.
Recently, Lin et al. [9] used a different DL-based object detection framework for crater detection. The following deep learning frameworks for crater detection are considered: Faster R-CNN [25], Faster R-CNN with FPN [95], Cascade R-CNN [97], SSD [88], RetinaNet [89], YOLOv3 [98], FoveaBox [99], FCOS [100], and RepPoints [101]. Overall Faster R-CNN [25] with FPN [95] backbone is performing best for crater detection.
To address the issue of limited labeled datasets, a novel network, CraterDANet, was proposed by Yang et al. [78]. To effectively detect real unannotated data samples in crater detection problems, domain adaptation (DA) is used with auto-annotated synthetic data samples. The source data and labels are synthetic images and corresponding labels. The target data and target labels are real crater images and labels. The source data, source labels, and target data are used to learn a classifier to predict target labels. A lunar crater simulation algorithm [102] is used for source data, i.e., synthetic data generation. The DA has three main components. First, encoder-decoder networks aim to preserve the local structure across domains. Second, a domain classifier aims to minimize the adversarial loss to learning domain invariant features for target and source domain data. It means that even if ground truth for the source dataset only is provided, the network will learn to detect craters from the domain invariant features of the target dataset since the domain invariant features of both source and target datasets will become similar. Finally, A multi-scale object detector detects craters from the domain invariant features.
Most research works using object detection CDAs have not published their code, making it challenging to replicate their work in a limited time frame. Also, object detection-based works are computationally expensive. Consequently, in this work, we have focused on implementing semantic segmentation-based approaches for crater detection. This approach is less computationally expensive and has shown promising outcomes in prior research. Nonetheless, we acknowledge the benefits of object detection-based CDAs and aim to implement them in future work to compare their performance with semantic segmentation-based CDAs.
V-C Classification Based CDAs
In a classification-based method, first, potential crater regions are found using non-deep learning methods such as sliding window and selective search [103]. Then these potential crater regions are trained on deep learning-based classification networks to classify crater and non-crater classes. Based on this method, we got a single paper, i.e., Emami et al. [80]. Emami et al. [80] first utilized Hough transform [104], highlight-shadow regions [105], convex grouping [106], and interest points [107] algorithms to find the potential craters locations and then utilize convolutional neural networks (CNNs) classification network to classify them into crater and non-crater. Three classification networks are used; first, two have two convolution layers and one fully connected layer, and the last has two convolution layers and three fully connected layers.
The classification-based method heavily relies on selected potential regions of the non-deep learning-based method. Hence, it is less effective than the deep learning-based method [25]. Therefore, most of the recent crater detection works are based on semantic segmentation and object detection-based methods.
V-D Evaluation Metrics:
Evaluation metrics are used for assessing the performance of CDAs. The primary metrics utilized by most of the CDAs are precision (P) and recall (R), which are calculated as follows [108, 109]:
where TP, FP, and FN are the total number of true positives, false positives, and false negatives, respectively. TP is the total number of matches between ground truth and CDA detections, FP is the number of craters detected by the CDA that are not present in the ground truth, and FN is the number of craters missed by the CDA that are present in the ground truth.
We observed that recall is defined as the ratio of the number of matches between ground truth and CDA detections divided by the total annotated craters in the ground truth. The recall represents the percentage of ground truth craters identified by the CDA. A high recall indicates that there is a low chance that the CDA will miss a true crater (crater present in ground truth). Therefore, recall can be defined as the probability that CDA will identify a true crater.
Similarly, precision is defined as the ratio of the total number of matches between ground truth and CDA detection divided by the total number of craters detected by the CDA. The percentage of CDA predictions that are true craters is represented by precision. The higher the precision, the less likely the CDA will incorrectly identify a non-crater feature as a crater. Thus, precision can be defined as the probability that the CDA prediction is correct.
We can analyze the CDA’s performance based on recall and precision in four scenarios. First, low precision and recall imply that CDA misses most true craters, and detections are also incorrect; hence, it has no practical use. Second, high precision and high recall imply an ideal CDA that correctly detects all ground-truth craters. The third and fourth cases, i.e., high precision and low recall; low recall and high precision, commonly occur in most CDAs. If precision is low, it means many false craters are detected, and if the recall is low, many true craters are missed. Therefore, to give a better idea of the overall performance of a CDA, a harmonic mean of precision and recall, known as the -score calculated as:
where P, R denotes precision and recall, respectively.
When the -score is high, it indicates that both precision and recall are high, but when the -score is lower, it indicates a greater disparity in precision and recall.
In application-specific tasks such as automatic rover landing on hazardous surfaces, we prioritize recall over precision because we cannot afford to miss any crater on the lunar surface, which may lead to a rover accident. In such cases, entirely relying on the -score is not a good choice. Additionally, we can prioritize recall over precision when the catalog used for evaluating CDA is incomplete, i.e., many craters are unmarked in the catalog. That causes low precision if CDA detects new craters. Therefore, to place a greater emphasis on recall, -score is calculated as follows:
Finally, in order to assess the network’s accuracy in predicting crater size and location, we compute the median fractional errors in latitude, longitude, and radius, which are calculated as follows:
where , and represent each crater’s longitude, latitude, and radius, respectively. The subscripts P and G denote predicted and ground-truth measures, respectively.
V-E Discussion
The working mechanisms of the three CNNs, semantic segmentation, classification, and object detection, are different. They can all be used in suitable pipelines to perform the task of crater detection. In classification-based methods, first potential crater regions are estimated using traditional algorithms such as selective search [103], and then a deep learning-based classification network is used to classify the potential regions into craters and non-craters. It is simpler in structure and easy to implement relative to other categories of crater detection methods, i.e., object detection-based and semantic segmentation-based approaches.
Semantic segmentation-based CDAs segment the image to the crater and non-crater regions. This method provides detailed shape information on the craters. Finally, a template-matching algorithm is used to extract the craters’ location and size information. In this approach, images need not be pre-processed to extract the potential crater regions from images like in classification-based crater detection methods. Also, semantic segmentation architectures have a simpler framework that needs to process the image only in one step to get the segmented image compared to object detection-based methods, which need to process one image in multiple steps to extract craters.
Object detection-based CDAs utilize object detection DNNs to give the location and size information of the craters. The object detection-based methods eliminate the need for pre-processing and post-processing steps, which are needed in classification-based and semantic segmentation-based CDAs. The semantic segmentation-based approach provides a precise shape of craters, while the object detection-based approach provides a precise location of the craters. In the future, to utilize the advantage of both, an instance segmentation-based approach can be used to get the precise shape as well as location and size information of the craters. A recent work by Tewari et al. [110] has made progress in this direction.
VI Datasets
| Number of Images | ||||||||||||||
| Paper | Region studied | Dataset | Resolution | Catalog | Craters in Catalog | Image size (pixels) | Train | Validation | Test | Detected Diameter Range | ||||
| Chen et al. [67] 2021 | Moon Latitude: -60° to 60° Longitude: 0° to 360° | LRO DEM | 512 pixels/degree | Head et al., Povilaitis et al. | 24,523 | 256 x 256 | 30,000 | 5,000 | 5,000 | [30, inf) pixels | ||||
| Jia et al. [64] 2021 | Moon Latitude: -60° to 60° Longitude: 0° to 360° | LRO DEM | 512 pixels/degree | Head et al., Povilaitis et al. | 24,523 | 256 x 256 | 30,000 | 5,000 | 5,000 | [10 , 80] pixels | ||||
| Wang S. et al. [61] 2020 | Moon Latitude: -60° to 60° Longitude: 0° to 360° | LRO DEM | 512 pixels/degree | Head et al. Povilaitis et al. | 24,523 | 256 x 256 | 30,000 | 3,000 | 3,000 | [10 , 80] pixels | ||||
| Silburt et al. [23] 2019 | Moon Latitude: -60° to 60° Longitude: 0° to 360° | LRO DEM | 512 pixels/degree | Head et al., Povilaitis et al. | 24,523 | 256 x 256 | 30,000 | 30,000 | 30,000 | [10 , 80] pixels | ||||
| Mao et al. [56] 2022 | Moon Latitude: -60° to 60° Longitude: -180° to 180° | LRO DEM LRO WAC | DEM: 512 pixels/degree, Optical: 303.23 pix/deg | Head et al., Povilaitis et al. | 24,523 | 256 x 256 | 15,000 | 5,000 | 5,000 | [10 , 80] pixels | ||||
| Lee et al. [62] 2021 | Mars | DTM THEMIS Daytime IR | DTM: 200 m/pixel IR: 100 m/pixel | Robbins and Hynek | 3,84,343 | 256 x 256 | 40,000 | 10,000 | - | [10 , 80] pixels | ||||
| Lee C. [58] 2019 | Mars | DTM | 200 m/pixel | Robbins and Hynek | 3,84,343 | 256 x 256 | 25,000 | 5,000 | 25,000 | [10 , 80] pixels | ||||
| DeLatte et al. [60] 2019 | Mars Latitude: -30° to 30° Longitude: 0° to 360° | THEMIS Daytime IR | 256 pixels/degree | Robbins and Hynek | 3,84,343 | 512 x 512 | - | - | - | [4 , 64] km | ||||
| Jia Y. et al. [74] 2021 | Moon: Latitude: -65° to 65° Longitude: -180° to 180° Mercury: Latitude: -90° to 90° Longitude: 0° to 360° Mars: Latitude: -90° to 90° Longitude: 0° to 360° | CE-1 DOM, LRO DEM, Mercury MESSENGER Global DEM , Mars HRSC and MOLA Blended Global DEM | CE-1 DOM: 120 m/pixel LRO DEM: 59 m/pixel Mercury DEM: 665 m/pixel Mars DEM: 200 m/pixel | IAU | CE1: 4800 x 4800, 1200 x 1200 SLDEM: 1000 x 1000 | 8,000 | 1,000 | 1,000 | [0.6 , 860] km | |||||
| Yang H. et al. [78] 2021 | Moon, Latitude: -45° to 46° Longitude: -176.4° to 178.8° | LRO NAC | 1.5 m/pixel | Manually Marked | >20,000 | 256 x 256 | 12 | 8 | [12 , 400] m | |||||
| Yang S. et al. [77] 2021 | Mars, Entire surface Moon, Entire surface | MDCD LRNAOC | MDCD: 256 pixels/degree LRNAOC: 1 m/pixel | Manually Marked | 12,000 | - | 400 | 100 | [6, 250] pixels | |||||
| Zang et al. [73] 2021 | Moon, Entire surface | CE-2 DOM | 7 m/pixel | Manually Marked | 41, 614 | 512 x 512 | 4,000 | 1,000 | < 1 km | |||||
| Hsu et al. [72] 2021 | Mars, Entire surface | THEMIS Daytime IR | 100 m/pixel | Robbins and Hynek | 3,84,343 | - | 46,288 | 46,287 | [10 , 270] pixels | |||||
| Yang et al. [70] 2020 | Moon Latitude: -65° to 65° Longitude: 0° to 360° | CE-1 DOM CE-2 DEM | CE-1: 120 m/pixel CE-2: 50 m/pixel | IAU | - | CE1: 5000 x 5000, 1000 x 1000 CE2: 1000 x 1000 | 5,682 | 1,422 | 791 | [0.9, 532) km | ||||
| Ali-Dib et al. [68] 2020 | Moon Latitude: -60° to 60° Longitude: 0° to 360° | LRO DEM | 59 m/pixel | Head et al., Povilaitis et al. | 24,523 | 512 x 512 | 1,980 | 70 | [5 , 125] km | |||||
| Lin et al. [9] 2022 | Moon Latitude: -65° to 65° Longitude: 0° to 360° | LRO DEM | 512 pixels/degree | Head et al., Povilaitis et al. | 24,523 | 512 x 512 | 17,745 | < 50 km | ||||||
|
Moon, region unspecified | LRO NAC | 1 m/pixel |
|
- | 600 x 400 | 400 | 178 | [10, 100] m | |||||
This section provides an overview of the datasets used for implementing deep learning (DL) based CDAs, along with their comparison in Table V. It provides information such as the region studied, resolution, and image size used for training DL-based CDAs. The most commonly used catalog for lunar surface is the combined catalog of Head et al. [15] and Povilitis et al. [57], and for Martian surfaces, Robbins & Hynek [59] catalog. The combined catalog of Head et al. and Povilitis et al. contains craters with diameter size km, whereas Robbins & Hynek catalog contains craters with a diameter size km. Some researchers used the IAU catalog to mark the lunar surface craters, including Yang C. et al. [70] and Jia et al. [74]. Unlike others, Yang H. et al. [78], Yang S. et al. [77] and Zang et al. 2021 [73] marked the craters manually and used for the training and testing purpose. Detailed information of the existing catalogs used in DL based CDAs was provided in Table VI. Most CDAs have used image sizes pixels or for training the DL framework. A detailed summary of data utilized for crater detection is provided in Table VII; it can be observed that most deep learning methods used DEM data for crater detection.
VI-A Description of Catalogs used for Training Deep Learning based CDAs
| Surface | Catalog | Craters |
|
|
|
|
||||||||
| Moon |
|
9,137 | (0, ) | - | - | Manual | ||||||||
| Moon |
|
5,185 | [20, ) | LRO DEM | 474 | Manual | ||||||||
| Moon |
|
22,746 | [5, 20] |
|
100 | Manual | ||||||||
| Moon |
|
1,296,879 | [1, ) |
|
|
Manual | ||||||||
| Mars |
|
3,84,343 | [1, ) |
|
|
Manual | ||||||||
| Mars |
|
1,32,843 | [2, ) |
|
- |
|
||||||||
| ∗: http://host.planet4589.org/astro/lunar/ | ||||||||||||||
The attempt to produce a complete lunar crater catalog can be traced back to when Anderson and Whitaker [112] published their lunar catalog of craters. This catalog includes all craters identified by the IAU prior to mid-, and the remaining craters are all manually marked. This catalog has been approved by NASA and is referred to as the NASA-RP- catalog or the AW catalog. An updated version of this catalog containing additional craters identified by IAU is available at 333http://host.planet4589.org/astro/lunar/ and is commonly referred to as the IAU catalog. This latest update brings the total number of craters in the catalog to . It includes the craters’ name, longitude, latitude, and diameter value.
The Head et al. [15] catalog contains manually marked craters with a diameter greater than km. This catalog attempts to list all visible craters that exhibit a measurable rim and visible central depression. DEMs obtained from the lunar orbiter laser altimeter (LOLA), which was present onboard the lunar reconnaissance orbiter (LRO), were used for marking the craters. The CraterTools extension to ArcMap has been used for measuring the diameter of each crater.
The Povilaitis et al. [57] catalog contains a total of craters with a diameter ranging from km to km. The CraterTools extension in ArcGIS was utilized. Craters that have been buried by mares that are barely visible referred to as ghost craters [49] are excluded. The basemaps used for crater identification are given as follows: first, LROC wide angle camera (WAC) monochrome ( nm) mosaic that has a average solar incidence and a resolution of m/pixel [57], and second, a shaded relief map was created by merging LROC WAC digital terrain model (DTM) (GLD100 [113]) and LOLA polar DTM ( to N and S) [114].
The Robbins catalog [14] contains a total of craters, of which have diameters greater than km. This catalog has been marked in two steps; in the first step, the WAC “morphologic” mosaic made by the LROC with an average solar inclination of was used. The mosaics obtained from WAC at “dawn” and “dusk” were also used, but because the sun is at the horizon at these times, the smaller craters are obscured by shadows. In the second step, LOLA gridded data record (LOLA GDR), and a merged TC DTM and LOLA mosaic [83] are used to mark craters that were missed due to not being visible in the first step. While marking craters in this catalog, the following assumptions were made: 1) Any lunar feature that appears to have a quasi-circular shape has been marked as a crater; this assumption was made because other geological processes that form circular depressions on the moon are uncommon, and 2) Craters that appeared to be highly elliptical, with a cusp on both sides of the crater rim roughly in the middle of a long axis, were classified as two separate craters and not as one highly elliptical crater. The craters were marked using ArcMap software, and the basemaps used for crater identification were obtained from the following sources: LRO Camera’s (LROC) WAC [34], LRO’s LOLA [114], and terrain camera (TC) on SELENE [115]. The liberal marking of craters causes the Robbins catalog to have comparatively higher craters than other lunar catalogs. However, it is argued in Ali-Dib et al. [68] that there is a high possibility for features to be falsely marked as craters.
Robbins and Hynek [59] published a statistically complete catalog of manually identified Martian craters with diameter greater than km. This catalog lists craters, with morphometric information for each crater provided if possible. Two searches were conducted to identify the craters, the first search with THEMIS daytime IR mosaics [116] ( m/pixel) and Viking Map ( m/pixel at the equator), and the second search with MOLA images [117, 118] ( m/pixel).
The MA132843GT [111] catalog is a hybrid catalog (utilizing both manual and automatic crater detection approaches) that has been generated by step-by-step improvements to the Martian catalog MA57633GT [119]. MA57633GT is itself a combination of five manually marked catalogs: Barlow et al. 444http://webgis.wr.usgs.gov/mars.htm, Rodionova et al. 555http://selena.sai.msu.ru/Home/Mars_Cat/Mars_Cat.htm, Kuzmin 666http://www.marscraterconsortium.nau.edu/, Boyce et al. [120], and [121]. To generate the MA13283GT catalog from the MA57633GT catalog following steps are taken. First, craters are added to this catalog using a traditional CDA on MOLA data resulting in the MA115225GT catalog [122]. Second, Salamuniccar et al. 2011b [123] extended the MA115225GT catalog using Salamuniccar and Loncaric, 2010a [122] CDA, Bandeira et al. [124] CDA, and the MA75919T catalog generated using the Stepinski and Urbach CDA [125]. That resulted in the formation of the MA130310GT catalog. Finally, an improved version of Salamuniccar and Loncaric [122] CDA was utilized to get the final MA132843GT catalog.
| Surface | Mosaic | Data Type | Resolution (meter/pixel) | Spacecraft | Instrument | ||||||||||
| Moon | LRO WAC [34] | Optical | 100 |
|
|
||||||||||
| Moon | LRO LOLA [114] | DEM | 59 | LRO |
|
||||||||||
| Moon | LRO NAC [34] | DEM | 1.5 | LRO |
|
||||||||||
| Moon | CE-1 DOM [126] | DOM | 120 | CE-1 |
|
||||||||||
| Moon | CE-2 DOM [126] | DOM | 7 | CE-2 | CCD | ||||||||||
| Moon | CE-2 DEM [126] | DEM | 50 | CE-2 | CCD | ||||||||||
| Mars |
|
DTM | 200 |
|
|
||||||||||
| Mars |
|
|
100 | Mars odyssey |
|
||||||||||
| Mars |
|
|
230 | Mars odyssey | THEMIS |
VI-B Description of Data used for Training Deep Learning based CDAs
The LRO LOLA DEM mosaic covers the complete longitudinal span of the lunar surface and latitude from 60∘ north to 60∘ south. This DEM was constructed by the LOLA and Kaguya teams from data obtained from the LOLA onboard LRO [114, 83]. The co-registered data from the SELENE terrain camera was used to correct orbital and pointing geolocation errors. This DEM has a resolution of 512 pixels/degree (59m/pixel) at the equator with a vertical accuracy between 3 to 4 m. More details of the construction of this DEM mosaic can be found at 777https://www.usgs.gov/media/images/lro-lola-and-kaguya-terrain-camera-dem-merge-60n60s-512ppd.
The lunar reconnaissance orbiter camera (LROC) [34] consisted of three cameras, one wide angle camera (WAC) and two narrow angle cameras (NACs). The WAC contains five filters that capture images in the visible wavelength, i.e., 415, 565, 605, 645, and 690 nm and two filters that capture images in the ultraviolet wavelength, i.e., 320 and 360 nm. The WAC captured overlapping images with a resolution of 100 m/pixel. The NAC captured optical images with a very high resolution of up to 0.5 m/pixel, which are useful for detecting small craters.
The missions Chang’E-1 and Chang’E-2 both had a charged coupled device (CCD) stereo camera and a laser altimeter [126]. The CCD camera of Chang’E-1 captured the grayscale images of the lunar surface from north to south latitude at a resolution of 120 m/pixel. The laser altimeter data of Chang’E-1 of a resolution of 500 m/pixel was used to obtain a DEM model of the lunar surface. The DOM images with the highest resolution of 7 m/pixel covering the entire lunar surface have been obtained from the Chang’E-2 CCD camera.
Themis Day IR Global Mosaic of the Martian surface (Version 2.0) tiles released on November 16, 2006 cover the entire planetary surface with a resolution of 256 pixels per degree (230 m/pixel) and can be accessed at 888https://www.mars.asu.edu/data/thm_dir/. Each tile covers in the latitudinal and longitudinal direction and the total size of all the available images is pixels. An updated version of Themis Daytime Infrared mosaic (version 12) with a resolution of 100 m/pixel [128] was released in the year 2014 and can be downloaded from 999https://astrogeology.usgs.gov/search/map/Mars/Odyssey/THEMIS-IR-Mosaic-ASU/Mars_MO_THEMIS-IR-Day_mosaic_global_100m_v12.
The Martian DEMs captured by altimeters such as MOLA have a fairly low resolution of m/pixels compared to the lunar DEMs having a resolution of m/pixel [126]. In an attempt to increase the spatial resolution of Martian DEMs, a blended martian DEM mosaic with a resolution of 200 m/pixel was created by combining data obtained from MOLA (463 m/pixel) and high-resolution stereo camera (HRSC) aboard the Mars express (MEX) spacecraft of the European space agency [129] [130]. The HRSC produces multicolor optical images with 10 m/pixel resolution. The three-dimensional nature of images produced by the HRSC makes it possible to derive high-resolution DEMs from the HRSC images with a resolution of around 50 m/pixel. The MOLA DEMs were upsampled, the HRSC DEMs were downsampled to an intermediate resolution of 200 m/pixel, and a blended DEM mosaic was created. The generated mosaic is a hybrid mosaic which is available at 101010https://astrogeology.usgs.gov/search/map/Mars/Topography/HRSC_MOLA_Blend/Mars_HRSC_MOLA_BlendDEM_Global_200mp_v2.
VII Future Direction
VII-A Handling less annotated data
Deep learning algorithms typically perform better with large amounts of data. However, annotating millions of craters is a cumbersome and error-prone task. There is a high degree of disagreement among experts about what constitutes a crater. According to Robbins et al. [16], approximately 45% of experts disagree on what constitutes a crater. Therefore an adequate approach is required to deal with this scenario. One approach is to annotate a small number of highly certain samples of crater samples for training the deep learning algorithm and then increase the number of annotations using a semi-supervised approach. For example, Zang et al. [73] propose a two-teachers self-training with noise (TTSN) method to increase the number of labeled craters in the training dataset. Recently, numerous semi-supervised techniques [131, 132, 133, 134, 135, 136] have been developed; these can be used in the future for crater detection.
VII-B Parameter/Hyper-parameter tuning
Most researchers focus primarily on modifying the existing state-of-the-art architectures by introducing additional new layers to increase the depth of the architecture or by adding skip connections to preserve spatial features and other architectural constituents. However, less attention is paid to hyper-parameter tuning. Some examples of such hyper-parameters include learning rate, number of filters in convolutional layers, and kernel size. However, sub-optimal hyper-parameters may result in the model failing to converge and not properly minimizing the loss function, resulting in sub-optimal performance. On the other hand, choosing optimal hyper-parameters can improve performance drastically. For example, in Table II, a DeLatte et al. [60] based architecture with no skip or dense connections in the encoder and decoder blocks is comparable to a more complex architecture having residual and/or dense connections in the encoder and decoder blocks. Therefore, it is worthwhile to look into hyper-parameter tuning before proposing significant architectural changes.
VII-C Accurate shape extraction of the craters
Most recent work depicts craters as circular shapes; however, this may not be the exact shape of the craters. Figure 1 shows examples of crater shape variations on the lunar surface. Precisely extracting the shape of the craters can aid in understanding many scientific discoveries. For example, the geometry of craters can be used to visualize the degradation state of craters. If their rims are correctly identified, it is possible to precisely calculate craters’ mean diameter, depth, and morphometric characteristics. Additionally, it can help with studies that use morphometric data to classify craters [137, 138, 139, 140, 141]. In previous studies, crater depth and diameter were the most commonly used metrics to define crater morphology and shape. On the other hand, the complex shape of the crater cannot be adequately captured by these two simple metrics measurements. Therefore, future research should also focus on developing deep learning based crater shape retrieval methods.
VII-D Fair comparison
A typical CDA pipeline consists of the following steps: data generation, pre-processing, deep learning architecture, and post-processing. The specifications selected in the step-by-step process have a significant impact on the performance of the CDA. When a specific work compares its entire CDA pipeline to the state-of-the-art (SOTA) work, some factors must be considered carefully. For example, the region selected in CDA and SOTA should be the same; then, only we can say with certainty that the performance improvement of CDA is due to the proposed pipeline and not specific to the study region. Similarly, we cannot compare one CDA pipeline that detects craters in the 1 to 5 km range to another that detects craters in the 15 to 20 km range. Such a comparison is unfair because the pipeline for detecting craters in the 1 to 5 km range may have been designed primarily for small craters. Therefore, the testing region and diameter range chosen in the proposed CDA pipeline and SOTA must be the same.
On the other hand, if a paper claims that the proposed deep learning architecture performs better than existing works, then the data generation, pre-processing, and post-processing steps involved in the compared CDA pipelines must be the same. When comparing the effectiveness of deep-learning architectures, it is critical to use the same dataset for training and testing; otherwise, the results may be misleading. For example, if we utilize pixels size images for one architecture and pixels size images for the other. In such cases, the performance variation may be due to a change in the image size and not necessarily due to modification or novelty in the architecture. Therefore, when comparing deep learning architectures in the crater detection process, factors such as the diameter range, training region, number of training images and craters, image resolution, image size feed into the DL architecture, and post-processing parameters must be the same. From here, we can observe that when we compare deep-learning-based architectures, we need a standard dataset with specified samples for training, validation, and testing. We attempted to do so, and now researchers can validate their proposed deep-learning-based architecture in a lunar surface on a single dataset for comparison if their research focuses on detecting craters ranging in size from 5 to 20 km. However, more research work is needed in this direction.
VII-E Performance evaluation with respect to particular metrics is misleading
The evaluation of CDA performance using only a single metric may not always be fair. For example, in the case of more conservative catalogs, such as the Head et al. [15] and Povilitis et al. catalog [57] on the lunar surface, a single metric, such as the -score, may be misleading. Many craters are missing in this catalog, so even if the algorithm detects an actual crater, it will be considered a false positive, resulting in low precision and a low -score. Similarly, Robbins catalog [14] has liberally marked the crater on the lunar surface and contains many degraded craters that may be falsely positive; training with such data can confuse the CDA, which is undesirable. Tewari et al. [55] attempted to solve the problem of the unmarked crater on the catalog by validating it against another catalog. However, an appropriate procedure is required to evaluate the performance of the different CDA algorithms. Depending on the application, researchers may emphasize recall over precision and vice versa.
VII-F Difficulty in reproducibility
Incomplete information makes it difficult to replicate the results of existing SOTA. The researchers should be able to easily replicate a research work, which helps to move the research fast. To avoid the reproducibility problem in CDAs, some important factors, such as detection range in meter and pixel coordinates, spatial resolution, image size fed to the deep learning framework, train-test region, and the number of images and craters used for training and testing need to be provided. Also, in the deep learning framework, information such as learning rate, epochs, optimizer, loss function, and batch size need to be provided. In addition, the code and data must be made publicly available to the research community in order to accelerate the research process and allow researchers to validate their methods on a single data set for a fair comparison.
VIII Conclusion
Deep learning (DL) based crater detection methods have gained popularity in recent years due to their ability to learn features on their own and have good generalization capability. We have reviewed the DL-based crater detection algorithms (CDAs) and explained the challenges, key characteristics, methods, and datasets used for crater detection. We have categorized the DL-based CDAs into three categories: (i) Semantic segmentation, (ii) Object detection, and (iii) Classification. Additionally, Semantic segmentation-based CDAs are trained and tested on a common dataset. Common dataset helps to perform fair comparisons in different DL architectures. Finally, we have identified and presented many open issues crucial for crater detection and suggested several promising future directions for developing better crater detection approaches. In our future works, we plan to explore the implementation of object detection-based CDAs to gain an empirical understanding of their performance.
Acknowledgment
This material is based upon work partially supported by the Indian Space Research Organisation (ISRO), Department of Space, Government of India under the Award number ISRO/SSPO/Ch-1/2016-17. Atal Tewari is supported by TCS Research Scholarship. Any opinions, findings, and conclusions or recommendations expressed in this material are those of the author(s) and do not necessarily reflect the views of the funding agencies. Address all correspondence to Nitin Khanna at nitin@iitbhilai.ac.in.
References
- [1] Jitendra Nath Goswami and Mylswamy Annadurai. Chandrayaan-2 mission. In 42nd Annual Lunar and Planetary Science Conference, number 1608, page 2042, 2011.
- [2] Richard W Zurek and Suzanne E Smrekar. An overview of the mars reconnaissance orbiter (mro) science mission. Journal of Geophysical Research: Planets, 112(E5), 2007.
- [3] Long Xiao, Yuqi Qian, Qian Wang, and Qiong Wang. The chang’e-5 mission. In Sample return missions, pages 195–206. Elsevier, 2021.
- [4] Augustin Chicarro, Patrick Martin, and R Trautner. The mars express mission: an overview. Mars Express: the scientific payload, 1240:3–13, 2004.
- [5] Manabu Kato, Susumu Sasaki, Yoshisada Takizawa, and Kaguya Project Team. The Kaguya mission overview. Space science reviews, 154:3–19, 2010.
- [6] Robert G Strom, Renu Malhotra, Takashi Ito, Fumi Yoshida, and David A Kring. The origin of planetary impactors in the inner solar system. Science, 309(5742):1847–1850, 2005.
- [7] Caleb I Fassett. Analysis of impact crater populations and the geochronology of planetary surfaces in the inner solar system. Journal of Geophysical Research: Planets, 121(10):1900–1926, 2016.
- [8] Kosei Toyokawa, Junichi Haruyama, Naoyuki Hirata, Sayuri Tanaka, and Takahiro Iwata. Kilometer-scale crater size-frequency distributions on ceres. Icarus, 377:114909, 2022.
- [9] Xuxin Lin, Zhenwei Zhu, Xiaoyuan Yu, Xiaoyu Ji, Tao Luo, Xiangyu Xi, Menghua Zhu, and Yanyan Liang. Lunar crater detection on digital elevation model: A complete workflow using deep learning and its application. Remote Sensing, 14(3):621, 2022.
- [10] DONALD E Gault. Impact cratering. A primer in lunar geology, pages 137–175, 1974.
- [11] Susan Werner Kieffer and Charles H Simonds. The role of volatiles and lithology in the impact cratering process. Reviews of Geophysics, 18(1):143–181, 1980.
- [12] Qiangyi Liu, Weiming Cheng, Guangjian Yan, Yunliang Zhao, and Jianzhong Liu. A machine learning approach to crater classification from topographic data. Remote Sensing, 11(21):2594, 2019.
- [13] Meng Yu, Hutao Cui, and Yang Tian. A new approach based on crater detection and matching for visual navigation in planetary landing. Advances in Space Research, 53(12):1810–1821, 2014.
- [14] Stuart J Robbins. A new global database of lunar impact craters> 1–2 km: 1. crater locations and sizes, comparisons with published databases, and global analysis. Journal of Geophysical Research: Planets, 124(4):871–892, 2019.
- [15] James W Head, Caleb I Fassett, Seth J Kadish, David E Smith, Maria T Zuber, Gregory A Neumann, and Erwan Mazarico. Global distribution of large lunar craters: Implications for resurfacing and impactor populations. science, 329(5998):1504–1507, 2010.
- [16] Stuart J Robbins, Irene Antonenko, Michelle R Kirchoff, Clark R Chapman, Caleb I Fassett, Robert R Herrick, Kelsi Singer, Michael Zanetti, Cory Lehan, Di Huang, et al. The variability of crater identification among expert and community crater analysts. Icarus, 234:109–131, 2014.
- [17] Jung Rack Kim, Jan-Peter Muller, Stephan van Gasselt, Jeremy G Morley, and Gerhard Neukum. Automated crater detection, a new tool for mars cartography and chronology. Photogrammetric Engineering & Remote Sensing, 71(10):1205–1217, 2005.
- [18] Ricardo Martins, Pedro Pina, Jorge S Marques, and Margarida Silveira. Crater detection by a boosting approach. IEEE Geoscience and Remote Sensing Letters, 6(1):127–131, 2009.
- [19] Lourenço Bandeira, Wei Ding, and Tomasz F Stepinski. Detection of sub-kilometer craters in high resolution planetary images using shape and texture features. Advances in Space Research, 49(1):64–74, 2012.
- [20] Tomasz F Stepinski, Michael P Mendenhall, and Brian D Bue. Machine cataloging of impact craters on Mars. Icarus, 203(1):77–87, 2009.
- [21] Satoru Yamamoto, Tsuneo Matsunaga, Ryosuke Nakamura, Yasuhito Sekine, Naru Hirata, and Yasushi Yamaguchi. Rotational pixel swapping method for detection of circular features in binary images. IEEE Transactions on Geoscience and Remote Sensing, 53(2):710–723, 2015.
- [22] Yi Zhou, Hao Zhao, Min Chen, Jie Tu, and Long Yan. Automatic detection of lunar craters based on DEM data with the terrain analysis method. Planetary and Space Science, 160:1–11, 2018.
- [23] Ari Silburt, Mohamad Ali-Dib, Chenchong Zhu, Alan Jackson, Diana Valencia, Yevgeni Kissin, Daniel Tamayo, and Kristen Menou. Lunar crater identification via deep learning. Icarus, 317:27–38, 2019.
- [24] Wenwen Li, Bin Zhou, Chia-Yu Hsu, Yixing Li, and Fengbo Ren. Recognizing terrain features on terrestrial surface using a deep learning model: An example with crater detection. In Proceedings of the 1st Workshop on Artificial Intelligence and Deep Learning for Geographic Knowledge Discovery, GeoAI ’17, page 33–36, New York, NY, USA, 2017. Association for Computing Machinery.
- [25] Shaoqing Ren, Kaiming He, Ross Girshick, and Jian Sun. Faster R-CNN: Towards real-time object detection with region proposal networks. Advances in neural information processing systems, 28, 2015.
- [26] Jianfeng Wang, Lin Song, Zeming Li, Hongbin Sun, Jian Sun, and Nanning Zheng. End-to-end object detection with fully convolutional network. In Proceedings of the IEEE/CVF conference on computer vision and pattern recognition, pages 15849–15858, June 2021.
- [27] Nicolas Carion, Francisco Massa, Gabriel Synnaeve, Nicolas Usunier, Alexander Kirillov, and Sergey Zagoruyko. End-to-end object detection with transformers. In Computer Vision – ECCV 2020, pages 213–229, Cham, 2020. Springer International Publishing.
- [28] Xiyang Dai, Yinpeng Chen, Jianwei Yang, Pengchuan Zhang, Lu Yuan, and Lei Zhang. Dynamic DETR: End-to-end object detection with dynamic attention. In Proceedings of the IEEE/CVF International Conference on Computer Vision, pages 2988–2997, October 2021.
- [29] Olaf Ronneberger, Philipp Fischer, and Thomas Brox. U-net: Convolutional networks for biomedical image segmentation. In International Conference on Medical image computing and computer-assisted intervention, pages 234–241, Cham, 2015. Springer International Publishing.
- [30] Ke Sun, Bin Xiao, Dong Liu, and Jingdong Wang. Deep high-resolution representation learning for human pose estimation. In Proceedings of the IEEE/CVF Conference on Computer Vision and Pattern Recognition, pages 5693–5703, June 2019.
- [31] Jun Fu, Jing Liu, Jie Jiang, Yong Li, Yongjun Bao, and Hanqing Lu. Scene segmentation with dual relation-aware attention network. IEEE Transactions on Neural Networks and Learning Systems, 32(6):2547–2560, 2020.
- [32] Ho Kei Cheng, Jihoon Chung, Yu-Wing Tai, and Chi-Keung Tang. CascadePSP: Toward class-agnostic and very high-resolution segmentation via global and local refinement. In Proceedings of the IEEE/CVF Conference on Computer Vision and Pattern Recognition, pages 8890–8899, June 2020.
- [33] DM DeLatte, Sarah T Crites, N Guttenberg, and T Yairi. Automated crater detection algorithms from a machine learning perspective in the convolutional neural network era. Advances in Space Research, 64(8):1615–1628, 2019.
- [34] MS Robinson, SM Brylow, M Tschimmel, D Humm, SJ Lawrence, PC Thomas, BW Denevi, E Bowman-Cisneros, J Zerr, MA Ravine, et al. Lunar reconnaissance orbiter camera (LROC) instrument overview. Space science reviews, 150(1):81–124, 2010.
- [35] Mohammad Nazari-Sharabian, Mohammad Aghababaei, Moses Karakouzian, and Mehrdad Karami. Water on mars—a literature review. Galaxies, 8(2):40, 2020.
- [36] Paul O Hayne, Amanda Hendrix, Elliot Sefton-Nash, Matthew A Siegler, Paul G Lucey, Kurt D Retherford, Jean-Pierre Williams, Benjamin T Greenhagen, and David A Paige. Evidence for exposed water ice in the moon’s south polar regions from lunar reconnaissance orbiter ultraviolet albedo and temperature measurements. Icarus, 255:58–69, 2015.
- [37] Henrik Hargitai, Konrad Willner, and Trent Hare. Fundamental frameworks in planetary mapping: A review. Planetary Cartography and GIS, pages 75–101, 2019.
- [38] JH Waite Jr, RS Perryman, ME Perry, KE Miller, J Bell, TE Cravens, CR Glein, J Grimes, M Hedman, J Cuzzi, et al. Chemical interactions between saturn’s atmosphere and its rings. Science, 362(6410):eaat2382, 2018.
- [39] S James, Saranya R Chandran, M Santosh, AP Pradeepkumar, MN Praveen, and KS Sajinkumar. Meteorite impact craters as hotspots for mineral resources and energy fuels: a global review. Energy Geoscience, 3(2):136–146, 2022.
- [40] Gerhard Neukum, Boris A Ivanov, and William K Hartmann. Cratering records in the inner solar system in relation to the lunar reference system. In Chronology and Evolution of Mars: Proceedings of an ISSI Workshop, 10–14 April 2000, Bern, Switzerland, pages 55–86. Springer, 2001.
- [41] Anezina Solomonidou, Catherine Neish, Athena Coustenis, Michael Malaska, Alice Le Gall, Rosaly MC Lopes, Alyssa Werynski, Y Markonis, Kenneth Lawrence, N Altobelli, et al. The chemical composition of impact craters on titan-i. implications for exogenic processing. Astronomy & Astrophysics, 641:A16, 2020.
- [42] Lu Pan, Bethany L Ehlmann, John Carter, and Carolyn M Ernst. The stratigraphy and history of mars’ northern lowlands through mineralogy of impact craters: A comprehensive survey. Journal of Geophysical Research: Planets, 122(9):1824–1854, 2017.
- [43] Tao Zhang, Yiteng Li, Yin Chen, Xiaoyu Feng, Xingyu Zhu, Zhangxing Chen, Jun Yao, Yongchun Zheng, Jianchao Cai, Hongqing Song, and Shuyu Sun. Review on space energy. Applied Energy, 292:116896, 2021.
- [44] Richard J Pike. Size-dependence in the shape of fresh impact craters on the moon. In Impact and explosion cratering: Planetary and terrestrial implications, pages 489–509, 1977.
- [45] Thomas A Mutch. Geology of the moon: a stratigraphic view, volume 1382. Princeton University Press, 2015.
- [46] Erwan Martin and Ilya Bindeman. Mass-independent isotopic signatures of volcanic sulfate from three supereruption ash deposits in lake tecopa, california. Earth and Planetary Science Letters, 282(1-4):102–114, 2009.
- [47] Herbert Frey. Martian canyons and african rifts: Structural comparisons and implications. Icarus, 37(1):142–155, 1979.
- [48] Desiree E Stuart-Alexander and Keith A Howard. Lunar maria and circular basins—a review. Icarus, 12(3):440–456, 1970.
- [49] Don E Wilhelms, John F McCauley, and Newell J Trask. The geologic history of the moon. Technical report, 1987.
- [50] Nikita Agarwal, Athira Haridas, Nitin Khanna, Pradeep Srivastava, and Vikrant Jain. Study of morphology and degradation of lunar craters using chandrayaan–1 data. Planetary and Space Science, 167:42–53, 2019.
- [51] Ramiro Marco Figuera, Christian Riedel, Angelo Pio Rossi, and Vikram Unnithan. Depth to diameter analysis on small simple craters at the lunar south pole—possible implications for ice harboring. Remote Sensing, 14(3):450, 2022.
- [52] P. Mahanti, M.S. Robinson, T.J. Thompson, and M.R. Henriksen. Small lunar craters at the apollo 16 and 17 landing sites - morphology and degradation. Icarus, 299:475–501, 2018.
- [53] Mert Degirmenci and Shatlyk Ashyralyyev. Impact crater detection on mars digital elevation and image model. Middle East Technical University, 2010.
- [54] Juntao Yang and Zhizhong Kang. Bayesian network-based extraction of lunar impact craters from optical images and dem data. Advances in Space Research, 63(11):3721–3737, 2019.
- [55] Atal Tewari, Vinay Verma, Pradeep Srivastava, Vikrant Jain, and Nitin Khanna. Automated crater detection from co-registered optical images, elevation maps and slope maps using deep learning. Planetary and Space Science, 218:105500, 2022.
- [56] Yuqing Mao, Rongao Yuan, Wei Li, and Yijing Liu. Coupling complementary strategy to u-net based convolution neural network for detecting lunar impact craters. Remote Sensing, 14(3):661, 2022.
- [57] R.Z. Povilaitis, M.S. Robinson, C.H. van der Bogert, H. Hiesinger, H.M. Meyer, and L.R. Ostrach. Crater density differences: Exploring regional resurfacing, secondary crater populations, and crater saturation equilibrium on the moon. Planetary and Space Science, 162:41–51, 2018. Lunar Reconnaissance Orbiter – Seven Years of Exploration and Discovery.
- [58] Christopher Lee. Automated crater detection on mars using deep learning. Planetary and Space Science, 170:16–28, 2019.
- [59] Stuart J Robbins and Brian M Hynek. A new global database of mars impact craters 1 km: 1. database creation, properties, and parameters. Journal of Geophysical Research: Planets, 117(E5), 2012.
- [60] Danielle M DeLatte, Sarah T Crites, Nicholas Guttenberg, Elizabeth J Tasker, and Takehisa Yairi. Segmentation convolutional neural networks for automatic crater detection on mars. IEEE Journal of Selected Topics in Applied Earth Observations and Remote Sensing, 12(8):2944–2957, 2019.
- [61] Song Wang, Zizhu Fan, Zhengming Li, Hong Zhang, and Chao Wei. An effective lunar crater recognition algorithm based on convolutional neural network. Remote Sensing, 12(17):2694, 2020.
- [62] Christopher Lee and James Hogan. Automated crater detection with human level performance. Computers & Geosciences, 147:104645, 2021.
- [63] Zhengxin Zhang, Qingjie Liu, and Yunhong Wang. Road extraction by deep residual U-Net. IEEE Geoscience and Remote Sensing Letters, 15(5):749–753, 2018.
- [64] Yutong Jia, Lei Liu, and Chenyang Zhang. Moon impact crater detection using nested attention mechanism based unet++. IEEE Access, 9:44107–44116, 2021.
- [65] Zongwei Zhou, Md Mahfuzur Rahman Siddiquee, Nima Tajbakhsh, and Jianming Liang. UNet++: Redesigning skip connections to exploit multiscale features in image segmentation. IEEE transactions on medical imaging, 39(6):1856–1867, 2019.
- [66] Ozan Oktay, Jo Schlemper, Loic Le Folgoc, Matthew Lee, Mattias Heinrich, Kazunari Misawa, Kensaku Mori, Steven McDonagh, Nils Y Hammerla, Bernhard Kainz, et al. Attention U-Net: Learning where to look for the pancreas. arXiv preprint arXiv:1804.03999, 2018.
- [67] Siyuan Chen, Yu Li, Tao Zhang, Xingyu Zhu, Shuyu Sun, and Xin Gao. Lunar features detection for energy discovery via deep learning. Applied Energy, 296:117085, 2021.
- [68] Mohamad Ali-Dib, Kristen Menou, Alan P Jackson, Chenchong Zhu, and Noah Hammond. Automated crater shape retrieval using weakly-supervised deep learning. Icarus, 345:113749, 2020.
- [69] Kaiming He, Georgia Gkioxari, Piotr Dollár, and Ross Girshick. Mask R-CNN. In Proceedings of the IEEE international conference on computer vision, pages 2961–2969, Oct 2017.
- [70] Chen Yang, Haishi Zhao, Lorenzo Bruzzone, Jon Atli Benediktsson, Yanchun Liang, Bin Liu, Xingguo Zeng, Renchu Guan, Chunlai Li, and Ziyuan Ouyang. Lunar impact crater identification and age estimation with chang’e data by deep and transfer learning. Nature Communications, 11(1):1–15, 2020.
- [71] Jifeng Dai, Yi Li, Kaiming He, and Jian Sun. R-fcn: Object detection via region-based fully convolutional networks. Advances in neural information processing systems, 29, 2016.
- [72] Chia-Yu Hsu, Wenwen Li, and Sizhe Wang. Knowledge-driven geoai: Integrating spatial knowledge into multi-scale deep learning for mars crater detection. Remote Sensing, 13(11):2116, 2021.
- [73] Sudong Zang, Lingli Mu, Lina Xian, and Wei Zhang. Semi-supervised deep learning for lunar crater detection using ce-2 dom. Remote Sensing, 13(14):2819, 2021.
- [74] Yutong Jia, Gang Wan, Lei Liu, Jue Wang, Yitian Wu, Naiyang Xue, Ying Wang, and Rixin Yang. Split-attention networks with self-calibrated convolution for moon impact crater detection from multi-source data. Remote Sensing, 13(16):3193, 2021.
- [75] Hang Zhang, Chongruo Wu, Zhongyue Zhang, Yi Zhu, Haibin Lin, Zhi Zhang, Yue Sun, Tong He, Jonas Mueller, R Manmatha, et al. ResNeSt: Split-attention networks. arXiv preprint arXiv:2004.08955, 2020.
- [76] Jiang-Jiang Liu, Qibin Hou, Ming-Ming Cheng, Changhu Wang, and Jiashi Feng. Improving convolutional networks with self-calibrated convolutions. In Proceedings of the IEEE/CVF Conference on Computer Vision and Pattern Recognition, pages 10096–10105, June 2020.
- [77] Shuojin Yang and Zhanchuan Cai. High-resolution feature pyramid network for automatic crater detection on mars. IEEE Transactions on Geoscience and Remote Sensing, 60:1–12, 2021.
- [78] Huan Yang, Xinchao Xu, Youqing Ma, Yaming Xu, and Shaochuang Liu. CraterDaNet: A convolutional neural network for small-scale crater detection via synthetic-to-real domain adaptation. IEEE Transactions on Geoscience and Remote Sensing, 60:1–12, 2021.
- [79] Jun-Yan Zhu, Taesung Park, Phillip Isola, and Alexei A Efros. Unpaired image-to-image translation using cycle-consistent adversarial networks. In Proceedings of the IEEE international conference on computer vision, pages 2223–2232, Oct 2017.
- [80] Ebrahim Emami, Touqeer Ahmad, George Bebis, Ara Nefian, and Terry Fong. Crater detection using unsupervised algorithms and convolutional neural networks. IEEE Transactions on Geoscience and Remote Sensing, 57(8):5373–5383, 2019.
- [81] Kaiming He, Xiangyu Zhang, Shaoqing Ren, and Jian Sun. Deep residual learning for image recognition. In Proceedings of the IEEE conference on computer vision and pattern recognition, pages 770–778, June 2016.
- [82] Vinod Nair and Geoffrey E. Hinton. Rectified linear units improve restricted boltzmann machines. In ICML, pages 807–814, 2010.
- [83] MK Barker, E Mazarico, GA Neumann, MT Zuber, Junichi Haruyama, and DE Smith. A new lunar digital elevation model from the lunar orbiter laser altimeter and selene terrain camera. Icarus, 273:346–355, 2016.
- [84] Diederik P. Kingma and Jimmy Ba. Adam: A method for stochastic optimization. In Yoshua Bengio and Yann LeCun, editors, 3rd International Conference on Learning Representations, ICLR 2015, Conference Track Proceedings, 2015.
- [85] Quinn R Passey and HJ Melosh. Effects of atmospheric breakup on crater field formation. Icarus, 42(2):211–233, 1980.
- [86] Yiran Wang, Bo Wu, Haiou Xue, Xiaoming Li, and Jun Ma. An improved global catalog of lunar impact craters ( 1 km) with 3d morphometric information and updates on global crater analysis. Journal of Geophysical Research: Planets, 126(9):e2020JE006728, 2021.
- [87] Jihao Yin, Yin Xu, Hui Li, and Yueshan Liu. A novel method of crater detection on digital elevation models. In 2013 ieee international geoscience and remote sensing symposium-igarss, pages 2509–2512. IEEE, 2013.
- [88] Wei Liu, Dragomir Anguelov, Dumitru Erhan, Christian Szegedy, Scott Reed, Cheng-Yang Fu, and Alexander C Berg. SSD: Single shot multibox detector. In Bastian Leibe, Jiri Matas, Nicu Sebe, and Max Welling, editors, European conference on computer vision, pages 21–37, Cham, 2016. Springer International Publishing.
- [89] Tsung-Yi Lin, Priya Goyal, Ross Girshick, Kaiming He, and Piotr Dollár. Focal loss for dense object detection. In Proceedings of the IEEE international conference on computer vision, pages 2980–2988, Oct 2017.
- [90] Joseph Redmon and Ali Farhadi. Yolo9000: better, faster, stronger. In Proceedings of the IEEE conference on computer vision and pattern recognition, pages 7263–7271, July 2017.
- [91] Kemal Oksuz, Baris Can Cam, Sinan Kalkan, and Emre Akbas. Imbalance problems in object detection: A review. IEEE transactions on pattern analysis and machine intelligence, 43(10):3388–3415, 2020.
- [92] Li Liu, Wanli Ouyang, Xiaogang Wang, Paul Fieguth, Jie Chen, Xinwang Liu, and Matti Pietikäinen. Deep learning for generic object detection: A survey. International journal of computer vision, 128(2):261–318, 2020.
- [93] Zhong-Qiu Zhao, Peng Zheng, Shou-tao Xu, and Xindong Wu. Object detection with deep learning: A review. IEEE transactions on neural networks and learning systems, 30(11):3212–3232, 2019.
- [94] Youzi Xiao, Zhiqiang Tian, Jiachen Yu, Yinshu Zhang, Shuai Liu, Shaoyi Du, and Xuguang Lan. A review of object detection based on deep learning. Multimedia Tools and Applications, 79(33):23729–23791, 2020.
- [95] Tsung-Yi Lin, Piotr Dollár, Ross Girshick, Kaiming He, Bharath Hariharan, and Serge Belongie. Feature pyramid networks for object detection. In Proceedings of the IEEE conference on computer vision and pattern recognition, pages 2117–2125, July 2017.
- [96] Federico Marini and Beata Walczak. Particle swarm optimization (pso). a tutorial. Chemometrics and Intelligent Laboratory Systems, 149:153–165, 2015.
- [97] Zhaowei Cai and Nuno Vasconcelos. Cascade R-CNN: Delving into high quality object detection. In Proceedings of the IEEE conference on computer vision and pattern recognition, pages 6154–6162, June 2018.
- [98] Joseph Redmon and Ali Farhadi. YOLOv3: An incremental improvement. arXiv preprint arXiv:1804.02767, abs/1804.02767, 2018.
- [99] Tao Kong, Fuchun Sun, Huaping Liu, Yuning Jiang, Lei Li, and Jianbo Shi. FoveaBox: Beyound anchor-based object detection. IEEE Transactions on Image Processing, 29:7389–7398, 2020.
- [100] Zhi Tian, Chunhua Shen, Hao Chen, and Tong He. FCOS: Fully convolutional one-stage object detection. In Proceedings of the IEEE/CVF international conference on computer vision, pages 9627–9636, October 2019.
- [101] Ze Yang, Shaohui Liu, Han Hu, Liwei Wang, and Stephen Lin. RepPoints: Point set representation for object detection. In Proceedings of the IEEE/CVF International Conference on Computer Vision, pages 9657–9666, 2019.
- [102] Li Jian-Sheng, Liu Wei-min, Lan Chao-zhen, Mao Xiao-yan, and Lu Zhan-wei. Fast algorithm for lunar craters simulation. In Advances in Automation and Robotics, Vol. 2, pages 301–306. Springer Berlin Heidelberg, Berlin, Heidelberg, 2012.
- [103] Jasper RR Uijlings, Koen EA Van De Sande, Theo Gevers, and Arnold WM Smeulders. Selective search for object recognition. International journal of computer vision, 104(2):154–171, 2013.
- [104] HK Yuen, John Princen, John Illingworth, and Josef Kittler. Comparative study of hough transform methods for circle finding. Image and vision computing, 8(1):71–77, 1990.
- [105] Erik R Urbach and Tomasz F Stepinski. Automatic detection of sub-km craters in high resolution planetary images. Planetary and Space Science, 57(7):880–887, 2009.
- [106] David W Jacobs. Robust and efficient detection of salient convex groups. IEEE transactions on pattern analysis and machine intelligence, 18(1):23–37, 1996.
- [107] Jianbo Shi and Tomasi. Good features to track. In 1994 Proceedings of IEEE Conference on Computer Vision and Pattern Recognition, pages 593–600, 1994.
- [108] Christopher M Bishop and Nasser M Nasrabadi. Pattern recognition and machine learning, volume 4. Springer, 2006.
- [109] Kevin P Murphy. Machine learning: a probabilistic perspective. MIT press, 2012.
- [110] Atal Tewari, Vikrant Jain, and Nitin Khanna. Automatic crater shape retrieval using unsupervised and semi-supervised systems. arXiv preprint arXiv:2211.01933, 2022.
- [111] Goran Salamunićcar, Sven Lončarić, and Erwan Mazarico. LU60645GT and MA132843GT catalogues of lunar and martian impact craters developed using a crater shape-based interpolation crater detection algorithm for topography data. Planetary and Space Science, 60(1):236–247, 2012.
- [112] LA Andersson and Ewen Adair Whitaker. Nasa catalogue of lunar nomenclature. Technical report, 1982.
- [113] Frank Scholten, J Oberst, K-D Matz, Thomas Roatsch, Marita Wählisch, EJ Speyerer, and MS Robinson. GLD100: The near-global lunar 100 m raster dtm from lroc wac stereo image data. Journal of Geophysical Research: Planets, 117(E12), 2012.
- [114] David E Smith, Maria T Zuber, Glenn B Jackson, John F Cavanaugh, Gregory A Neumann, Haris Riris, Xiaoli Sun, Ronald S Zellar, Craig Coltharp, Joseph Connelly, et al. The lunar orbiter laser altimeter investigation on the lunar reconnaissance orbiter mission. Space science reviews, 150(1):209–241, 2010.
- [115] Junichi Haruyama, Seiichi Hara, Kazuyuki Hioki, Akira Iwasaki, Tomokatsu Morota, Makiko Ohtake, Tsuneo Matsunaga, Hitoshi Araki, Koii Matsumoto, Yoshiaki Ishihara, et al. Lunar global digital terrain model dataset produced from SELENE (kaguya) terrain camera stereo observations. In 43rd Annual Lunar and Planetary Science Conference, number 1659 in Lunar and Planetary Science Conference, page 1200, mar 2012.
- [116] Philip R Christensen, Bruce M Jakosky, Hugh H Kieffer, Michael C Malin, Harry Y McSween, Kenneth Nealson, Greg L Mehall, Steven H Silverman, Steven Ferry, Michael Caplinger, et al. The thermal emission imaging system (THEMIS) for the mars 2001 odyssey mission. Space Science Reviews, 110(1):85–130, 2004.
- [117] David E Smith, Maria T Zuber, Herbert V Frey, James B Garvin, James W Head, Duane O Muhleman, Gordon H Pettengill, Roger J Phillips, Sean C Solomon, H Jay Zwally, et al. Mars orbiter laser altimeter: Experiment summary after the first year of global mapping of mars. Journal of Geophysical Research: Planets, 106(E10):23689–23722, 2001.
- [118] Maria T Zuber, D_E Smith, SC Solomon, DO Muhleman, JW Head, JB Garvin, JB Abshire, and JL Bufton. The mars observer laser altimeter investigation. Journal of Geophysical Research: Planets, 97(E5):7781–7797, 1992.
- [119] Goran Salamunićcar and Sven Lončarić. GT-57633 catalogue of martian impact craters developed for evaluation of crater detection algorithms. Planetary and Space Science, 56(15):1992–2008, 2008.
- [120] Joseph M. Boyce, Peter Mouginis-Mark, and Harold Garbeil. Ancient oceans in the northern lowlands of mars: Evidence from impact crater depth/diameter relationships. Journal of Geophysical Research: Planets, 110(E3), 2005.
- [121] G Salamunićcar and S Lončarić. Estimation of Ground Truth for Evaluation of Crater Detection Algorithms. In Stephen Mackwell and Eileen Stansbery, editors, 37th Annual Lunar and Planetary Science Conference, Lunar and Planetary Science Conference, page 1137, mar 2006.
- [122] Goran Salamuniccar and Sven Loncaric. Method for crater detection from martian digital topography data using gradient value/orientation, morphometry, vote analysis, slip tuning, and calibration. IEEE transactions on Geoscience and Remote Sensing, 48(5):2317–2329, 2010.
- [123] Goran Salamunićcar, Sven Lončarić, Pedro Pina, Lourenço Bandeira, and José Saraiva. MA130301GT catalogue of martian impact craters and advanced evaluation of crater detection algorithms using diverse topography and image datasets. Planetary and Space Science, 59(1):111–131, 2011.
- [124] Lourenço Bandeira, Jose Saraiva, and Pedro Pina. Impact crater recognition on Mars based on a probability volume created by template matching. IEEE Transactions on Geoscience and Remote Sensing, 45(12):4008–4015, 2007.
- [125] TF Stepinski and ER Urbach. Completion of the first automatic survey of craters on mars. In Proceedings of the 11th Mars Crater Consortium meeting, US Geological Survey in Flagstaff-AZ, 2008.
- [126] Wei Zuo, Chunlai Li, and Zhoubin Zhang. Scientific data and their release of Chang’E-1 and Chang’E-2. Chinese Journal of Geochemistry, 33(1):24–44, 2014.
- [127] RL Fergason, TM Hare, and J Laura. Hrsc and mola blended digital elevation model at 200m v2. Astrogeology PDS Annex, US Geological Survey, 2018.
- [128] CS Edwards, KJ Nowicki, PR Christensen, J Hill, N Gorelick, and K Murray. Mosaicking of global planetary image datasets: 1. techniques and data processing for thermal emission imaging system (THEMIS) multi-spectral data. Journal of Geophysical Research: Planets, 116(E10), 2011.
- [129] Jason Laura and Robin L Fergason. Modeling martian thermal inertia in a distributed memory high performance computing environment. In 2016 IEEE International Conference on Big Data (Big Data), pages 2919–2928. IEEE, 2016.
- [130] RL Fergason, JR Laura, and TM Hare. Themis-derived thermal inertia on mars: improved and flexible algorithm. In 48th Annual Lunar and Planetary Science Conference, number 1964 in Lunar and Planetary Science Conference, page 1563, mar 2017.
- [131] Yanzhao Zhou, Xin Wang, Jianbin Jiao, Trevor Darrell, and Fisher Yu. Learning saliency propagation for semi-supervised instance segmentation. In Proceedings of the IEEE/CVF Conference on Computer Vision and Pattern Recognition, pages 10307–10316, June 2020.
- [132] Long Chen, Weiwen Zhang, Yuli Wu, Martin Strauch, and Dorit Merhof. Semi-supervised instance segmentation with a learned shape prior. In Interpretable and Annotation-Efficient Learning for Medical Image Computing, pages 94–102. Springer International Publishing, Cham, 2020.
- [133] Jisoo Jeong, Seungeui Lee, Jeesoo Kim, and Nojun Kwak. Consistency-based semi-supervised learning for object detection. Advances in neural information processing systems, 32, 2019.
- [134] Mingfei Gao, Zizhao Zhang, Guo Yu, Sercan Ö Arık, Larry S Davis, and Tomas Pfister. Consistency-based semi-supervised active learning: Towards minimizing labeling cost. In European Conference on Computer Vision, pages 510–526, Cham, 2020. Springer.
- [135] Miriam Bellver, Amaia Salvador, Jordi Torres, and Xavier Giro-i Nieto. Mask-guided sample selection for semi-supervised instance segmentation. Multimedia Tools and Applications, 79(35):25551–25569, 2020.
- [136] Peng Tang, Chetan Ramaiah, Yan Wang, Ran Xu, and Caiming Xiong. Proposal learning for semi-supervised object detection. In Proceedings of the IEEE/CVF Winter Conference on Applications of Computer Vision, pages 2291–2301, January 2021.
- [137] Tim Krüger, Stefan Hergarten, and Thomas Kenkmann. Deriving morphometric parameters and the simple-to-complex transition diameter from a high-resolution, global database of fresh lunar impact craters (d 3 km). Journal of Geophysical Research: Planets, 123(10):2667–2690, 2018.
- [138] Min Chen, Mengling Lei, Danyang Liu, Yi Zhou, Hao Zhao, and Kejian Qian. Morphological features-based descriptive index system for lunar impact craters. ISPRS International Journal of Geo-Information, 7(1):5, 2017.
- [139] SJ He, JP Chen, K Li, et al. The morphological classification and distribution characteristics of the craters in the LQ-4 area. Earth Science Frontiers, 19(6):83–89, 2012.
- [140] Yi Zhou, Long Yan, Hao Zhao, and Jie Tu. A new classification and index calibration of lunar impact craters for digital terrain analysis. Astronomy Reports, 63(12):1069–1079, 2019.
- [141] Gwendolyn D Bart and HJ Melosh. Using lunar boulders to distinguish primary from distant secondary impact craters. Geophysical research letters, 34(7), 2007.