Dust depletion of metals from local to distant galaxies II:
The evolution of the cosmic dust content and the cycle between metals and dust in the interstellar medium (ISM) play a fundamental role in galaxy evolution. The chemical enrichment of the Universe can be traced through the evolution of the dust-to-metals ratio (DTM) and the dust-to-gas ratio (DTG) with metallicity. The physical processes through which dust is created and eventually destroyed still remain important open questions. We use a novel method to determine mass estimates of the DTM, DTG and dust composition in terms of fraction of dust mass contributed by element X (f) based on our previous measurements of the depletion of metals in different environments (the Milky Way, the Magellanic Clouds, and damped Lyman- absorbers, DLAs, toward quasars and towards gamma-ray bursts, GRBs), which were calculated from the relative abundances of metals in the ISM through absorption-line spectroscopy column densities observed mainly from VLT/UVES and X-shooter, and HST/STIS. We also derive the dust extinction from the estimated dust depletion () for GRB-DLAs, the Magellanic Clouds and the Milky Way and compare it with the estimated from extinction (). We find that the DTM and DTG ratios increase with metallicity and with the dust tracer [Zn/Fe]. This suggests that grain growth in the ISM is a dominant process of dust production, at least in the metallicity range (-2 [M/H]tot 0.5) and redshift range () that we are studying. The increasing trend of the DTM and DTG with metallicity is in good agreement with a dust production and evolution hydrodynamical model. Our data suggest that the stellar dust yield is much lower (about 1) than the metal yield and thus that the overall amount of dust in the warm neutral medium that is produced by stars is much lower, than previously estimated. The global neutral gas metallicity is decreasing over cosmic time and is traced similarly by quasar- and GRB-DLAs. We find that is overall lower than for the Milky Way and a few Magellanic Clouds lines of sight, a discrepancy that is likely related to the presence of carbonaceous dust associated with dense clumps of cold neutral gas. For the other environments, we find an overall good agreement between the and . We show that the main elements (f ¿ 1) that contribute to the dust composition are, by mass, O, Fe, Si, Mg, C, S, Ni and Al for all the environments, with Si, Mg and C being equivalent contributors. There are, nevertheless, variations in the dust composition depending on the overall amount of dust. The abundances measured at low dust regimes in quasar- and GRB-DLAs suggest the presence of pyroxene and metallic iron in dust. These results give important information on the dust and metal content of galaxies across cosmic times, from the Milky Way up to .
Key Words.:
galaxies: evolution - ISM: dust, extinction1 Introduction
The interplay between the production of metals by stars and the formation and evolution of cosmic dust plays a fundamental role in the chemical enrichment of the interstellar medium (ISM). The cycle of exchanging material between stars, interstellar gas and cosmic dust drives galactic evolution (Maiolino & Mannucci 2019). Yet the direct observations of the chemical properties of the baryon cycle remain a big challenge.
Metals are formed in stars and are ejected into the ISM by strong stellar winds and supernova explosions. More than 90 of the baryons are found in the gas phase at ¿ 2 (Péroux & Howk 2020). These metals in the ISM can be incorporated into the next generation of stars. While substantial amount of metals are found in neutral gas, large fractions of these metals are instead locked into dust grains, an effect called dust depletion (Field 1974; Savage & Sembach 1996; Phillips et al. 1982; Savaglio et al. 2003; Jenkins 2009; De Cia et al. 2016; Roman-Duval et al. 2021). Potential channels for the production of dust are the cooling ejecta of supernovae (Dunne et al. 2003; Matsuura et al. 2015), grain growth in the ISM (Draine 2003; Mattsson et al. 2012; Dwek 2016; De Cia et al. 2016) and asymptotic giant branch (AGB) stars (Gail et al. 2009; Höfner & Olofsson 2018). Around 30 of the light in the Universe is re-radiated by dust grains in the infrared, altering the light that we observe (Calzetti et al. 1995; Witt & Gordon 2000). Dust is also necessary in the process of star formation, because it is an important direct coolant for star formation and acts as a catalyst for the production of molecular hydrogen (Hollenbach & Salpeter 1971; Hollenbach & McKee 1979). Therefore, characterizing the dust properties and also the cycle of metals between the dust and gas is of fundamental importance in our understanding of galaxy formation and evolution.
The fraction of metals in dust can be described by the dust-to-metal ratio, and another indicator of the dust content is the dust-to-gas ratio (Draine 2003). These properties can help us understand the production and destruction mechanisms of the dust and its evolution. They can be used to estimate a number of dust properties, including the dust surface density (see Péroux et al. 2023) and the dust composition. One way to infer the dust composition is to observe the abundances of metals in the gas phase ISM through absorption-line spectroscopy and taking into account their depletion into dust grains (e.g, Roman-Duval et al. 2022a). In Konstantopoulou et al. (2022) (hereafter Paper I), we characterized the dust depletion of 18 metals in the Milky Way, the Magellanic Clouds, QSO- and GRB-DLAs using the ISM relative abundances of metals, following the prescription of (De Cia et al. 2016). Here we use the depletion estimates from Paper I to infer the dust properties, namely the dust-to-gas (DTG) and dust-to-metal (DTM) ratios, dust composition, and dust extinction in a wide range of galactic environments (the Milky Way, the Magellanic Clouds, QSO- and GRB-DLAs) and study how they evolve over cosmic time.
The paper is organized as follows. In Section 2 we briefly present the samples and the method that is used for the dust depletion estimates. In Section 3 we infer the DTM, DTG, the extinction and dust composition from depletion. We discuss our results in Section 4, and finally summarize and conclude in Section 5.
Throughout the paper we use a linear unit for the column densities N in terms of ions cm-2. We refer to relative abundances of elements X and Y as log log, where reference solar abundances are taken from Asplund et al. (2021) following the recommendations of Lodders et al. (2009) (see Table 1 in Paper I). We adopt a cold dark matter cosmology (CDM) with H0 = 67.7 km s-1 Mpc-1, = 0.3 and = 0.7 (Planck Collaboration et al. 2020).
2 Data Samples
In this section we briefly present the observational sample that we use for our analysis and the method that is used to estimate the dust depletion of all the metals for the Milky Way, the Magellanic Clouds and for high-redshift QSO- and GRB-DLAs. These can be found in more detail in Paper I.
In Paper I we used a large compilation of metal column densities, measured in a consistent way, in the neutral ISM for the Milky Way, the Magellanic Clouds, QSO- and GRB-DLAs to characterize the dust depletion of 18 metals (C, P, O, Cl, Kr, S, Ge, Mg, Si, Cu, Co, Mn, Cr, Ni, Al, Ti, Zn, and Fe). Our sample probes gas in a wide range of galaxy types and regions. QSO-DLAs trace gas-rich regions in the outskirts of galaxies (Prochaska et al. 2007; Fynbo et al. 2008), while GRB-DLAs probe the inner regions of galaxies hosting GRBs in a way more similar to the Milky Way and the Magellanic Clouds samples but at high redshifts.
The Milky Way sample is from Jenkins (2009), De Cia et al. (2021), Welty & Crowther (2010), and Phillips et al. (1982). The Large Magellanic Cloud (LMC) sample from Roman-Duval et al. (2021), the Small Magellanic Cloud (SMC) from Welty & Crowther (2010), Tchernyshyov et al. (2015), Jenkins & Wallerstein (2017) and the QSO-DLAs sample is from De Cia et al. (2016), Berg et al. (2015), De Cia et al. (2018). We also use 36 GRB-DLAs from Savaglio et al. (2003); Shin et al. (2006); Prochaska et al. (2007); Piranomonte et al. (2008); Ledoux et al. (2009); D’Elia et al. (2011); Wiseman et al. (2017); Zafar & Møller (2019); Bolmer et al. (2019); Saccardi et al. (2023), as compiled in Heintz et al. (2023), who also presents three new GRB-DLAs.
The column densities are measured mainly from spectra obtained with UVES/VLT, X-Shooter/VLT and STIS/HST and were homogenized to the newest oscillator strengths, listed in Paper I. The details of the full sample properties are presented in Paper I.
3 Methods and results
3.1 Dust depletion measurements
In this work we adopt the dust depletions of each metal from Paper I, which were estimated from the relative abundances of metals (De Cia et al. 2016), based on the fact that different metals have different tendencies of being incorporated into dust grains. We note that this is a different approach from the one of Roman-Duval et al. (2021), who also derived dust properties based on depletions, but estimated the depletions from the observed abundances and assuming a given metallicity of the gas. Here we briefly present our method.
The depletion of an element X () can be estimated from the relative abundances of two elements that have different refractory properties but follow each other nucleosynthetically. If X is a refractory element and Y is volatile (i.e., is not easily depleted into dust, like Zn) then the dust depletion of X can be expressed using the ratio of the two elements [X/Y]. De Cia et al. (2016) and Paper I relied on [X/Zn] and their relation to the dust tracer to estimate the depletion of X. To trace the overall amount of dust we used the dust tracer [Zn/Fe]. Two corrections are applied: first the dependence on the depletion of Zn is removed by assuming = -0.27[Zn/Fe], which is derived from the Milky Way and QSO-DLAs (De Cia et al. 2016) and second a correction is applied to account for nucleosynthesis effects, such as -element enhancement and Mn underabundance, as described in Paper I.
The depletion of X correlates linearly with the dust tracer, such as [Zn/Fe], but others, such as [Si/Ti] or [O/Si] are possible and thus the dust depletion can then be expressed by a simple linear relation as,
| (1) |
where the A2X and B2X coefficients for all the metals are the results of the linear fits to the data and are presented in Table 4 of Paper I. These results are consistent with De Cia et al. (2016). In Paper I the coefficients are estimated using two different assumptions on -element enhancement and Mn underabundance in the Magellanic Clouds. Here we adopt the coefficients that were estimated using the assumption of constant -element enhancement and Mn underabundance and are reported in Table 1 for completeness.
| Element X | A2x | B2x |
|---|---|---|
| C | 0.00 | 0.100.10 |
| P | 0.080.05 | 0.260.08 |
| O | 0.00 | 0.200.05 |
| Cl | 0.00 | 0.120.09 |
| Kr | 0.00 | 0.040.09 |
| S | 0.010.02 | 0.480.04 |
| Zn | 0.000.01 | 0.270.03 |
| Ge | 0.00 | 0.400.04 |
| Mg | 0.010.03 | 0.660.04 |
| Si | 0.040.02 | 0.750.03 |
| Cu | 0.00 | 0.730.04 |
| Co | 0.00 | 0.890.19 |
| Mn | 0.070.02 | 1.030.03 |
| Cr | 0.120.01 | 1.300.01 |
| Ni | 0.070.02 | 1.310.03 |
| Fe | 0.010.03 | 1.260.04 |
| Al | 0.00 | 1.660.35 |
| Ti | 0.070.03 | 1.670.04 |
3.2 Dust-to-metal and dust-to-gas mass ratios
The total abundance of element X can be expressed as:
| (2) |
where [X/H]⊙ is the solar abundance of element X and [M/]tot is the total dust-corrected metallicity of the gas.
Then the DTM mass ratio can be calculated including all the metals as:
| (3) |
where is the dust depletion of element X, which are taken from Paper I and WX the atomic weight of element X. The total dust-corrected metallicity of the gas [M/]tot cancels out and thus the dust-to-metal ratio is estimated independently of the total metallicity. 111We note that Eq. 3 is equivalent to eq. 9 of Roman-Duval et al. (2022a), but the depletions are estimated from the observed abundances. In De Cia et al. (2016) the calculation of DTM is based on () and only for Fe. The sum is over all metals that have an elemental abundance . In total we use 29 metals, namely, C, P, O, Cl, Kr, S, Ge, Mg, Si, Cu, Co, Mn, Cr, Ni, Al, Ti, N, Ne, Ar, F, Na, K, Ga, V, Sc, Se, Li, Zn, and Fe. The abundance measurements of these metals are done in the neutral gas of the ISM in their dominant ionization state, which is mostly singly ionized. In some cases, some elements should be volatile, although their depletion is not assessed in Paper I. In such cases (namely, N, Ne, Ar, F, Na, K, Ga, V, Sc, Se and Li) we assume that = 0. These metals make a small difference in the calculation of the DTM and DTG, but we include them because they contribute to the mass of the metals by summing their atomic weights in the denominator of Eq. 3. The calculation of the depletions using the method of relative abundances is based on the availability of Zn and Fe. Thus, when Zn and/or Fe were not available, no estimate of the depletion was made in Paper I. In case was not estimated in Paper I, but [Zn/Fe] has been observed, we use the coefficients A2X and B2X listed in Table 1 to estimate the depletion using Eq. 1. The dust depletion is typically defined as a negative number, because it removes metals from the gas-phase. In a few cases, however, the observed [Zn/Fe] is slightly negative, and typically consistent with zero within the uncertainties. In such cases, the values of depletion () that we strictly derive from the [Zn/Fe] would be slightly positive, which is non-physical (i.e. the presence of dust removes metals from the gas phase, does not add them). We therefore assign zero depletion in such cases. For the cases of GRB-DLAs with no observed [Zn/Fe], we use the estimated [Zn/Fe]fit from Heintz et al. (2023) to calculate the expected depletions from the coefficients A2X and B2X, listed in Table 1 and using Eq. 1. [Zn/Fe]fit is equivalent to the observed [Zn/Fe], but is derived from the abundances of all the available metals.
The DTG is the total dust mass relative to the total gas mass. It can be expressed as:
| (4) |
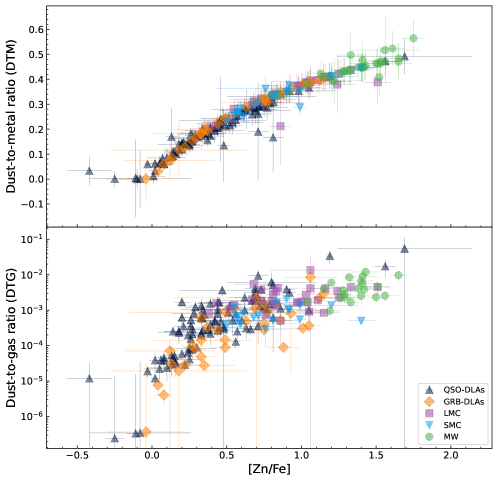
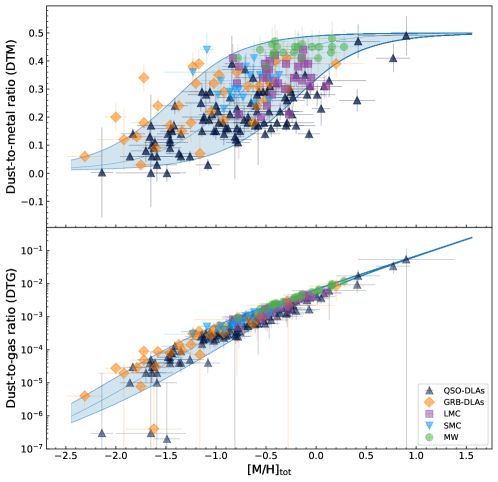
where DTM is defined in Eq. 3, [M/]tot is the total dust-corrected metallicity of the gas and Z⊙ = 0.0139 is the solar metallicity taken from Asplund et al. (2021). Figures 1 and 2 show the DTM (top panel) and the DTG (bottom panel) with respect to the dust tracer [Zn/Fe] and the total dust-corrected metallicity [M/]tot respectfully and for all the environments. Our measurements are given in Tables LABEL:dlastable- LABEL:grbtable.
3.3 Dust composition
We estimate the fraction of dust mass contributed by element X, f as,
| (5) |
where [X/H]⊙ is the solar abundance of element X, is the dust depletion of element X and WX the atomic weight of element X.222We note that Eq. 5 is equivalent to Eq. 12 of Roman-Duval et al. (2022a), but the depletions are estimated in a different way (see Sect. 3.1).
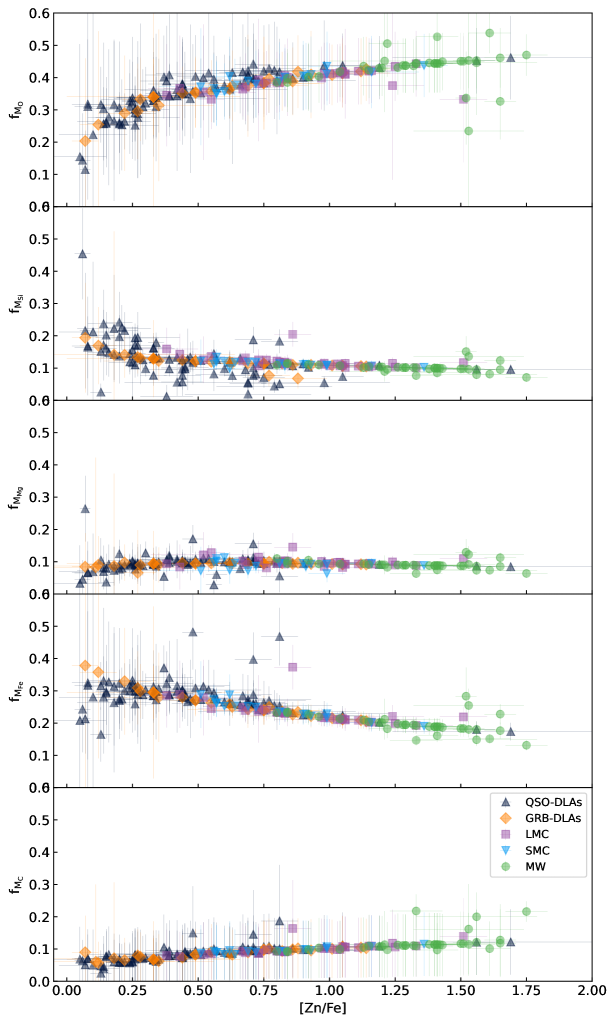
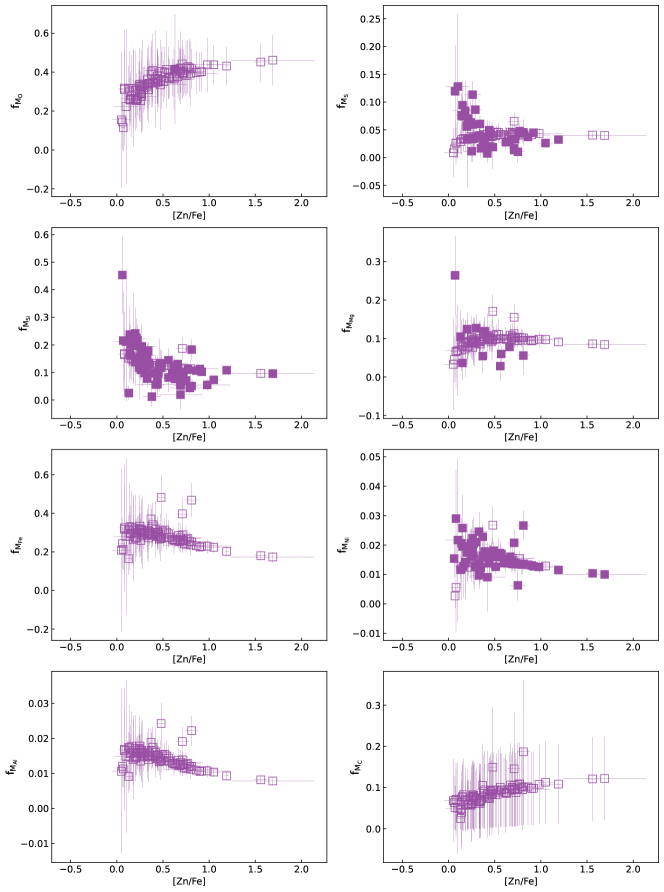
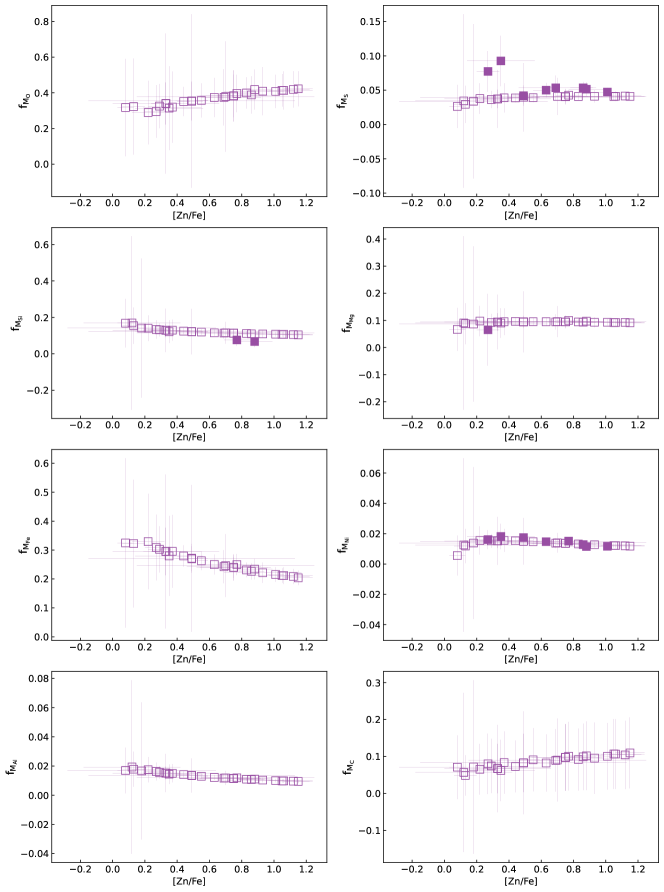
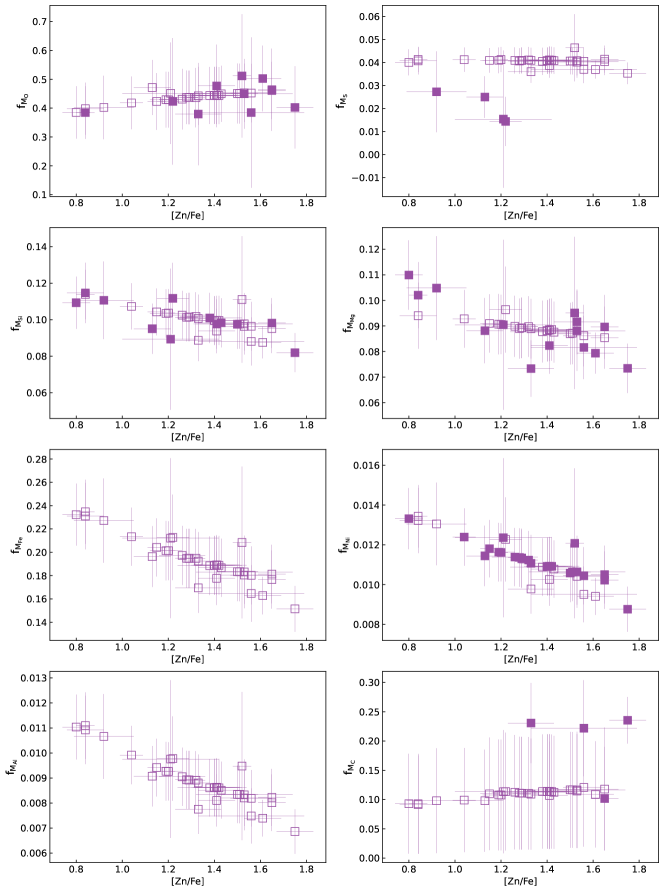
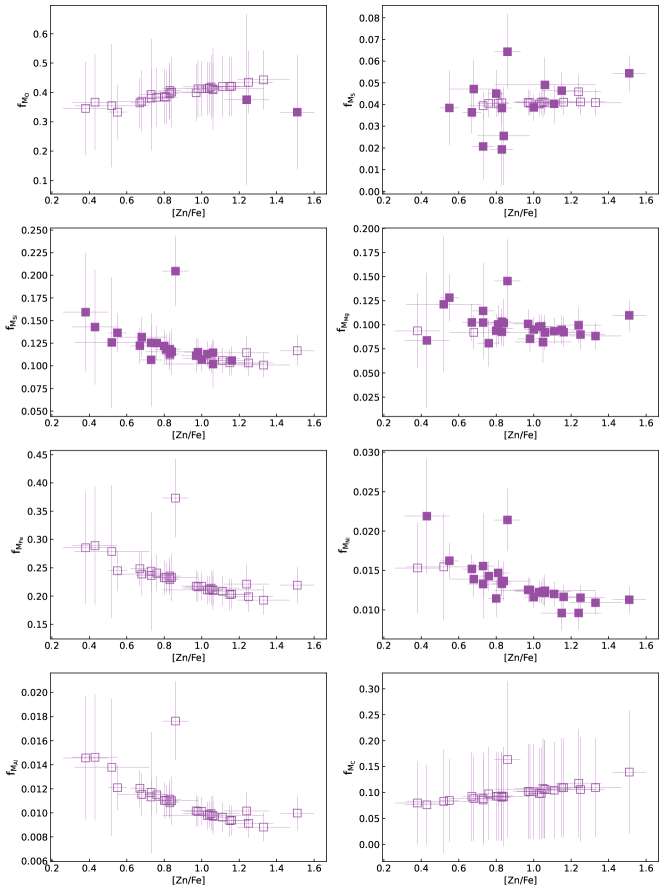
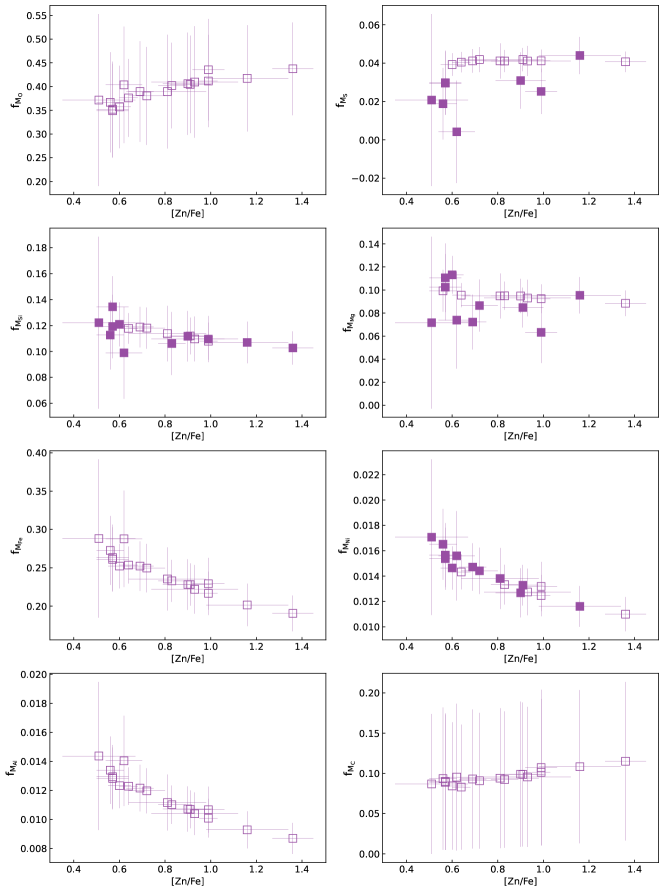
Figure 3 shows the evolution of dust composition with [Zn/Fe] for the elements that contribute at least 1 to the dust composition (f ¿ 1). In case a measurement of is unavailable for a given system, we calculate it from the measurements of dust depletion of a given metal. This is done using Eq. 1 and the coefficients presented in Table 1. This means that in such cases the measurements of the dust depletion are extrapolated from the general behaviour of the other environments, and our estimates on the dust composition are indicative. For the cases of targets that have less than three measurements of metals, the calculation of f is not reliable and thus we exclude them. Figures 9 to 13 show the dust composition with respect to [Zn/Fe] for all the environments. The systems for which we have a measurement of dust depletion for each metal are shown with filled symbols and those calculated from the coefficients with empty symbols.
3.4 Dust extinction from depletion
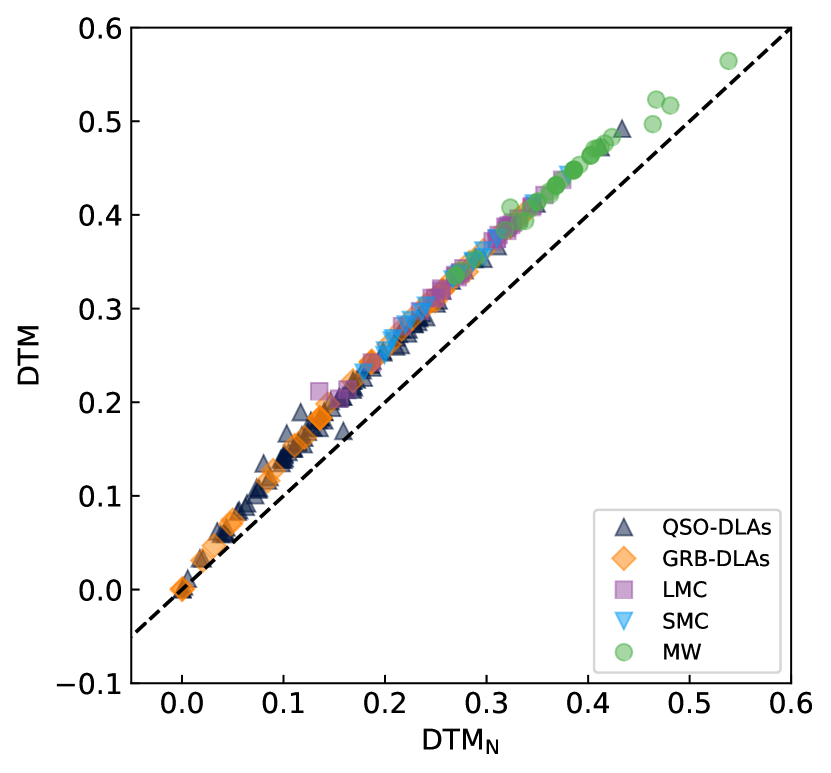
The extinction of light by dust grains depends on several factors, such as their density, their size distribution, and composition (e.g. Draine 2003). While typically the dust extinction is measured from the variations on the spectral continuum, it is also possible to estimate an from the dust depletion (and the dust-to-metals ratio), which we refer to as . However, because dust extinction depends on the cross section of the dust grains, it is more sensitive to the number of grains, rather than the mass of the individual grains. Therefore, we derive the based on a DTM that is defined in terms of number of atoms (or column densities), which we refer to as DTMN. We derive the DTMN in terms of column density by number as,
| (6) |
The DTM in terms of column density (DTMN) is on average 0.05 times lower than the DTM in terms of mass (DTM), as expected because Eq. 6 is equivalent to Eq. 3 without adding the atomic weights WX of the elements. However, the overall trend is the same. Figure 8 shows the relation between the DTM by mass and the DTM by column density (DTMN). Our measurements of both DTM and DTMN are given in Tables LABEL:dlastable - LABEL:grbtable.
The dust extinction can be derived from the depletion estimated DTMN as,
| (7) |
where 10-21 mag cm2 is the Galactic DTM ratio from Watson (2011). DTM is the dust-to-metal ratio for the Galaxy in terms of column density, derived using Eq. 6 and assuming an average [Zn/Fe] = 1.22 for the Milky Way. N(H) is the total column density of H, defined as N(H) = N(H I) + 2 N(H 2), although for most QSO- and GRB-DLAs only H I is measured and H 2 is negligible (e.g., the mean molecular fraction measured in QSO-DLAs in Noterdaeme et al. 2008, is log f -6.2). [M/]tot is the total dust-corrected metallicity.
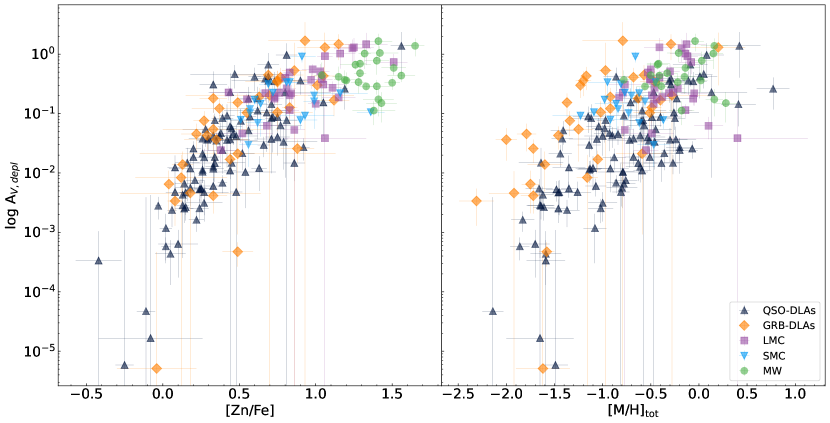
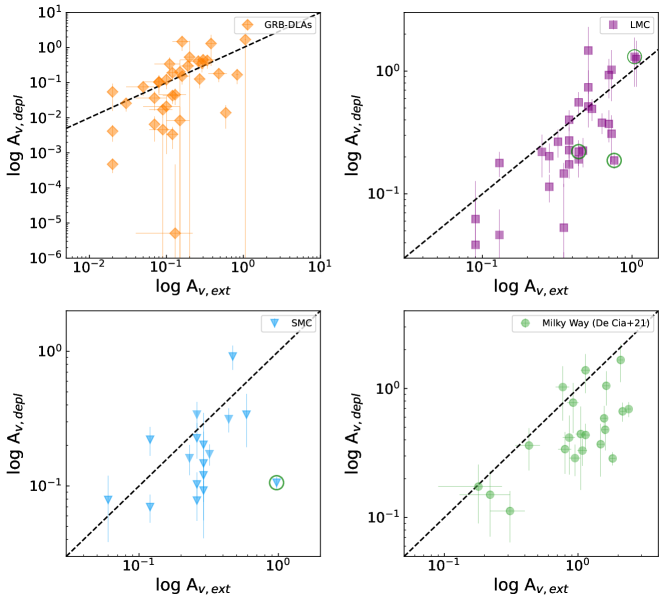
Figure 4 shows the distribution of with [Zn/Fe] (left panel) and with the total dust corrected metallicity [M/]tot (right panel). The DTM, DTG, DTMN and results for all the environments are reported in Tables LABEL:dlastable- LABEL:grbtable.
4 Discussion
4.1 DTM, DTG, and the origin of dust
The evolution of the DTM and DTG ratios with metallicity gives us clues about the origin of interstellar dust. The three candidate mechanisms for the formation of the bulk of cosmic dust are dust condensation in the envelopes of AGB stars (Gail et al. 2009), condensation in SNe ejecta (Dunne et al. 2003; Matsuura et al. 2015), and grain growth in the ISM (Draine 2003; Mattsson et al. 2012; Dwek 2016; De Cia et al. 2016).
Different dust production mechanisms can produce different types of dust. AGB stars produce C-rich dust as well as silicates, while SNe produce mostly silicates. Type Ia SNe are the major Fe producers but dust produced by Type Ia SNe has generally not been observed, with the exception of Dwek (2016); Nagao et al. (2018). ISM grain growth by condensation upon existing seeds produced by stars is the mechanism that can produce silicates but also the amounts of C- and Fe-dust observed.
Different mechanisms of dust production have different dependencies on the environment metallicity. Dust that is mostly built up with ISM grain growth has DTM ratios that increase with metallicity, because the grain growth rate is metallicity dependent. On the other hand, SNe-produced dust should show a constant DTM (Mattsson et al. 2014), because dust production by SNe is weakly dependent on metallicity. AGB stars are often considered secondary for dust production, because of their longer lifetimes, although they cannot be neglected on short timescales (500 Myr, Valiante et al. 2009).
Although grain growth in the ISM can occur at any time during the lifetime of a galaxy, Zhukovska et al. (2008) show that there is likely a critical metallicity above which grain growth in the ISM becomes dominant over other sources of dust production. Their evolution model shows that at very low metallicities [M/]tot in the solar neighbourhood the grain growth timescale exceeds by about 10 Myr the average lifetime of the molecular cloud. This means that until this point, not a lot is added to the dust content of the interstellar matter. When the metallicity of the ISM has reached [M/] some dust starts to condensate in the ISM and at [M/]tot the rate of growth increases rapidly and grain growth is the dominant mechanism of dust production in the diffuse ISM (Zhukovska et al. 2008). At high metallicities, such as in the Milky Way, the DTM ratio has a smaller dependence with metallicity. This is possibly because dust production depends not only on metallicity, but also temperature, density and pressure. In the Milky Way the presence of cold dense gas and high pressure provide favorable conditions for the formation of dust. In this case, due to the higher dependence of ISM grain growth on density and pressure, the metallicity dependence is lower (Blitz & Rosolowsky 2006).
The top panel of Fig. 1 shows the DTM ratio with respect to the dust tracer [Zn/Fe] for the Milky Way, LMC, SMC, QSO- and GRB-DLAs. It is evident that there is a tight correlation between the DTM and [Zn/Fe], which is expected by the fact that the depletions that are used for the DTM calculation are linearly correlated with [Zn/Fe] (see Eq. 1). The DTM is lower for QSO-DLAs and increases with increasing [Zn/Fe], i.e., for dustier systems, like the Milky Way.
The bottom panel of Fig. 1 shows the DTG with respect to [Zn/Fe] for the Milky Way, LMC, SMC, DLA- and GRB-DLAs. The DTG ratio is increasing with [Zn/Fe] and there is a larger scatter in the linear relation than what we see for the DTM (top panel of Fig. 1). Fig. 2 shows the DTM (top panel) and DTG (bottom panel) with respect to the total dust-corrected metallicity [M/]tot. We find that overall the DTM is increasing with metallicity. For QSO-DLAs, we see a relatively sharp decline of the DTM at low metallicities (at [M/]), indicating that the net dust production rate is lower at low metallicities. This decline of the DTM could indicate that dust is destroyed more efficiently than being formed in this low-metallicity regime. However, uncertainties are large for these few systems probably as a result of the low amounts of dust, which is difficult to measure with this method.
The analytic dust production and evolution model tracks from Mattsson (2020) are also shown in Fig. 2. The model is overplotted, using eq. 42 of Mattsson (2020) and assuming that the dust destruction parameter is essentially equal to the growth parameter . The model considers all sources of dust, i.e., stellar sources (AGB stars, SNe) and grain growth in the ISM, involves several simplifying assumptions and is based on an idealised model of grain growth in turbulent cold molecular clouds. Some parameters are modified to fit the observational data well, that is, the stellar dust yield (yd) is lowered by an order of magnitude with respect to Mattsson (2020) and the solar abundance Z⊙ is updated to the most recent value from Asplund et al. (2021). The parameters for the model are then yZ = 0.01, yd = 1 10-4, = and Z⊙ = 0.0139. The shaded regions in the plots show the parts of the DTM-[M/]tot and DTG-[M/]tot planes that are covered by varying = from 1 to 16. Surprisingly, the predicted (stellar) dust yield is only 1 of the metals yield, while the previous estimates by Mattsson (2020) indicated 10-20. This suggests that the overall stellar population (and not individual cases) produce much less dust than previously estimated. We note that with our data we probe the integrated metals and dust recycled by the stellar sources (AGB stars, SNe) in the warm diffuse ISM. We might be missing the dust produced by stars in the dense and dustier regions around AGB stars or SNe.
The fact that the DTM is increasing with metallicity indicates that grain growth in the ISM, is likely the dominant mechanism for dust production. This is supported by the fact that the data fit well the dust production and evolution model trend from Mattsson (2020). We note that due to the nature of the measurements used in this paper (column densities of the metals in the warm neutral gas from UV absorption-line spectroscopy), there is a selection effect that gives privilege to sampling of environments where there is dust growth in the (more diffuse) ISM. Moreover, with the depletion measurements we probably cannot distinguish between grain growth and dust destruction/sputtering in the diffuse ISM. With our method we do not directly probe the very dense envelopes of AGB stars, or regions of condensations in SNe ejecta, but any dust that has been produced or recycled into the warm neutral ISM. In addition the number of SNe or AGB stars along a line of sight depends on the star-formation history of the local environment sampled. As shown in Paper I, the depletions sequences are independent of the star-formation histories of the different galaxies that were sampled. This means that the total budget of dust grains in the warm neutral medium does not depend on the star-formation histories of the galaxies. However, our technique does not probe dust in the densest regions of the ISM (cold and molecular neutral medium) and in particular C-rich dust grains, which contribute significantly to the dust budget.
We find that the increase of the DTM with metallicity is not developing with the same rate for all the environments (49 increase for QSO-DLAs, 40 for GRB-DLAs, 23 for the LMC, 21 for the SMC and 23 for the Milky Way). In environments that have high metallicity and large amounts of cold dense gas (high pressure), like in the Milky Way disk, the dependence on the metallicity seems to become less important. In this case, grain growth in the ISM depends more strongly on pressure and thus molecular production and ISM grain growth (Blitz & Rosolowsky 2006). This can cause a shallower increase in the DTM with metallicity for environments with higher pressure.
Overall, the DTM is larger for dustier and higher metallicity systems, like the Milky Way and lower for QSO-DLAs. An increase of the DTM with metallicity has been observed in local and distant galactic environments (e.g. De Cia et al. 2013, 2016; Wiseman et al. 2017), with this tendency somehow flattening above 0.1 Z⊙ and reaching the Milky Way values. However, there are differences between the DTM calculations in these works. In our method, we use all the metals that contribute into dust, including C, by using the depletion of C that is estimated either from measurements for the Milky Way or from its empirical relation with [Zn/Fe] (calibrated with Milky Way data only) for the rest of the environments. We also calculate the DTM in terms of mass, by weighting each element for its atomic weight. De Cia et al. (2013) and De Cia et al. (2016) derive DTMN in terms of column density and only based on the depletion of Fe. Wiseman et al. (2017) calculate the DTMN in terms of column density and not including C.All these works refer to a normalized DTMN with respect to the Milky Way. If we consider this, our DTMN is consistent with the DTMN estimated by Wiseman et al. (2017) within the uncertainties.
In Fig. 2, the DTM suggests that GRB-DLAs are dustier than QSO-DLAs for equal amounts of metals, while in Figs. 1 and 2 the DTG indicates that GRB-DLAs exhibit more gas with respect to QSO-DLAs along the lines of sight. In addition, most systems lying above the model expectations in Fig 2 are GRB-DLAs at low metallicity, while those below are QSO-DLAs at [M/]. A possible explanation for these effects is the increased amount of colder dense gas and pressure in GRB hosts with respect to the more diffuse and warmer gas probed by QSO DLAs. This is vastly a geometrical effect of GRB lines of sight crossing through more central parts of their host galaxy, while QSO-DLAs probe more peripheral regions of the absorbing galaxy (e.g., Fynbo et al. 2008, Krogager et al. in prep). Overall, our results suggest that the production of dust is not only dependent on the metallicity - or the availability of metals - but also on gas temperature, pressure and density in each environment. The scatter that we observe in the DTM values at a given metallicity may be due to the different dynamical timescales that the stellar and ISM sources contribute to dust at various redshifts. At higher redshifts but for the same [M/]tot it is possible that some sources did not have enough time to form dust in such short timescales (the Universe is just 1 Gyr old at = 6). The scatter in our DTM values suggest a complex interplay of factors within galactic environments. With our method we primarily probe the characteristics of dust within the diffuse ISM. We acknowledge that our approach may not fully capture contributions from specific stellar sources, such as carbonaceous dust from AGB stars, in denser regions. It is indeed possible that the scatter observed in our DTM values arises from the combined effects of sampling different combinations of more diffuse and denser ISM, as well as regions with varying star-formation histories. The results presented in Paper I indicate that in the diffuse ISM, dust origin appears to be less dependent on the star formation history of galaxies. As our study predominantly focuses on the diffuse ISM, we recognize the need for further research to explore methods that better represent denser regions, which may be influenced by variations in star formation history. The DTM overall tends to decrease with redshift, which is likely due to the dependence of the DTM on the decreasing metallicity (Heintz et al. 2023).
The DTG shows a clear increasing trend with metallicity for all the environments (see bottom panel of Fig. 2). The increase of DTG with metallicity has been consistently observed in previous works (Issa et al. 1990; Lisenfeld & Ferrara 1998; Draine & Li 2007; Galliano et al. 2008; Rémy-Ruyer et al. 2014; De Vis et al. 2017; Galliano et al. 2018; Li et al. 2019; Roman-Duval et al. 2022b). The observed DTG trend with metallicity is in agreement with the dust production and evolution model from Mattsson (2020). Roman-Duval et al. (2022b) compare their observed DTG-metallicity trend with the model tracks from Feldmann (2015), which fits well the FIR observations of galaxies from Rémy-Ruyer et al. (2014). In this comparison, these author find a discrepancy of the QSO-DLA observations with the FIR observations from Rémy-Ruyer et al. (2014), which is still present in our current observational dataset. This discrepancy highlights that FIR observations probe a very different kind of environment, likely the most dense clouds around star-forming regions and AGB stars that may have dust with a different nature from what is observed in the diffuse ISM. The DTG-metallicity trend that we observe is consistent with the one observed in Roman-Duval et al. (2022b).
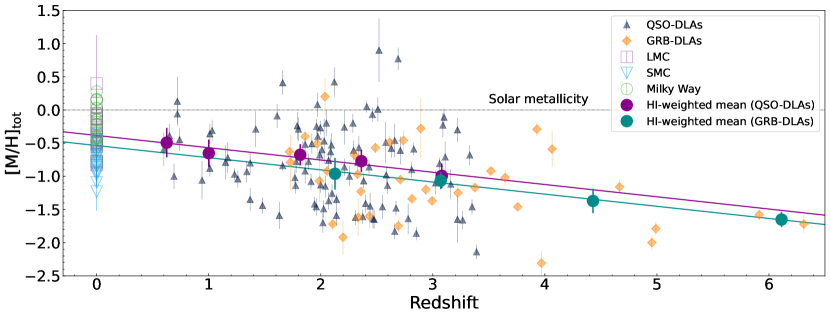
4.2 Cosmic metallicity evolution of the neutral gas - Comparison between QSO- and GRB-DLAs
In Fig. 5 we compare the metallicity evolution with redshift between QSO- and GRB-DLAs. We calculate the -weighted mean from the linear metallicities in five redshift bins for QSO- and GRB-DLAs and plot the points at the mean redshift. We fit the -weighted mean metallicities, taking into account the y-axis uncertainties. The individual metallicity measurements in different environments are shown in Fig. 5. The two linear fits result to [M/]tot for QSO-DLAs and [M/]tot for GRB-DLAs, where is the redshift. There is a small difference between the fits, which we quantify by calculating the difference between the reduced of the two fits (). We note that the two samples have different redshift ranges, with most of the targets concentrating in the redshift range . In this range, the observed scatter is large, and is reflecting the diversity in metallicity of galaxies at any given time. This is not complete, however, since optically- or UV-selected QSOs tend to have lower [M/]tot, because their selection is biased by the presence of dust (Krogager et al. 2019). At higher and lower redshifts there are less data points due to observational limitations. The effect of dust bias will be further investigated with the 4MOST–Gaia Purely Astrometric Quasar Survey (4G-PAQS) (Krogager et al. 2023).
The -weighted mean metallicity is a measure of the metallicity in the neutral gas in the Universe, rather than the metallicity of the individual systems. The agreement between the two fits suggests that QSO- and GRB-DLA may be arising from a similar population of galaxies, or at least probe the neutral gas in the Universe in a similar way (see also Krogager et al. in prep.). We find a decrease of neutral gas metallicity with redshift (), in agreement with previous studies (e.g. De Cia et al. 2018; Mattsson et al. 2019; Péroux & Howk 2020). The inclusion of GRB-DLAs extends the study of the cosmic chemical evolution to (Heintz et al. 2023; Saccardi et al. 2023).
4.3 Dust composition
Figure 3 shows the evolution of dust composition derived from the dust depletion, with [Zn/Fe] for the elements that contribute at least 1 to the dust composition (f¿ 1). Dust depletion can be used to get information on the dust composition in various ways (Savage & Sembach 1996; Jenkins 2014; De Cia et al. 2016; Mattsson et al. 2019; Roman-Duval et al. 2022a).
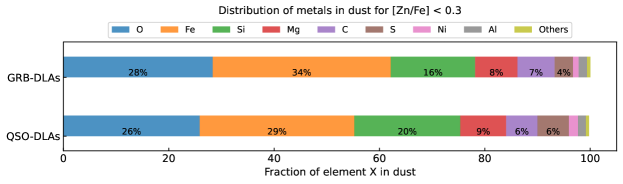
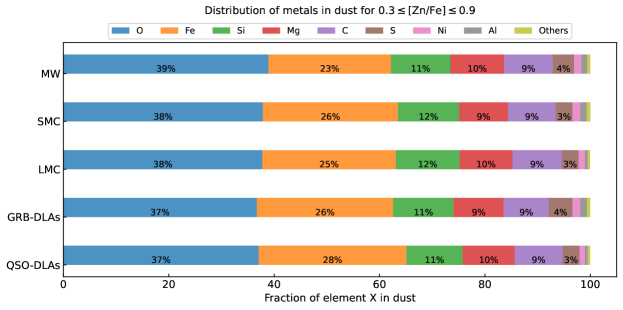
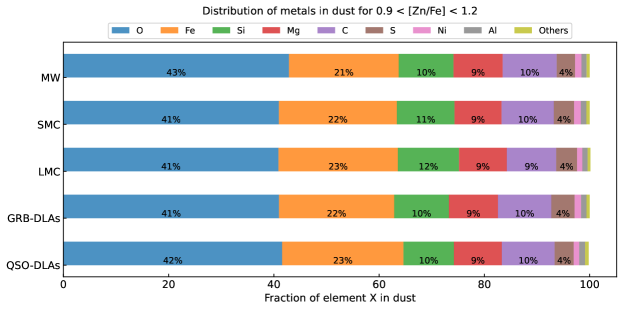
In each panel of Fig. 3 we can see that the main components of dust are by mass, O, Fe, Si, Mg, C, S, Ni and Al. The distribution of the elements that compose dust varies, however, with the amount of dust in the system measured with [Zn/Fe]. Figure 6 visualizes this distribution of metals that compose dust for the least dusty systems (upper panel, e.g. [Zn/Fe] ¡ 0.3), the distribution of metals in the middle range of [Zn/Fe] (middle panel, e.g. 0.3 [Zn/Fe] 0.9) and for most dusty systems (lower panel, e.g. 0.9 ¡ [Zn/Fe] ¡ 1.2). Systems with low dust content ([Zn/Fe] ¡ 0.3) are observed among QSO- and GRB-DLAs, which tend to have a low metallicity. In these systems, the most abundant elements in dust are Fe, O, and after these Si. On the contrary, in the average [Zn/Fe] and high dust content regime (0.9 ¡ [Zn/Fe] ¡ 1.2) O is more abundant than Fe in all the galactic environments. Overall, in GRB-DLAs and QSO-DLAs the contribution of Fe and Si to dust increases steeply as we go towards lower [Zn/Fe] (i.e. less dust), while O decreases. We speculate that this least dusty regime may be one where the seeds of dust grains did not undergo as much grain growth by the gradual accumulation of matter in the ISM, because there was not enough time, or underwent a more efficient dust destruction process by SNe shocks. In low metallicity and low dust environments the dust grains are small and are more easily destroyed by SNe shocks.
The main dust destruction processes in the ISM are either from sputtering by high-velocity SN shocks and photo-destruction by high-energy photons (Dwek et al. 1996; Jones et al. 1996; Bocchio et al. 2014; Slavin et al. 2015), or from consumption of interstellar dust by star formation (astration).
In Table 2 we present the gas- and solid phase abundances in parts-per-million (ppm) of the main elements that contribute to the dust composition for systems in different environments and for the three different intervals of [Zn/Fe] defined above. At low-depletion levels ([Zn/Fe] ¡ 0.3), where dust starts to form, we find for QSO- and GRB-DLAs that the O abundance in dust is 3 times higher than the Si abundance. This suggests that the presence of pyroxene (\chMg_xFe_(1-x)SiO3) is likely. The amounts of Fe and Mg observed in the least-dusty regime suggest a significant contribution of enstatites (\chMgSiO3) and metallic Fe. There is no need to invoke oxydation of Fe (e.g. \chFeO) in the least dusty regime, because all the oxygen can in principle be included in pyroxenes. A more detailed analysis of the dust composition, such as the one presented in Mattsson et al. (2019), is required to accurately constrain the dust composition of the different environments.
| Element X | [X/H]gas (ppm) | [X/H]dust (ppm) | Interval [] | ||||
|---|---|---|---|---|---|---|---|
| QSO-DLAs | GRB-DLAs | Milky Way | LMC | SMC | |||
| O | 490 | 35 | 27 | … | … | … | [] ¡ 0.3 |
| 102 | 118 | 154 | 126 | 125 | 0.3 [] 0.9 | ||
| 186 | 178 | 181 | 172 | 168 | 0.9 ¡ [] ¡ 1.2 | ||
| Fe | 29 | 10 | 27 | … | … | … | [] ¡ 0.3 |
| 23 | 23 | 26 | 25 | 25 | 0.3 [] 0.9 | ||
| 27 | 27 | 27 | 27 | 27 | 0.9 ¡ [] ¡ 1.2 | ||
| Si | 32 | 13 | 8 | … | … | … | [] ¡ 0.3 |
| 14 | 20 | 25 | 25 | 22 | 0.3 [] 0.9 | ||
| 21 | 25 | 27 | 26 | 27 | 0.9 ¡ [] ¡ 1.2 | ||
| Mg | 35 | 7 | 5 | … | … | … | [] ¡ 0.3 |
| 18 | 20 | 27 | 24 | 20 | 0.3 [] 0.9 | ||
| 24 | 27 | 28 | 22 | 26 | 0.9 ¡ [] ¡ 1.2 | ||
| C | 288 | 10 | 8 | … | … | … | [] ¡ 0.3 |
| 34 | 37 | 48 | 43 | 40 | 0.3 [] 0.9 | ||
| 56 | 33 | 81 | 48 | 54 | 0.9 ¡ [] ¡ 1.2 | ||
| S | 14 | 3 | 2 | … | … | … | [] ¡ 0.3 |
| 5 | 6 | 8 | 6 | 5 | 0.3 [] 0.9 | ||
| 7 | 10 | 8 | 8 | 9 | 0.9 ¡ [] ¡ 1.2 | ||
| Ni | 2 | 1 | 0.3 | … | … | … | [] ¡ 0.3 |
| 1 | 1 | 1 | 1 | 1 | 0.3 [] 0.9 | ||
| 1 | 1 | 2 | 1 | 1 | 0.9 ¡ [] ¡ 1.2 | ||
| Al | 3 | 1 | 1 | … | … | … | [] ¡ 0.3 |
| 2 | 2 | 3 | 3 | 2 | 0.3 [] 0.9 | ||
| 3 | 3 | 3 | 2 | 3 | 0.9 ¡ [] ¡ 1.2 | ||
The different environments considered in this study span different ranges of dust content ([Zn/Fe], see Fig. 3). Here we discuss their average properties. For the full range of [Zn/Fe], for all the environments, we find that the largest fraction of dust mass is contributed by O and is increasing with [Zn/Fe] with a smaller increase in the Milky Way and the largest increase for QSO-DLAs. The largest amount of O in dust is found in the Milky Way (44 ) and the smallest in GRB-DLAs (35 ). The second most abundant element in dust is Fe, which is decreasing with [Zn/Fe] for all the environments. A possible cause for the opposite evolutions of the mass abundance of O and C with respect to Fe and other refractory elements is the following. For the least dusty systems, at low levels of [Zn/Fe], most of the Fe and other refractory elements are available in the gas-phase and they are the ones that can more easily be incorporated in dust grains. On the other hand, for very dusty systems, at high levels of dust depletion, there are much fewer atoms of Fe and refractory metals available in the gas-phase to form additional dust, while O and C are always very abundant in the gas-phase. Layers of complexity will need to be added to this simplified picture when considering systems that have intrinsically very low abundance of Fe and heavily refractory metals, for example in the very distant Universe. The chemical evolution of galactic environments and their local star-formation histories influence the availability of metals for dust formation. In regions with lower metallicity and lower dust content, which are chemically less evolved, there might be a reduced abundance of heavy elements crucial for dust production. Si, C, Mg, S, Ni and Al have smaller contributions in dust (¡ 12) in all the environments.
Our current data suggest that C has a similar mass abundance in dust for all the environments, 8 , 9 , 10 , 10 , 12 for QSO-DLAs, GRB-DLAs, LMC, SMC and Milky Way respectively. However, the Milky Way and Magellanic clouds have substantially different extinction curves, in particular the presence and strength of the 2175 feature (e.g. Pei 1992). The origin of the 2175 feature remains unclear and it is likely that a combination of several species that produce it. Some candidates that may produce the feature have been proposed, such as non-graphitic C (Mathis 1994) or polycyclic aromatic hydrocarbons (PAHs, Draine 2003). This indicates that the Milky Way has a much higher content of C-rich dust, possibly polycyclic aromatic hydrocarbons (PAH) (Shivaei et al. 2022), than the LMC and even more the SMC. The SMC extinction curve does mostly not show the 2175 feature, with few exceptions (e.g. Gordon & Clayton 1998; Gordon et al. 2003; Welty & Crowther 2010). Most GRB afterglows also do not show a 2175 feature in their extinction curve (e.g. Zafar et al. 2011; Schady et al. 2012), with some exceptions (Elíasdóttir et al. 2009; Zafar et al. 2012; Heintz et al. 2019). Thus, one could expect a smaller contribution of PAH grains, and possibly C-rich dust and smaller grain sizes to their dust composition. The distribution of PAHs may actually vary with location, being more strongly associated with molecular clouds (Sandstrom et al. 2010). The dust depletion analysis probes more efficiently the warm neutral medium in galaxies, and may be not very sensitive to dust located in dense molecular clouds. Thus our results on the dust composition are only representative of the dust in the warm neutral medium, while the dust located in dense molecular clouds might have a different composition.
The depletion of C in dust is very uncertain for GRB- and QSO-DLAs, because the typical line used to measure the C content is normally highly saturated. In Paper I we derived the depletion of C based only on five Milky Way measurements. This can only give a rough estimate of the C dust depletion. We extrapolate these estimates on the C depletion for the other environments and this is probably the cause of the similar percentages of C dust composition that we obtain, regardless of the presence or not of strong C-dust features in their extinction curves (i.e. SMC, LMC). This highlights the importance of a detailed study of the C depletion and the need for more and reliable measurements for systems in all environments.
Similar C fractions in dust can also result from the fact that most of C is produced by C-rich AGB stars (Gustafsson et al. 1999; Mattsson 2010), the presence of which does not depend on the environment. Although, C-rich massive stars may significantly contribute to the C budget (Gustafsson 2022).
| X | QSO-DLAs | GRB-DLAs | LMC | SMC | Milky Way |
|---|---|---|---|---|---|
| O | 36 | 35 | 38 | 39 | 44 |
| Fe | 27 | 27 | 23 | 24 | 19 |
| Si | 11 | 12 | 12 | 11 | 10 |
| Mg | 9 | 9 | 10 | 9 | 9 |
| C | 8 | 9 | 10 | 10 | 12 |
| S | 4 | 4 | 4 | 3 | 4 |
| Ni | 2 | 1 | 1 | 1 | 1 |
| Al | 1 | 1 | 1 | 1 | 1 |
4.4 Dust extinction from depletion compared to extinction from SED
Figure 4 shows the distribution of with [Zn/Fe] (left panel) and with the total dust corrected metallicity [M/]tot (right panel). The for QSO-DLAs is generally small and is increasing with the dust tracer [Zn/Fe] and with the total dust corrected metallicity [M/]tot. At higher metallicities and [Zn/Fe], the dust extinction is also expected to be higher. The right panel of Fig. 4 shows that, for a given metallicity, QSO-DLAs tend to have a lower than the other systems. This is probably due to the fact that QSO-DLAs probe outer galactic regions than GRB-DLAs (Prochaska et al. 2007; Fynbo et al. 2008) and absorbing systems towards OB stars in local galaxies.
We compare the with , which we measured from the reddening , assuming = 3.08, for the Milky Way , = 3.16 for the LMC and for the SMC (Pei 1992). In the case of GRB-DLAs we compare the with the measured from the SED in Heintz et al. (2023). The comparison between and is shown in Fig. 7. The green circles in 7 highlight systems in the Magellanic Clouds that show a 2175 feature in their dust extinction curve. for QSO-DLAs are difficult to obtain and no measurements are available for the systems that we are studying here. The dust extinction of a sample of QSO-DLAs has been measured in previous studies (Krogager et al. 2016; Heintz et al. 2016), but is only possible for strong absorbers and/or for cases with the 2175 bump present in their spectra. We find that is much lower than for the Milky Way. This could be due to the fact that with we are probing only the warm diffuse ISM, while is the cummulative extinction along the full line of sight, including the warm ISM and also regions of cold dense gas. On the other hand, for the LMC, SMC and GRB-DLAs the is generally in good agreement with , with some exceptions that lie above or below the 1:1 line of equality. In the LMC and the SMC most of the systems lie below the line of equality ( ¿ ). We quantify the correlation between the two measurements of by calculating the between and for all the environments. The Milky Way has the highest with = 2.18 and then the SMC with = 2.14. GRB-DLAs have = 1.03 and finally the LMC = 0.63. We additionally estimate the Pearson’s correlation coefficients r and report: r = 0.55 (GRBs), r = 0.71 (LMC), r = 0.30 (SMC), r = 0.48 (Milky Way). These indicate that the LMC points have the tightest correlation and the SMC the smallest. However, the low r for the SMC is driven only by the outlier marked in the green circle, which if excluded would give r = 0.61. Because this point has different properties due to the presence of the 2175 bump in the dust extinction curve for this system and is a physical outlier.
Savaglio & Fall (2004); Wiseman et al. (2017); Bolmer et al. (2019) also compare their estimates of the dust extinction derived from depletion with the dust extinction derived from SED () for GRB-DLAs. They find that some systems lie above or below the line of equality, with an overall larger scatter that is observed in this paper, and they report that most lines of sight have a larger than . The difference in our method is that we include C, as well as several more metals in the derivation of the (all those that have an elemental abundance ). Dust extinction depends on the composition of the dust, but also on the grain size distribution (Mathis et al. 1977; Pei 1992; Hoffman & Draine 2016; Mattsson 2020), and gray dust has previously been suggested (e.g., Wiseman et al. 2017) as a solution for the high , but low reddening in some sources. If grains are big enough, then the extinction depends less on the wavelength and more on the geometrical cross section, which has been observed in some cases (e.g., Friis et al. 2015). In this case, the extinction curve is achromatic and would be lower because each measurement is sensitive only to wavelength dependent extinction. On the other hand, is an average of the dust extinction in the warm neutral medium of the absorbing galaxies and would be more sensitive to gray dust. The presence of gray dust would result to ¿ . Most of the measurements for GRB-DLAs are done adopting an X-ray spectral slope (e.g., Heintz et al. 2019) and this makes them more robust in presence of gray dust. In any case, we observe only a few systems with significant ¿ , which possibly limits the effects of gray dust in this work.
The shape of the extinction curves depend on several properties, and can be steeper at lower metallicities (e.g. Shivaei et al. 2020), like for GRB-DLAs. and may be probing different types of dust and different regions with lower or higher densities. The methods used to measure and are very different, so that represents a sum of the extinction integrated along the line of sight, including clumps of dense cold regions and intervening systems at lower , while represents an average value in the warm neutral medium through galaxies. On the other hand, the composition of dust plays a role in dust extinction, because the is very sensitive to C-rich dust, but the depletion of C is challenging to constrain. For the calculation of we do take into account C. However, only five Milky Way measurements are available (see Fig. B.2 of Paper I). These are based on only one weak transition (2325), since the allowed transitions at 1036 and 1335 are strongly saturated (Jenkins 2009). In Paper I we adopted the laboratory oscillator strength measurements with no additional correction for the oscillator strength of C.
In Paper I using the depletion coefficients we extrapolated the C depletion measured from a few Milky Way systems to the other environments where no measurements are available. This could mean that the depletion of C might be underestimated and might lead to a lower . On the other hand, is estimated probing also C grains, especially in the Milky Way that has the strongest 2175 feature. This could partly explain the higher values of and the large discrepancy with for the cases where C is present, like for most of the targets in the Milky Way.
In fact, the presence of C-rich dust confined in molecular clouds may explain the discrepancy between and in a few outliers in the Magellanic Clouds as well as in the Milky Way (see Fig. 7). The highly deviating points, Sk 143 (SMC) at = 0.97 and Sk 672 (LMC) at = 0.76, that are marked with green circles in Fig. 7, are moderately reddened stars and the lines of sight with the highest molecular fraction and CN absorption within the SMC and LMC sample (Cartledge et al. 2006; Welty et al. 2006). Sk 143 is, in fact, the only SMC line of sight known to exhibit a Milky Way-like extinction curve, with a 2175 extinction bump (Gordon et al. 2003; Welty & Crowther 2010). In the LMC, Sk 6619 fits a Milky Way-like extinction curve (Gordon et al. 2003) and is marked with a green circle point above the 1:1 line seen in Fig. 7.
The good agreement of the two extinction estimates for GRB-DLAs can be explained by the fact the two measurements may be probing dust with more similar composition - because there may be less C-rich dust given the low metallicity - and in more similar regions - because the GRB is expected to photo-dissociate the surrounding dense region, (e.g., Ledoux et al. 2009), possibly leading to being more representative of the diffuse warm neutral medium in the host galaxy. In general, the measurements of in GRB afterglows are reliable (Watson et al. 2006; Zafar & Watson 2013; Perley et al. 2013; Heintz et al. 2019), because the intrinsic afterglow spectrum is known to be either a power law or a broken power law (e.g. Sari et al. 1998).
Overall, and do not measure dust in the same way or in the same regions. measures the average extinction along the line of sight, while only dusty clouds contribute to (i.e., the latter is not sensitive to the dust-free segments of the line of sight). The analysis of the depletion is mostly probing the warm neutral medium, and less sensitive to the dense clumps of cold molecular gas, which may contain large fractions of C-rich dust. This is a likely cause of the discrepancy between and observed in the Milky Way and a few lines of sight in the Magellanic Clouds.
5 Conclusions
In this paper we measure the dust-to-metal (DTM), dust-to-gas (DTG) ratios, dust extinction from depletion and the fraction of dust mass contributed by element X (f) from the dust depletion of all the elements that contribute to dust. We do this for systems in different environments, QSO-DLAs, GRB-DLAs, LMC, SMC and the Milky Way. We study the DTM, DTG and evolution with the total dust-corrected metallicity and the dust tracer [Zn/Fe]. The evolution of the DTM and DTG with metallicity gives us clues on the dominant mechanisms of dust production. We find that the DTM and DTG ratios increase with metallicity and with [Zn/Fe], which suggests that the dominant mechanism for dust production in the metallicity range (-2 [M/H]tot 0.5) and redshift range () that we study is grain growth in the ISM. Our data are in very good agreement with the dust production and evolution model from Mattsson (2020). The comparison of our data with the model indicates that the stellar dust yield is only 1 of the metals yield, which suggests that the net amount of dust that the overall stellar population produces is about ten times less than what was previously estimated. However, we note that this could be an effect of observational bias, since our data probe sightlines of warm diffuse gas and, as a result, might be missing some dust production contributions from stellar sources.
We investigate the cosmic metallicity evolution of the neutral gas and find a declining evolution with increasing redshift, which is probed both with QSO- and GRB-DLAs in a similar way.
The main elements that contribute to dust are, in order of abundance in mass, O, Fe, Si, Mg, C, S, Ni and Al for different environments and with overall similar percentages. Si, Mg and C have similar contributions by mass in dust in all the environments and vary with the amount of dust in each system, as traced by [Zn/Fe]. O and Fe have the highest fractions among all studied elements and show opposite trends with [Zn/Fe] between each other. O (and C) is increasing, while Fe is decreasing with [Zn/Fe]. This opposite evolution may be due to larger availability of Fe in systems with lower levels of depletions. In the low-dust regime ([Zn/Fe] 0.3), we find that the amount of O in dust is about three times that of Si. This suggests the presence of pyroxenes as the main dust species.
We calculate the dust-to-metal ratio in terms of column density (DTMN), in order to estimate the dust extinction using dust depletion (). The dust extinction is increasing with metallicity and with [Zn/Fe]. At any given metallicity, we find lower values of for QSO-DLAs than for GRB-DLAs, Mikly Way, and Magellanic Clouds. This suggest that not only metallicity but also the presence of dense cold gas at high pressure (such as in galaxy disks) are determinant factors to facilitate the growth of dust in the ISM.
We compare the dust extinction estimated from depletion () with the one estimated from SED or from the reddening (). We find an overall good agreement between and . However, we find that is much lower than for the Milky Way, as well as in a few systems in the SMC and LMC. In all these cases, the systems show a 2175 bump in their extinction curves. The likely cause of the discrepancy is the presence of C-rich dust in clumps of dense cold gas, such as molecular clouds, which are not probed by the depletion measurements. Overall, and do not measure the amount of dust in the same way and in the same regions, with measuring an average extinction along the line of sight and being sensitive to dust-rich clouds. Nevertheless, in this work we refine the measurements of and find a better consistency with . The reasons for the discrepancies that remain are probably related to C-rich dust in clumps of cold dense gas.
Acknowledgements.
We thank the anonymous referee for the useful and constructive comments that improved this manuscript. CK, ADC and TRH acknowledge support by the Swiss National Science Foundation under grant 185692. KEH acknowledges support from the Carlsberg Foundation Reintegration Fellowship Grant CF21-0103. ACA would like to acknowledge support by the Carlsberg Foundation. The Cosmic Dawn Center (DAWN) is funded by the Danish National Research Foundation under grant No. 140. This research has made use of NASA’s Astrophysics Data System.References
- Asplund et al. (2021) Asplund, M., Amarsi, A. M., & Grevesse, N. 2021, A&A, 653, A141
- Berg et al. (2015) Berg, T. A. M., Ellison, S. L., Prochaska, J. X., Venn, K. A., & Dessauges-Zavadsky, M. 2015, MNRAS, 452, 4326
- Blitz & Rosolowsky (2006) Blitz, L. & Rosolowsky, E. 2006, ApJ, 650, 933
- Bocchio et al. (2014) Bocchio, M., Jones, A. P., & Slavin, J. D. 2014, A&A, 570, A32
- Bolmer et al. (2019) Bolmer, J., Ledoux, C., Wiseman, P., et al. 2019, A&A, 623, A43
- Calzetti et al. (1995) Calzetti, D., Bohlin, R. C., Gordon, K. D., Witt, A. N., & Bianchi, L. 1995, ApJ, 446, L97
- Cartledge et al. (2006) Cartledge, S. I. B., Lauroesch, J. T., Meyer, D. M., & Sofia, U. J. 2006, ApJ, 641, 327
- De Cia et al. (2021) De Cia, A., Jenkins, E. B., Fox, A. J., et al. 2021, Nature, 597, 206
- De Cia et al. (2016) De Cia, A., Ledoux, C., Mattsson, L., et al. 2016, A&A, 596, A97
- De Cia et al. (2018) De Cia, A., Ledoux, C., Petitjean, P., & Savaglio, S. 2018, A&A, 611, A76
- De Cia et al. (2013) De Cia, A., Ledoux, C., Savaglio, S., Schady, P., & Vreeswijk, P. M. 2013, A&A, 560, A88
- De Vis et al. (2017) De Vis, P., Gomez, H. L., Schofield, S. P., et al. 2017, MNRAS, 471, 1743
- D’Elia et al. (2011) D’Elia, V., Campana, S., Covino, S., et al. 2011, MNRAS, 418, 680
- Draine (2003) Draine, B. T. 2003, ARA&A, 41, 241
- Draine & Li (2007) Draine, B. T. & Li, A. 2007, ApJ, 657, 810
- Dunne et al. (2003) Dunne, L., Eales, S., Ivison, R., Morgan, H., & Edmunds, M. 2003, Nature, 424, 285
- Dwek (2016) Dwek, E. 2016, ApJ, 825, 136
- Dwek et al. (1996) Dwek, E., Foster, S. M., & Vancura, O. 1996, ApJ, 457, 244
- Elíasdóttir et al. (2009) Elíasdóttir, Á., Fynbo, J. P. U., Hjorth, J., et al. 2009, ApJ, 697, 1725
- Feldmann (2015) Feldmann, R. 2015, MNRAS, 449, 3274
- Field (1974) Field, G. B. 1974, ApJ, 187, 453
- Friis et al. (2015) Friis, M., De Cia, A., Krühler, T., et al. 2015, MNRAS, 451, 167
- Fynbo et al. (2008) Fynbo, J. P. U., Prochaska, J. X., Sommer-Larsen, J., Dessauges-Zavadsky, M., & Møller, P. 2008, ApJ, 683, 321
- Gail et al. (2009) Gail, H. P., Zhukovska, S. V., Hoppe, P., & Trieloff, M. 2009, ApJ, 698, 1136
- Galliano et al. (2008) Galliano, F., Dwek, E., & Chanial, P. 2008, ApJ, 672, 214
- Galliano et al. (2018) Galliano, F., Galametz, M., & Jones, A. P. 2018, ARA&A, 56, 673
- Gordon & Clayton (1998) Gordon, K. D. & Clayton, G. C. 1998, ApJ, 500, 816
- Gordon et al. (2003) Gordon, K. D., Clayton, G. C., Misselt, K. A., Landolt, A. U., & Wolff, M. J. 2003, ApJ, 594, 279
- Gustafsson (2022) Gustafsson, B. 2022, Universe, 8
- Gustafsson et al. (1999) Gustafsson, B., Karlsson, T., Olsson, E., Edvardsson, B., & Ryde, N. 1999, A&A, 342, 426
- Heintz et al. (2023) Heintz, K. E., De Cia, A., Thöne, C. C., et al. 2023, arXiv e-prints, arXiv:2308.14812
- Heintz et al. (2016) Heintz, K. E., Fynbo, J. P. U., Møller, P., et al. 2016, A&A, 595, A13
- Heintz et al. (2019) Heintz, K. E., Ledoux, C., Fynbo, J. P. U., et al. 2019, A&A, 621, A20
- Hoffman & Draine (2016) Hoffman, J. & Draine, B. T. 2016, ApJ, 817, 139
- Höfner & Olofsson (2018) Höfner, S. & Olofsson, H. 2018, A&A Rev., 26, 1
- Hollenbach & McKee (1979) Hollenbach, D. & McKee, C. F. 1979, ApJS, 41, 555
- Hollenbach & Salpeter (1971) Hollenbach, D. & Salpeter, E. E. 1971, ApJ, 163, 155
- Issa et al. (1990) Issa, M. R., MacLaren, I., & Wolfendale, A. W. 1990, A&A, 236, 237
- Jenkins (2009) Jenkins, E. B. 2009, ApJ, 700, 1299
- Jenkins (2014) Jenkins, E. B. 2014, arXiv e-prints, arXiv:1402.4765
- Jenkins & Wallerstein (2017) Jenkins, E. B. & Wallerstein, G. 2017, ApJ, 838, 85
- Jones et al. (1996) Jones, A. P., Tielens, A. G. G. M., & Hollenbach, D. J. 1996, ApJ, 469, 740
- Konstantopoulou et al. (2023) Konstantopoulou, De Cia, Annalisa, Krogager, Jens-Kristian, et al. 2023, A&A, 674, C1
- Konstantopoulou et al. (2022) Konstantopoulou, C., De Cia, A., Krogager, J.-K., et al. 2022, A&A, 666, A12
- Krogager et al. (2016) Krogager, J. K., Fynbo, J. P. U., Heintz, K. E., et al. 2016, ApJ, 832, 49
- Krogager et al. (2019) Krogager, J.-K., Fynbo, J. P. U., Møller, P., et al. 2019, MNRAS, 486, 4377
- Krogager et al. (2023) Krogager, J. K., Leighly, K. M., Fynbo, J. P. U., et al. 2023, The Messenger, 190, 38
- Ledoux et al. (2009) Ledoux, C., Vreeswijk, P. M., Smette, A., et al. 2009, A&A, 506, 661
- Li et al. (2019) Li, Q., Narayanan, D., & Davé, R. 2019, MNRAS, 490, 1425
- Lisenfeld & Ferrara (1998) Lisenfeld, U. & Ferrara, A. 1998, ApJ, 496, 145
- Lodders et al. (2009) Lodders, K., Palme, H., & Gail, H. P. 2009, Landolt & Börnstein, 4B, 712
- Maiolino & Mannucci (2019) Maiolino, R. & Mannucci, F. 2019, A&A Rev., 27, 3
- Mathis (1994) Mathis, J. S. 1994, ApJ, 422, 176
- Mathis et al. (1977) Mathis, J. S., Rumpl, W., & Nordsieck, K. H. 1977, ApJ, 217, 425
- Matsuura et al. (2015) Matsuura, M., Dwek, E., Barlow, M. J., et al. 2015, ApJ, 800, 50
- Mattsson (2010) Mattsson, L. 2010, A&A, 515, A68
- Mattsson (2020) Mattsson, L. 2020, MNRAS, 499, 6035
- Mattsson et al. (2012) Mattsson, L., Andersen, A. C., & Munkhammar, J. D. 2012, MNRAS, 423, 26
- Mattsson et al. (2019) Mattsson, L., De Cia, A., Andersen, A. C., & Petitjean, P. 2019, A&A, 624, A103
- Mattsson et al. (2014) Mattsson, L., De Cia, A., Andersen, A. C., & Zafar, T. 2014, MNRAS, 440, 1562
- Nagao et al. (2018) Nagao, T., Maeda, K., & Yamanaka, M. 2018, MNRAS, 476, 4806
- Noterdaeme et al. (2008) Noterdaeme, P., Ledoux, C., Petitjean, P., & Srianand, R. 2008, A&A, 481, 327
- Pei (1992) Pei, Y. C. 1992, ApJ, 395, 130
- Perley et al. (2013) Perley, D. A., Levan, A. J., Tanvir, N. R., et al. 2013, ApJ, 778, 128
- Péroux et al. (2023) Péroux, C., De Cia, A., & Howk, J. C. 2023, MNRAS, 522, 4852
- Péroux & Howk (2020) Péroux, C. & Howk, J. C. 2020, ARA&A, 58, 363
- Phillips et al. (1982) Phillips, A. P., Gondhalekar, P. M., & Pettini, M. 1982, MNRAS, 200, 687
- Piranomonte et al. (2008) Piranomonte, S., Ward, P. A., Fiore, F., et al. 2008, A&A, 492, 775
- Planck Collaboration et al. (2020) Planck Collaboration, Aghanim, N., Akrami, Y., et al. 2020, A&A, 641, A6
- Prochaska et al. (2007) Prochaska, J. X., Chen, H.-W., Dessauges-Zavadsky, M., & Bloom, J. S. 2007, ApJ, 666, 267
- Rémy-Ruyer et al. (2014) Rémy-Ruyer, A., Madden, S. C., Galliano, F., et al. 2014, A&A, 563, A31
- Roman-Duval et al. (2022a) Roman-Duval, J., Jenkins, E. B., Tchernyshyov, K., et al. 2022a, ApJ, 928, 90
- Roman-Duval et al. (2022b) Roman-Duval, J., Jenkins, E. B., Tchernyshyov, K., et al. 2022b, ApJ, 935, 105
- Roman-Duval et al. (2021) Roman-Duval, J., Jenkins, E. B., Tchernyshyov, K., et al. 2021, ApJ, 910, 95
- Saccardi et al. (2023) Saccardi, A., Vergani, S. D., De Cia, A., et al. 2023, A&A, 671, A84
- Sandstrom et al. (2010) Sandstrom, K. M., Bolatto, A. D., Draine, B. T., Bot, C., & Stanimirović, S. 2010, ApJ, 715, 701
- Sari et al. (1998) Sari, R., Piran, T., & Narayan, R. 1998, ApJ, 497, L17
- Savage & Sembach (1996) Savage, B. D. & Sembach, K. R. 1996, ARA&A, 34, 279
- Savaglio & Fall (2004) Savaglio, S. & Fall, S. M. 2004, ApJ, 614, 293
- Savaglio et al. (2003) Savaglio, S., Fall, S. M., & Fiore, F. 2003, ApJ, 585, 638
- Schady et al. (2012) Schady, P., Dwelly, T., Page, M. J., et al. 2012, A&A, 537, A15
- Shin et al. (2006) Shin, M.-S., Berger, E., Penprase, B. E., et al. 2006, arXiv e-prints, astro
- Shivaei et al. (2022) Shivaei, I., Boogaard, L., Díaz-Santos, T., et al. 2022, MNRAS, 514, 1886
- Shivaei et al. (2020) Shivaei, I., Darvish, B., Sattari, Z., et al. 2020, ApJ, 903, L28
- Slavin et al. (2015) Slavin, J. D., Dwek, E., & Jones, A. P. 2015, ApJ, 803, 7
- Tchernyshyov et al. (2015) Tchernyshyov, K., Meixner, M., Seale, J., et al. 2015, ApJ, 811, 78
- Valiante et al. (2009) Valiante, R., Schneider, R., Bianchi, S., & Andersen, A. C. 2009, MNRAS, 397, 1661
- Watson (2011) Watson, D. 2011, A&A, 533, A16
- Watson et al. (2006) Watson, D., Fynbo, J. P. U., Ledoux, C., et al. 2006, ApJ, 652, 1011
- Welty & Crowther (2010) Welty, D. E. & Crowther, P. A. 2010, MNRAS, 404, 1321
- Welty et al. (2006) Welty, D. E., Federman, S. R., Gredel, R., Thorburn, J. A., & Lambert, D. L. 2006, ApJS, 165, 138
- Wiseman et al. (2017) Wiseman, P., Schady, P., Bolmer, J., et al. 2017, A&A, 599, A24
- Witt & Gordon (2000) Witt, A. N. & Gordon, K. D. 2000, ApJ, 528, 799
- Zafar & Møller (2019) Zafar, T. & Møller, P. 2019, MNRAS, 482, 2731
- Zafar & Watson (2013) Zafar, T. & Watson, D. 2013, Astronomy & Astrophysics, 560, A26
- Zafar et al. (2012) Zafar, T., Watson, D., Elíasdóttir, Á., et al. 2012, ApJ, 753, 82
- Zafar et al. (2011) Zafar, T., Watson, D., Fynbo, J. P. U., et al. 2011, A&A, 532, A143
- Zhukovska et al. (2008) Zhukovska, S., Gail, H. P., & Trieloff, M. 2008, A&A, 479, 453
Appendix A Additional figures
Here we present additional figures for the relation between the DTM by mass and the DTM by column density (DTMN) and for the dust composition f with respect to [Zn/Fe] for all the elements that contribute to dust with f ¿ 1, namely O, S, Si, Mg, Fe, Ni, Al and C. In the dust composition figgures, we show the targets that have dust depletion measurements with filled symbols and the ones whose dust depletion is calculated from the coefficients listed in Table 1 with empty symbols. This is shown for each environment: QSO- and GRB-DLAs, the Milky Way, the LMC and the SMC.
Appendix B Dust properties of the data sample
Here we present the tables of the dust properties for QSO- and GRB-DLAs, the Milky Way, LMC and SMC. We include the redshift zabs, the column densities of H i, H ii, the dust tracer [Zn/Fe], the DTM and DTG in terms of mass, the DTM in terms of column density (DTMN), the dust extinction estimated from the dust depletion and the total dust-corrected metallicity [M/]tot. We note that the DTM in terms of column density (DTMN) is not normalized by the Galactic DTM. We also report the references of the data samples.
| QSO | zabs | log N(H I) | log N(H 2) | [Zn/Fe] | DTM | DTG | DTMN | [M/H]tot | Ref | |
|---|---|---|---|---|---|---|---|---|---|---|
| B0105-008 | 1.371 | 21.700.15 | … | 0.080.05 | 0.060.02 | 4.00e-052.00e-05 | 0.040.01 | 0.010.01 | -1.350.17 | *,2,3 |
| B2314-409 | 1.857 | 20.900.10 | … | 0.180.14 | 0.140.04 | 2.30e-041.20e-04 | 0.100.03 | 0.010.01 | -0.920.19 | *,2,3 |
| B2355-106 | 1.173 | 21.000.10 | … | 0.420.20 | 0.190.05 | 5.10e-043.00e-04 | 0.150.05 | 0.040.02 | -0.720.23 | *,2,3 |
| BRI1013+0035 | 3.104 | 21.100.10 | … | 0.900.05 | 0.350.04 | 3.82e-031.24e-03 | 0.290.06 | 0.360.15 | -0.110.13 | *,2,3 |
| FJ0812+32 | 2.626 | 21.350.10 | … | 0.810.07 | 0.170.14 | 6.10e-045.40e-04 | 0.100.15 | 0.080.12 | -0.580.14 | *,2,3 |
| FJ0812+32 | 2.067 | 21.000.10 | … | 0.060.03 | 0.070.02 | 4.00e-051.00e-05 | 0.040.01 | … | -1.370.13 | *,2,3 |
| FJ2334-0908 | 3.057 | 20.480.05 | … | 0.480.04 | 0.130.15 | 2.90e-043.20e-04 | 0.080.16 | 0.0030.001 | -0.810.09 | *,2,3 |
| HE0515-4414 | 1.150 | 20.450.15 | … | 0.540.20 | 0.230.05 | 5.10e-043.20e-04 | 0.180.05 | 0.010.01 | -0.790.26 | *,2,3 |
| HE1104-1805 | 1.662 | 20.850.01 | … | 0.460.02 | 0.390.10 | 7.80e-042.30e-04 | 0.350.10 | 0.050.02 | -0.840.07 | *,2,3 |
| J0000+0048 | 2.525 | 21.070.10 | … | 1.690.45 | 0.490.07 | 5.43e-026.06e-02 | 0.430.09 | 5.145.91 | 0.900.48 | *,2,3 |
| J0008-0958 | 1.768 | 20.850.15 | … | 0.440.07 | 0.210.03 | … | 0.160.03 | … | 0.00.18 | *,2,3 |
| J0058+0115 | 2.010 | 21.100.15 | … | 0.510.07 | 0.240.03 | 8.50e-043.70e-04 | 0.190.04 | 0.080.04 | -0.600.18 | *,2,3 |
| J0256+0110 | 0.725 | 20.700.16 | … | 0.800.30 | 0.330.06 | 6.18e-035.38e-03 | 0.270.07 | 0.230.22 | 0.130.37 | *,2,3 |
| J0927+1543 | 1.731 | … | … | 0.980.25 | 0.350.06 | … | 0.300.07 | … | … | *,2,3 |
| J1049-0110 | 1.658 | 20.310.15 | … | 0.710.07 | 0.260.04 | 9.32e-034.11e-03 | 0.220.05 | 0.140.08 | 0.410.18 | *,2,3 |
| J1056+1208 | 1.610 | 21.450.15 | … | 0.690.07 | 0.280.04 | 3.20e-031.39e-03 | 0.230.05 | 0.670.39 | -0.090.18 | *,2,3 |
| J1107+0048 | 0.740 | 21.000.05 | … | 0.280.105 | 0.160.03 | 8.00e-043.50e-04 | 0.120.03 | 0.050.03 | -0.450.17 | *,2,3 |
| J1135-0010 | 2.207 | 22.050.10 | … | 0.600.04 | 0.270.03 | 5.20e-041.70e-04 | 0.210.04 | 0.420.18 | -0.860.13 | *,2,3 |
| J1142+0701 | 1.841 | 21.500.15 | … | 0.560.07 | 0.250.03 | 7.90e-043.40e-04 | 0.200.04 | 0.180.10 | -0.650.18 | *,2,3 |
| J1155+0530 | 3.326 | 21.050.10 | … | 0.260.09 | 0.180.02 | 5.20e-041.90e-04 | 0.130.03 | 0.040.02 | -0.680.15 | *,2,3 |
| J1200+4015 | 3.220 | 20.650.15 | … | 0.290.07 | 0.170.02 | 1.22e-035.30e-04 | 0.130.03 | 0.040.02 | -0.300.18 | *,2,3 |
| J1211+0833 | 2.117 | 21.000.20 | … | 1.560.07 | 0.470.06 | 1.73e-029.02e-03 | 0.410.08 | 1.380.98 | 0.420.22 | *,2,3 |
| J1237+0647 | 2.690 | 20.000.15 | … | 1.190.02 | 0.410.05 | 3.37e-021.38e-02 | 0.350.07 | 0.260.15 | 0.770.17 | *,2,3 |
| J1240+1455 | 3.108 | 21.300.20 | … | 1.050.08 | 0.370.05 | 9.90e-045.40e-04 | 0.310.06 | 0.150.11 | -0.710.23 | *,2,3 |
| J1310+5424 | 1.801 | 21.450.15 | … | 0.670.07 | 0.260.05 | 1.85e-038.30e-04 | 0.210.05 | 0.390.23 | -0.290.18 | *,2,3 |
| J1313+1441 | 1.795 | … | … | 0.490.07 | 0.210.03 | … | 0.170.04 | … | … | *,2,3 |
| J1417+4132 | 1.951 | 21.450.25 | … | 0.710.07 | 0.190.19 | … | 0.120.21 | … | … | *,2,3 |
| J1431+3952 | 0.602 | 21.200.10 | … | 0.620.22 | 0.280.05 | 9.90e-045.90e-04 | 0.220.05 | 0.110.08 | -0.590.25 | *,2,3 |
| J1454+0941 | 1.788 | 20.500.15 | … | 0.440.13 | 0.210.03 | 1.65e-038.40e-04 | 0.160.04 | 0.040.02 | -0.240.21 | *,2 |
| J1541+3153 | 2.444 | 20.950.10 | … | 0.270.16 | 0.160.03 | 8.00e-054.00e-05 | 0.120.03 | … | -1.450.20 | *,2,3 |
| J1552+4910 | 1.960 | … | … | 0.200.07 | 0.120.03 | 6.00e-052.00e-05 | 0.090.02 | … | -1.460.13 | *,2,3 |
| J1604+3951 | 3.163 | 21.750.20 | … | 0.390.07 | 0.200.02 | 2.10e-041.10e-04 | 0.150.03 | 0.080.06 | -1.120.22 | *,2,3 |
| J1623+0718 | 1.336 | 21.350.10 | … | 0.380.10 | 0.180.03 | 3.00e-041.20e-04 | 0.140.03 | 0.050.02 | -0.930.16 | *,2,3 |
| J2328+0022 | 0.652 | 20.320.07 | … | 0.340.15 | 0.180.03 | 1.04e-034.70e-04 | 0.140.04 | 0.010.01 | -0.390.18 | *,2,3 |
| J2340-00 | 2.054 | 20.350.15 | … | 0.390.09 | 0.170.03 | 1.51e-037.20e-04 | 0.140.04 | 0.020.01 | -0.200.19 | *,2,3 |
| PSS1253-0228 | 2.783 | 21.850.20 | … | 0.160.08 | 0.100.02 | 3.00e-052.00e-05 | 0.070.02 | 0.010.01 | -1.640.23 | *,2,3 |
| PSSJ2344+0342 | 3.220 | 21.250.08 | … | -0.080.34 | 0.00110.120 | 3.00e-074.00e-05 | 0.001 0.08 | … | -1.650.35 | *,2,3 |
| Q0000-263 | 3.390 | 21.400.08 | … | -0.110.06 | 0.0030.16 | 3.00e-072.00e-05 | 0.0030.16 | … | -2.140.11 | *,1,3 |
| Q0010-002 | 2.025 | 20.950.10 | … | -0.250.06 | 0.00050.030 | 2.00e-071.00e-05 | 0.0010.03 | … | -1.490.13 | *,1,3 |
| Q0013-004 | 1.973 | 20.830.05 | 18.861.14 | 0.750.01 | 0.320.04 | 1.77e-034.60e-04 | 0.260.05 | 0.090.03 | -0.400.10 | *,1,3 |
| Q0027-1836 | 2.402 | 21.750.10 | 17.300.07 | 0.560.03 | 0.240.03 | 1.30e-044.00e-05 | 0.190.04 | 0.050.02 | -1.410.13 | *,2,3 |
| Q0058-292 | 2.671 | 21.100.10 | … | 0.240.03 | 0.140.01 | 6.00e-052.00e-05 | 0.100.02 | 0.010.001 | -1.480.11 | *,1,3 |
| Q0100+130 | 2.309 | 21.350.08 | … | 0.130.01 | 0.090.01 | 3.00e-051.00e-05 | 0.060.01 | … | -1.620.11 | *,1,3 |
| Q0102-190a | 2.370 | 21.000.08 | … | 0.010.08 | 0.010.03 | … | 0.010.02 | … | … | *,1,3 |
| Q0149+33 | 2.141 | 20.500.10 | … | 0.050.10 | 0.060.03 | 2.00e-051.00e-05 | 0.040.02 | … | -1.590.16 | *,2,3 |
| Q0201+365 | 2.463 | 20.380.05 | … | 0.200.05 | 0.140.02 | 1.67e-034.70e-04 | 0.100.02 | 0.030.01 | -0.070.11 | *,2,3 |
| Q0216+080a | 1.769 | 20.300.10 | … | 0.240.06 | 0.150.02 | 1.90e-047.00e-05 | 0.10.02 | … | -1.020.13 | *,1,3 |
| Q0216+080b | 2.293 | 20.500.10 | … | 0.330.05 | 0.170.02 | 5.90e-042.20e-04 | 0.130.03 | 0.010.01 | -0.610.15 | *,1,3 |
| Q0302-223 | 1.009 | 20.360.11 | … | 0.520.08 | 0.220.03 | 1.31e-034.90e-04 | 0.170.04 | 0.020.01 | -0.360.15 | *,2,3 |
| Q0347-383 | 3.025 | 20.730.05 | 14.530.06 | 0.630.05 | 0.280.08 | 3.10e-041.50e-04 | 0.220.09 | 0.010.01 | -1.10 0.18 | *,1,3 |
| Q0405-443a | 1.913 | 20.800.10 | … | 0.020.04 | 0.030.02 | 4.00e-052.00e-05 | 0.020.01 | … | -1.080.12 | *,1,3 |
| Q0405-443b | 2.550 | 21.150.15 | … | 0.150.04 | 0.110.02 | 5.00e-052.00e-05 | 0.080.02 | … | -1.460.18 | *,1,3 |
| Q0405-443c | 2.595 | 21.050.10 | 18.140.07 | 0.260.01 | 0.150.02 | 1.50e-044.00e-05 | 0.110.02 | 0.010.001 | -1.140.12 | *,1,3 |
| Q0449-1645 | 1.007 | 20.980.07 | … | 0.270.07 | 0.160.02 | 2.90e-049.00e-05 | 0.110.03 | 0.020.01 | -0.880.12 | *,2,3 |
| Q0458-020 | 2.040 | 21.700.10 | … | 0.570.04 | 0.250.03 | 2.50e-041.00e-04 | 0.20.04 | 0.090.04 | -1.150.16 | *,1,3 |
| Q0528-250a | 2.141 | 20.980.05 | … | 0.250.04 | 0.140.02 | 9.00e-052.00e-05 | 0.10.02 | 0.0100.001 | -1.350.08 | *,1,3 |
| Q0528-250b | 2.811 | 21.350.07 | 18.220.11 | 0.370.01 | 0.160.02 | 2.70e-049.00e-05 | 0.120.03 | 0.040.02 | -0.900.12 | *,1,3 |
| Q0551-366 | 1.962 | 20.700.08 | 17.420.14 | 0.710.04 | 0.290.04 | 2.26e-036.50e-04 | 0.230.05 | 0.080.03 | -0.250.11 | *,1,3 |
| Q0642-5038 | 2.659 | 20.950.08 | … | 0.220.05 | 0.140.02 | 3.00e-051.00e-05 | 0.100.02 | … | -1.830.12 | *,2,3 |
| Q0841+129a | 1.864 | 21.000.10 | … | -0.100.12 | 0.000170.04 | … | 0.00020.03 | … | … | *,1 |
| Q0841+129b | 2.375 | 21.050.10 | … | 0.150.03 | 0.110.02 | 4.00e-051.00e-05 | 0.080.02 | … | -1.610.11 | *,1,3 |
| Q0841+129c | 2.476 | 20.800.10 | … | 0.130.04 | 0.170.11 | 5.00e-054.00e-05 | 0.160.12 | … | -1.650.14 | *,1,3 |
| Q0918+1636 | 2.583 | 20.960.05 | … | 0.720.01 | 0.290.04 | 1.31e-039.50e-04 | 0.230.05 | 0.090.07 | -0.490.31 | *,2,3 |
| Q0918+1636 | 2.412 | 21.260.06 | … | 0.470.29 | 0.230.06 | 3.65e-031.16e-03 | 0.180.06 | 0.460.20 | 0.050.09 | *,2,3 |
| Q0933+733 | 1.479 | 21.620.10 | … | 0.260.02 | 0.150.02 | 8.00e-052.00e-05 | 0.110.02 | 0.020.01 | -1.440.12 | *,2,3 |
| Q0935+417 | 1.373 | 20.520.10 | … | 0.180.10 | 0.120.03 | 2.60e-041.10e-04 | 0.080.02 | 0.010.0 | -0.800.16 | *,2,3 |
| Q0948+433 | 1.233 | 21.620.06 | … | 0.340.01 | 0.180.02 | 2.70e-046.00e-05 | 0.140.02 | 0.080.02 | -0.970.09 | *,2,3 |
| Q1010+0003 | 1.265 | 21.520.07 | … | 0.440.08 | 0.210.03 | 2.60e-049.00e-05 | 0.160.03 | 0.060.02 | -1.040.13 | *,2,3 |
| Q1037-270 | 2.139 | 19.700.05 | … | 0.070.02 | 0.080.02 | … | 0.050.02 | … | … | *,1,3 |
| Q1111-152 | 3.266 | 21.300.05 | … | 0.250.09 | 0.130.03 | 4.00e-052.00e-05 | 0.100.03 | 0.0100.001 | -1.660.14 | *,1,3 |
| Q1117-134 | 3.350 | 20.950.10 | … | 0.140.06 | 0.090.02 | 4.00e-051.00e-05 | 0.060.02 | … | -1.460.11 | *,1,3 |
| Q1137+3907 | 0.720 | 21.100.10 | … | 0.730.07 | 0.310.04 | 3.80e-031.31e-03 | 0.250.05 | 0.350.15 | -0.060.14 | *,2,3 |
| Q1157+014 | 1.944 | 21.800.10 | … | 0.300.01 | 0.170.02 | 9.00e-053.00e-05 | 0.120.03 | 0.040.02 | -1.420.11 | *,1,3 |
| Q1209+093 | 2.584 | 21.400.10 | … | 0.450.03 | 0.220.03 | 3.20e-041.00e-04 | 0.170.03 | 0.060.02 | -0.980.13 | *,1,3 |
| Q1210+17 | 1.892 | 20.630.08 | … | 0.140.06 | 0.110.02 | 2.50e-048.00e-05 | 0.070.02 | 0.0100.001 | -0.780.12 | *,2,3 |
| Q1215+33 | 1.999 | 20.950.07 | … | 0.330.07 | 0.190.02 | 2.00e-046.00e-05 | 0.140.03 | 0.010.0 | -1.130.12 | *,2,3 |
| Q1223+178 | 2.466 | 21.400.10 | … | -0.030.02 | 0.060.01 | 2.00e-051.00e-05 | 0.0400.001 | … | -1.640.14 | *,1,3 |
| Q1232+082 | 2.338 | 20.900.10 | … | 0.770.14 | 0.290.05 | 1.07e-034.70e-04 | 0.230.06 | 0.060.03 | -0.570.18 | *,2,3 |
| Q1328+307 | 0.692 | 21.250.10 | … | 0.480.14 | 0.240.04 | 3.30e-041.60e-04 | 0.190.04 | 0.040.02 | -1.000.19 | *,2,3 |
| Q1331+170 | 1.776 | 21.150.07 | … | 0.660.04 | 0.290.03 | 2.90e-049.00e-05 | 0.230.04 | 0.030.01 | -1.140.12 | *,1,3 |
| Q1354+258 | 1.420 | 21.540.06 | … | 0.330.09 | 0.180.02 | 1.32e-038.40e-04 | 0.140.03 | 0.310.20 | -0.290.27 | *,2,3 |
| Q1409+095a | 2.019 | 20.650.10 | … | 0.100.13 | 0.080.04 | 2.00e-051.00e-05 | 0.060.03 | … | -1.700.15 | *,1,3 |
| Q1425+6039 | 2.827 | 20.300.04 | … | 0.440.04 | 0.220.02 | 8.00e-041.80e-04 | 0.170.03 | 0.010.0 | -0.590.09 | *,2,3 |
| Q1444+014 | 2.087 | 20.250.07 | 18.160.14 | 0.860.07 | 0.340.05 | 1.11e-035.10e-04 | 0.280.06 | 0.010.01 | -0.630.19 | *,1,3 |
| Q1451+123a | 2.255 | 20.350.10 | … | 0.270.12 | 0.150.03 | 2.10e-049.00e-05 | 0.110.03 | … | -1.000.15 | *,1,3 |
| Q1727+5302 | 1.031 | 21.410.15 | … | 0.690.24 | 0.270.05 | 1.86e-037.70e-04 | 0.220.06 | 0.360.20 | -0.310.16 | *,2,3 |
| Q1727+5302 | 0.945 | 21.160.10 | … | 0.710.11 | 0.290.04 | 3.50e-042.40e-04 | 0.230.05 | 0.040.03 | -1.060.29 | *,2,3 |
| Q1755+578 | 1.971 | 21.400.15 | … | 0.810.07 | 0.310.04 | 5.16e-032.24e-03 | 0.250.05 | 0.970.56 | 0.080.18 | *,2,3 |
| Q2116-358 | 1.996 | 20.100.07 | … | 0.450.09 | 0.220.03 | 1.67e-034.50e-04 | 0.170.04 | 0.010.01 | -0.270.10 | *,1,3 |
| Q2138-444a | 2.383 | 20.600.05 | … | 0.330.08 | 0.190.02 | 2.20e-046.00e-05 | 0.140.03 | 0.010.0 | -1.070.11 | *,1,3 |
| Q2138-444b | 2.852 | 20.980.05 | … | 0.020.03 | 0.060.01 | 1.00e-050.00e+00 | 0.030.01 | … | -1.860.10 | *,1,3 |
| Q2206-199a | 1.921 | 20.670.05 | … | 0.200.01 | 0.140.02 | 6.20e-042.20e-04 | 0.100.02 | 0.020.01 | -0.510.15 | *,1,3 |
| Q2228-3954 | 2.095 | 21.200.10 | … | 0.080.06 | 0.060.02 | 5.00e-052.00e-05 | 0.040.01 | … | -1.260.14 | *,2,3 |
| Q2230+025 | 1.864 | 20.830.05 | … | 0.350.07 | 0.180.02 | 7.60e-042.20e-04 | 0.130.03 | 0.030.01 | -0.520.11 | *,2,3 |
| Q2231-00 | 2.066 | 20.530.08 | … | 0.210.06 | 0.150.02 | 3.50e-041.10e-04 | 0.100.02 | 0.010.0 | -0.760.12 | *,2,3 |
| Q2243-605 | 2.331 | 20.650.05 | … | 0.260.02 | 0.160.02 | 3.50e-041.10e-04 | 0.110.02 | 0.010.0 | -0.790.12 | *,1,3 |
| Q2318-1107 | 1.989 | 20.680.05 | 15.490.03 | 0.340.03 | 0.200.02 | 5.80e-041.40e-04 | 0.150.02 | 0.020.01 | -0.680.09 | *,2,3 |
| Q2332-094a | 2.287 | 20.070.07 | … | 0.920.04 | 0.350.04 | 3.09e-031.07e-03 | 0.290.06 | 0.030.01 | -0.200.14 | *,1,3 |
| Q2343+125 | 2.431 | 20.400.07 | 13.690.09 | 0.390.03 | 0.210.02 | 3.90e-041.00e-04 | 0.160.03 | 0.010.0 | -0.860.10 | *,1,3 |
| Q2359-022a | 2.095 | 20.650.10 | … | 0.750.08 | 0.290.04 | 1.19e-035.20e-04 | 0.240.05 | 0.040.02 | -0.530.18 | *,1,3 |
| SDSS0225+0054 | 2.714 | 21.000.15 | … | 0.330.14 | 0.180.03 | 6.30e-043.20e-04 | 0.140.04 | 0.040.03 | -0.610.21 | *,2,3 |
| SDSS1116+4118A | 2.662 | 20.480.10 | … | 0.790.22 | 0.310.05 | 1.47e-038.80e-04 | 0.250.06 | 0.030.02 | -0.460.25 | *,2,3 |
| SDSS1249-0233 | 1.781 | 21.450.15 | … | 0.420.05 | 0.210.02 | 4.70e-041.90e-04 | 0.150.03 | 0.090.05 | -0.780.17 | *,2,3 |
| SDSS1610+4724 | 2.508 | 21.150.15 | … | 0.690.07 | 0.280.04 | 4.04e-031.76e-03 | 0.230.05 | 0.420.24 | 0.010.18 | *,2,3 |
| SDSS2059-0529 | 2.210 | 20.800.20 | … | 0.680.16 | 0.300.04 | 2.26e-031.39e-03 | 0.240.05 | 0.10.08 | -0.260.26 | *,2,3 |
| SDSS2100-0641 | 3.092 | 21.050.15 | … | 0.620.07 | 0.270.03 | 2.23e-039.60e-04 | 0.210.04 | 0.180.10 | -0.230.18 | *,2,3 |
| UM673A | 1.626 | 20.700.10 | … | -0.420.15 | 0.030.06 | 1.00e-052.00e-05 | 0.020.05 | … | -1.590.20 | *,2,3 |
| eHAQ0111+0641 | 2.027 | 21.500.30 | … | 0.440.14 | 0.220.04 | 1.05e-038.40e-04 | 0.170.04 | 0.230.25 | -0.470.34 | *,2,3 |
References: Measurements of the DTM, DTG, DTMN and are from () this work, column densities from (1) De Cia et al. (2016); (2) Berg et al. (2015) and total dust-corrected metallicities from De Cia et al. (2018).
| Star | log N(H I) | log N(H 2) | [Zn/Fe] | DTM | DTG | DTMN | [M/H]tot | Ref | |
|---|---|---|---|---|---|---|---|---|---|
| 1-SCO | … | … | 1.530.21 | 0.460.06 | … | 0.400.08 | … | … | *,2 |
| 23O-ORI | … | … | 1.750.08 | 0.560.08 | … | 0.540.08 | … | … | *,2 |
| 62-TAU | 20.950.10 | 20.790.10 | 1.560.09 | 0.470.06 | 2.55e-038.30e-04 | 0.410.08 | 0.440.23 | -0.410.13 | *,1 |
| BET-1-SCO | … | … | 1.560.23 | 0.520.14 | … | 0.480.15 | … | … | *,2 |
| CHI-OPH | 21.130.10 | 20.630.10 | 1.290.04 | 0.430.05 | 2.80e-037.90e-04 | 0.370.07 | 0.480.24 | -0.330.11 | *,1 |
| DEL-ORI-A | … | … | 1.410.08 | 0.480.08 | … | 0.420.09 | … | … | *,2 |
| EPS-ORI | … | … | 1.610.08 | 0.520.07 | … | 0.470.09 | … | … | *,2 |
| EPS-PER | 20.450.10 | 19.520.10 | 1.380.14 | 0.450.06 | 4.12e-031.33e-03 | 0.390.07 | 0.110.06 | -0.180.13 | *,1 |
| HD-110432 | 20.850.10 | 20.640.10 | 1.510.08 | 0.460.06 | 4.67e-031.72e-03 | 0.400.08 | 0.590.33 | -0.140.15 | *,1 |
| HD-116852 | … | … | 0.840.04 | 0.340.04 | … | 0.270.05 | … | … | *,2 |
| HD-149404 | 21.400.10 | 20.790.10 | 1.410.09 | 0.450.06 | 5.68e-031.37e-03 | 0.390.07 | 1.660.80 | -0.040.09 | *,1 |
| HD-154368 | 21.000.10 | 21.160.10 | 1.290.04 | 0.430.05 | 2.28e-036.90e-04 | 0.370.07 | 0.690.36 | -0.420.12 | *,1 |
| HD-164402 | 21.110.10 | 19.490.10 | 1.150.04 | 0.410.05 | 4.00e-031.13e-03 | 0.340.07 | 0.420.21 | -0.150.11 | *,1 |
| HD-18100 | … | … | 0.800.06 | 0.330.04 | … | 0.270.05 | … | … | *,2 |
| HD-188439 | 20.780.10 | 19.950.10 | 1.200.03 | 0.410.05 | 6.03e-031.22e-03 | 0.350.07 | 0.360.17 | 0.020.07 | *,1 |
| HD-199579 | 21.040.10 | 20.530.10 | 1.650.06 | 0.480.06 | 9.71e-033.37e-03 | 0.420.08 | 1.380.75 | 0.160.14 | *,1 |
| HD-206267 | 21.300.10 | 20.860.10 | 1.420.12 | 0.450.06 | 3.84e-031.16e-03 | 0.390.07 | 1.050.54 | -0.210.12 | *,1 |
| HD-215733 | … | … | 0.920.13 | 0.350.05 | … | 0.290.06 | … | … | *,2 |
| HD-62542 | 20.700.10 | 20.810.10 | 1.500.05 | 0.460.06 | 2.34e-036.60e-04 | 0.400.08 | 0.330.28 | -0.440.11 | *,1 |
| HD-73882 | 21.110.10 | 21.110.10 | 1.260.10 | 0.420.06 | 2.19e-036.30e-04 | 0.360.07 | 0.670.34 | -0.430.11 | *,1 |
| HR-4908 | 21.080.10 | 20.140.10 | 1.400.08 | 0.450.06 | 6.67e-032.02e-03 | 0.390.07 | 0.780.40 | 0.030.12 | *,1 |
| IOT-ORI | 20.200.10 | 14.690.10 | 1.430.10 | 0.450.06 | 1.200e-023.88e-03 | 0.390.07 | 0.150.08 | 0.280.13 | *,1 |
| KAP-AQL | 20.900.10 | 20.310.10 | 1.280.05 | 0.430.05 | 3.61e-031.24e-03 | 0.370.07 | 0.340.18 | -0.220.14 | *,1 |
| KSI-PER | … | … | 1.520.04 | 0.410.08 | … | 0.320.10 | … | … | *,2 |
| LAM-SCO | … | … | 1.220.07 | 0.390.09 | … | 0.330.10 | … | … | *,2 |
| MU-COL | … | … | 1.130.08 | 0.420.05 | … | 0.360.06 | … | … | *,2 |
| OMI-PER | 20.820.10 | 20.600.10 | 1.400.09 | 0.450.06 | 2.54e-031.10e-03 | 0.390.07 | 0.290.17 | -0.390.18 | *,1 |
| PI-SCO | … | … | 1.530.10 | 0.470.06 | … | 0.410.08 | … | … | *,2 |
| RHO-OPH-A | 21.630.10 | 20.570.10 | 1.190.07 | 0.410.05 | 9.50e-042.90e-04 | 0.350.07 | 0.370.19 | -0.780.12 | *,1 |
| TAU-CMA | … | … | 1.330.10 | 0.500.09 | … | 0.460.10 | … | … | *,2 |
| TET-MUS | 21.150.10 | 19.830.10 | 1.320.04 | 0.430.06 | 8.48e-032.24e-03 | 0.370.07 | 1.030.51 | 0.150.10 | *,1 |
| TET01-ORI-C | 21.540.10 | 17.250.10 | 1.040.05 | 0.380.05 | 1.69e-038.00e-04 | 0.320.06 | 0.440.28 | -0.500.20 | *,1 |
| V600-HER | … | … | 0.840.08 | 0.340.04 | … | 0.280.05 | … | … | *,2 |
| X-PER | 20.730.1 | 20.920.10 | 1.330.05 | 0.440.05 | 1.68e-034.10e-04 | 0.370.07 | 0.290.14 | -0.560.09 | *,1 |
| ZET-OPH | … | … | 1.650.06 | 0.470.07 | … | 0.410.09 | … | … | *,2 |
| ZET-ORI-A | 20.390.10 | 15.860.10 | 1.410.10 | 0.450.06 | 8.99e-032.17e-03 | 0.390.07 | 0.170.08 | 0.160.09 | *,1 |
| ZET-PUP | … | … | 1.210.21 | 0.390.06 | … | 0.340.07 | … | … | *,2 |
References: Measurements of the DTM, DTG, DTMN and are from () this work, column densities from (1) De Cia et al. (2021); (2) Jenkins (2009) and total dust-corrected metallicities from De Cia et al. (2021).
| Star | log N(H I) | log N(H 2) | [Zn/Fe] | DTM | DTG | DTMN | [M/H]tot | Ref | |
| BI173 | 21.250.05 | 15.640.10 | 0.830.05 | 0.340.04 | 1.54e-033.00e-04 | 0.280.05 | 0.200.05 | -0.490.07 | *,1,2 |
| BI184 | 21.150.04 | 19.650.10 | 0.730.08 | 0.320.04 | 1.86e-034.80e-04 | 0.260.05 | 0.190.06 | -0.380.10 | *,1,2 |
| BI237 | 21.650.03 | 20.050.10 | 0.980.07 | 0.370.05 | 1.65e-032.50e-04 | 0.310.06 | 0.560.12 | -0.500.04 | *,1,2 |
| BI253 | 21.680.03 | 19.760.10 | 0.830.04 | 0.340.04 | 1.39e-031.90e-04 | 0.270.05 | 0.490.10 | -0.530.03 | *,1,2 |
| PGMW3120 | 21.480.03 | 18.300.10 | 0.970.08 | 0.370.05 | 1.64e-034.00e-04 | 0.310.06 | 0.370.11 | -0.500.09 | *,1,2 |
| PGMW3223 | 21.400.06 | 18.690.10 | 1.030.06 | 0.390.05 | 2.71e-037.00e-04 | 0.320.06 | 0.510.17 | -0.300.10 | *,1,2 |
| SK 6522 | 20.660.03 | 14.930.10 | 0.830.06 | 0.330.04 | 3.36e-036.70e-04 | 0.270.05 | 0.110.03 | -0.140.07 | *,1,2 |
| SK 66172 | 21.270.03 | 18.210.10 | 1.110.06 | 0.400.05 | 1.91e-034.30e-04 | 0.330.06 | 0.270.08 | -0.460.08 | *,1,2 |
| SK-6619 | 21.870.07 | 20.200.10 | 1.250.13 | 0.420.06 | 2.28e-038.90e-04 | 0.360.07 | 1.310.59 | -0.410.16 | *,1,2 |
| SK 6635 | 20.850.04 | 19.300.10 | 0.840.14 | 0.340.05 | 4.19e-031.47e-03 | 0.270.06 | 0.220.09 | -0.050.14 | *,1,2 |
| SK 67101 | 20.200.04 | 14.140.10 | 0.680.13 | 0.310.04 | 5.45e-032.00e-03 | 0.250.05 | 0.060.03 | 0.100.15 | *,1,2 |
| SK 67105 | 21.260.04 | 19.130.10 | 0.860.07 | 0.210.16 | 5.00e-043.90e-04 | 0.140.17 | 0.050.07 | -0.770.09 | *,1,2 |
| SK-67191 | 20.780.03 | 14.280.10 | 0.520.20 | 0.240.05 | 1.09e-036.20e-04 | 0.190.06 | 0.050.03 | -0.490.23 | *,1,2 |
| SK 672 | 21.460.12 | 20.950.10 | 1.150.11 | 0.410.05 | 8.40e-041.70e-04 | 0.350.07 | 0.190.07 | -0.830.07 | *,1,2 |
| SK 67211 | 20.810.04 | 13.980.10 | 0.730.06 | 0.310.04 | 3.77e-035.80e-04 | 0.250.05 | 0.180.04 | -0.060.04 | *,1,2 |
| SK 675 | 21.040.04 | 19.460.10 | 1.000.05 | 0.370.05 | 1.76e-032.70e-04 | 0.310.06 | 0.150.03 | -0.470.04 | *,1,2 |
| SK 68129 | 21.620.14 | 20.200.10 | 1.330.14 | 0.440.05 | 4.51e-032.15e-03 | 0.370.07 | 1.470.87 | -0.130.20 | *,1,2 |
| SK 68135 | 21.480.02 | 19.870.10 | 1.040.07 | 0.390.05 | 1.66e-032.30e-04 | 0.320.06 | 0.380.08 | -0.510.03 | *,1,2 |
| SK 68140 | 21.510.11 | 20.110.10 | 1.160.10 | 0.410.05 | 4.11e-031.60e-03 | 0.340.07 | 1.030.50 | -0.140.16 | *,1,2 |
| SK 68155 | 21.470.09 | 19.990.10 | 1.060.05 | 0.390.05 | 4.13e-031.16e-03 | 0.330.06 | 0.930.35 | -0.120.11 | *,1,2 |
| SK 6826 | 21.650.06 | 20.380.10 | 1.050.15 | 0.380.05 | 9.00e-043.70e-04 | 0.320.07 | 0.310.14 | -0.770.17 | *,1,2 |
| SK 6852 | 21.310.06 | 19.470.10 | 0.430.12 | 0.210.04 | 1.59e-032.80e-04 | 0.160.04 | 0.230.06 | -0.270.03 | *,1,2 |
| SK 6873 | 21.680.02 | 20.090.10 | 1.240.12 | 0.380.12 | 3.48e-031.08e-03 | 0.310.13 | 1.250.53 | -0.180.03 | *,1,2 |
| SK 69104 | 19.570.68 | 14.030.10 | 1.060.27 | 0.390.06 | 1.36e-022.30e-02 | 0.320.07 | 0.040.09 | 0.400.73 | *,1,2 |
| SK 69175 | 20.640.03 | 14.280.10 | 0.380.12 | 0.200.03 | 8.00e-042.70e-04 | 0.150.04 | 0.020.01 | -0.550.13 | *,1,2 |
| SK 69246 | 21.480.02 | 19.710.10 | 0.800.04 | 0.330.04 | 1.81e-032.30e-04 | 0.270.05 | 0.400.08 | -0.410.02 | *,1,2 |
| SK 69279 | 21.630.05 | 20.310.10 | 0.760.06 | 0.320.04 | 7.20e-041.60e-04 | 0.260.05 | 0.220.07 | -0.790.08 | *,1,2 |
| SK 70115 | 21.180.08 | 19.940.10 | 0.670.05 | 0.300.03 | 2.02e-032.50e-04 | 0.230.04 | 0.220.06 | -0.310.02 | *,1,2 |
| SK 7079 | 21.340.04 | 20.260.10 | 1.510.09 | 0.390.09 | 4.48e-031.67e-03 | 0.320.10 | 0.740.33 | -0.080.13 | *,1,2 |
| SK 7145 | 21.110.03 | 18.630.10 | 0.810.06 | 0.340.04 | 2.81e-035.60e-04 | 0.270.05 | 0.270.07 | -0.220.07 | *,1,2 |
| SK 7150 | 21.240.05 | 20.130.10 | 0.550.05 | 0.280.03 | 1.42e-032.80e-04 | 0.220.04 | 0.170.05 | -0.440.07 | *,1,2 |
References: Measurements of the DTM, DTG, DTMN and are from () this work, column densities from (1) Roman-Duval et al. (2021); and total dust-corrected metallicities from (2) De Cia et al. in prep.
| Star | log N(H I) | log N(H 2) | [Zn/Fe] | DTM | DTG | DTMN | [M/H]tot | Ref | |
| AzV18 | 22.040.02 | 20.360.08 | 0.910.09 | 0.350.04 | 1.07e-031.60e-04 | 0.290.06 | 0.920.20 | -0.660.03 | *,1,2 |
| AzV26 | 21.700.06 | 20.630.06 | 0.600.05 | 0.280.03 | 4.10e-045.00e-05 | 0.220.04 | 0.170.04 | -0.980.02 | *,1,2 |
| AzV47 | 21.320.04 | 18.540.70 | 0.570.07 | 0.270.03 | 6.90e-041.00e-04 | 0.210.04 | 0.100.02 | -0.730.03 | *,1,2 |
| AzV80 | 21.810.02 | 20.080.30 | 0.690.06 | 0.300.04 | 6.40e-049.00e-05 | 0.240.05 | 0.310.07 | -0.810.02 | *,1,2 |
| AzV95 | 21.490.04 | 19.400.09 | 0.570.07 | 0.270.03 | 5.30e-048.00e-05 | 0.210.04 | 0.120.03 | -0.840.03 | *,1,2 |
| AzV104 | 21.450.06 | 19.230.30 | 0.510.16 | 0.230.04 | 3.90e-041.80e-04 | 0.180.05 | 0.080.04 | -0.920.19 | *,1,2 |
| AzV207 | 21.430.06 | 19.400.10 | 0.830.06 | 0.340.04 | 1.66e-032.50e-04 | 0.270.05 | 0.340.08 | -0.450.04 | *,1,2 |
| AzV216 | 21.640.03 | 18.781.30 | 0.720.08 | 0.300.04 | 7.20e-041.70e-04 | 0.240.05 | 0.230.07 | -0.770.09 | *,1,2 |
| AzV229 | 21.060.04 | 15.660.30 | 0.620.08 | 0.250.03 | 8.30e-041.30e-04 | 0.200.04 | 0.070.02 | -0.620.03 | *,1,2 |
| AzV242 | 21.320.04 | 17.211.30 | 1.160.18 | 0.410.06 | 1.37e-032.30e-04 | 0.350.07 | 0.220.05 | -0.620.04 | *,1,2 |
| AzV321 | 20.700.08 | 14.441.30 | 0.900.11 | 0.350.05 | 2.07e-033.60e-04 | 0.290.06 | 0.080.02 | -0.370.05 | *,1,2 |
| AzV332 | 20.540.16 | 14.500.12 | 0.560.06 | 0.260.03 | 1.20e-035.00e-04 | 0.200.04 | 0.030.02 | -0.470.17 | *,1,2 |
| AzV388 | 21.180.04 | 19.400.10 | 0.990.07 | 0.350.05 | 1.36e-032.60e-04 | 0.300.06 | 0.160.04 | -0.560.06 | *,1,2 |
| AzV456 | 21.000.06 | 20.930.10 | 1.360.09 | 0.440.06 | 5.00e-041.00e-04 | 0.380.07 | 0.110.03 | -1.090.07 | *,1,2 |
| AzV476 | 21.850.07 | 20.950.30 | 0.810.17 | 0.330.04 | 5.20e-042.50e-04 | 0.270.05 | 0.340.18 | -0.950.20 | *,1,2 |
| AzV327 | 20.930.10 | 14.790.10 | 0.930.19 | 0.360.05 | 3.00e-042.00e-04 | 0.300.06 | 0.090.08 | -1.230.29 | *,1,2 |
| AzV238 | 21.410.10 | 15.950.10 | 0.990.04 | 0.380.05 | 1.04e-035.40e-04 | 0.310.06 | 0.200.15 | -0.700.22 | *,1,2 |
| SK116 | 21.570.10 | 18.530.10 | 0.640.04 | 0.290.03 | 5.50e-042.90e-04 | 0.230.04 | 0.150.11 | -0.860.22 | *,1,2 |
References: Measurements of the DTM, DTG, DTMN and are from () this work, column densities from (1) Jenkins & Wallerstein (2017); and total dust-corrected metallicities from (2) De Cia et al. in prep.
| GRB | zabs | log N(H I) | log N(H 2) | [Zn/Fe] | DTM | DTG | DTMN | [M/H]tot | Ref | |
| 00926 | 2.0380 | 21.300.20 | … | 1.060.18 | 0.390.05 | 8.55e-035.63e-03 | 0.320.07 | 1.301.00 | 0.200.28 | *,1 |
| 030226 | 1.9870 | 20.500.30 | … | -0.180.12 | … | … | … | … | -1.070.31 | *,1 |
| 050730 | 3.9690 | 22.100.10 | … | 0.080.05 | 0.060.02 | 4.00e-062.00e-06 | 0.040.01 | … | -2.310.18 | *,1 |
| 050820A | 2.6150 | 21.050.10 | … | 0.830.05 | 0.340.04 | 1.53e-033.92e-04 | 0.270.05 | 0.130.06 | -0.490.10 | *,1 |
| 050922C | 2.1990 | 21.550.10 | … | 0.180.46 | 0.120.11 | 1.94e-052.20e-05 | 0.080.10 | 0.0050.006 | -1.920.26 | *,1 |
| 071031 | 2.6920 | 22.150.05 | … | 0.040.03 | 0.030.01 | 7.70e-063.70e-06 | 0.020.01 | 0.0070.004 | -1.750.09 | *,1 |
| 080413A | 2.4330 | 21.850.15 | … | 0.130.07 | 0.090.02 | 3.02e-051.49e-05 | 0.060.02 | 0.010.01 | -1.600.18 | *,1 |
| 081008 | 1.9685 | 21.110.10 | … | 0.550.04 | 0.260.03 | 1.12e-034.61e-04 | 0.200.04 | 0.100.06 | -0.510.17 | *,1 |
| 090809A | 2.7373 | 21.480.07 | … | 0.750.21 | 0.320.05 | 1.54e-035.85e-04 | 0.260.06 | 0.340.19 | -0.460.15 | *,1 |
| 090926A | 2.1069 | 21.580.01 | … | 0.880.11 | 0.340.05 | 8.99e-051.59e-05 | 0.280.06 | 0.030.01 | -1.720.05 | *,1 |
| 100219A | 4.6676 | 21.280.02 | … | 0.120.30 | 0.070.08 | 7.12e-058.05e-05 | 0.050.07 | 0.010.01 | -1.160.11 | *,1 |
| 111008A | 4.9910 | 22.390.01 | … | 0.220.10 | 0.130.02 | 2.87e-058.60e-06 | 0.090.02 | 0.050.02 | -1.790.10 | *,1 |
| 111107A | 2.8930 | 21.100.04 | … | 0.700.55 | 0.300.09 | 2.22e-032.40e-03 | 0.240.10 | 0.200.24 | -0.280.45 | *,1 |
| 120119A | 1.7285 | 22.440.12 | … | 0.930.24 | 0.360.06 | 8.16e-047.99e-04 | 0.300.07 | 1.691.78 | -0.790.42 | *,1 |
| 120327A | 2.8143 | 22.070.01 | 17.390.13 | 0.270.07 | 0.150.03 | 9.78e-051.99e-05 | 0.110.03 | 0.080.03 | -1.340.02 | *,1 |
| 120716A | 2.4874 | 21.730.03 | … | 0.690.23 | 0.310.05 | 1.15e-032.84e-04 | 0.240.06 | 0.450.21 | -0.570.08 | *,1 |
| 120815A | 2.3582 | 22.090.01 | 20.420.08 | 1.010.05 | 0.380.05 | 3.10e-044.30e-05 | 0.310.06 | 0.300.12 | -1.230.03 | *,1 |
| 120909A | 3.9290 | 21.820.02 | … | 1.150.09 | 0.410.05 | 2.90e-037.62e-04 | 0.340.07 | 1.480.68 | -0.290.10 | *,1 |
| 121024A | 2.3005 | 21.780.02 | 19.900.17 | 0.770.08 | 0.310.04 | 8.95e-041.87e-04 | 0.250.05 | 0.410.18 | -0.680.07 | *,1 |
| 130408A | 3.7579 | 21.900.01 | … | 0.290.07 | 0.170.02 | 7.99e-051.43e-05 | 0.120.03 | 0.040.02 | -1.460.05 | *,1 |
| 130606A | 5.9127 | 19.880.01 | … | 0.490.10 | 0.240.03 | 8.87e-051.99e-05 | 0.190.04 | … | -1.580.08 | *,1 |
| 140311A | 4.9550 | 22.300.02 | … | 0.350.21 | 0.200.05 | 2.76e-059.80e-06 | 0.140.05 | 0.040.02 | -2.000.11 | *,1 |
| 141028A | 2.3333 | 20.390.03 | … | -0.040.26 | 0.0010.090 | 4.00e-072.91e-05 | 0.0010.062 | … | -1.620.28 | *,1 |
| 141109A | 2.9940 | 22.180.02 | 18.020.12 | 0.490.07 | 0.240.03 | 1.45e-042.46e-05 | 0.190.04 | 0.150.06 | -1.370.05 | *,1 |
| 150403A | 2.0571 | 21.730.02 | 19.900.14 | 0.630.08 | 0.290.04 | 4.84e-048.28e-05 | 0.230.04 | 0.190.08 | -0.920.05 | *,1 |
| 151021A | 2.3297 | 22.140.03 | 18.991.28 | 0.860.08 | 0.350.05 | 5.20e-041.07e-04 | 0.280.06 | 0.531.02 | -0.970.07 | *,1 |
| 151027B | 4.0650 | 20.540.07 | … | 0.490.64 | 0.240.12 | 8.67e-046.78e-04 | 0.190.12 | 0.020.02 | -0.590.27 | *,1 |
| 160203A | 3.5187 | 21.740.02 | … | 0.370.18 | 0.190.04 | 3.25e-047.45e-05 | 0.150.04 | 0.120.06 | -0.920.04 | *,1 |
| 161023A | 2.7100 | 20.950.01 | … | 0.440.04 | 0.220.02 | 2.76e-043.77e-05 | 0.170.03 | 0.020.01 | -1.050.04 | *,1 |
| 170202A | 3.6456 | 21.530.04 | … | 0.750.23 | 0.320.05 | 4.24e-041.44e-04 | 0.260.06 | 0.110.05 | -1.020.13 | *,1 |
| 181020A | 2.9379 | 22.240.03 | … | 0.750.14 | 0.320.04 | 2.80e-046.48e-05 | 0.260.06 | 0.360.16 | -1.200.08 | *,1 |
| 190114A | 3.3764 | 22.190.05 | … | 1.050.08 | 0.390.05 | 3.64e-046.69e-05 | 0.320.06 | 0.430.18 | -1.170.06 | *,1 |
| 190106A | 1.8599 | 21.000.04 | … | 1.120.10 | 0.400.05 | 2.19e-035.77e-04 | 0.330.06 | 0.170.08 | -0.400.10 | *,1 |
| 190919B | 3.2241 | 21.750.06 | … | 0.330.33 | 0.180.07 | 1.43e-047.45e-05 | 0.140.07 | 0.050.04 | -1.250.15 | *,1 |
| 191011A | 1.7204 | 21.650.08 | … | 0.330.09 | 0.180.02 | 5.97e-041.22e-04 | 0.140.03 | 0.180.08 | -0.630.07 | *,1 |
| 210905A | 6.3118 | 21.100.10 | … | 0.330.09 | 0.180.02 | 4.85e-051.57e-05 | 0.140.03 | … | -1.720.13 | *,1 |
References: () This work; (1) Heintz et al. (2023)