11email: wonjukim@ph1.uni-koeln.de 22institutetext: Centre for Astrophysics and Planetary Science, University of Kent, Ingram Building, Canterbury, Kent CT2 7NH, UK 33institutetext: Max-Planck-Institut für Radioastronomie, Auf dem Hügel 69, 53121 Bonn, Germany 44institutetext: Jodrell Bank Centre for Astrophysics, Department of Physics and Astronomy, the University of Manchester, Oxford Road, Manchester M13 9PL, UK 55institutetext: Korea Astronomy and Space Science Institute, 776 Daedeokdae-ro, Yuseong-gu, Daejeon 34055, Republic of Korea 66institutetext: University of Science and Technology, Korea (UST), 217 Gajeong-ro, Yuseong-gu, Daejeon 34113, Republic of Korea
A survey of SiO 1 – 0 emission toward massive star-forming regions ††thanks: Full tables 1, 4, and 7 are only available in electronic form at the CDS via anonymous ftp to cdsarc.cds.unistra.fr (130.79.128.5) or via https://cdsarc.cds.unistra.fr/cgi-bin/qcat?J/A+A/.
Abstract
Aims. The application of silicon monoxide (SiO) as a shock tracer arises from its propensity to occur in the gas phase as a result of shock-induced phenomena, including outflow activity and interactions between molecular clouds and expanding Hii regions or supernova remnants. For this work, we searched for indications of shocks toward 366 massive star-forming regions by observing the ground rotational transition of SiO (, ) at 43 GHz with the Korean VLBI Network (KVN) 21 m telescopes to extend our understanding on the origins of SiO in star-forming regions.
Methods. We analyzed the thermal SiO 1 – 0 emission and compared the properties of SiO emission with the physical parameters of associated massive dense clumps as well as 22 GHz \ceH2O and Class I 44 GHz \ceCH3OH maser emission.
Results. We detected SiO emission toward 104 regions that consist of 57 IRDCs, 21 HMPOs, and 26 UCHiis. Out of 104 sources, 71 and 80 sources have 22 GHz \ceH2O and 44 GHz Class I \ceCH3OH maser counterparts, respectively. The determined median SiO column density, (SiO), and abundance, (SiO), relative to (\ceH2) are cm-2 and , respectively. These values are similar to those obtained toward other star-forming regions and also consistent with predicted values from shock models with low-velocity shocks (10 – 15 km s-1). For sources with dust temperatures of () K, we find that (SiO) and (SiO) derived with the transition are a factor larger than those from the previous studies obtained with SiO 2 – 1. While the (SiO) does not exhibit any strong correlation with the evolutionary stages of their host clumps, is highly correlated with dust clump mass, and also has a strong negative correlation with . This shows that colder and younger clumps have high suggestive of an evolutionary trend. This trend is not due to excess emission at higher velocities, such as SiO wing features, as the colder sources with high ratios lack wing features. Comparing SiO emission with \ceH2O and Class I \ceCH3OH masers, we find a significant correlation between / and ratios, whereas no similar correlation is seen for the \ceH2O maser emission. This suggests a similar origin for the SiO and Class I \ceCH3OH emission in these sources.
Conclusions. We demonstrate that in cold regions SiO may be a better tracer of shocks than a higher transition of SiO. Lower (and so probably less globally evolved) sources appear to have higher relative to their . The SiO 1 – 0 emission toward infrared dark sources ( 20 K), which do not contain identified outflow sources, may be related to other mechanisms producing low-velocity shocks (5 – 15 km s-1) for example, arising from cloud-cloud collisions, shocks triggered by expanding Hii regions, global infall, or converging flows.
Key Words.:
astrochemistry – surveys – ISM:clouds – stars:formation1 Introduction
In the quiescent cold interstellar medium (ISM), silicon monoxide (SiO) is depleted in the gas phase to the point of being undetectable as (SiO) (Ziurys et al., 1989; Martin-Pintado et al., 1992) as silicon (Si) is mostly locked into the dust grain cores, although SiO can be present in the icy mantles of dust grains. SiO is only liberated into the gas phase, or formed from released Si, and detectable at millimeter and submillimeter wavelengths if the mantle or grain core is disrupted (Schilke et al., 1997; Gusdorf et al., 2008).
Most commonly, this disruption takes place in the high-velocity shocks ( 20 – 25 km s-1 and up to 100 km s-1) associated with outflows from young stars, with either the jets from the protostars or the interaction of the molecular outflow with the surrounding ambient gas (e.g., Gusdorf et al. 2008; Guillet et al. 2011; Kelly et al. 2017). In addition to outflow regions with strong radiation regions such as photodissociation regions (PDRs), photo-desorption can also lead to an enhancement of SiO in the gas phase (Walmsley et al., 1999; Schilke et al., 2001). Recently, SiO emission of a different nature has been detected in several regions, including massive star-forming regions (e.g., Jiménez-Serra et al. 2010; Nguyen-Lu’o’ng et al. 2013; Louvet et al. 2016; Cosentino et al. 2020) and even diffuse molecular clouds at high latitudes (e.g., Rybarczyk et al. 2023). This emission found toward active star-forming regions is spatially extended and does not always coincide with outflow sources or CO outflows (e.g., Widmann et al. 2016), which are concentrated on smaller scales ( 0.05 pc).
Spatially extended SiO emission with a typical fractional SiO abundance, (SiO), of is not only weaker than expected from energetic outflows associated with massive stars, which produce bright and broad lines with (SiO) from to (e.g., Jiménez-Serra et al. 2010; López-Sepulcre et al. 2016), but often also has a narrower line width range, typically 2 – 4 km s-1 and even smaller than 1 km s-1 in some cases (e.g., Jiménez-Serra et al. 2010; Cosentino et al. 2020). Such narrow SiO emission lines imply the existence of low-velocity shocks. According to several observational studies with shock models (e.g., Nguyen-Lu’o’ng et al. 2013; Jiménez-Serra et al. 2008; Duarte-Cabral et al. 2014; Louvet et al. 2016; Csengeri et al. 2011a, b), shock velocities of 5 – 15 km s-1 can produce abundances of SiO about . Three possible explanations have been proposed for the origin of narrow and spatially extended SiO emission: (1) an association with the outflows from an undetected dispersed population of low-mass protostars (Jiménez-Serra et al., 2010); (2) produced in low velocity, large-scale shocks associated with the formation of the molecular cloud themselves, perhaps as a result of colliding or converging flows (e.g., Csengeri et al. 2011a, b, 2016a), cloud-cloud collisions (e.g., Cosentino et al. 2020; Armijos-Abendaño et al. 2020; Zhu et al. 2023), or accretion flows associated with global collapse (e.g., Duarte-Cabral et al. 2014); or (3) low-velocity shocks ( 20 km s-1) driven by supernova remnants, interacting with adjacent molecular clouds (e.g., Vaupré et al. 2014; Dumas et al. 2014; Cosentino et al. 2019, 2022).
| Source name | R.A. | Dec. | SiO | \ceH2O | \ceCH3OH | Selected | ATLASGAL | Classification | |
|---|---|---|---|---|---|---|---|---|---|
| (J2000) | (J2000) | (km s-1) | (1 – 0) | Maser | Maser | Category | Name | ||
| IRAS180322032 | 18:06:14 | 20:31:47 | 5.0 | Yb | Y | Y | UCHii | 009.62100.194 | MSF (radio-Hii)∗ |
| G8.670.36 | 18:06:19 | 21:37:32 | 38.0 | Yb | Y | Y | UCHii | 008.67100.356 | MSF (radio-Hii)∗ |
| G10.470.03 | 18:08:38 | 19:51:52 | 66.2 | Yb | Y | Y | UCHii | 010.47200.027 | MSF (radio-Hii)∗ |
| G10.300.15 | 18:08:56 | 20:05:54 | 11.0 | Yb | Y | Y | UCHii | 010.29900.147 | MSF (radio-Hii)∗ |
| G10.150.34 | 18:09:25 | 20:19:15 | 5.0 | N | N | N | UCHii | – | MSF (radio-Hii)∗ |
| IRAS180732046 | 18:10:17 | 20:45:43 | 28.0 | N | Y | Y | UCHii | 009.87900.751 | MSF (radio-Hii)∗ |
| G10.620.38 | 18:10:24 | 19:56:15 | 3.0 | N | Y | Y | UCHii | – | MSF (radio-Hii)∗ |
| IRAS180851931 | 18:11:33 | 19:30:39 | 1.1 | Ye | N | N | UCHii | 011.10900.397 | MSF (radio-Hii)∗ |
| HM180891732 | 18:11:51 | 17:31:28 | 33.0 | Yc | Y | Y | HMPO | 012.88800.489 | MSF (radio-Hii) |
| HM180901832 | 18:12:02 | 18:31:56 | 110.0 | N | N | N | HMPO | 012.02400.031 | YSO |
| G12.210.10 | 18:12:40 | 18:24:21 | 20.0 | Yb,c | Y | Y | UCHii | 012.20800.102 | MSF (radio-Hii)∗ |
| G12.430.05 | 18:12:55 | 18:11:08 | 40.0 | N | N | N | UCHii | 012.43100.049 | MSF (radio-Hii)∗ |
| HM181021800 | 18:13:12 | 17:59:35 | 21.0 | Yb | N | Y | HMPO | – | unclassified |
| G11.940.62 | 18:14:01 | 18:53:24 | 38.9 | Yb,c | Y | Y | UCHii | 011.93600.616 | MSF (radio-Hii)∗ |
| HM181441723 | 18:17:24 | 17:22:13 | 47.0 | Ya,c | Y | Y | HMPO | 013.65800.599 | YSO |
| G015.0500.07 MM2 | 18:17:40 | 15:48:55 | 24.7 | N | N | N | IRDC | 015.05300.089 | YSO |
| G015.0500.07 MM1 | 18:17:50 | 15:53:38 | 24.7 | Yd | N | N | IRDC | 015.00600.009 | Quiescent |
| HM181511208 | 18:17:57 | 12:07:22 | 33.0 | Ye | Y | Y | HMPO | – | unclassified |
| HM181591550 | 18:18:48 | 15:48:54 | 60.0 | N | N | N | HMPO | 015.18400.159 | MSF (Hii) |
| G015.3100.16 MM2 | 18:18:50 | 15:43:19 | 31.1 | N | N | N | IRDC | 015.27100.122 | Protostellar |
| G015.3100.16 MM1 | 18:18:56 | 15:45:00 | 31.1 | N | N | N | IRDC | – | unclassified |
Massive stars ( 8 – 10 M⊙) and their clusters of lower mass companions form in massive (up to several M⊙), pc-sized clumps within molecular clouds (Urquhart et al., 2022; Elia et al., 2021). Understanding how stars form in such environments requires tracing the gas flow from the clouds through the clumps and the progenitors of individual stars, pc-sized cores, and ultimately on to the protostars. Observational evidence increasingly shows that the formation of most massive clumps is driven by the global collapse of regions several parsec in size (e.g., Csengeri et al. 2017; Jackson et al. 2019; Pillai et al. 2023). Peretto et al. (2013) and Wyrowski et al. (2016) report an infall rate range between (0.3 M⊙/yr for massive clumps that are in a wide range of evolutionary stages. Blue asymmetric line profiles of \ceHCO+ (), which are diagnostic of infall motions, have also been observed on pc-scales in massive but less evolved regions (Fuller et al., 2005; Traficante et al., 2018; Pillai et al., 2023). However, the exact nature of these gas infall motions, such as how they are initiated and their role in assembling massive clumps, is still unclear.
In this paper, we use SiO () observations toward 366 massive star-forming regions to explore the connection between extended shocks and star formation activity. In Sect. 2, we describe the source selection criteria, observational setup, and data reduction. We complement these observations with \ceH2O and Class I \ceCH3OH masers archival data as well as properties derived from dust surveys (i.e., molecular hydrogen column density and dust temperature, Urquhart et al. 2018, 2022; Marsh et al. 2017); these are introduced in Sect. 2. In Sect. 3, we present the SiO (1 – 0) detection statistics, line profiles, and determined column density and abundances. In Sect. 4, we compare the SiO column densities and abundances with the archival datasets (dust properties and maser associations) and discuss the origin of SiO (1 – 0) emission. We summarize our results and highlight our main findings in Sect. 5.
2 Observation
2.1 Description of target sources
| Telescope | Beam size (′′) | Beam efficiency |
|---|---|---|
| KVNYonsei | 61.5 | 0.45 |
| KVNUlsan | 61.6 | 0.42 |
| KVNTamna | 62.1 | 0.48 |


| ID | Source name | Fitted | rms | ||||
|---|---|---|---|---|---|---|---|
| component | (K km s-1) | (km s-1) | (km s-1) | (K) | (mK) | ||
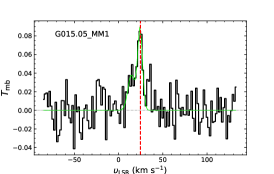
| 1 | G015.0500.07 MM1 | 1 | 0.6040.143 | 24.270.66 | 6.451.34 | 0.088 | 15.82 |
| 2 | 0.3740.157 | 14.501.85 | 9.214.50 | 0.038 | 15.82 | ||
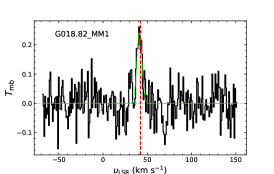
| 2 | G018.8200.28 MM1 | 1 | 1.7320.194 | 41.080.37 | 6.700.85 | 0.243 | 53.67 |
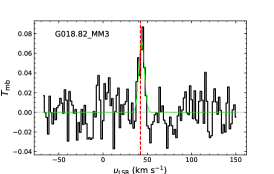
| 3 | G018.8200.28 MM3 | 1 | 0.5660.080 | 43.530.56 | 7.161.02 | 0.074 | 16.10 |
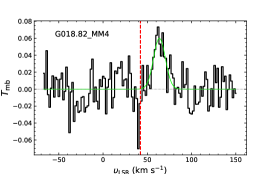
| 4 | G018.8200.28 MM4 | 1 | 1.0060.154 | 63.721.13 | 15.723.04 | 0.060 | 18.70 |
| 5 | G019.2700.07 MM1 | 1 | 0.9620.142 | 26.050.44 | 6.261.15 | 0.144 | 27.29 |
| 6 | G019.2700.07 MM2 | 1 | 1.2160.142 | 26.930.32 | 6.161.03 | 0.186 | 35.07 |
| 7 | G022.3500.41 MM1 | 1 | 0.8700.053 | 51.480.86 | 4.370.86 | 0.187 | 45.94 |
| 2 | 1.2600.053 | 52.440.86 | 20.090.86 | 0.059 | 45.94 | ||
| 8 | G023.6000.00 MM1 | 1 | 0.9760.130 | 105.600.57 | 8.631.27 | 0.106 | 22.68 |
| 9 | G023.6000.00 MM2 | 1 | 1.4520.218 | 50.790.58 | 7.531.38 | 0.181 | 38.91 |
| 10 | G023.6000.00 MM4 | 1 | 0.3730.140 | 52.980.35 | 4.391.10 | 0.080 | 17.58 |
| 2 | 0.6900.184 | 46.341.93 | 14.043.19 | 0.046 | 17.58 | ||
| 11 | G023.6000.00 MM7 | 1 | 0.9780.138 | 52.090.49 | 7.601.44 | 0.121 | 32.55 |
| 12 | G024.3300.11 MM1 | 1 | 0.8640.057 | 112.600.29 | 4.540.42 | 0.179 | 25.55 |
| 2 | 1.2210.142 | 116.200.51 | 9.681.71 | 0.119 | 25.55 | ||
| 13 | G024.3300.11 MM2 | 1 | 1.0260.110 | 116.900.28 | 5.150.66 | 0.187 | 34.18 |
| 14 | G024.3300.11 MM3 | 1 | 0.9420.089 | 115.900.12 | 2.890.37 | 0.307 | 30.81 |
| 2 | 0.2760.082 | 110.800.58 | 3.641.05 | 0.071 | 30.81 | ||
| 15 | G024.3300.11 MM5 | 1 | 0.4720.158 | 116.100.31 | 3.540.75 | 0.125 | 23.45 |
| 2 | 2.2210.223 | 116.201.04 | 15.782.12 | 0.132 | 23.45 | ||
| 16 | G024.3300.11 MM6 | 1 | 1.3230.089 | 113.500.18 | 6.090.55 | 0.204 | 23.79 |
| 17 | G024.3300.11 MM10 | 1 | 0.4870.102 | 116.200.48 | 4.941.36 | 0.093 | 21.63 |
We selected 366 sources toward massive star-forming regions from five catalogs covering three different categories, there are being: infrared dark clouds (IRDCs) defined as high extinction regions against bright mid-infrared Galactic background (Perault et al., 1996; Egan et al., 1998; Hennebelle et al., 2001; Rathborne et al., 2006; Peretto & Fuller, 2009), high-mass protostellar objects (HMPOs, Molinari et al. 1996) considered as a precursor of ultra-compact Hii regions (UCHiis), and molecular clump hosting UCHiis (Wood & Churchwell, 1989b; Kurtz et al., 1994) considered to be the most evolved evolutionary stage of the massive star formation. The selected sources consist of 134 infrared dark cloud (IRDC) cores toward 33 IRDCs taken from Rathborne et al. (2006), 129 high-mass protostellar objects (HMPOs) taken from the catalogs of Molinari et al. (1996) and Sridharan et al. (2002), and 103 UCHiis from the radio continuum catalogs of Wood & Churchwell (1989b) and Kurtz et al. (1994).
The 134 IRDC cores are identified as compact dust emission sources at 1.2 mm wavelength observed with the 117 element bolometer array MAMBO II at the Institut de Radioastronomie Millimet́rique (IRAM) 30 m telescope (Rathborne et al., 2006), and based on their mid-infrared emission, the cores are characterized as associated to different evolutionary phases (Chambers et al., 2009). The UCHii sources were initially selected with IRAS colors (Log( and Log(); Wood & Churchwell 1989a) and later the 103 sources were confirmed as UCHiis with radio continuum emission observations at 2/6 cm and 7 mm wavelengths (Wood & Churchwell, 1989b; Kurtz et al., 1994; Walsh et al., 1998; Carral et al., 1999) (see Kim et al. 2019 for details). The 129 HMPOs are selected from two different catalogs that are Molinari et al. (1996) and Sridharan et al. (2002). The sources from Molinari et al. (1996) are divided into two groups, indicated as High and Low based on the colors. The catalog from Molinari et al. (1996) has the same IRAS color criteria used for the UCHii catalogs of Wood & Churchwell (1989b) and Kurtz et al. (1994), and due to the same initial selection criteria, HMPO candidates referred to as High can potentially be UCHiis. The other HMPO catalog from Sridharan et al. (2002) used the IRAS criteria defined by Ramesh & Sridharan (1997), and besides, all the selected sources are satisfied by the following criteria: detection of CS (2 – 1) line (Bronfman et al., 1996), Jy and Jy, and the absences of radio continuum emission detected from the Galaxy-Wide 5 GHz Green bank (Gregory & Condon, 1991) and Parkes-MIT-NRAO ratio continuum surveys (Griffith et al., 1994; Wright et al., 1994). Except for the UCHii source group, the source classifications for the two categories (i.e., IRDC and HMPO) are not definitive. Thus instead of using the three catalogs, we use the ratio of bolometric luminosity and clump mass as well as dust temperatures for indicators of evolutionary stages. However, as supplementary information, we list the classification defined in The APEX Telescope Large Area Survey of the Galaxy (ATLASGAL) survey (Urquhart et al., 2022). For the UCHii sample, if there are no classifications from the ATLASGAL catalog, we refer to their classification as MSF (radio-Hii) in the classification column because we already know that all the sources have radio continuum sources indicating them as Hii regions (Kim et al., 2019). Table 1 lists information on the observed sources.
2.2 SiO (1 – 0) observations and data reduction
Observations of the rotational ground state transition of SiO (, 43.42376 GHz) toward 366 sources were carried out over four observation periods (2010 October - December, 2011 February, 2012 October-November, and 2013 May) using the Korean VLBI Network (KVN) 21 m telescopes555https://radio.kasi.re.kr/kvn/main_kvn.php at the Yonsei, Ulsan and Tamna sites (Kim et al., 2011; Lee et al., 2011). The pointing and focus observations were performed every 23 hours by observing strong \ceH2O (652,3, 22.23508 GHz) and SiO (, , 43.12203 GHz) maser sources (i.e., V1111 Oph, R Cas, W3(OH), and Orion KL) and found to be within 5″. Position switching mode was used with a total ONOFF integration time of 30 minutes per source, yielding a typical rms noise level up to 50 mK at velocity resolutions () of 0.86 and 1.73 km s-1 depending on the noise of a spectrum. The main beam efficiencies for converting to and the full-width half maxima (FWHM) of the beams are listed in Table 3. We used the Continuum and Line Analysis Single-dish Software (CLASS) software666https://www.iram.fr/IRAMFR/GILDAS/doc/html/class-html/class.html of the Grenoble Image and Line Data Analysis Software (GILDAS) package (Pety, 2005) for the data reduction and fitting a Gaussian profile.
In addition, to investigate the association with outflows of embedded objects and surrounding environment toward our target positions, we use published observational data of 22 GHz \ceH2O () and 44 GHz Class I \ceCH3OH ( A+ ) masers. These maser observations were done toward the same coordinates of our SiO sources with the same three KVN 21 m telescopes. The \ceH2O and \ceCH3OH maser data toward UCHii sources are taken from Kim et al. (2019), but both maser line parameters for the HMPO and IRDC samples are obtained from Kim (2016). In Table 1, we provide detections of both masers toward the observed sources.
3 Results and analysis
3.1 Detection and SiO line properties
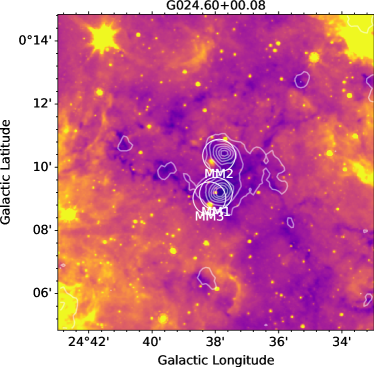
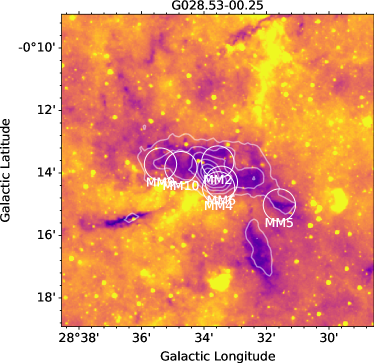
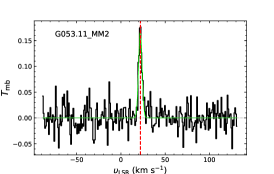
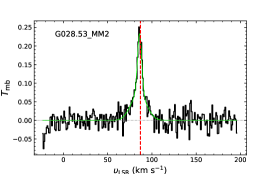
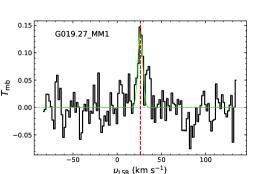
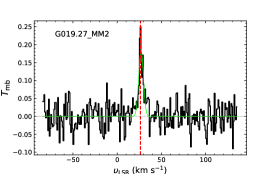
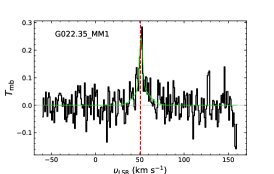
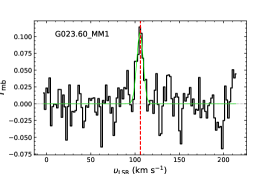
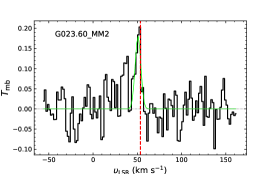
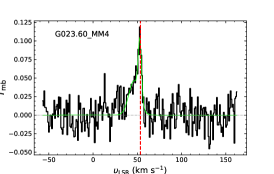
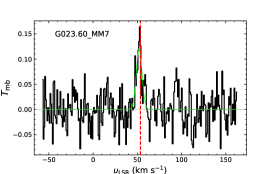
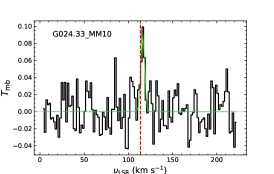
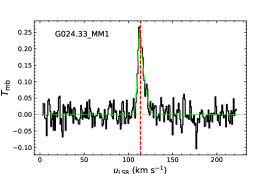
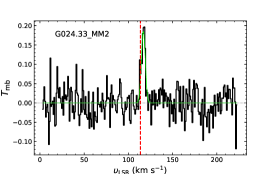
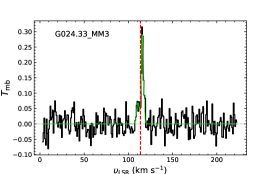
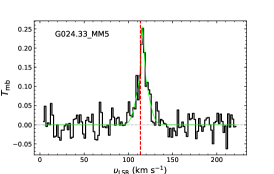
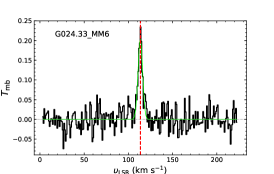
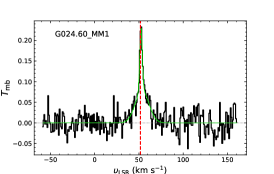
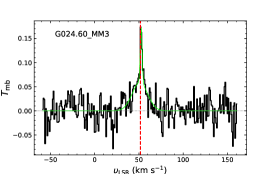
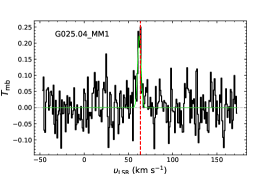
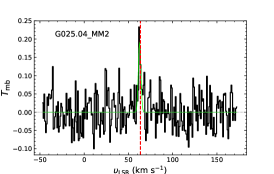
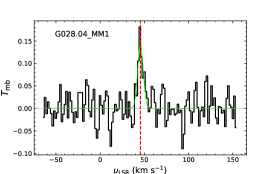
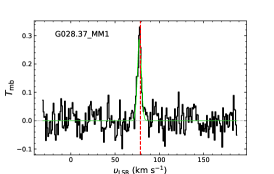
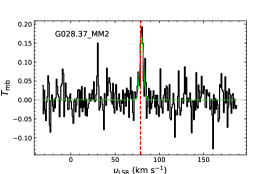
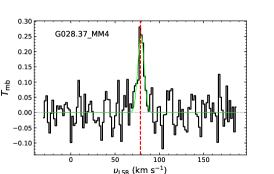
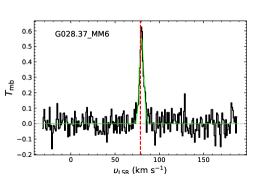
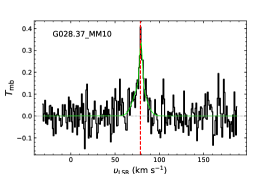
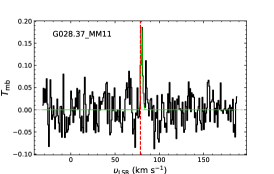
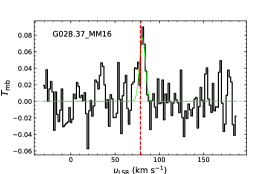
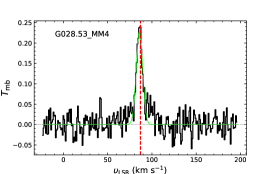
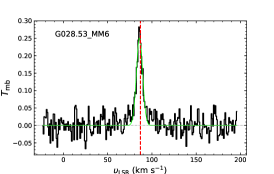
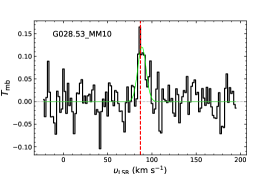
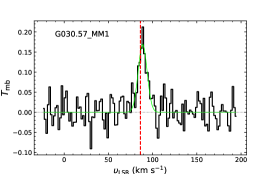
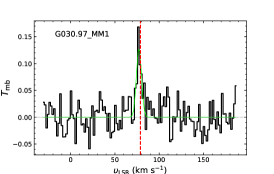
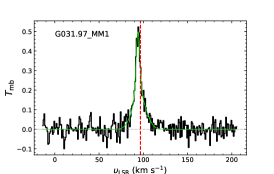
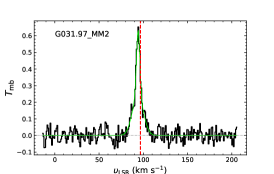
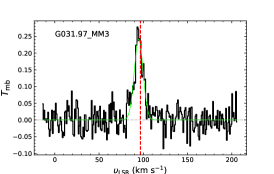
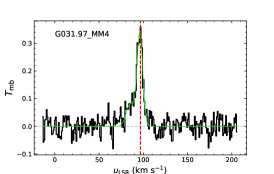
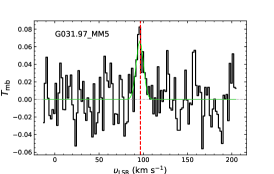
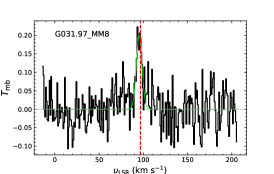
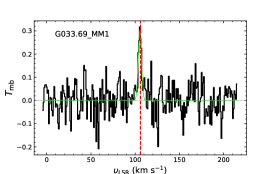
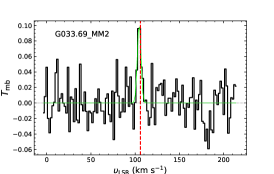
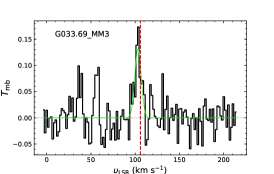
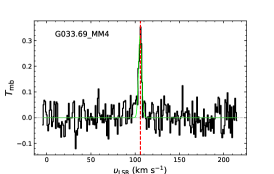
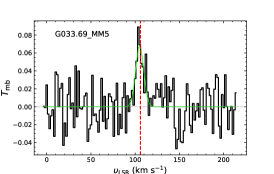
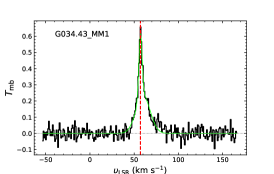
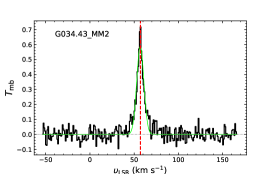
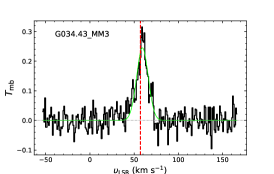
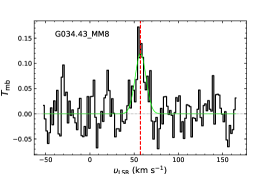
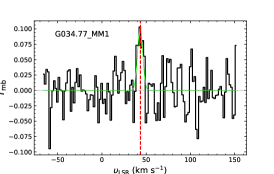
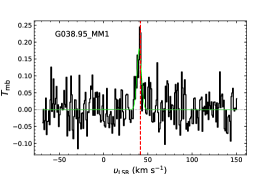
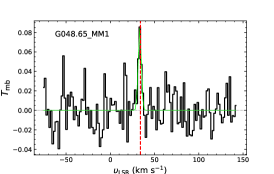
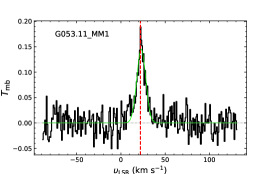
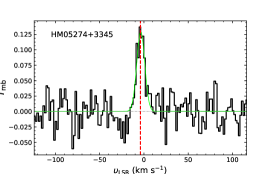
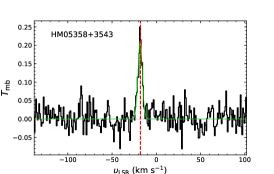
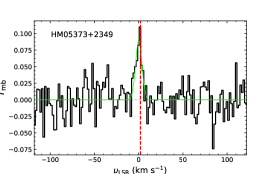
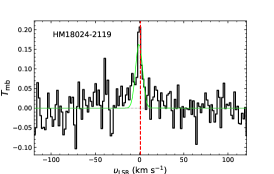
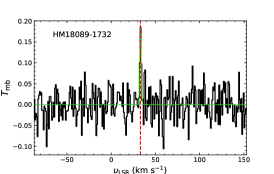
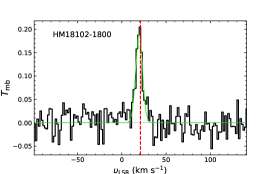
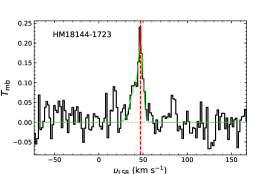
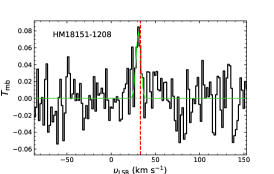
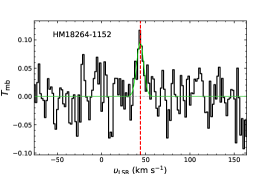
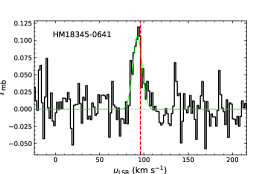
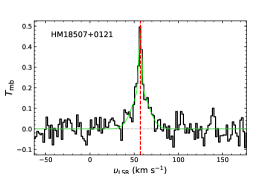
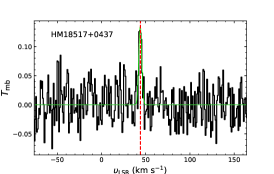
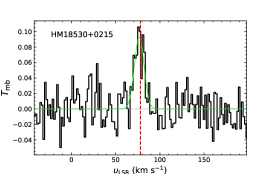
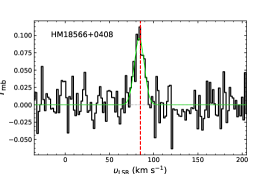
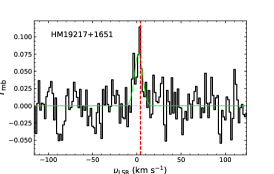
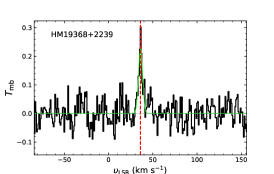
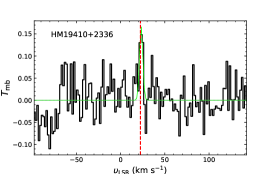
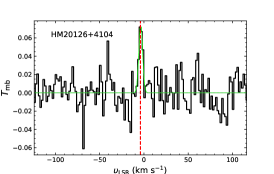
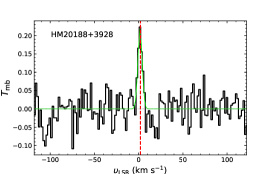
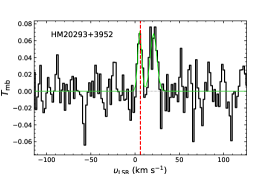
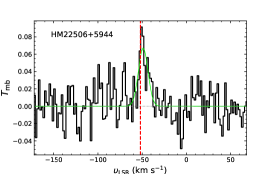
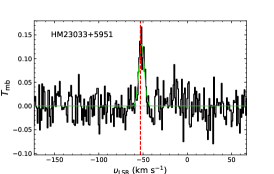
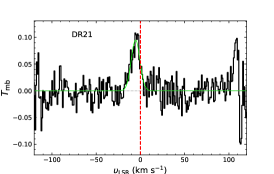
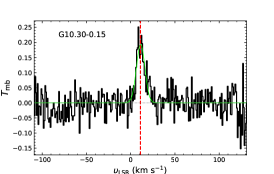
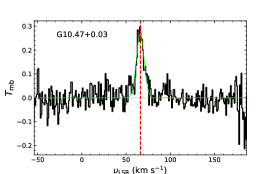
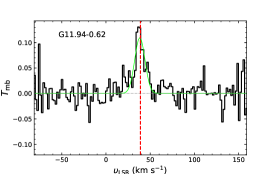
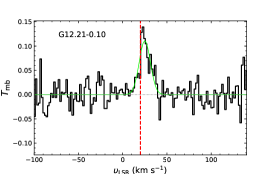
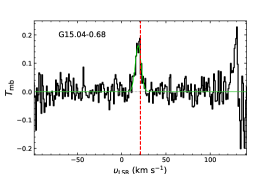
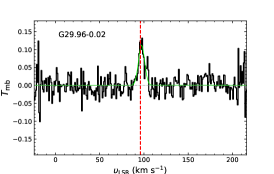
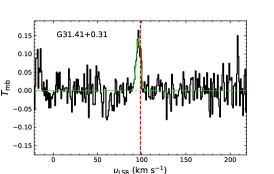
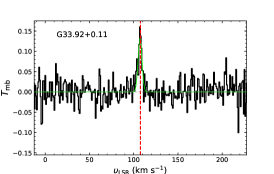
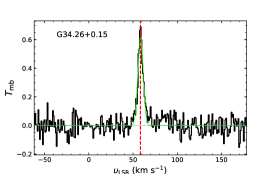
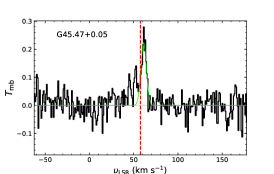
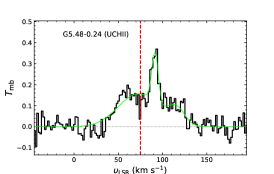
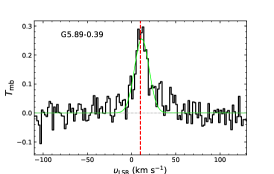
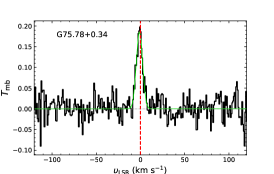
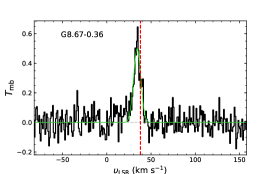
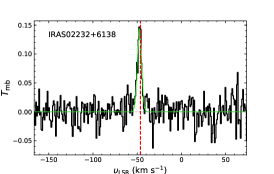
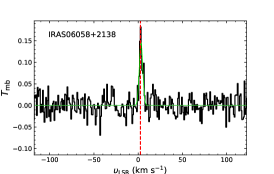
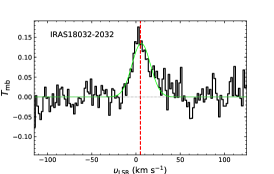
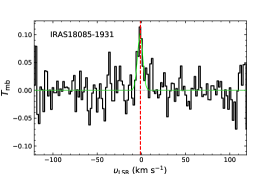
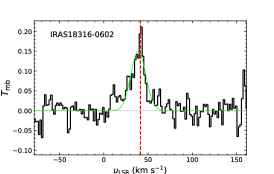
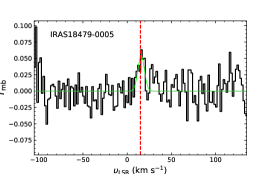
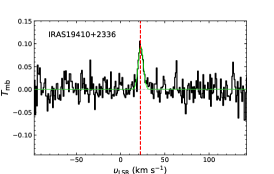
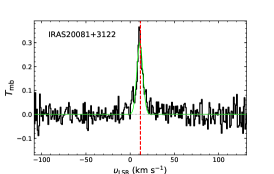
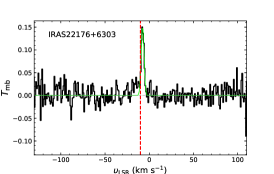
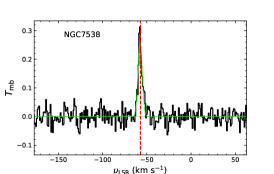
We detected SiO (1 – 0) emission lines toward 106 massive star-forming regions. Among the detected sources, 59 sources are associated with the IRDCs, and the positions of two pairs of four cores (i.e., G024.6000.08 MM1/MM3 and G028.5300.25 MM4/MM6) as shown in Fig. 1 are very close to each other within a beam width. They match a common ATLASGAL clump, respectively. The SiO detections from these sources are likely duplicates; thus, we only include the brightest spectrum for these duplicated positions toward in the following statistical analysis. The other 21 and 26 detections are found toward HMPO and UCHii associated sources, respectively. Figures 2, 15, 16, 17, and 18 show SiO emission spectral lines detected from this survey. Table 4 lists Gaussian fit parameters of SiO emission lines, which are velocity-integrated intensities () in K km s-1, peak velocity () in km s-1, full width at half maximum () in km s-1, peak intensity () in K, and rms level in K. For the following analyses, we exclude the beam-overlapped sources, G024.6000.08 MM3 and G028.5300.25 MM4, and 104 out of 106 sources is the total number of SiO emission sources confirmed as final detections.
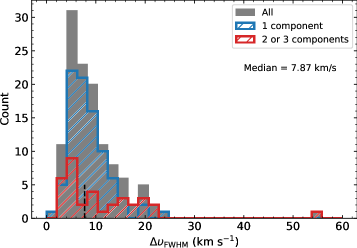
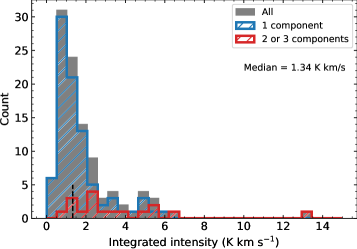
SiO emission lines for 86 sources are fitted with a single Gaussian profile, and in 17 cases two Gaussian components are required to fit, based on visual inspection of the residual emission after subtracting a first Gaussian component that was fitted. Only one case (G5.480.24) is fitted with three Gaussian components, and the FWHM line width of its broadest components is 54 km s-1 (see Fig. 20). Figure 3 shows the histogram of for all the SiO spectral lines, and for multicomponents, we plot all the fitted components, including a narrow component where the peak velocity is consistent with the ambient gas velocity and a broad component tracing outflows. The median line width marked as a black vertical line is 7.87 km s-1 and a significant fraction of the Gaussian components have FWHM narrower. The components with narrower than 7.87 km s-1 exhibit an average of 5.38 km s-1. The narrowest observed being 1.8 km s-1 toward HM180891732, where the spectrum has a velocity resolution of 0.86 km s-1. We note that in some cases, weak SiO emission lines are smoothed to a velocity resolution of 1.73 km s-1, which can cause broadened line widths.
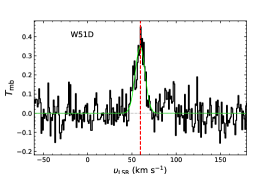
The median value (7.87 km s-1) of toward our data are close to 8 km s-1. If the is narrower than 8 km s-1, we, thus, consider the SiO emission lines as low-velocity components. The same is used in Csengeri et al. (2016a). The average of the narrow components from one and multiple Gaussian fitting are 5.71 and 4.63 km s-1, respectively, and for broad components, we obtained 11.46 and 17.39 km s-1, respectively. These average values are in good agreement with the (5 – 6 kms and 14 – 19 km s-1) obtained from SiO 2 – 1 emission measured toward massive dust clumps (Csengeri et al., 2016a). As depicted in the upper panels of Fig. 2, certain sources exhibit narrower SiO profiles compared to others (lower panels), characterized by broader wings fitted with a broad Gaussian component. The histogram of the total velocity integrated intensity shows that multiple Gaussian component SiO lines have a bright total velocity integrated intensity than those with a single Gaussian component, except for some sources that are associated with a single bright components.
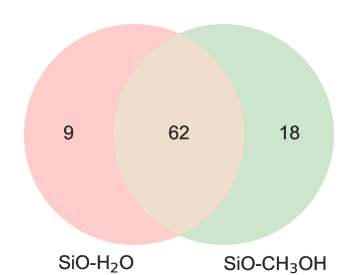
The Venn diagram in Figure 4 illustrates the distribution of \ceH2O and Class I \ceCH3OH masers toward 104 SiO detected sources. We find 22 GHz \ceH2O maser emission toward 71 sources (in red and orange colored areas), and 80 sources have 44 GHz Class I \ceCH3OH masers (in green and orange colored areas). Among these maser-detected sources, 62 sources (in the orange colored area) have both maser emission lines. Out of 71 \ceSiO-\ceH2O detected sources, 9 positions do not have \ceCH3OH maser emission lines, and 18 sources of the 80 \ceSiO-\ceCH3OH detected sources only have \ceCH3OH masers, not \ceH2O masers. Toward HMPOs and UCHiis associated sources, most SiO detected sources have either \ceH2O or \ceCH3OH masers, and only 2 and 5 sources toward HMPOs and UCHiis respectively have SiO detection without maser emission. On the other hand, toward IRDC sources, 26 and 18 sources with SiO detections have a lack of \ceH2O and \ceCH3OH maser emission lines, respectively.
3.2 Physical properties of SiO detected and non-detected sources
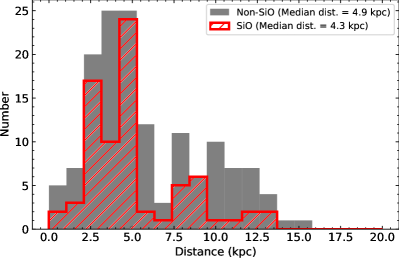
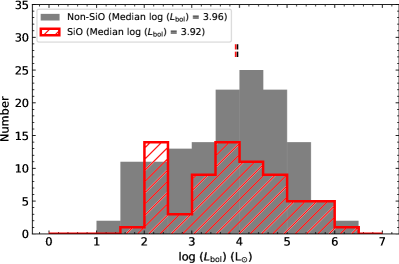
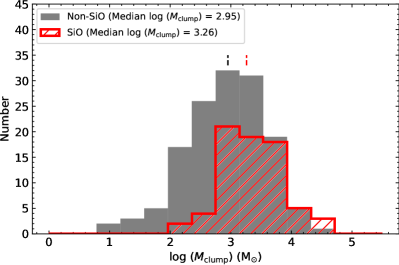
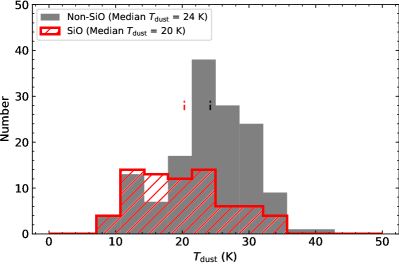
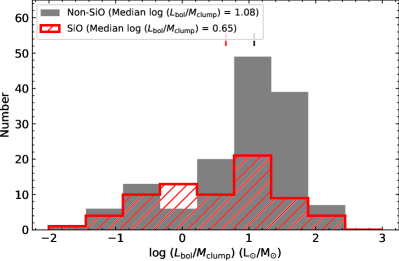
We investigated the physical properties (bolometric luminosity, clump mass, dust temperature, and /) derived from Urquhart et al. (2018) toward the SiO detected and non-detected sources. Figure 5 displays histograms of these properties of sources showing the SiO detections (red bars) and non-SiO detections (gray bars). To qualify the statistical significance of these differences, we performed Kolmogorov-Smirnov (KS) tests to and between the two groups. The values from the KS-tests are remarkably small, , indicating a significant distinction between the groups. The distribution of SiO emission sources in spread widely, while the non-SiO detected sources trend to be concentrated to associated clumps with higher indicating more evolved clumps. The KS-test resulted in a reasonably small value, 0.007, implying that the SiO emission clumps are likely different with the clumps without SiO emission. In addition, we do not find any apparent differences in source distances and toward sources of the two groups, with large values 0.09 and 0.8, respectively. In summary, the SiO detected sources are notably associated with massive (median Log 3.26) and colder (a median 20 K) sources compared to the sources without SiO emission. In addition, there is an indication that the SiO detected sources have a lower median by a factor % lower than the non-detected sources, suggestive of being somewhat less evolved.
| Source | Log()a | Log()b | Dist. | Log() | Log() | |||||
| (cm-2) | (cm-2) | (cm-2) | (kpc) | (K) | (L⊙) | (M⊙) | (L⊙) | (L⊙) | ||
| G018.8200.28MM1 | 1.06 | 23.055 | 22.936 | 9.34 | 12.6 | 18.7 | 4.806 | 4.369 | 1.34 | 9.71 |
| G019.2700.07MM2 | 7.44 | 22.714 | 22.560 | 1.44 | 2.8 | 12.1 | 2.079 | 2.713 | 2.31 | |
| G022.3500.41MM1 | 1.30 | 22.953 | 22.465 | 1.45 | 3.6 | 13.1 | 2.420 | 3.057 | 6.70 | 4.23 |
| G023.6000.00MM1 | 5.97 | 22.930 | 22.771 | 7.02 | 5.9 | 16.9 | 3.782 | 3.519 | 1.21 | 2.42 |
| G023.6000.00MM2 | 8.89 | 22.806 | 22.673 | 1.39 | 3.6 | 16.7 | 3.362 | 3.064 | 1.24 | |
| G31.410.31 | 5.57 | 23.696 | 1.12 | 4.9 | 22.0 | 4.800 | 3.852 | 1.52 | 1.30 | |
| G33.920.11 | 4.49 | 23.048 | 22.857 | 4.02 | 6.9 | 27.4 | 5.226 | 3.726 | 7.73 | 5.26 |
| G34.260.15 | 2.87 | 23.917 | 23.253 | 3.48 | 2.9 | 29.2 | 5.330 | 3.776 | 3.34 | 2.58 |
| G45.470.05 | 1.06 | 22.915 | 22.763 | 1.29 | 7.7 | 29.0 | 5.557 | 3.779 | 2.61 | |
| HM185070121 | 3.40 | 23.249 | 22.679 | 1.92 | 2.9 | 20.5 | 4.042 | 3.260 | 1.37 | 2.25 |
| HM185170437 | 3.50 | 1.9 | 1.50 | 7.47 | ||||||
| HM185300215 | 7.74 | 22.855 | 22.624 | 1.08 | 4.7 | 26.1 | 4.674 | 3.283 | 6.20 | |
| HM185660408 | 8.28 | 22.908 | 22.606 | 1.02 | 4.9 | 22.5 | 4.365 | 3.293 | 9.69 | 4.64 |
| HM192171651 | 5.22 | 22.659 | 22.373 | 1.15 | 10.9 | 29.1 | 5.035 | 3.457 | 2.37 | 4.04 |
3.3 SiO (1 – 0) column density and abundance
We assume that the SiO (10) is optically thin (e.g., Csengeri et al. 2016a), and so the total column density is given by,
| (1) | ||||
where is 43423.760 MHz, the Einstein coefficient for spontaneous emission, , is s-1, and the statistical weight of the upper state level, is 3. and are the partition function and Boltzmann constant, respectively. The energy of the upper level, , is 2.084 K. All these values are taken from the Cologne Database for Molecular Spectroscopy (CDMS, Müller et al. 2005; Endres et al. 2016). The partition function at 10 K is calculated by interpolating data from the CDMS. is the velocity integrated main beam temperature of an observed source, and is the beam filling factor, which is the fraction of the beam filled by the source. Here we consider the calculated column densities are beam-averaged values, and the medium is spatially homogeneous and larger than the size of the beam. Thus, the beam filling factor is adopted to be 1. We note that toward some sources the beam filling factor could be smaller than 1 if a SiO 1–0 emitting region is localized on scales smaller than the beam. In these cases, the beam filling factors are smaller than unity and the derived column density is a lower limit. is the Rayleigh-Jeans temperature, . is the background emission temperature assumed to be 2.7 K that is the cosmic microwave background radiation. Some sources do not have available measurements, and the SiO emitting regions are not always necessarily associated with embedded sources heating dust grains. It is also possible that the SiO and dust grains are not in thermal equilibrium. We assumed a fixed excitation temperature, , of 10 K for all the sources. Given that our data are subsequently compared with other SiO surveys that have also utilized the same fixed excitation temperature for calculating the SiO column density, this assumption remains valid within this specific context. However, to consider the potential variation in (SiO) caused by an unknown , we estimated uncertainties in (SiO) using a range of temperatures. We applied 5 K as the lower limit, while considering as the upper limits if is available. Thus, (SiO) derived in this study only represent lower limits of the measurements. Instead of using integrated intensity over the full width at zero power (FWZP), we adopt velocity-integrated intensity from Gaussian fit to avoid overestimating SiO column density due to noise. We derived SiO (10) column density, (SiO), in a range 2.181012 – 7.921013 cm-2 toward the all detected positions. The median (SiO) is 8.121012 cm-2. The (SiO) derived in this study are comparable with the SiO column densities ( cm-2 from SiO 2 – 1 and cm-2 from SiO 1 – 0) determined from SiO 1 – 0 and 2 – 1 surveys toward other massive star-forming regions (Csengeri et al., 2016a; Zhu et al., 2020).
To determine the SiO abundance, (SiO) relative to molecular hydrogen, we used \ceH2 column densities from the ATLASGAL catalog (Urquhart et al., 2018, 2022) but also obtained a beam-averaged (\ceH2) from \ceH2 column density maps produced by the point process mapping (PPMAP) to Hi-GAL data (Marsh et al., 2017) using the Python package, Photutils. (SiO), (\ceH2), and (SiO), that are derived here, and physical properties of associated dust clumps are listed in Table 7. With (\ceH2) obtained from PPMAP, the median and mean SiO abundances are 1.95 and 3.00. The SiO abundance can change significantly depending on (\ceH2), and thus to compare with SiO data from other surveys, we also use \ceH2 column densities obtained from Urquhart et al. (2018, 2022) for the other catalogs, which are subsequently compared with SiO column densities of our sources. The median and mean SiO abundances determined using the \ceH2 column densities from Urquhart et al. (2018, 2022) are 1.28 and 1.71, respectively. These abundances are close to the estimated abundances with the beam-average (\ceH2) from PPMAP. In the following sections, we use the physical parameters of associated clumps as well as (\ceH2) taken from the ATLASGAL catalog only for comparisons with previous surveys (i.e., Csengeri et al. 2016a; Zhu et al. 2020). In addition, for discussion, we use the PPMAP (\ceH2) column densities for sources that do not have ATLASGAL counterparts within the single-dish beam size. For uncertainties in (SiO), we used upper and lower limits of (SiO) using a range of excitation temperatures (from 5 K to ) but used a fixed (\ceH2). Thus, we note that these (SiO) values and their uncertainties are probably lower limits since SiO in the gas phase likely only exists in part of the relative \ceH2 column density. Moreover, additional uncertainties arising from Gaussian fits, calculated with where and represent uncertainties of for the narrow and broad Gaussian components respectively, are found to be insignificant.
4 Discussion
4.1 Comparisons with the properties of dust clumps
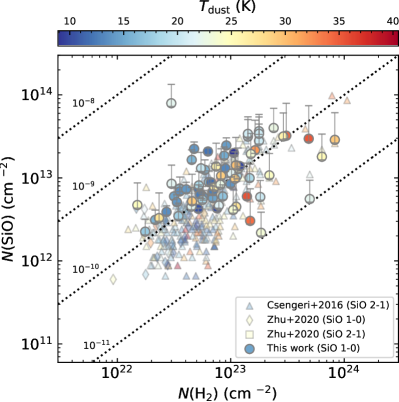
To understand the origin of SiO (1 – 0) emission, we compare the physical parameters of dust clumps associated with the detected SiO emission. The selected categories of observed sources do not provide the evolutionary stages of the embedded sources or surroundings. For instance, even some IRDCs, considered as the earliest stage, host evolved embedded objects, such as young stellar objects or hyper/ultra-compact Hii regions. For this reason, we utilize dust temperature and as an indicator of the evolutionary stages of star formation (Urquhart et al., 2018, 2022). Thus, in the following analyses, we exclusively compare sources with ATLASGAL counterparts to use the physical parameters measured from the dust continuum. In the upper panel of Fig. 6 shows the comparison between (SiO) and (\ceH2) for 73 sources observed in this survey (marked by circles), 261 dust clump sources hosting different evolutionary stages of massive stars (triangles) (Csengeri et al., 2016a), and 24 starless clump candidates (diamonds and squares) (Zhu et al., 2020) in the 1.1 mm continuum Bolocam Galactic Plane Survey (Svoboda et al., 2016). As mentioned in the previous section, the uncertainties of (SiO) indicated with error bars in Fig. 6 are determined by applying a range of 5 K as the lower limit and as the upper limit for cases with available from the ATLASGAL catalog (Urquhart et al., 2018, 2022). (SiO) trends to increase as (\ceH2) increases, while these column densities do not show any association with the evolutionary stages as indicated by the temperatures.
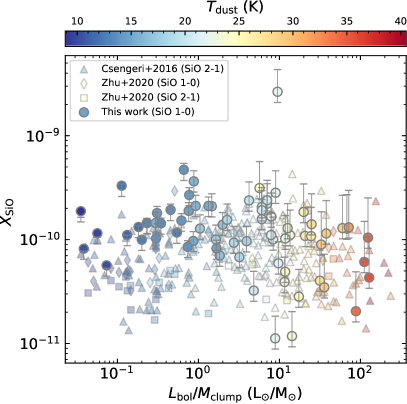
The plot in the lower panel of Fig. 6 shows the comparison of (SiO) and the ratio of bolometric luminosity and clump mass () with dust temperature in color, for sources mentioned above. The abundance uncertainties, represented by the error bars, are derived from the upper and lower (SiO) limits, while maintaining a constant (\ceH2). Therefore, as previously indicated, these (SiO) values serve as lower limits. The SiO abundances do not have any correlation with evolutionary stages. The lack of correlation between (SiO) and is also found toward the data points from the other SiO surveys with no dependency of the observed transitions. All the surveys used here adopt the excitation temperature of 10 K for SiO 1 – 0 and 2 – 1 transitions. To compare with our observations, we use the dust properties from Urquhart et al. (2018, 2022) to avoid any biased results due to applying different assumptions. Csengeri et al. (2016a) and Zhu et al. (2020) estimate (\ceH2) with different assumptions. Csengeri et al. (2016a) shows a moderate correlation of (SiO) with in their work, but that is likely due to assuming 18 K for the dust temperature to calculate the (\ceH2) used in their work. As a result, the (\ceH2) estimated in Csengeri et al. (2016a) are likely underestimated for infrared dark clumps, and thus SiO abundances toward the cold sources are overestimated.
Zhu et al. (2020) also show higher abundances in their analysis toward starless clump candidates, and their (\ceH2) column densities determined with \ceNH3 kinetic gas temperature are smaller than the (\ceH2) from the ATLASGAL catalog. This causes higher abundances of SiO toward the starless clump candidates. If kinetic gas temperature and dust temperatures are out of thermal equilibrium, using the gas temperature also leads to less accurate clump properties. Zhu et al. (2020) also shows higher abundances in their analysis toward starless clump candidates, and their (\ceH2) column densities determined with \ceNH3 kinetic gas temperature are smaller than the (\ceH2) from the ATLASGAL catalog. This causes higher abundances of SiO toward the starless clump candidates. If the kinetic gas temperature and dust temperatures are out of thermal equilibrium, using the gas temperature also leads to less accurate clump properties. Therefore, for all sources of these three surveys (Csengeri et al. 2016a, Zhu et al. 2020 and this work), with ATLASGAL counterparts, we used (\ceH2) taken from Urquhart et al. (2018, 2022) because the (\ceH2) were estimated with dust temperatures determined by fitting spectral energy distributions of mid- and far-infrared continuum data with individual cold graybody and warm blackbody functions (see König et al. 2017 for details). The lower panel of Fig. 6 shows that when using a uniform (\ceH2) data the gradient in abundance disappears.
We also notice that toward sources with 20 K, (SiO) determined in our study (, circle markers) and by Zhu et al. (2020) (, diamond markers) tend to be higher than Csengeri et al. (2011b) (, triangle markers) and Zhu et al. (2020) (, square markers). The origin of the difference between the and is unclear. The fixed excitation temperature to 10 K for SiO toward all the sources can affect the distribution of (SiO). Until the lines attain thermalization for a given density, the transition exhibits a lower compared to the transition, though this is unlikely to be the sole explanation. Decreasing to 5 K results in a 7% reduction in the inferred SiO column density from the 2 – 1 line, while further reducing to 3 K would be required to raise the column density by 30%. The observed discrepancy between the two transitions may be influenced by the distinct beam sizes employed for the 1 – 0 () and 2 – 1 () transitions. Consequently, the higher column densities of SiO derived from the 1 – 0 transition could imply that the SiO emission exhibits spatial extension beyond the region probed by the 2 – 1 transition.
By using the same data set for the clump properties for the three SiO surveys compared here, we find that (SiO) does not show any apparent correlation with which indicate the evolutionary stage of clumps. This is consistent with the findings from previous observations (e.g., Liu et al. 2022). With potential uncertainty for the SiO excitation temperature, Csengeri et al. (2016a) also conclude that there are no clear trends in SiO abundances compared with the evolutionary stages.
We also find that distributions of all three surveys (i.e., this survey, Csengeri et al. 2016a, and Zhu et al. 2020) show significant variations in SiO abundance across the samples of objects. The median (SiO) toward all the samples is about that is consistent with SiO abundances measured toward narrow and extended SiO emission regions toward IRDCs and low-velocity ( 10 – 15 km s-1) shocked areas (e.g., Duarte-Cabral et al. 2014; Jiménez-Serra et al. 2010; Cosentino et al. 2020) but smaller than SiO abundances , determined with SiO emission from outflow sources and high-velocity regimes of SiO emission in low- and high-mass star-forming regions (e.g., Jiménez-Serra et al. 2005, 2010; Sánchez-Monge et al. 2013; Duarte-Cabral et al. 2014; López-Sepulcre et al. 2016).
.
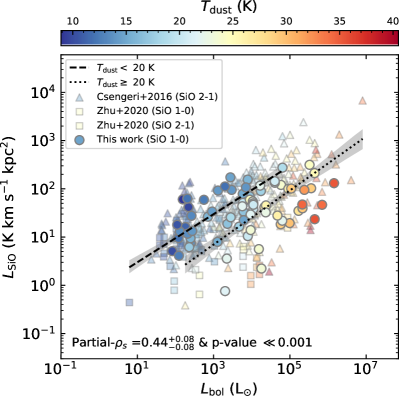
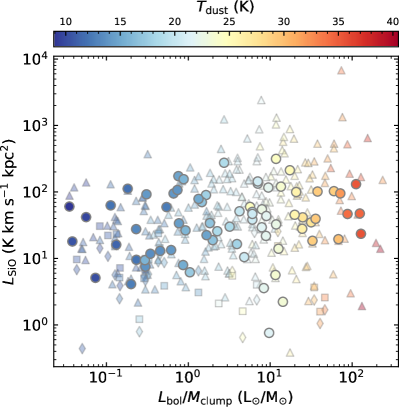
The upper panel of Fig. 7 shows the comparison between SiO luminosity and bolometric luminosity toward the three SiO surveys. Using a partial-spearman -rank correlation, which takes into account the influence of distance on the outcome, to all the data points, the distribution shows a moderate correlation (partial-) between the two parameters as higher sources trend to be associated with higher . In addition, at a given , sources with lower than 20 K have brighter SiO luminosity compared with other sources with 20 K. The dashed and dotted lines are the best fits of linear regression to the sources with colder or hotter than 20 K, respectively. The gray areas indicate the 2 confidence interval of uncertainties for the best fits. These uncertainties are estimated by iteratively performing linear regression fitting randomly resampled data sets of the applied sample. It seems that SiO luminosity for sources of a given bolometric luminosity is greater by a factor of for sources with dust temperatures less than 20 K. However, the excess SiO luminosity is not relevant to the evolutionary stage of the embedded objects or the clumps as estimated by as we do not find any correlation in the comparison of and plotted in the lower panel of Fig. 7. Liu et al. (2022) also did not find a trend in the comparison between and for SiO (2 – 1) toward 171 massive star-forming clumps from the ALMA ACA observations, which have higher angular resolutions ( 13.5′′) than this survey. Their colder clumps also have a higher SiO luminosity at a given bolometric luminosity. This might imply that there could be additional formation mechanisms to release SiO in the gas phase from dust grains, for example, via low-velocity shocks (Jiménez-Serra et al., 2008) apart from stronger/fast shocks from outflows or/and jets releasing SiO from dust cores (Schilke et al., 1997; Gusdorf et al., 2008).
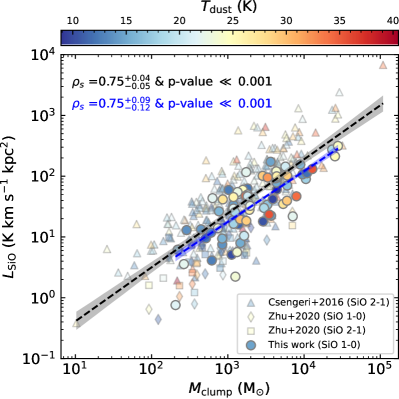
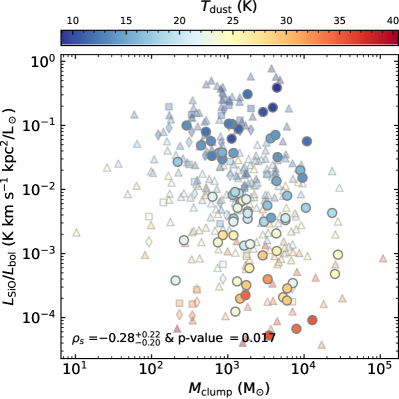
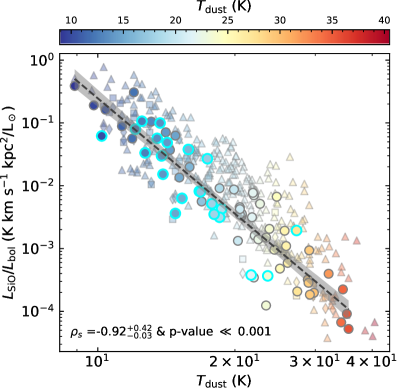
In Fig. 8, the upper panel shows versus . The SiO luminosities estimated over the beam size show the excellent correlations, with masses of the associated dust clumps for both cases including all the three surveys (black dashed line and gray shade region) or only our survey (blue dashed line and blue shade region) with a significant spearman -rank coefficient of 0.75 with value 3. In contrast to the plot of versus , there is no gradient in dust temperature observed in this comparison of mass and SiO luminosity. The lower panel of Fig. 8 shows the comparison of versus indicating no obvious correlation as spearman -rank coefficient of 0.28 (value of 0.017) is not significant. As found in the lower panel of Fig. 7 showing no trend with evolutionary stages of embedded sources, we also see no correlation between the clump mass and the dust temperature. Figure 9 shows that has a significant correlation (0.92 with value 0.001) with indicating the evolutionary stages of associated dust clumps. We find that is clearly larger toward colder ( 20 K) clumps at a given clump mass.
To distinguish SiO emission caused by ongoing star-forming activities (i.e., outflows or jets), we divide SiO emission sources into two groups based on four classifications of SiO emission features for SiO 1 – 0 and 2 – 1 transitions, from this survey and Csengeri et al. (2016a), respectively. In the SiO detection column of Table 1, sources marked with indicating no sign of wing features in either or transitions with a narrow 8 km s-1 are classified as non-wing SiO sources, in other words, which are narrow line SiO sources. The other cases with SiO wing features or/and broad SiO line with 8 km s-1 are considered SiO wing sources. The narrow SiO emission marked with cyan circles in Fig. 9 are tightly associated with cold clumps, which also have large ratios. We discuss the physical properties of these narrow SiO sources in detail in the following section (Sect. 4.3).
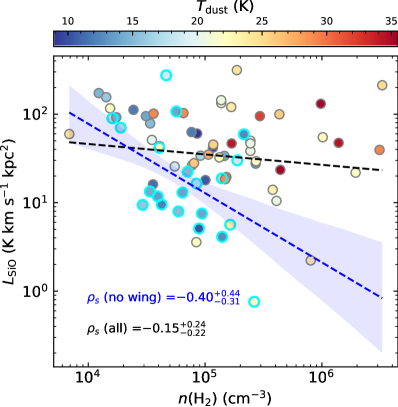
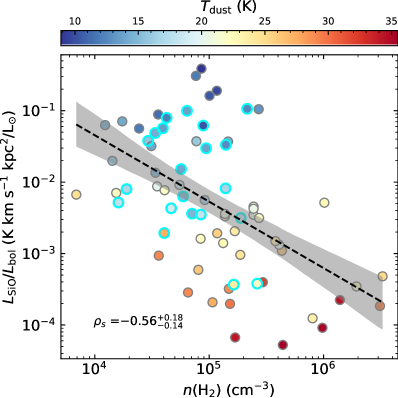
Figure 10 shows comparisons of the volume density of molecular hydrogen and SiO luminosity (in the upper panel) and (in the lower panel). For all the sources in the upper panel plot, we find no correlation () between and (\ceH2), and the linear-regression fit is the black dashed line. However, interestingly, the narrow SiO sources marked with open cyan circles are mainly located in the lower envelope of the distribution and show a moderate correlation of . The linear regression best fit is the blue dashed line, and its 2 confidence intervals are indicated in the blue shaded area.
In the lower panel plot of versus (\ceH2), we see a slightly better correlation with . Although the range of volume density is small, it is clear that lower volume density regions have higher SiO luminosity relative to . In general, we expect lower (\ceH2) toward early evolutionary stages due to longer free-fall times, while more evolved stages trend to have high (\ceH2) and corresponding shorter free-fall times (Urquhart et al., 2018, 2022). The lower panel of Fig. 10 also shows trend as clumps with colder are mainly distributed toward (\ceH2) cm-3. However, at (\ceH2) around cm-3, both colder and hotter clumps exist. Nevertheless, it is significant that narrow SiO emission lines are often detected toward clumps with 20 K and (\ceH2) cm-3, and these clumps tend to have km s-1 kpc2/L⊙. Duarte-Cabral et al. (2014) and Csengeri et al. (2016a) suggest that narrow SiO emission sources without any bright infrared sources might trace the earliest phase of molecular clouds undergoing global-infalling processes or converging flows on clouds. Here we find high relative SiO luminosity to toward sources with K and (\ceH2) cm-3, with most of them showing narrow SiO emission. This trend might suggest that those narrow SiO sources or high sources observed in this survey are experiencing large-scale infall processes. If this suggestion is correct, it can explain why we see higher SiO luminosity toward sources with colder dust temperatures, mainly associated with IRDC sources.
| SiO wing source | Non-wing SiO source | ||||||||
| # | Mean | Median | Standard deviation | # | Mean | Median | Standard deviation | ||
| (\ceH2) [cm-2] | 51 | 22 | |||||||
| (SiO) [cm-2] | 66 | 38 | |||||||
| (SiO) | 51 | 22 | |||||||
| [K] | 51 | 21.6 | 21.9 | 6.8 | 22 | 16.3 | 15.6 | 3.9 | |
| Log () [L⊙] | 50 | 5.03 | 4.04 | 5.38 | 22 | 3.87 | 3.21 | 4.14 | |
| Log () [M⊙] | 50 | 3.63 | 3.38 | 3.72 | 22 | 3.50 | 3.03 | 3.72 | |
| (\ceH2) [cm-3] | 51 | 21 | |||||||
| Log () [L⊙/M⊙] | 50 | 1.32 | 0.90 | 1.51 | 22 | 0.49 | 0.75 | ||
| Log () [K km s-1 kpc2/L⊙] | 50 | 22 | |||||||
| 37 | 11 | ||||||||
| 40 | 12 | ||||||||
4.2 Comparisons with 22 GHz \ceH2O and 44 GHz Class I \ceCH3OH maser emission
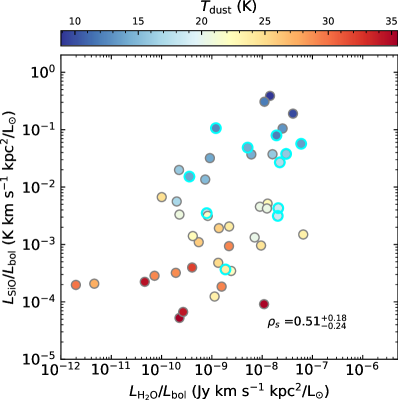
All of the positions observed for SiO (1 – 0) were also observed for 22 GHz \ceH2O and 44 GHz Class I \ceCH3OH masers with the KVN telescopes. We recalculated the luminosities of both the maser species with the same distances used for the SiO luminosities, and these are listed in Table 7. Figure 11 shows the comparisons of SiO and masers luminosities normalized by bolometric luminosity as tends to vary with evolutionary stages (e.g., shown in the lower panel of Fig. 10). Felli et al. (1992) show a strong correlation between and the mechanical luminosity of outflows in CO emission, which is proportional to the bolometric luminosity measured at submillimeter/far-infrared wavelengths. This indicates that \ceH2O masers are strongly associated with outflow sources. \ceH2O maser luminosities presented in this study, as shown, however, show a moderate correlation with SiO luminosities with the spearman correlation coefficient of 0.51 and -value 0.001). In addition, Duarte-Cabral et al. (2014) show that estimated for individual outflow sources correlate well with the respective CO outflow momentum flux (). However, when they compare the SiO luminosities obtained over entire fields including outflows and ambient gas regions, in which the observations do not resolve individual outflow sources, with the and find no correlation between SiO emission and CO flux powered by outflows. This is consistent with the lack of a significant correlation that we see between / and /.
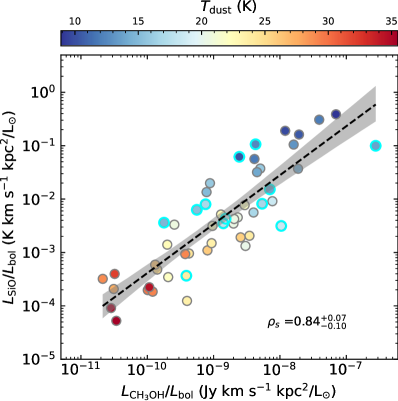
The scatter plot for versus in the lower panel of Fig. 11 shows a significant correlation. The spearman -rank efficient is 0.84 with a small -value 0.001. Such the strong correlation indicates that SiO and Class I 44 GHz \ceCH3OH maser trace similar properties of shocked gas toward these massive star-forming regions. We also find that SiO luminosity is strongly correlated with clump mass shown in the left panel of Fig. 8.
The 22 GHz \ceH2O and Class I 44 GHz \ceCH3OH masers are known to be collisionally pumped by mainly outflows (Felli et al., 1992; Kurtz et al., 2004), but for some cases, Class I \ceCH3OH masers are excited by expanding ionized gas (Voronkov et al., 2010, 2014; Gómez-Ruiz et al., 2016) or cloud-cloud collisions (Haschick & Baan, 1993; Sato et al., 2000). The processes collisionally exciting Class I \ceCH3OH maser can release SiO as well as possibly Si into the gas phase from icy mantles of dust grains/cores. This probably explains the tight correlation between the Class I \ceCH3OH maser and SiO emission shown in Fig. 11.
We also note that potentially the inclusion of thermal or quasi-thermal emission in the 44 GHz \ceCH3OH luminosity estimate might contribute to the scatter shown in the shaded gray area in the lower panel of Fig. 11. For \ceH2O maser (the upper panel), it unexpectedly shows much larger scatters with less correlation between the \ceH2O maser and SiO emission. In general, outflows could be the primary origin of producing SiO and exciting \ceH2O maser transition but as mentioned earlier, SiO can be produced by other processes. This might cause the large scatter between the SiO and \ceH2O emission.
4.3 Association with the presence of SiO wing features
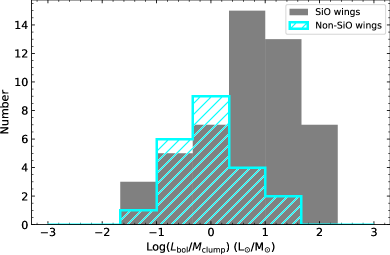
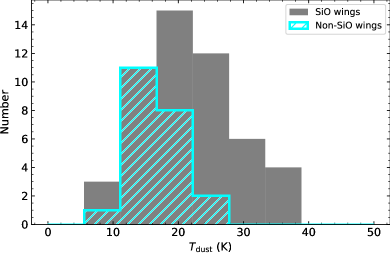
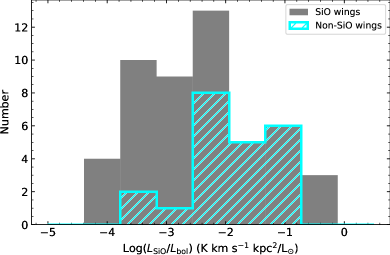
Table 5 lists mean, median, and standard deviation values of physical parameters toward sources with SiO wings and without them. shows no differences between the two groups. On the other hand, the mean and median values for Log (), , and Log (), which are all of traces of evolution, are apparently different with the presence of SiO wing features. We do not find any significant differences in \ceH2, SiO column densities, and (SiO) between SiO wing and non-wing sources. Overall sources with SiO wings have higher luminosity than non-wing sources by a factor 7 – 14 (depending on whether considering the median or mean ).
Figure 12 shows histograms of those parameter ratios for sources with SiO wings (in gray color) and without them (in cyan color). To distinguish significant differences in these physical parameters as well as between SiO wing sources and non-wing sources, we performed KS-tests on , , and where we find some differences in their mean and median values. According the KS-tests, we can strongly reject the null hypothesis, which is that the two group represent the same sample, for and with small values . For , comparing the two groups gives a value of 0.04 and so can be rejected at the 0.95 confidence level (2 ). Therefore, the sources with no apparent SiO wing features may tend to be associated with less evolved clumps indicated by lower and lower , whereas their are higher than those of sources with SiO wings.
Several studies (e.g., Motte et al. 2007; Sakai et al. 2010) report bright SiO emission toward less evolved sources (i.e., mid-infrared dark). We also find the trend toward our sources showing bright SiO emission toward colder and younger sources. However, some of them do not show high-velocity SiO emission, and their SiO lines have relatively narrow line widths ( km s-1). This may imply that the SiO emission toward the sources with no wings are associated with low-velocity shock processes, such as cloud-cloud collision (Cosentino et al., 2020; Armijos-Abendaño et al., 2020) or converging flow/global-infalling flow (Jiménez-Serra et al., 2010; Duarte-Cabral et al., 2014; Csengeri et al., 2016a), to release the SiO into the gas-phase.
4.4 The origin of SiO emission
Many sources observed in this survey host bright infrared objects, such as HMPOs and UCHiis that are selected with infrared colors (Wood & Churchwell, 1989b; Molinari et al., 1996; Rathborne et al., 2006). Some sources of the IRDCs have compact point sources at 4.5 m and 8 m wavelengths (Chambers et al., 2009). The detected SiO emission may originate from ongoing star-forming activity, such as outflows or jets from embedded sources. We have found 66 sources (18 UCHiis, 15 HMPOs, and 33 IRDC cores) showing SiO wing features or broad SiO lines ( km s-1), and most of the sources seem to be more evolved sources with a median Log() of 0.90 compared with those showing no SiO wing features (a median Log() ). Broad SiO line width and wing features apparently indicate the presence of fast shock with the typical C-shock velocity (e.g., Gusdorf et al. 2008). However, we also find narrow SiO components toward bright infrared sources at 8 m or/and 24 m wavelengths. Lefloch et al. (1998) found widespread SiO emission toward NGC 1333, and they proposed that the SiO emission lines trace materials shocked by outflows, being diverted and decelerated by interacting with colder ambient clumps. This can produce narrow SiO emission lines due to the processes formed by fast-shocks and surrounding gas at a systemic velocity (Lefloch et al., 1998; Codella et al., 1999; Duarte-Cabral et al., 2014).
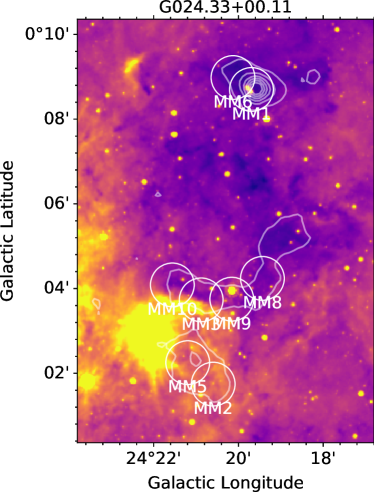
Some SiO-detected sources, however, do not have discernible infrared objects, and so they are classified as infrared quiescent sources in the ATLASGAL catalog or unidentified. Among those sources, narrow SiO emission lines are found toward eight sources: G023.6000.00 MM7, G024.3300.11 MM6, G024.3300.11 MM2, G024.3300.11 MM3, G024.3300.11 MM10, G028.3700.07 MM1, G028.3700.07 MM16, and G031.9700.07 MM8.
Within the IRDC G024.3300.11, three sources (MM2, MM3, and MM10) showing narrow SiO lines are found in the same cloud. G024.33+00.11 MM2 is very close to another source, G024.33+00.11 MM5, which shows a slightly broad SiO emission profile. The other positions, G24.3300.11 MM3 and MM10, are situated in the vicinity of a Hii bubble (Simpson et al., 2012; Anderson et al., 2015) showing bright 8 m emission presented in Fig. 13. It might be possible that their narrow SiO lines are produced by the photo-desorption of icy mantles of dust grains (Walmsley et al., 1999; Schilke et al., 2001). The SiO abundances relative to (\ceH2) obtained from PPMAP toward these four sources (MM2, MM3, MM5, and MM10 of G024.3300.11) surrounding the Hii bubble are range from – that are close to SiO abundances measured in translucent clouds ( – , Turner 1998) and in the Orion Bar PDR (, Schilke et al. 2001). However, (SiO) and (SiO) toward the MM2, MM3, MM5, MM10 regions also enter typical ranges of column density and abundance of SiO found in regions showing large-scale shocks (Jiménez-Serra et al., 2010) or cloud-cloud collision by the interaction between ambient colder gas and expanding Hii regions (Colombo et al., 2019; Zhu et al., 2023) as all of the positions surround the 8 m bright Hii region (see Fig. 13).
G024.3300.11 MM6 is close to MM1, hosting a young stellar object that likely has outflows. Thus, the SiO emission detected toward MM6 could be tracing the shocked gas interacting with potential outflows, and this might be the same for G028.3700.07 MM1, which is close to the bright 8 m source. However, G028.3700.07 MM1 and G024.3300.11 MM6 are separated by 0.64 – 1.12 pc from the outflow candidate sources. These IRDCs are relatively isolated from the other IRDCs in IRDC G024.3300.11. If these narrow SiO emission are not associated with outflows, this could be explained by shocks associated with infalling material from massive dense clumps ( pc) onto the core envelope scale ( pc) or small-scale converging flows creating low-velocity shocks (Jiménez-Serra et al., 2010; Csengeri et al., 2011a, b; Nguyen-Lu’o’ng et al., 2013; Duarte-Cabral et al., 2014; Louvet et al., 2016).
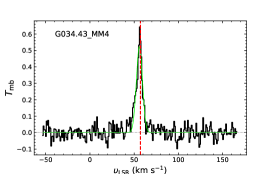
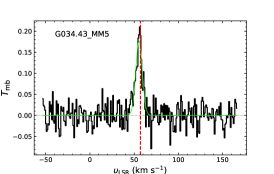
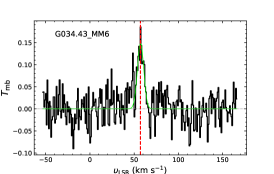
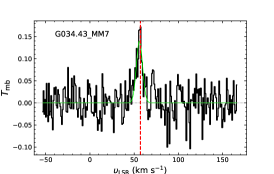
Although we adopt a of 8 km s-1 as the threshold to divide sources into two groups, narrow (i.e., non-wing SiO) and broad (i.e., SiO wing) SiO emission sources, the value is still arbitrary, and in many previous studies, the definition of the line width for narrow SiO components are variable ( km s-1 to 10 – 15 km s-1) (e.g., Jiménez-Serra et al. 2010; Lefloch et al. 1998; Cosentino et al. 2020; Duarte-Cabral et al. 2014; Csengeri et al. 2016a; Louvet et al. 2016; Nguyen-Lu’o’ng et al. 2013). In this survey, seven sources (G015.0500.07 MM1, G023.6000.00 MM4, G028.5300.25 MM10, G034.4300.24 MM5, G034.4300.24 MM6, G034.4300.24 MM7, and G034.43+00.24 MM8) with 8 km s-1 and no significant wing features of SiO do not have any infrared counterpart or are classified as embedded sources in the ATLASGAL catalog.
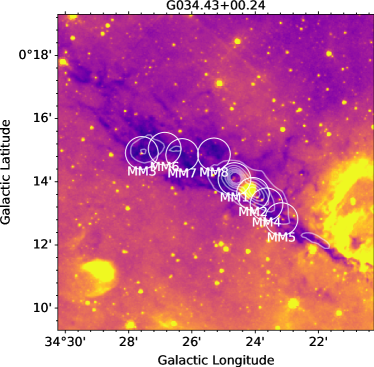
Four positions out of the seven sources with SiO line width 8 km s-1 without both SiO wing features and discernible embedded objects are located in the IRDC G034.43+00.24, these are MM5, MM6, MM7, and MM8 marked in Fig. 14. Those positions are located far from the outflow sources, that are MM1 which is known an extended green object (EGO G034.410.24, Cyganowski et al. 2008), MM2, and MM3, with separations of 0.64–0.86 pc. As seen in Fig. 14, these four positions clearly follow the high visual extinction region at 8 m along the filamentary features. We find such cares toward other IRDCs for narrow SiO sources without embedded sources; G015.0500.07 MM1, G023.6000.00 MM4, G023.6000.00 MM7, G028.3700.07 MM1, G028.3700.07 MM16, G028.5300.25 MM10, and G031.9700.07 MM8. In cold and dense environments, Si is unlikely to be in the gas phase because of depletion back onto the icy grain mantles or oxidization forming \ceSiO2, which itself is also eventually depleted to the ice mantle of dust grains. This leads to the relatively short lifetime of SiO in the gas phase in about yr (Martin-Pintado et al., 1992; Gusdorf et al., 2008). According to Nguyen-Lu’o’ng et al. (2013) and Duarte-Cabral et al. (2014), converging flow from diffuse interstellar mediums containing preexisting SiO in the gas phase into massive dense clumps provide low-velocity shocks with of 5 km s-1 that could preserve the abundance of SiO above the typical abundance of in low-mass dense cores (Ziurys et al., 1989). Toward some diffuse and translucent clouds (e.g., Turner 1998; Rybarczyk et al. 2023), absorption observations show that SiO can already exist in the gas phase from diffuse environments. In addition, Guillet et al. (2011), Caselli et al. (1997) and Jiménez-Serra et al. (2008) show that low-velocity shocks about 10 – 15 km s-1 can produce SiO in the gas-phase through sputtering for evaporation of the grain mantle ices caused by grain-grain collisions or desorbing Si in the gas phase if a fraction of Si exits in the grain ice mantles. Such low-velocity shocks can be created by cloud-cloud collisions, infalling materials, or converging flows.
Our survey shows that narrow SiO without wing features are commonly detected toward IRDCs. However, this could be due to an observational bias because we observed more positions in the IRDCs than toward HMPOs and UCHiis. We note that the large number of detections toward IRDCs are not due to their distances as their detection distribution in distance is not significantly different from those of HMPOs and UCHiis. Therefore, it is hard to conclude that narrow SiO emission features appear to be related to a particular type of cloud, for example, IRDCs. If we only consider sources having ATLASGAL counterparts, we can discern that narrow SiO sources with no wings are associated with younger and colder dust clumps. This supports the suggestions proposed in previous studies that narrow and widespread SiO emission lines toward molecular clumps with a lack of star-forming activity seem to be originated from cloud formation processes producing low-velocity shocks (10 – 15 km s-1) and to trace the early phase of molecular cloud evolution (Duarte-Cabral et al., 2014; Csengeri et al., 2016a).
5 Summary
We carried out a survey of 43 GHz SiO () emission toward 366 massive star-forming regions consisting of different evolutionary stages of massive stars, including infrared dark cloud cores, outflow candidates of high mass young stellar objects, and ultracompact Hii regions, with the KVN 21 m telescopes. The main results are:
-
We detected SiO (1 – 0) emission toward 106 positions (59 IRDC cores, 21 HMPOs, and 26 UCHiis), however, two sources out of the 59 IRDC cores are excluded from further analysis as the beam significantly overlaps with two sources with stronger SiO emission. We divide the 104 sources into two groups by line profile and ; 66 out of 104 sources are considered as non-wing SiO group because these sources do not have wing features at high-velocities in SiO (1 – 0) or/and (2 – 1) or/and of their SiO spectra are narrower than 8 km s-1. The remaining 38 sources have either high-velocity wing features in SiO 1 – 0 or 2 – 1 or/and their is broader than 8 km s-1 (the median width of all the fitted components) . We show that 72 (69%) and 81 (78%) sources have 22 GHz \ceH2O and 44 GHz Class I \ceCH3OH masers, respectively. By comparing physical properties of the dust clumps with SiO detection and non-detections, we show that the dust clumps with SiO emission are more massive (median Log () = 3.26) and colder (median K) than the clumps without SiO emission.
-
The range of the beam-averaged SiO column density is cm-2, and the median is cm-2. The median and mean (SiO) relative to (\ceH2) taken from the ATLASGAL catalog are and , respectively. (SiO) shows a good correlation with (\ceH2), but (SiO) does not show any strong correlation with the clump evolutionary stage as measured by the clump luminosity to mass ratio. We also find that for lower dust temperature sources, the SiO column density and abundance determined from SiO 1 – 0 are times higher than those obtained from SiO 2 – 1 surveys. We find that less evolved sources (those with lower dust temperatures) tend to have higher ratio by a factor of 7 compared with higher temperature sources. is also very well correlated with the clump dust mass.
-
We have compared with and toward \ceH2O and \ceCH3OH maser detected sources, respectively. We find that SiO does not seem to be correlated with \ceH2O, although both transitions are known as outflow tracers. However, the SiO luminosity correlates well with \ceCH3OH luminosity, which itself is also well correlated with clump mass. These two molecules occur on dust grains and are released from the dust icy mantles or grain cores. Thus, it seems that toward our sources, the SiO and Class I \ceCH3OH maser emission might result from the related shocks.
-
Toward sources with outflow candidates, embedded young stellar objects or UCHiis, the detected SiO emission may be associated with outflows or jets as many of them show wing features at high-velocities and/or broader ( 8 km s-1). However, the origin of SiO emission toward infrared dark sources and sources without clear embedded young stellar objects is unclear. The majority of these sources have narrow SiO emission, and even if a SiO line width is broader than 8 km s-1, there are no clear embedded sources, and the observed positions can be situated far from bright infrared sources by 0.64 – 1.12 pc. In addition, we show that the SiO emission is can be widely spread over infrared clouds, not concentrated in a small area. Such cases might be associated with other mechanisms with low-velocity shocks ( km s-1). Cloud-cloud collisions, infalling material onto massive dense clumps, or converging flows from diffuse clouds toward dense molecular clouds are candidates for such low-velocity shock resources.
This study demonstrates that toward colder molecular clumps without identified outflow sources, SiO traces low-velocity shocks. These shocks may be caused by various mechanisms, such as cloud-cloud collisions, expanding Hii regions, global infall, or converging flows. Therefore, SiO may be a more suitable tracer of shocks for such cases than a higher transition of SiO.
Acknowledgements.
We would like to thank the referee for their constructive comments and suggestions that have helped to improve this article. We are grateful to all staff members in Korean VLBI Network (KVN) who helped to operate the array and to correlate the data. The KVN is a facility operated by Korea Astronomy and Space Science Institute (KASI). W.-J. Kim was supported by DLR/Verbundforschung Astronomie und Astrophysik Grant 50 OR 2007 for this work. G.A.F acknowledges support from the Universität zu Köln and its Global Faculty Program.References
- Anderson et al. (2015) Anderson, L. D., Armentrout, W. P., Johnstone, B. M., et al. 2015, ApJS, 221, 26
- Armijos-Abendaño et al. (2020) Armijos-Abendaño, J., Banda-Barragán, W. E., Martín-Pintado, J., et al. 2020, MNRAS, 499, 4918
- Beuther et al. (2002) Beuther, H., Schilke, P., Menten, K. M., et al. 2002, ApJ, 566, 945
- Bronfman et al. (1996) Bronfman, L., Nyman, L. A., & May, J. 1996, A&AS, 115, 81
- Carral et al. (1999) Carral, P., Kurtz, S., Rodríguez, L. F., et al. 1999, Rev. Mexicana Astron. Astrofis., 35, 97
- Caselli et al. (1997) Caselli, P., Hartquist, T. W., & Havnes, O. 1997, A&A, 322, 296
- Chambers et al. (2009) Chambers, E. T., Jackson, J. M., Rathborne, J. M., & Simon, R. 2009, ApJS, 181, 360
- Chira et al. (2013) Chira, R. A., Beuther, H., Linz, H., et al. 2013, A&A, 552, A40
- Churchwell et al. (1990) Churchwell, E., Walmsley, C. M., & Cesaroni, R. 1990, A&AS, 83, 119
- Codella et al. (1999) Codella, C., Bachiller, R., & Reipurth, B. 1999, A&A, 343, 585
- Colombo et al. (2019) Colombo, D., Rosolowsky, E., Duarte-Cabral, A., et al. 2019, MNRAS, 483, 4291
- Cosentino et al. (2019) Cosentino, G., Jiménez-Serra, I., Caselli, P., et al. 2019, ApJ, 881, L42
- Cosentino et al. (2020) Cosentino, G., Jiménez-Serra, I., Henshaw, J. D., et al. 2020, MNRAS, 499, 1666
- Cosentino et al. (2022) Cosentino, G., Jiménez-Serra, I., Tan, J. C., et al. 2022, MNRAS, 511, 953
- Csengeri et al. (2011a) Csengeri, T., Bontemps, S., Schneider, N., Motte, F., & Dib, S. 2011a, A&A, 527, A135
- Csengeri et al. (2011b) Csengeri, T., Bontemps, S., Schneider, N., et al. 2011b, ApJ, 740, L5
- Csengeri et al. (2017) Csengeri, T., Bontemps, S., Wyrowski, F., et al. 2017, A&A, 601, A60
- Csengeri et al. (2016a) Csengeri, T., Leurini, S., Wyrowski, F., et al. 2016a, A&A, 586, A149
- Csengeri et al. (2016b) Csengeri, T., Weiss, A., Wyrowski, F., et al. 2016b, A&A, 585, A104
- Cyganowski et al. (2008) Cyganowski, C. J., Whitney, B. A., Holden, E., et al. 2008, AJ, 136, 2391
- Duarte-Cabral et al. (2014) Duarte-Cabral, A., Bontemps, S., Motte, F., et al. 2014, A&A, 570, A1
- Dumas et al. (2014) Dumas, G., Vaupré, S., Ceccarelli, C., et al. 2014, ApJ, 786, L24
- Egan et al. (1998) Egan, M. P., Shipman, R. F., Price, S. D., et al. 1998, ApJ, 494, L199
- Elia et al. (2021) Elia, D., Merello, M., Molinari, S., et al. 2021, MNRAS, 504, 2742
- Endres et al. (2016) Endres, C. P., Schlemmer, S., Schilke, P., Stutzki, J., & Müller, H. S. 2016, Journal of Molecular Spectroscopy, 327, 95, new Visions of Spectroscopic Databases, Volume II
- Felli et al. (1992) Felli, M., Palagi, F., & Tofani, G. 1992, A&A, 255, 293
- Fuller et al. (2005) Fuller, G. A., Williams, S. J., & Sridharan, T. K. 2005, A&A, 442, 949
- Gómez-Ruiz et al. (2016) Gómez-Ruiz, A. I., Kurtz, S. E., Araya, E. D., Hofner, P., & Loinard, L. 2016, ApJS, 222, 18
- Gregory & Condon (1991) Gregory, P. C. & Condon, J. J. 1991, ApJS, 75, 1011
- Griffith et al. (1994) Griffith, M. R., Wright, A. E., Burke, B. F., & Ekers, R. D. 1994, ApJS, 90, 179
- Guillet et al. (2011) Guillet, V., Pineau Des Forêts, G., & Jones, A. P. 2011, A&A, 527, A123
- Gusdorf et al. (2008) Gusdorf, A., Pineau Des Forêts, G., Cabrit, S., & Flower, D. R. 2008, A&A, 490, 695
- Haschick & Baan (1993) Haschick, A. D. & Baan, W. A. 1993, ApJ, 410, 663
- Hennebelle et al. (2001) Hennebelle, P., Pérault, M., Teyssier, D., & Ganesh, S. 2001, A&A, 365, 598
- Jackson et al. (2019) Jackson, J. M., Whitaker, J. S., Rathborne, J. M., et al. 2019, ApJ, 870, 5
- Jiménez-Serra et al. (2008) Jiménez-Serra, I., Caselli, P., Martín-Pintado, J., & Hartquist, T. W. 2008, A&A, 482, 549
- Jiménez-Serra et al. (2010) Jiménez-Serra, I., Caselli, P., Tan, J. C., et al. 2010, MNRAS, 406, 187
- Jiménez-Serra et al. (2005) Jiménez-Serra, I., Martín-Pintado, J., Rodríguez-Franco, A., & Martín, S. 2005, ApJ, 627, L121
- Kelly et al. (2017) Kelly, G., Viti, S., García-Burillo, S., et al. 2017, A&A, 597, A11
- Kim (2016) Kim, C.-H. 2016, PhD thesis, Seoul National University, Korea
- Kim et al. (2011) Kim, K.-T., Byun, D.-Y., Je, D.-H., et al. 2011, Journal of Korean Astronomical Society, 44, 81
- Kim et al. (2019) Kim, W.-J., Kim, K.-T., & Kim, K.-T. 2019, ApJS, 244, 2
- König et al. (2017) König, C., Urquhart, J. S., Csengeri, T., et al. 2017, A&A, 599, A139
- Kurtz et al. (1994) Kurtz, S., Churchwell, E., & Wood, D. O. S. 1994, ApJS, 91, 659
- Kurtz et al. (2004) Kurtz, S., Hofner, P., & Álvarez, C. V. 2004, ApJS, 155, 149
- Lee et al. (2011) Lee, S.-S., Byun, D.-Y., Oh, C. S., et al. 2011, PASP, 123, 1398
- Lefloch et al. (1998) Lefloch, B., Castets, A., Cernicharo, J., & Loinard, L. 1998, ApJ, 504, L109
- Liu et al. (2022) Liu, R., Liu, T., Chen, G., et al. 2022, MNRAS, 511, 3618
- López-Sepulcre et al. (2016) López-Sepulcre, A., Watanabe, Y., Sakai, N., et al. 2016, ApJ, 822, 85
- Louvet et al. (2016) Louvet, F., Motte, F., Gusdorf, A., et al. 2016, A&A, 595, A122
- Marsh et al. (2017) Marsh, K. A., Whitworth, A. P., Lomax, O., et al. 2017, MNRAS, 471, 2730
- Martin-Pintado et al. (1992) Martin-Pintado, J., Bachiller, R., & Fuente, A. 1992, A&A, 254, 315
- Molinari et al. (1996) Molinari, S., Brand, J., Cesaroni, R., & Palla, F. 1996, A&A, 308, 573
- Motte et al. (2007) Motte, F., Bontemps, S., Schilke, P., et al. 2007, A&A, 476, 1243
- Müller et al. (2005) Müller, H. S. P., Schlöder, F., Stutzki, J., & Winnewisser, G. 2005, Journal of Molecular Structure, 742, 215
- Nguyen-Lu’o’ng et al. (2013) Nguyen-Lu’o’ng, Q., Motte, F., Carlhoff, P., et al. 2013, ApJ, 775, 88
- Perault et al. (1996) Perault, M., Omont, A., Simon, G., et al. 1996, A&A, 315, L165
- Peretto & Fuller (2009) Peretto, N. & Fuller, G. A. 2009, A&A, 505, 405
- Peretto et al. (2013) Peretto, N., Fuller, G. A., Duarte-Cabral, A., et al. 2013, A&A, 555, A112
- Pety (2005) Pety, J. 2005, in SF2A-2005: Semaine de l’Astrophysique Francaise, ed. F. Casoli, T. Contini, J. M. Hameury, & L. Pagani, 721
- Pillai et al. (2023) Pillai, T. G. S., Urquhart, J. S., Leurini, S., et al. 2023, MNRAS, 522, 3357
- Ramesh & Sridharan (1997) Ramesh, B. & Sridharan, T. K. 1997, MNRAS, 284, 1001
- Rathborne et al. (2006) Rathborne, J. M., Jackson, J. M., & Simon, R. 2006, ApJ, 641, 389
- Rybarczyk et al. (2023) Rybarczyk, D. R., Stanimirovic, S., & Gusdorf, A. 2023, arXiv e-prints, arXiv:2304.06741
- Sakai et al. (2010) Sakai, T., Sakai, N., Hirota, T., & Yamamoto, S. 2010, ApJ, 714, 1658
- Sánchez-Monge et al. (2013) Sánchez-Monge, Á., López-Sepulcre, A., Cesaroni, R., et al. 2013, A&A, 557, A94
- Sato et al. (2000) Sato, F., Hasegawa, T., Whiteoak, J. B., & Miyawaki, R. 2000, ApJ, 535, 857
- Schilke et al. (2001) Schilke, P., Pineau des Forêts, G., Walmsley, C. M., & Martín-Pintado, J. 2001, A&A, 372, 291
- Schilke et al. (1997) Schilke, P., Walmsley, C. M., Pineau des Forets, G., & Flower, D. R. 1997, A&A, 321, 293
- Schuller et al. (2009) Schuller, F., Menten, K. M., Contreras, Y., Wyrowski, F., & Schilke, e. a. 2009, A&A, 504, 415
- Simpson et al. (2012) Simpson, R. J., Povich, M. S., Kendrew, S., et al. 2012, MNRAS, 424, 2442
- Sridharan et al. (2002) Sridharan, T. K., Beuther, H., Schilke, P., Menten, K. M., & Wyrowski, F. 2002, ApJ, 566, 931
- Svoboda et al. (2016) Svoboda, B. E., Shirley, Y. L., Battersby, C., et al. 2016, ApJ, 822, 59
- Traficante et al. (2018) Traficante, A., Fuller, G. A., Smith, R. J., et al. 2018, MNRAS, 473, 4975
- Turner (1998) Turner, B. E. 1998, ApJ, 495, 804
- Urquhart et al. (2018) Urquhart, J. S., König, C., Giannetti, A., et al. 2018, MNRAS, 473, 1059
- Urquhart et al. (2022) Urquhart, J. S., Wells, M. R. A., Pillai, T., et al. 2022, MNRAS, 510, 3389
- Vaupré et al. (2014) Vaupré, S., Hily-Blant, P., Ceccarelli, C., et al. 2014, A&A, 568, A50
- Voronkov et al. (2014) Voronkov, M. A., Caswell, J. L., Ellingsen, S. P., Green, J. A., & Breen, S. L. 2014, MNRAS, 439, 2584
- Voronkov et al. (2010) Voronkov, M. A., Caswell, J. L., Ellingsen, S. P., & Sobolev, A. M. 2010, MNRAS, 405, 2471
- Walmsley et al. (1999) Walmsley, C. M., Pineau des Forêts, G., & Flower, D. R. 1999, A&A, 342, 542
- Walsh et al. (1998) Walsh, A. J., Burton, M. G., Hyland, A. R., & Robinson, G. 1998, MNRAS, 301, 640
- Widmann et al. (2016) Widmann, F., Beuther, H., Schilke, P., & Stanke, T. 2016, A&A, 589, A29
- Wood & Churchwell (1989a) Wood, D. O. S. & Churchwell, E. 1989a, ApJ, 340, 265
- Wood & Churchwell (1989b) Wood, D. O. S. & Churchwell, E. 1989b, ApJS, 69, 831
- Wright et al. (1994) Wright, A. E., Griffith, M. R., Burke, B. F., & Ekers, R. D. 1994, ApJS, 91, 111
- Wyrowski et al. (2016) Wyrowski, F., Güsten, R., Menten, K. M., et al. 2016, A&A, 585, A149
- Zhu et al. (2023) Zhu, F.-Y., Wang, J., Yan, Y., Zhu, Q.-F., & Li, J. 2023, MNRAS, 523, 2770
- Zhu et al. (2020) Zhu, F.-Y., Wang, J.-Z., Liu, T., et al. 2020, MNRAS, 499, 6018
- Ziurys et al. (1989) Ziurys, L. M., Friberg, P., & Irvine, W. M. 1989, ApJ, 343, 201
Appendix A SiO 1 – 0 spectral lines
Appendix B Histograms