Photoreflectance spectroscopy of BiOCl epitaxial thin films
Far-IR R&D Center
University of Fukui
Fukui 910-8507, Japan
\And
Far-IR R&D Center
University of Fukui
Fukui 910-8507, Japan
tmakino@u-fukui.ac.jp
\AND
SKL-ATMSP
Wuhan University of Technology
Wuhan 430070, China
\And
Department of Chemistry,
Tokyo Metropolitan University
Hachioji 192-0397, Japan
\And
Department of Chemistry and WPI-AIMR
Tohoku University
Sendai 980-8578, Japan
Abstract
We have observed a new optical transition in the photoreflectance spectra of indirect-gap BiOCl thin films, which were grown on SrTiO3 substrates. The position of this transition is close in energy to its bulk critical point energy. Moreover, these are significantly lower than a higher-lying direct-type critical point from an energetic point of view. The spectral line shape analysis for our observed signal suggests the presence of an excitonic effect of this compound. We determined its dependence of the optical anomaly on temperature ranging from 80 K to room temperature. We adopted the Varshni model for this analysis. At last, we compared photonic properties of BiOCl with those of an element and binary semiconductors.
1 Introduction
Bismuth oxychloride (BiOCl) is one of the oxyhalide compounds. This compound belongs to the P4/nmm, i.e., a tetragonal structure. Namely, its crystal structure can be regarded as the same as that of matlockite [1–4]. This has played an important role in both basic and applied perspectives as one of the wide-gap materials because of its potential photocatalytic and optoelectronic applications [5,6].
Despite the abovementioned potentials, even a modern deposition technique has not been able to accomplish a flat surface [7], owing to its low symmetry. Until now, a number of attempts at thin film growth have shown that polycrystalline nanoplatelets or nanoflower-like particles have been formed [8]. This is also true for the conventional synthesis of bulk crystals [9]. To the best of our knowledge, no previous study has investigated the detailed optical properties, probably because the forms of the previously produced specimens are not adequate for the studies on the intrinsic physical properties. We here point out a pivotal work to attack this problem. Sun et al. have recently grown successfully epitaxial layers of BiOCl with a flat surface and high crystallinity. In their work, they adopted a mist chemical vapor deposition (CVD) method [7]. In that study, careful controls on various growth conditions such as carrier gas flow rate, growing temperature, and choice of an appropriate substrate (SrTiO3) allowed them to grow specimens with a flat surface, which potentially facilitates the detailed characterization of their intrinsic properties.
Several researchers so far have conducted first-principles calculations on the electronic structures of this oxyhalide. As earlier-mentioned, it is shown that the oxyhalides are classified as indirect-type semiconductors with the energy gap of ca. 2.9 eV [10]. We have considered that the optical response at the bandedge region of indirect semiconductors is weak. On this subject, much less is known about its properties. Especially in the case of thin films, the volume of the specimen under test cannot be useful to cover the weakness of such a bandedge-response-related signal. Therefore, observation of such a response in the case of indirect-type semiconductors is rarely expected when the specimen is only available in the form of thin films or epilayers. As earlier-mentioned, the grade suitable for detailed optical characterization having an atomically flat surface is only available in the form of thin films, which has discouraged the researchers from studying the spectroscopic study of the indirect-type semiconductors at the bandedge region. Recently, however, large optical transitions at bandedge have been observed in hexagonal-BN and diamond, both of which are albeit indirect semiconductors [11–13]. In these materials, both the strong excitonic effects and the strong electron-phonon interactions give rise to the observation of sufficiently strong optical transitions.
Despite not being intrinsic, another recent observation is the formation of an interface-related midgap state situated near the indirect-bandedge of TiO2 grown on F-doped SnO2, which leads to an optical response near the energy of the indirect-bandedge [14].
Even more, a Chinese group recently reported the results of theoretical calculations of an interesting electronic structure of oxyhalides [15]. They reported that the formation of heterostructures between oxyhalides would turn an indirect-type into a direct-type semiconductor. Therefore, it could be expected that BiOCl grown on SrTiO3 also becomes a direct-type semiconductor due to its heterostructure nature, and hence a strong optical response is observed at the indirect-bandedge.
As earlier mentioned, there are several possibilities leading to us the observation of the strong optical transitions even at the indirect-bandedge region. However, few examples of research have been conducted from such a point of view in the oxyhalides, which might be promising to gain understanding or deeper insight into their physical properties.
We paid attention to one of the spectroscopic tools in this work. This is known as photoreflectance (PR) spectroscopy. This measures the differential reflectance under the condition of applying an additional-irradiated-laser-beam- modulated electric field to the device under test (DUT) [16]. Because of these features, nondestructive and non-catalytic measurements can be attained by PR spectroscopy. In addition, the PR is known to have an energy-derivative and background-free nature. Therefore, this is considered appropriate for the detection of the bandedge optical transition.
To strengthen the potentials of BiOCl, it is necessary to further elucidate the fundamental properties from a material scientific point of view. For example, we could come up with a temperature-dependent optical property as one of the fundamental and technically essential properties of semiconductors. Expectedly, one can obtain through this study further insights into various aspects such as electron-phonon interaction, thermophysical phenomenon, and photonic properties. A search of the literature revealed that spectroscopic measurements have been performed only at room temperature up until now. There is almost no published data on the cryogenic temperature region.
In the current paper, we report on the discovery of a new optical transition in BiOCl thin films grown on SrTiO3 substrates, assessed with PR spectroscopy. We also estimated the temperature dependence of their optical properties. Special emphasis is placed on the interpretation of the temperature dependence of the bandgap energies with respect to the electron-phonon interaction. Finally, we compare the fit-determined parameters with those of other elements and binary semiconductors.
2 Experimental methods
2.1 Sample preparation
We grew epitaxial BiOCl thin films at a temperature of 350 ∘C. We adopted SrTiO3 (STO) as a substrate. There is a considerable difference in the lattice constants between BiOCl and STO, which was estimated to be ca. 0.33%. We grew the thin film, the typical thickness of which was ca. 260 nm. In this study, we adopted the mist-CVD technique [17,18]. It is now well known that this facile-solution-based technique enables fundamental growth even under atmospheric pressure. During the growth, we utilized N,N-dimethylformamide (DMF, purity: 99.5%; Wako) solutions of BiCl3 (purity: 99.99%; Kojundo Chemical Lab., 0.02 mol/L) as a precursor solution. This is followed by nebulization of the precursor solution into microscale mist and transfer to the substrates in a tubular furnace with N2 gas from the carrier and dilution ports at 3.0 L/min and 0.5 L/min, respectively [7].
2.2 Photoreflectance spectroscopy
Here, we explain an optical characterization method. The present study utilizes PR spectroscopy to analyze our observed data. Namely, we used a 325 nm line from a HeCd laser as a pumping source and monochromatized light from a Xe arc lamp as probe. Then, we attached DUT’s on a cold finger of a refrigerator for measurements in the cryogenic temperature range.
In this study, we used the normalization technique with careful treatment to avoid noise and spurious contributions. We have given a detailed explanation of why we adopted this technique elsewhere [14,19–22]. We summarize briefly here: we chose the DC-normalization procedure among several techniques, such as beam-sweeping and dual-chopping schemes. For the elimination of unwanted long-term thermal drift, great care was taken in the adoption of digital electronic components [22]. Throughout this study, we show the results after the facile a-posteriori subtraction of the constant background [23,24].
3 Calculation procedures
To calculate the band structures of BiOCl, we used the plane wave basis set PWscf package of Quantum ESPRESSO (QE) [25], an ab-initio density functional theory program with the plane wave basis, and a pseudopotential method [26–29]. In addition to calculating band dispersion, QE can also perform structural optimization calculations, eigenfrequencies, and dielectric constants. First-principles calculations within the framework of density functional theory (DFT) [30] is performed to analyze the structural and electronic properties of BiOCl. In this calculation, we neglected the contribution from SrTiO3. For the atomic coordinates of BiOCl, the structure that has been adopted in the previous DFT calculations, consistent with the experimental results, was adopted. To find the influence of the electron density on the exchange correlation energies of ions, we have used the LDA functional, which belongs to the class of Methfessel-Paxton functionals. The Brillouin zone (BZ) was integrated using an 8 8 8 centered Monkhorst-Pack k-point grid. As a precaution, it is necessary to adopt a value for which the cutoff energy converges. Our cutoff energy is Ry ( eV). The Bi, Cl, and O atoms are represented by norm-converving pseudopotentials, and the kinetic energy and charge density cutoffs are chosen to be 50 and 400 Ry (680 and 5442 eV), respectively. Methfessel-Paxton smearing of the Fermi-Dirac distribution, with a smearing width of 0.02 Ry (0.272 eV).
4 Theoretical models
4.1 Electronic energy-band structures of BiOCl
For purposes of discussion, detailed information on the electronic energy-band structures can be obtained with a wide variety of calculations of BiOCl. We also calculated the electronic energy-band structure of this compound. Figure 1 shows the calculated band structures of BiOCl along the high symmetry directions of the Brillouin zone (BZ). As can be seen, the crystal has an indirect bandgap. In other words, the fundamental absorption edge of this compound corresponds to the indirect bandgap. As indicated with an arrow in the figure, the optical transition is labeled E0. The top of the valence band (VB) is at the A point, and the bottom of the conduction band (CB) is at the Z point, respectively.
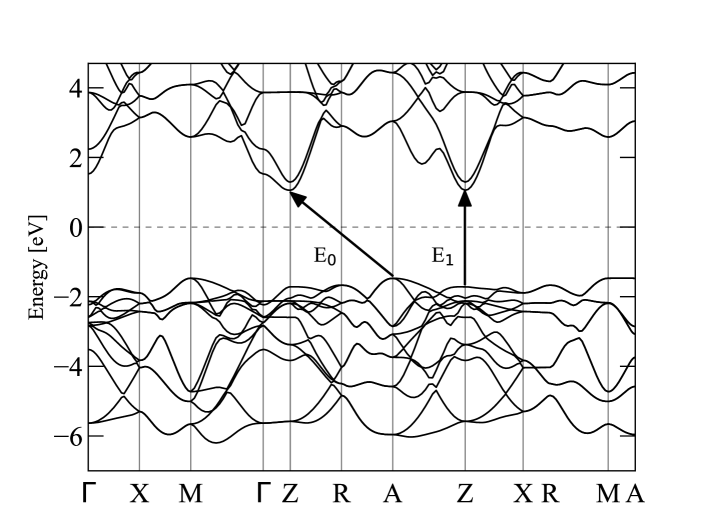
The calculated indirect DFT bandgap for BiOCl is ca. 2.5 eV. We can also confirm the higher-lying direct gap of ca. 2.8 eV. As shown with an arrow in the figure, the corresponding optical transition is labeled E1. It is well known that in DFT calculations, the bandgap of an insulator is often underestimated [31]. Our calculated value of the indirect bandgap energy is even lower than the ones calculated by other groups [10] as large as 2.9 eV. This is probably because we did not account for the Van-der-Waals effect in our calculation. This is not a serious concern because we show this band diagram for the main purpose of explaining optical transitions and assignments.
Considering the typical DFT-related ‘scissor’ shift ranging several hundreds of milli-electron-volts and the results of experimental studies conducted by other groups, the energy of the indirect-transition bandgap should be 3.2 eV in this compound. This agrees with the energetic range of our observed signal. As later discussed in detail, it is difficult to assign the PR signal to the indirect bandgap response. Hence, we tentatively assign this to an exciton related to the higher-lying E1 gap (ca. 3.5 eV).
4.2 Standard critical point theory
We here describe the model adopted throughout this study. This is called a standard critical point (SCP) model. Cardona, Aspens and others have established this critical point modeling [32,33]. This model relies on the experimentally obtained knowledge that fundamental features in the optical bandedge response are due to interband transition around the critical points. We analyzed our PR spectra obtained in this study are analyzed using the SCP model [34]. Based on this model, letting us set C, , and as an amplitude, phase angle and damping-related parameter, the differential reflectivity simply reads itself:
| (1) |
where is reflectivity change, is reflectance, is photon energy, and is the band gap energy at each temperature. Also, n represents the type of optical transition: = 2, 2.5, and 3 for an excitonic transition, a three-dimensional (3D) one-electron transition, and a two-dimensional one-electron transition, respectively. The phase angle takes the influence of an inhomogeneous electric modulation field into account [34].
5 Results and discussions
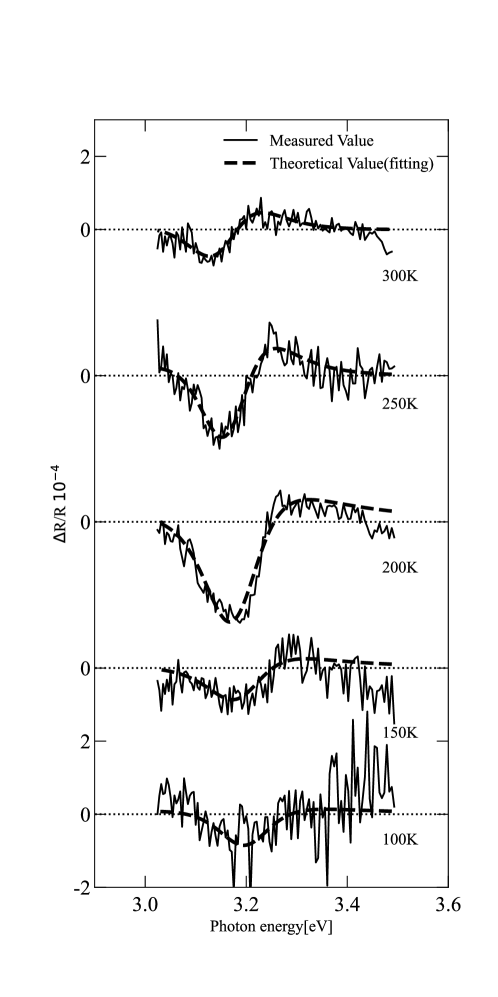
Figure 2 shows the measured PR spectra (solid lines) and the results of the fit based on the SCP theory to the measured data (dashed lines). These are taken for BiOCl thin films at temperatures of 100 to 300 K. Here, was estimated from SCP theory. It should be noted that, to the best of our knowledge, the PR signal associated with indirect transition has not been reported even for another indirect semiconductor such as SiC. Therefore, we exclude this assignment related to the E0 critical point. Alternatively, we assign this anomaly to the direct-type transition from the valence band of BiOCl to the interface midgap state, as has been observed in TiO2/F-SnO2 heterosystem [14]. This is because many years of research on harmonic generation have established the picture that optical processes through the midgap level almost always involve the true midgap level, and we believe that the midgap level is also the true midgap level in our case [35].
| Temperature (K) | (eV) | (rad) | (meV) | |
|---|---|---|---|---|
| 100 | 3.200 | 3.292 | 102 | |
| 150 | 3.193 | 3.705 | 108 | |
| 200 | 3.181 | 3.504 | 108 | |
| 250 | 3.171 | 5.318 | 121 | |
| 300 | 3.159 | 5.722 | 124 |
As seen in Table 1, the energy positions of the E1 peaks gradually increase as the temperature decreases from 300 to 100 K. For temperatures lower than 100 K, the energy positions of these peaks do not change so clearly (not shown in the figure). A similar tendency is observed for the spectral widths of these peaks. The dashed lines represent the theoretical fits using eq. (1). The excitonic () transition is taken into consideration in these fits. We successfully evaluated these regression parameters to be strength parameter and broadening parameters meV at 80 K, respectively. Other regression parameters are also summarized in Table 2. The abovementioned excitonic assignment favors our conjecture related to the E1 direct bandgap. In this case, we must attribute the energetic difference to the exciton binding energy, which amounts to ca. 300 meV. This is exceptionally large for the exciton binding energy of inorganic materials, although literature data reported the binding energy exceeding 200 meV for a delafossite-type cuprous oxide [36]. In addition, there is no published data suggesting presence of a sizable excitonic effect in oxyhalides. As has been extensively discussed in perovskite lead halides, it is now well known that the exciton binding energy severely depends on the crystalline shape. The microcrystals tend to exhibit smaller binding energies. So far, only the formation of polycrystalline nanoplatelets or nanoflower-like particles has been reported in oxyhalides. This is not advantageous due to the sizable excitonic effect. In other words, the availability of single-crystalline-grade epilayers can have the possibility of a sizable excitonic effect, which is suggestive for the consistent interpretation of our observations. On the other hand, let us discuss the assignment related to an indirect exciton, which has been recently observed in BN and diamonds as a strong optical transition even in the indirect-bandedge region. It is not necessary to consider the exceptionally large exciton binding energy for oxyhalides. It is considered that this assignment is, however, less plausible because this effect is cooperative, resulting both from a sizable excitonic effect and from an exceptionally large electron-phonon interaction. Moreover, this has only been reported for super-wide-gap semiconductors, which is not the case for oxyhalides. Nevertheless, extensive work should be conducted in the future for a more plausible and detailed assignment.
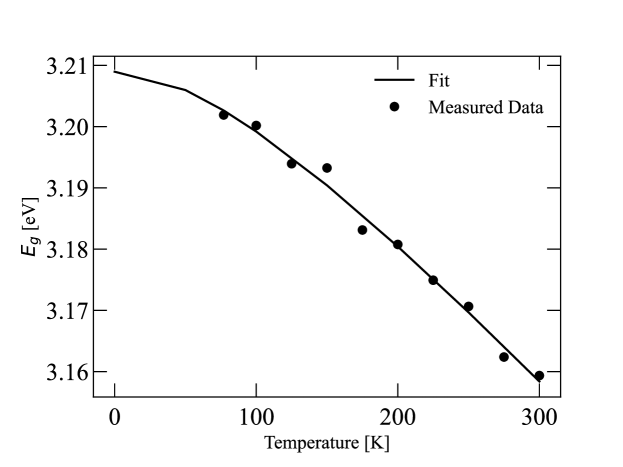
In Fig. 3, the plots of the critical point (CP) energies, versus temperature determined from the SCP fit analysis are shown. Closed circles in Fig. 3 depict the bandgap energy () in BiOCl as a function of temperature. We confirm that the bandgap energy () is monotonically decreasing along with the increase in temperature (T). Because the repulsion between electrons plays a role in the determination of the bandgap energy, the bandgap shrinkage is certainly a result of the thermal expansion of the crystal volume.
For comparison purposes, we adopted Varshini’s model to analyze the temperature-dependent bandgap energy, although there is a more flexible model [37,38]. Here, the corresponding temperature-dependent equation can be expressed as:
| (2) |
where is the bandgap energy at K, and are empirical and more or less phenomenological parameters [39]. The line in Fig. 3 denote the result of least-squares fits of eq. (2) to the experimental data [38]. The parameters are evaluated to be eV/K, K, eV, respectively. The calculated result (solid line in Fig. 3) is in reasonably good agreement with the experimental tendency, which is monotonic.
| Substance | (eV) | (eV/K) | (K) |
|---|---|---|---|
| Si | 1.16 | 1100 | |
| Ge | 0.741 | 210 | |
| GaAs | 1.53 | 570 | |
| Diamond | 5.42 | -1440 | |
| BiOCl | 3.21 | 170 |
We listed the Varshni-model-related parameters of a variety of elemental and compound semiconductors in Table 2 for comparison. We took these for Si, Ge, GaAs, and diamond from Ref. [37]. Although these parameters have been regarded as more or less phenomenological parameters, one of the hypothetical works insisted that is closely related to Debye’s temperature. Experimentally, the values of BiOCl are particularly low among the enumerated substances. It is considered that it is related to the relatively low optical phonon energy inherent to the Van-der-Waals bond nature. Because the oxyhalides are famous for the Van-der-Waals effect as a bonding mechanism, the relatively low concentration seems to be consistent with this conjecture.
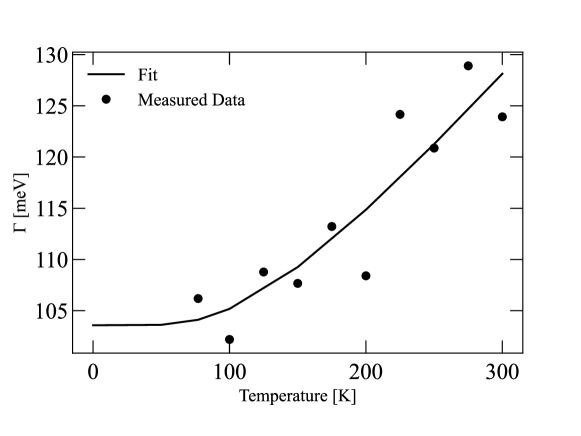
The effect of temperature has an influence not only on the energetic shift of the critical point (CP) but also on its broadening . Ozaki and coworkers have recently formulated a model for the purpose of temperature-induced broadening by taking into account the Bose-Einstein occupation factor [40,41]. By assuming that the electron (exciton)–optic phonon results in the broadening, and letting , , and as a temperature independent broadening, a phenomenological parameter, and an effective phonon temperature, its equation reads itself:
| (3) |
As an example of such a temperature-independent broadening mechanism, we can point out the Auger process, electron-electron interaction, crystalline imperfections, and surface scattering [40,41]. This equation tells us about an approximately constant value of from a low temperature of 80 K up to ca. 100 K. A temperature-dependent term in eq. (3) can no longer be negligible, which is followed a proportional increase at temperatures higher than ca. 100 K. The solid line in Fig. 4 correspond to the result of a fit to the experimentally obtained parameters. In the remainder, we compare an effective phonon temperature with the reported optic phonon energies of this compound. The maximum value of the optic phonon energy is ca. 25 meV, which is equivalent to 290 K [42]. This is significantly low compared with the value of , which is 360 K. It is believed so far that only one kind of optic phonon or weighted contribution from several phonons determines this effective temperature. On the contrary, our experimental result suggests rather that concomitant contributions both from Eg (7.3 meV) and A1g (25 meV) phonons, because the sum of these phonon energies coincide with the value of (360 K or equivalently 31 meV). Although more extensive works are necessary to support our preliminary assignment in the future, the energetic coincidence with the experimental result seems to capture the main features observed here. As has been demonstrated in lasing action mechanism in a certain class of semiconductor nanostructures, the importance of the polaron effect which is a consequence of the electron-phonon interaction is evident. Thus, the polaron-related material parameters obtained in this work are expected to be useful for future optoelectronic applications.
6 Conclusion
We assessed the temperature dependence of the optical properties of BiOCl thin films. We have been able to extract several important material parameters. We interpreted the TDBGE using a model based on the electron-phonon interaction. The temperature dependence of the CP parameters has been determined and analyzed using the Varshni equation [37] and an alternative analytical formula developed by Ozaki et al. recently [41]. We also compared the parameters with other substances using the Varshni equation. In particular, low values of were found, which may be related to the relatively low optical phonon energy inherent in the nature of van der Waals coupling. Also, he polaron-related material parameters obtained in this work are expected to be useful for future optoelectronic applications.
Acknowledgments
A partial financial support of this work from JSPS KAKENHI Grant Number 19K05303 was also acknowledged. We acknowledge technical assistance from E. Kobayashi.
References
-
1.
K. T. Drisya, S. Cortés-Lagunes, A.-L. Garduño-Jiménez, R. N. Mohan, N. Pineda-Aguilar, A. C. Mera, R. Zanella, and J. C. Durán-Alvarez, J. Environ. Chem. Eng. 10, 108495 (2022).
-
2.
K. G. Keramidas, G. P. Voutsas, and P. I. Rentzeperis, Zeitschrift für Krist. 205, 35 (1993).
-
3.
W. L. Huang and Q. Zhu, Comput. Mater. Sci. 43, 1101 (2008).
-
4.
Q. Wang, J. Hui, Y. Huang, Y. Ding, Y. Cai, S. Yin, Z. Li, and B. Su, Mater. Sci. Semicond. Process. 17, 87 (2014).
-
5.
Y. Yang, C. Zhang, C. Lai, G. Zeng, D. Huang, M. Cheng, J. Wang, F. Chen, C. Zhou, and W. Xiong, Adv. Colloid Interface Sci. 254, 76 (2018).
-
6.
L. Zhang, Z. Han, W. Wang, X. Li, Y. Su, D. Jiang, X. Lei, and S. Sun, Chem. Eur. J. 21, 18089 (2015).
-
7.
Z. Sun, D. Oka, and T. Fukumura, Chem. Commun. 56, 9481 (2020).
-
8.
D. S. Bhachu et al., Chem. Sci. 7, 4832 (2016).
-
9.
L. S. Gómez-Velázquez, A. Hernández-Gordillo, M. J. Robinson, V. J. Leppert, S. E. Rodil, and M. Bizarro, Dalton Trans. 47, 12459 (2018).
-
10.
L. Zhang, Z.-K. Tang, W.-M. Lau, W.-J. Yin, S.-X. Hu, and L.-M. Liu, Phys. Chem. Chem. Phys. 19, 20968 (2017).
-
11.
B. Arnaud, S. Lebegue, P. Rabiller, and M. Alouani, Phys. Rev. Lett. 96, 26402 (2006).
-
12.
G. Cassabois, P. Valvin, and B. Gil, Nat. Photonics 10, 262 (2016).
-
13.
K. Konishi and N. Naka, Phys. Rev. B 104, 125204 (2021).
-
14.
E. Kobayashi, S. Shinmura, S. Ito, and T. Makino, Jpn. J. Appl. Phys. 59, SCCB23 (2019).
-
15.
J. Wang, Y. Huang, J. Guo, J. Zhang, X. Wei, and F. Ma, J. Solid State Chem. 284, 121181 (2020).
-
16.
J. Misiewicz, P. Sitarek, G. Sek, and R. Kudrawiec, Mater. Sci. Pol. 21, 263 (2003).
-
17.
G. Yong Chung, H. Dong Kim, B. Tae Ahn, and H. Bin Im, Thin Solid Films 232, 28 (1993).
-
18.
T. Kawaharamura, G. T. Dang, and M. Furuta, Jpn. J. Appl. Phys. 51, 2 (2012).
-
19.
Y. Borensztein, R. Alameh, and M. Roy, Phys. Rev. B 48, 14737 (1993).
-
20.
T. Kita, M. Yamada, and O. Wada, Rev. Sci. Instrum. 79, 46110 (2008).
-
21.
U. Behn, A. Thamm, O. Brandt, and H. T. Grahn, J. Appl. Phys. 90, 5081 (2001).
-
22.
G. K. Boschloo, A. Goossens, and J. Schoonman, J. Electrochem. Soc. 144, 1311 (1997).
-
23.
H. Shen, P. Parayanthal, Y. F. Liu, and F. H. Pollak, Rev. Sci. Instrum. 58, 1429 (1987).
-
24.
D. Yan, H. Qiang, and F. H. Pollak, Rev. Sci. Instrum. 65, 1988 (1994).
-
25.
P. Giannozzi et al., J. Phys. Condens. Matter 21, 395502 (2009).
-
26.
X. Shan and H. Chen, Phys. Rev. E 47, 1815 (1993).
-
27.
X. Shan and H. Chen, Phys. Rev. E 49, 2941 (1994).
-
28.
X. Shan and G. Doolen, J. Stat. Phys. 81, 379 (1995).
-
29.
X. Shan and G. Doolen, Phys. Rev. E 54, 3614 (1996).
-
30.
P. Hohenberg and W. Kohn, Phys. Rev. 136, B864 (1964).
-
31.
J. Sun, C.-W. Lee, A. Kononov, A. Schleifé, and C. A. Ullrich, Phys. Rev. Lett. 127, 77401 (2021).
-
32.
P. Lautenschlager, M. Garriga, S. Logothetidis, and M. Cardona, Phys. Rev. B 35, 9174 (1987).
-
33.
D. E. Aspnes and A. A. Studna, Phys. Rev. B 27, 985 (1983).
-
34.
D. E. Aspnes, Surf. Sci. 37, 418 (1973).
-
35.
W. E. Angerer, N. Yang, A. G. Yodh, M. A. Khan, and C. J. Sun, Phys. Rev. B 59, 2932 (1999).
-
36.
H. Hiraga, T. Makino, T. Fukumura, H. Weng, and M. Kawasaki, Phys. Rev. B 84, 41411 (2011).
-
37.
Y. P. Varshni, Physica (Utrecht) 34, 149 (1967).
-
38.
R. Pässler, E. Griebl, H. Riepl, G. Lautner, S. Bauer, H. Preis, W. Gebhardt, B. Buda, D. J. As, D. Schikora, K. Lischka, K. Papagelis, and S. Ves, J. Appl. Phys. 86, 4403 (1999).
-
39.
I. A. Vainshtein, A. F. Zatsepin, and V. S. Kortov, Phys. Solid State 41, 905 (1999).
-
40.
L. Viña, S. Logothetidis, M. Cardona, Phys. Rev. B 30, 1979 (1984).
-
41.
S. Ozaki, T. Mishima, and S. Adachi, Jpn. J. Appl. Phys. 42, 5465 (2003).
-
42.
A. Rulmont, Spectrochim. Acta A 30, 311 (1974).