V1507 CYGNI (HD187399): A HIGHLY EVOLVED, ENIGMATIC INTERACTING BINARY SYSTEM WITH AN ECCENTRIC ORBIT
Abstract
The properties of the interacting, eccentric orbit binary V1507 Cyg (HD187399) are examined with spectra that cover wavelengths from 0.63 to m. The spectrum of the brightest star is very similar to that of the B8 I star Ori, although with absorption lines that show sub-structure consistent with a varying tidal field. The bulk of the H emission in the spectrum appears to be associated with the brighter star. Evidence is presented that the period of the system has been stable over timescales of many decades, arguing against large-scale mass transfer at the current epoch. Absorption and emission lines are identified that originate in an expanding asymmetric envelope around the companion, and component masses of and M⊙ are found, where the former applies to the brighter star and an inclination of 46o has been assumed. The evolutionary state of V1507 Cyg is then that of a system in which mass transfer has progressed to the point where the mass ratio has been reversed, with the brighter star stripped of much of its initial mass. It is argued that the brighter star is an Cyg variable, and that it is those light variations that dominate the system light curve. V1507 Cyg is observed at or near the center of a diffuse HI bubble that is detected at 408 and 1420MHz. It is suggested that the eccentric orbit is the result of evolution in a hierarchical system, in which a now-defunct massive third body recently disturbed the orbit of the stars in V1507 Cyg, thereby disrupting mass transfer.
1 INTRODUCTION
Binary stars play an important role in astrophysics. Non-interacting systems, in which the components are well detached, serve as fundamental calibrators of basic stellar properties (e.g. Torres et al., 2010), and are also primary distance indicators (e.g. de Vaucouleurs, 1978; Ren et al., 2021; Stassun & Torres, 2021). As for interacting systems, these are relatively common in the solar neighborhood, and mass transfer is thought to produce well-studied objects such as short period contact binaries (e.g. Stepien, 2006) and semi-detached systems (Morton, 1960; Smak, 1962). The former are also distance indicators (e.g. Rucinski, 1997). Interactions between very massive stars may also produce some of the most luminous objects in a galaxy, such as luminous blue variables (LBVs) and B[e] stars (e.g. Clark et al., 2013; Smith & Tombleson, 2015). If the initial conditions are right then the end result of interacting binary evolution will be the merger of stellar remnants within a Hubble time, resulting in the production of elements such as Au (e.g. Kobayashi et al., 2020). The immediate progenitors of such exotic systems have been detected in the solar neighborhood (e.g. Burdge et al., 2019, 2020).
The final state of a binary system is influenced by many factors, and so there is an obvious interest in characterizing the properties of a diverse population of close binary systems (CBSs), with a goal of linking the formation and early evolution of various system types with final end states. Spectra of the CBS V1507 Cyg (HD187399) are discussed in the present paper. V1507 Cyg was observed as part of a program underway with the 1.2 metre telescope at the Dominion Astrophysical Observatory (DAO) to record spectra of binaries with periods of tens of days that are thought to be in the early stages of mass transfer. Such systems are of interest since if mass transfer is not well-advanced then the component stars and system properties may not yet have departed far from their initial states, simplifying the task of characterizing the progenitors. This is also an evolutionary stage where the mass flow rate is expected to be very high, and significant amounts of mass may be lost from the system.
V1507 Cyg is in a list of possible W Ser systems and related objects that was compiled by Wilson et al. (1984). They state that V1507 Cyg is ’possibly related to W Ser stars, possibly not. Strange case.’ The W Ser stars were first recognized as a group by Plavec & Koch (1978), who identified six CBSs that have unusually high levels of UV emission. This emission, as well as other observational properties of W Ser systems, is thought to be the result of large scale mass transfer from the originally more massive star to a disk around the companion.
The binary nature of V1507 Cyg was first discussed by Merrill (1949), who examined spectra that span a multi-decade time line to show that it is a single line spectroscopic binary at visible wavelengths with a moderately eccentric orbit. Merrill (1949) concluded that the spectrum contains contributions from stellar and nonstellar sources. Signs of activity within the system were also identified. For example, lines of Ca were found to have strengths and velocities that vary with time in a complex manner.
Interest in V1507 Cyg was piqued when Trimble & Thorne (1969) suggested that it might host a collapsed object based on the large mass function found by Merrill (1949). An appealing aspect of this suggestion is that a collapsed object could explain the eccentric orbit of the system, as the supernova that would have produced it could alter the orbits of the component stars (e.g. Martin et al., 2009). Motivated by the potential of finding a collapsed object, Hutchings & Laskarides (1972) and Hutchings & Redman (1973) examined the V1507 Cyg spectrum, and found signs of activity in the system. The Balmer lines were found to have a P Cygni profile, indicating an outward flow of material. Possible variability in the properties of H on time scales of minutes (Hutchings & Redman, 1973) was also detected, suggesting that there are major changes in the intrasystem environment over modest spatial scales. Hutchings & Redman (1973) conclude that the unseen companion is likely not a collapsed object given the absence of X-ray emission.
Hill et al. (1976) and Pavlovski et al. (1979) find that the light curve of V1507 Cyg follows a wave-like shape with no evidence of eclipses, indicating an orbital inclination that is less than . The light curve shape is stable on the time scale of many years, although there is a cycle-to-cycle dispersion in the measurements. Later in this paper it is argued that the light curve is dominated by the intrinsic variability of the brighter star in the system.
Berdyugin & Tarasov (1998) discuss polarimetric observations of V1507 Cyg. An orbital inclination of degrees was found after de-coupling the interstellar and system contributions. This orientation is consistent with the absence of eclipses and the lack of complex large-scale photometric variations if light from accretion activity is largely restricted to the orbital plane. Berdyugin & Tarasov (1998) also note that a collapsed object is not required to explain the system properties.
Davidge (2023) used a sample of stars selected from the GAIA DR3 (GAIA Collaboration, 2022) to search for signatures of a fossil cluster or moving group that might be associated with V1507 Cyg. The parallax of V1507 Cyg indicates that it does not belong to the more distant young clusters and star-forming regions that are seen close to it on the sky. Still, there are hints that it might be associated with a diffuse cluster, in which it would be an outlier both in terms of physical location and proper motions. Based on the brightness of possible companions selected using a number of criteria, Davidge assigned a lower limit to the initial mass for the donor star of M⊙, and an approximate system age of no more than 1 Gyr. A faint extended circumsystem envelope at mid-infrared (MIR) wavelengths was also found, as might be expected if there has been non-conservative mass transfer (Deschamps et al., 2015).
There are numerous outstanding questions regarding the nature of V1507 Cyg and its relation to other CBSs. For example, is there evidence for mass flow within the system? If so, how does the mass flow vary throughout the orbital cycle? If there has been recent mass transfer then there may be evidence for an accretion disk/envelope around the gaining star, while an eccentric orbit should cause any mass flow to be episodic. A more basic question is ’What are the masses of the component stars’? To date, V1507 Cyg has been examined in the context of a single line spectroscopic binary. If the motion of the companion can be traced then the masses of both stars can be estimated, thereby providing insights into the nature of the system. Finally, what is the origin of the eccentric orbit? An eccentric orbit is surprising for a CBS given that tidal effects are expected to rapidly circularize the orbit (Zahn, 1977; Moreno et al., 2010), although there may be exceptions (Sepinsky et al., 2009, e.g.).
In the current paper we discuss spectra of V1507 Cyg at red wavelengths that were recorded over multiple orbital cycles during a single observing season. Absorption features in the spectrum of the brighter star are identified, as are features from an envelope that surrounds the companion. The properties of the brighter star are assessed to determine if it has been subjected to large scale mass loss. In addition, radial velocity measurements of the accretion disk are used as a proxy to track the orbital motion of the companion star, thereby providing information about the masses of both components. The morphology of H emission is also examined, and at least two distinct components are identified. Finally, maps from the Canadian Galactic Plane Survey (CGPS Taylor et al., 2003) are used to explore the interstellar medium (ISM) around V1507 Cyg to search for possible additional clues into the past history of the system.
2 OBSERVATIONS
Spectra were recorded with the DAO 1.2 meter Petrie telescope and the McKellar spectrograph (Monin et al., 2014) over the course of 36 nights in 2022. The spectrograph was configured with the 32 inch camera, IS32R image slicer, the 1200H grating, and the pixel SITE–4 CCD. The observations were recorded with the telescope operating in robotic mode, and accounted for only a modest portion of the available time on any given night. The central wavelength of the spectra varied by over the course of the observations to accommodate other programs, and all of the V1507 Cyg spectra sample the 6300Å to 6800Å wavelength interval. In addition to H, this wavelength region contains atomic transitions of metals (mostly Si and Fe) and He that produce lines in the spectra of moderately early-type stars, accretion disks, and circumstellar/system shells. The wavelength resolution is .
A complete nightly observing sequence consisted of three 300 sec exposures, and these were followed by an observation of a ThAr arc. Three 30 sec exposures of Vega were also recorded either before or after V1507 Cyg to monitor telluric absorption and sky transparency. Cloud cover was also tracked with an on-sky camera, and an inspection of the final spectra indicate that thick clouds were present during only a handful of nights.
The dates on which spectra were recorded and the corresponding orbital phases are listed in Table 1, where the latter were calculated using the ephemeris generated by Hutchings & Redman (1973). Later in the paper it is demonstrated that this ephemeris still applies at the current epoch – there is no evidence of a period change over the many decades that this system has now been observed. Nights on which clouds have a noticeable impact on the final S/N ratio of the processed spectra are indicated with an asterisk in Table 1.
| HJDaaAsterisks denote nights with poor transparency. | OrbitalbbCalculated with the Hutchings & Redman (1973) ephemeris. | HJDaaAsterisks denote nights with poor transparency. | OrbitalbbCalculated with the Hutchings & Redman (1973) ephemeris. |
|---|---|---|---|
| – 2400000 | Phase | –2400000 | Phase |
| 59684.381 | 0.111 | 59786.421 | 0.759 |
| 59686.364 | 0.182 | 59818.174 | 0.894 |
| 59695.414 | 0.505 | 59820.334 | 0.971 |
| 59696.348 | 0.539 | 59821.310 | 0.006 |
| 59698.381 | 0.611 | 59822.166 | 0.037 |
| 59708.430 | 0.971 | 59824.272 | 0.105 |
| 59709.366 | 0.004 | 59825.280* | 0.141 |
| 59737.423 | 0.007 | 59827.256 | 0.219 |
| 59751.381 | 0.506 | 59828.155 | 0.251 |
| 59753.331* | 0.576 | 59829.185 | 0.288 |
| 59758.344 | 0.755 | 59847.340 | 0.937 |
| 59761.339 | 0.862 | 59848.252 | 0.972 |
| 59762.326 | 0.897 | 59849.172 | 0.003 |
| 59780.211 | 0.537 | 59850.117* | 0.036 |
| 59781.211 | 0.573 | 59852.131 | 0.108 |
| 59783.462* | 0.645 | 59853.109 | 0.143 |
| 59784.207 | 0.680 | 59861.979 | 0.429 |
| 59785.434 | 0.724 | 59862.097 | 0.465 |
Artifacts in the spectra introduced by the instrumentation and the sky were removed using standard procedures. These steps include (1) summing the three spectra recorded on each night, (2) the removal of the floating bias and the fixed detector bias pattern, (3) the removal of cosmic rays, (4) flat-fielding, (5) correcting for scattered light, and (6) summing the signal within the full width at half maximum (FWHM) of the stellar profile as defined by the image slicer. The extracted spectra were then wavelength calibrated and normalized to a pseudo-continuum.
3 THE SPECTRUM OF THE BRIGHTER STAR
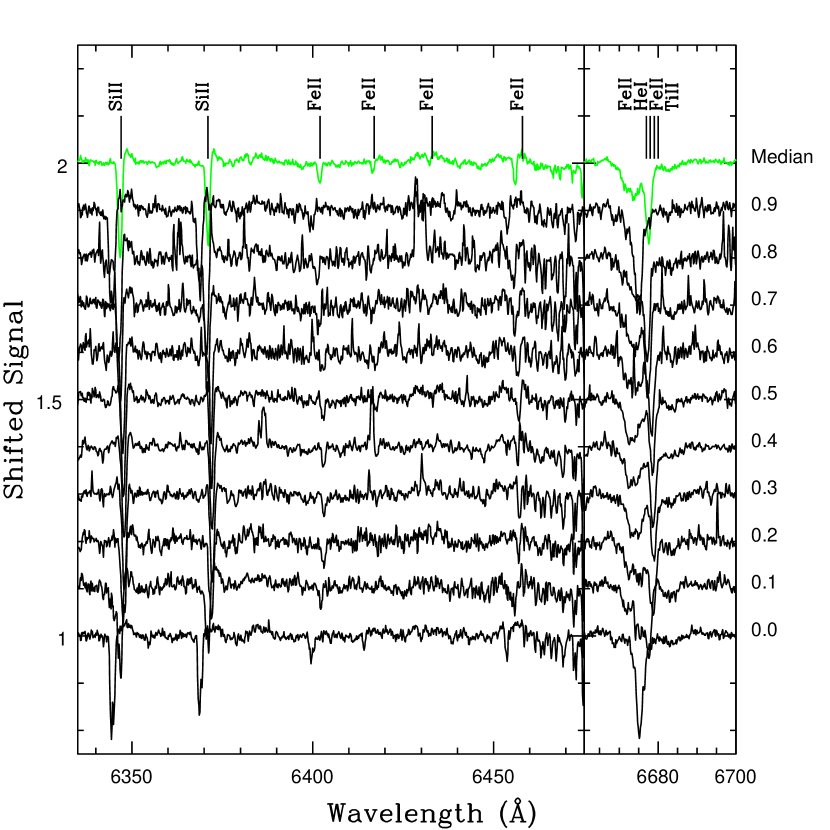
An example of a processed spectrum that has a signal to noise ratio that is typical of the dataset in general is shown in Figure 1. The dominant feature is H emission, which masks any H absorption that might originate in the spectrum of either star. H emission can originate from a number of sources (e.g. Broz et al., 2021), and a discussion of this feature is deferred to later in the paper. In this section we focus on the narrow absorption lines of SiII and HeI that are evident in Figure 1.

Wavelength intervals that contain SiII, FeII, and HeI lines are shown in Figure 2. The spectra in this figure are the means of nightly spectra that were binned in phase intervals that cover 10% of each orbital cycle. This binning is a compromise between the gain in signal-to-noise ratio that results from combining individual spectra, and the blurring of line characteristics that occurs with orbital phase. The velocity differential is greatest near phase 0.0, where the dispersion is km/sec, or Å at these wavelengths.
The wavelengths of the absorption lines vary with orbital phase, with the centroids of the SiII and HeI lines moving by almost 4Å (i.e. km/sec) throughout an orbital cycle. This is in agreement with the range in radial velocities measured at shorter wavelengths by Merrill (1949). SiII 6347 is a resonance transition, and so is more susceptible to ISM absorption than SiII 6171. The properties of SiII 6347 vary in lockstep with those of SiII 6171, indicating that the dominant contributor to SiII 6347 is stellar in origin.
The strengths and shapes of the SiII and HeI lines vary with orbital phase, and in both cases they have a skewed shape near phase 0.0 (i.e. at periastron). The sub-structure in the line cores near phase 0.0 is reminiscent of model line profiles generated by Moreno et al. (2005) for stars in binary systems with eccentric orbits. The structure in the model line profiles is due to flows in the outer regions of the stars that result from the variable tidal effects that are the natural consequence of an eccentric orbit. Tidal effects are expected to be greatest during and after periastron (e.g. Moreno et al., 2010), and so signatures of interactions might linger after phase 0.0.
As a first step toward examining the general characteristics of the brighter star, the spectra in Figure 2 were shifted to the rest frame and then median-combined to form a preliminary template of the brighter star spectrum, and the result is shown in green in Figure 2. Phase-related variations in narrow lines that do not originate in the brighter star will have wavelength variations that are out of sync with the brighter star spectrum, and so might be suppressed by taking the median. Unfortunately, while broad features with motions that differ from those of the brighter star may be blurred when constructing such a template, they may not be entirely suppressed. Indeed, an obvious residual feature in the template spectrum is the broad depression blueward of the HeI 6678 line. The origin of this feature is discussed in the next section.
Given the difficulties in suppressing features that do not belong to the brighter star, a proxy for its spectrum was found by comparing the template spectrum in Figure 2 with the spectra of a sample of bright stars with well-established spectral types. The prominent H emission in the V1507 Cyg spectrum makes this feature of little use for spectral classification. Still, the wavelength region examined here contains other features that are sensitive probes of temperature and surface gravity.
A preliminary comparison with stars in the MILES compilation (Sanchez-Blazquez et al., 2006) found that the relative strengths of the SiII and HeI lines are consistent with a mid- to late-B spectral type. The narrow widths of these lines is suggestive of formation in a slowly rotating, low gravity environment, such as that found in the atmosphere of a giant or supergiant. This motivated us to examine in greater detail spectra of late-type B giants and supergiants in the 6300 – 6800Å region in the MILES archive (Sanchez-Blazquez et al., 2006), to quantify the sensitivity of these features to temperature and surface gravity. We focus on the SiII lines at 6347 and 6371Å , and HeI 6678, as these are the strongest absorption lines in our spectra.
The ratio of the equivalent widths of SiII 6347 and SiII 6371, hereafter 6347/6371, is sensitive to surface gravity, in the sense that it is lower in supergiants than in giants of the same spectral type. The ratio of the sum of the equivalent widths of the two SiII lines to the equivalent width of HeI 6678, hereafter SiII/HeI, is sensitive to both effective temperature and surface gravity. Among late B stars (i.e. B5 and later) SiII/HeI increases as effective temperature drops, and is a factor of lower in supergiants than in giants of the same spectral class. In addition, among these supergiants HeI 6678 is consistently deeper than either of the SiII lines, whereas the opposite is true among giants of the same spectral class. The SiII and HeI lines thus provide leverage for examining the properties of the brighter star.
Assuming that the brighter star contributes 50 – 60% of the total light from the system at these wavelengths then 6347/6371 = 1.2, which is clearly consistent with a supergiant luminosity type. While measuring the equivalent width of HeI 6678 in the bright star template is complicated by the presence of the broad trough blueward of this line, experimentation with various stellar spectra indicate that it must have an equivalent width that is comparable to that of the SiII lines, which in turn is consistent with the supergiant classification from 6347/6371. We conclude based on the relative depths of the SiII lines and the depth of HeI6678 with respect to the Si II lines that the brighter star has a supergiant luminosity type.
The DAO 1.2 meter archive hosted by the Canadian Astronomical Data Centre 111https://www.cadc-ccda.hia-iha.nrc-cnrc.gc.ca/en/dao/ was searched for B giants and supergiants that had been observed with the same observational set-up as described in Section 2. Preference was given to stars that are spectroscopic standards. The spectra recovered from the archive were reduced using the same procedures as those applied to the V1507 Cyg spectra. The use of stars observed with the same instrumental set-up and processed with the same pipeline reduces possible systematic errors that may affect properties such as line width. While software is available that parses the spectra of stars in binary systems, the algorithms usually assume that the light is stellar in origin. In the particular case of V1507 Cyg, we prefer using spectra of standard stars as this should more cleanly isolate the spectrum of the bright star given that much of the system light is non-stellar (see next section).
UMa (B3V), Aur (B5V), Aur (B5I) and Ori (B8 I) were identified as comparison objects. These stars span a range of spectral types and line characteristics. With the exception of Aur these stars are MK spectroscopic standards (Morgan & Keenan, 1973).
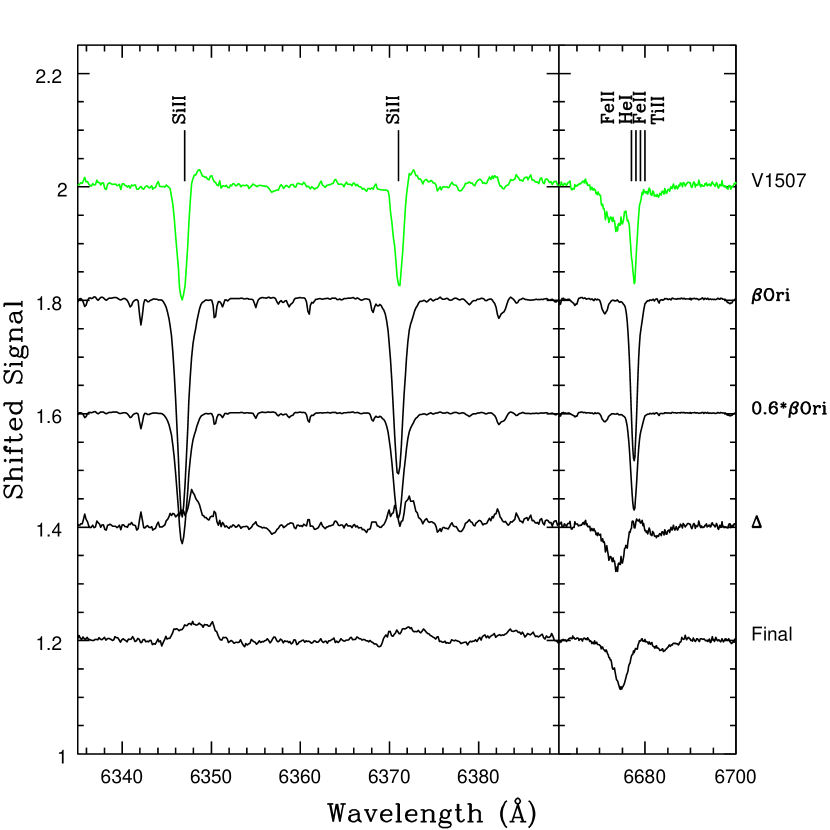
The V1507 Cyg spectrum is a composite of different components, only one of which is the brighter star, and experimentation found that a scaling factor of 0.6 was able to suppress the absorption features from the brighter star in the differenced spectrum. This scaling factor was found by matching the widths and depths of SiII6347 and 6371 as well as HeI 6678 in the spectrum of Ori (Rigel) with those in the spectrum of the brighter star. The uncertainty in the amount of light contributed by the brighter star at red wavelengths is estimated to be %.
The Ori spectrum is compared with that of the bright star template in the wavelength regions that sample the SiII and HeI 6678 lines in Figure 3. Also shown is the Ori spectrum scaled by a factor of 0.6 as well as the result of subtracting the scaled spectrum from the template spectrum. The relative depths and widths of the SiII and HeI features are not well matched when the spectra of the other reference stars are used.
While there is little ambiguity about the luminosity type of the brighter star, there is some uncertainty associated with the spectral type, as determined from SiII/HeI. Based on comparisons (1) with the template stars downloaded from the DAO archive and (2) with stars in the MILES compilation after smoothing the V1507 Cyg spectra to match the 2.5Å wavelength resolution of those observations, we estimate an uncertainty of sub-types in the spectral class. Therefore, the best estimate for the spectral type of the brighter star is B8 I, with a possible range B7.5 I – B8.5 I.
To the extent that the Ori spectrum matches the spectrum of the brighter star then the radius of that star can be estimated with respect to Rigel. Assuming that the brighter star and Rigel have the same effective temperature then . Przybilla et al. (2006) find that M for Rigel. The GAIA DR3 parallax for V1507 Cyg is mas, and if the brighter star contributes of the light to the system, for which (Pavlovski et al., 1979), then . If Rigel has a radius of 74 R⊙ with an estimated uncertainty of (Baines et al., 2018), then the bright star in V1507 Cyg has an effective radius of R⊙. Comparisons with stellar structure models and radii measurements from binary systems (e.g. Torres et al., 2010) indicates that the radius of the brighter star thus exceeds the ZAMS radius of a 2 – 3 M⊙ star (i.e. a main sequence star with a late B spectral type) by . The radius of the brighter star is then consistent with it being an evolved object.
4 THE SPECTRUM OF CIRCUMSTELLAR MATERIAL AROUND THE COMPANION STAR
The spectra contain features that do not belong to the brighter star. The most obvious is the broad absorption trough blueward of HeI 6678 in Figure 2 that is seen at many orbital phases. This feature moves with wavelength in a manner that is counter to that defined by the sharp HeI line in the spectrum of the brighter star, suggesting that the trough is associated with the companion. What appear to be parts of SiII emission lines are also seen in the shoulders of the deep SiII absorption lines in Figure 2.
A clear picture of the global properties of the HeI and SiII emission features can be gleaned from the bottom spectrum in Figure 3, which is the result of combining all of the spectra after subtracting light from the brighter star. HeI appears to define a P Cygni profile with a weak emission component. Later in this section it is shown that the strength of the emission varies with orbital phase, such that it is more pronounced at some points in the orbit. That the mean wavelength of the HeI trough is offset from the rest frame wavelength indicates that it forms in an environment that is approaching the observer. The offset between the bottom of the trough and the emission peak in the HeI profile is Å , which corresponds to km/sec along the line of sight, while a gaussian fit to the trough yields a FWHM width , indicating a velocity dispersion of km/sec.
There is also an absorption component in the HeI profile that is redward of the emission. The presence of such a feature suggests that there is material that is falling onto the envelope. That the redward trough is not seen at all phases suggests that the infalling material is not uniformly distributed, but may be in a stream. Hutchings & Redman (1973) also find evidence for infall in the profiles of some Balmer lines.
The Si II emission lines in Figure 3 have a flat profile. While not shown in this figure, weak emission from FeII is also present, and these lines have profiles that are similar to those of SiII. The measured width of the SiII emission lines is , which is significantly broader than the spectral resolution and yields a characteristic rotational velocity vsini km/sec.
The behaviour of the HeI and the SiII emission lines with orbital phase that remain after light from the brighter star is removed is examined in Figure 4. The phase-binned spectra shown in this figure were constructed by combining spectra from individual nights that had the contribution from the brighter star subtracted out. Offsets due to velocity variations within each phase bin, which can be large near phase 0.0, were corrected by aligning the deepest part of the HeI features in the residual spectra.

There is evidence that HeI 6678 originates in a medium that is not uniformly distributed around the companion, in the sense that the width and depth of the HeI line varies with orbital phase. The feature is narrowest and shallowest at phases 0.9 and 0.0 (i.e. near periastron). Weak emission is present redward of the trough at most – but not all – phases, and the width of the emission also varies with orbital phase. That the HeI emission component is not seen at all phases suggests that the emitting region is not symmetrically distributed around the companion star. If this is the case then variations would also be expected in the depth of the HeI trough, and these are seen.
SiII emission is detected at most phases in Figure 4, although these features are noisy when considered on their own. The central absorption in the SiII lines that is seen at some phases is due to imperfect matching with the Rigel spectrum. This is not unexpected in a CBS with an eccentric orbit where variations in the tidal field may affect the outer layers of a star. There is also evidence of absorption blueward of the SiII 6347 lines at phases 0.0 and 0.1, suggesting an outward mass flow.
There are indications that the flow of material near the companion may vary from orbit-to-orbit. In particular, the character of features associated with the circumstellar environment change with time, such that orbit-to-orbit variations in the properties of HeI 6678 occur near the same orbital phase. The detection of these variations was facilitated by the near-monthly cadence of the 1.2 meter telescope robotic observing schedule and the orbital period of the system.
There are three phase intervals with widths less than 1% of the total orbital phase in which spectra were observed on three or more nights. All three sets of spectra sample the orbit near periastron, which is the point in the orbit where elevated levels of activity might be anticipated. Any changes in the character of the HeI feature with time in such narrow phase bins will be due to orbit-to-orbit differences in the absorbing/emitting medium.
Spectra of HeI 6678 in three narrow phase intervals where data were recorded on three or more nights are shown in Figure 5. The spectra in each panel are ordered according to the date of observation, with spectra recorded at the earliest date at the bottom. Orbital phases are shown in brackets.

There is clear evidence for a cycle-to-cycle variation in the depth of the HeI trough among the spectra in the left hand panel, which samples phases near 0.97, in the sense that the trough became progressively shallower from May to September 2022. A similar, but not identical trend, is seen among the spectra near phase 0.005. In this case the depth of HeI in the June and August spectra is weaker than in May, in agreement with what is seen near phase 0.97. However, the HeI trough is deeper in the 0927 spectrum than in the 0830 spectrum. This is noteworthy as the depth of the HeI trough in the spectrum recorded on the previous night (0926, phase 0.972) is similar to that recorded on 0829. This suggests that significant changes in the behaviour of the HeI trough can occur over the time span of a day.
Some of the spectra in the middle panel of Figure 5 have sub-structure in the trough profile, in the sense that there are two components present near the center of the trough. The 0927 spectrum (phase = 0.003) has the highest S/N ratio of the four spectra in the middle panel, with an estimated noise of in the normalized flux. There is a spike near the center of the HeI trough in the 0927 spectrum that has an amplitude of , and so is well above the noise level. A central spike with a similar wavelength and amplitude is also seen in the 0830 spectrum (phase = 0.006), although the noise in that spectrum is slightly higher than in the 0927 spectrum. Hence, structure in the He trough is seen near periastron in at least some of the spectra.
The sub-structure in the central regions of the He trough is reminiscent of behaviour seen in the model spectra of stars on eccentric orbits at orbital phases near periastron that are discussed by Moreno et al. (2005). The models attribute this sub-structure to flows induced by the tidal field as the stars move in eccentric orbits. To the extent that these models apply to V1507 Cyg then the structure in the He trough suggests that the envelope that produces this feature might contain such tidally-driven flows. It should be recalled that similar sub-structure is seen in the centers of the SiII lines and HeI lines in the spectrum of the brighter star at similar phases (e.g. Figure 2). The difference between the centroids in the HeI lines in the 0927 and 0830 spectra in the middle panel of Figure 5 is Å , which corresponds to a velocity difference of 70 km/sec along the line of sight.
The HeI trough is much deeper in the three spectra near phase 0.105 than in the other two phase intervals. In the context of an asymmetric envelope geometry this is consistent with a thicker part of the envelope being seen along the line of sight at this phase. The HeI trough is deepest in the 0902 spectrum. HeI emission is also present in this phase interval, and the strength of the emission appears not to change with time. The radial velocity curve of the primary star is steep near periastron, and the motion of the deepest part of the HeI trough from phase 0.97 to 0.11 is qualitatively consistent with motion in the same direction as that of the brighter star, as expected if motions in the envelope are coupled with the orbit of the brighter star.
5 RADIAL VELOCITIES AND MASS ESTIMATES
5.1 Radial Velocities of the Brighter Star
Radial velocities of the brighter star were measured by cross-correlating the system spectra with the spectrum of Rigel in the wavelength interval 6335 - 6465Å , and the results are shown as black crosses in Figure 6. The left hand panel shows velocities measured as a function of time, while the right hand panel shows a phased radial velocity curve constructed using the Hutchings & Redman (1973) ephemeris. Radial velocity measurements that are the average of the HeI and metal values in Table 1 of Merrill (1949), phased using the Hutchings & Redman (1973) ephemeris, are also plotted in the right hand panel.

The measurements made by Merrill track those obtained from the DAO spectra to within 1 - 2% of an orbital cycle. This indicates that the ephemeris has not changed greatly: the orbital characteristics of the brighter star have remained more-or-less stable over a time span in excess of roughly one century. A dispersion of 1 - 2% of an orbital cycle over this timeline indicates that the period has remained stable to within .
5.2 Radial Velocities of the Envelope
In Section 4 it was noted that the features in the spectra that remain after removing the light from the bright star move with wavelength in a manner that is opposite to that of the brighter star, suggesting an association with the companion. To the extent that these features track the motion of the companion then they allow the masses of both objects in the system to be determined. Two wavelength regions in the envelope spectra were examined to measure radial velocities. One was in the wavelength interval containing the SiII emission lines, while the other covered HeI in the wavelength interval 6650 - 6700Å . Velocities were obtained by cross-correlating the residual spectra in these wavelength intervals with the median template shown in Figure 3.
The velocities measured from the residual spectra are plotted in Figure 6. The mean difference between the HeI and SiII emission line velocities is 4 km/sec, with a standard deviation of km/sec, thereby suggesting that they track a common source. The dispersion between the two sets of measurements is greatest near periastron.
That the velocities obtained from the envelope spectra do not define a tight velocity curve in the right hand panel of Figure 6 is not due to poor data quality. In the previous Section it was noted that there are cycle-to-cycle variations in the character of HeI near periastron, and this is where the difference between the HeI and SiII velocities is largest. Individual HeI envelope spectra near phase 0.0, where there is a large dispersion in HeI-based velocities, are shown in Figure 5. The two highest HeI envelope velocities were recorded on the nights of 0830 and 0831, and the spectra of those nights do not have markedly poor signal-to-noise ratios. Still, the 0830 spectrum, shown in the middle panel of Figure 5, has the shallowest HeI trough in this phase interval. This suggests that the velocities measured from the envelope spectra are likely susceptible to activity associated with this point in the orbit. Spectra that span a number of orbital cycles are then desirable to average out the affect of this activity. This is a source of uncertainty when calculating masses for this system.
5.3 Mass Estimates
Given (1) the scatter in the velocities obtained from the envelope features and (2) that the velocity curve for the brighter star is very well-defined, so that the orbital elements deduced from those velocities are well-determined, then we have opted not to obtain an independent orbital solution from the envelope velocities. Instead, it is assumed that (1) the eccentricity of the companion orbit is the same as that of the brighter star, and (2) the arguments of periastron () for the two stars differ by . This simplifies the task of estimating a mass ratio.
While the velocity measurements made from the envelope spectra may not define a clear-cut radial velocity curve, the majority of them still contain information about the orbit of the companion. Evidence to support this claim comes from a comparison of the velocities of the bright star and those obtained from the envelope spectrum. The relationship between the velocities of the bright star and those obtained from the envelope is examined in Figure 7, where the velocity measurements obtained from the SiII absorption lines in the spectrum of the bright star are compared with velocities obtained from the HeI profile (top panel) and the SiII emission lines (middle panel). The lower panel compares the mean of the HeI and SiII emission velocities with those of the bright star.
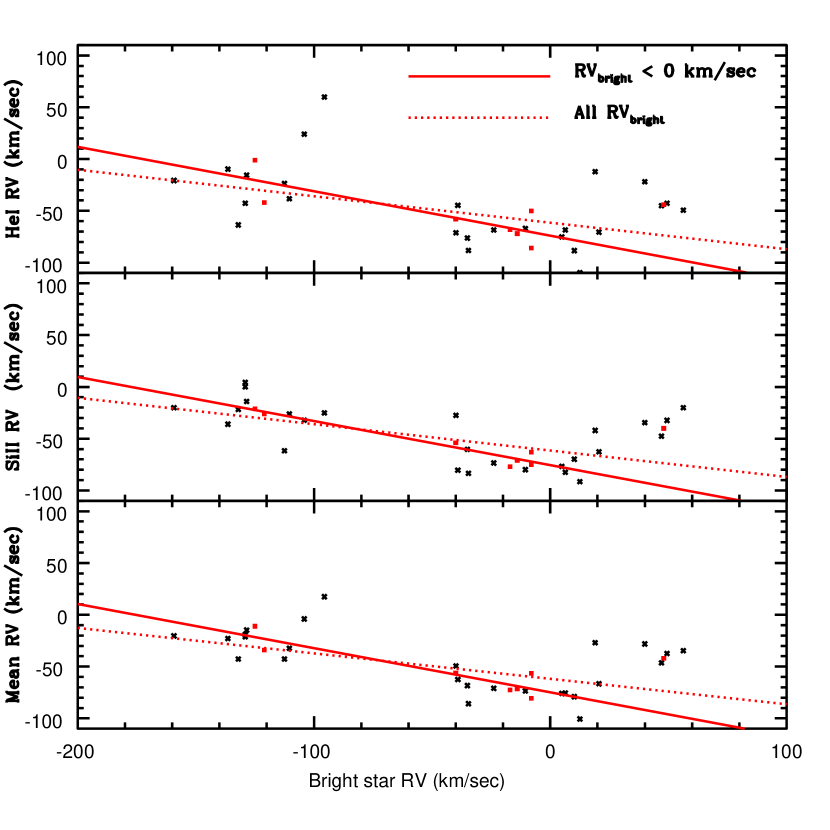
If the velocities obtained from the envelope spectra track the motion of the companion then, given the assumptions about the orbit of the companion discussed above, the velocities of the bright star and those measured from the HeI and Si II emission lines should be anti-correlated. The slope of the relation between the two then provides a statistical means of determining the relative radial velocity amplitudes of the bright star and its companion. In fact, there is a clear tendency for the velocities of the brighter star and those made from the SiII emission and the HeI profile to be anti-correlated over much of the velocity range covered by the brighter star. This is to be expected if the velocities measured from the HeI profile and SiII emission track the motion of the companion and its envelope over much of the orbital cycle. However, there is considerable scatter and degradation of the relation from linearity when km/sec, which corresponds to phases 0.1 – 0.4.
What is the cause of the outlier points in Figure 7 at post-periastron phases? The radial velocity curve of the brighter star at these phases is not distorted, indicating that the cause of the outlying points is associated with the envelope around the companion. The HeI 6678 profile indicates that the envelope is extended and contains an expanding component, and so is susceptible to tidal distortions that are amplified near periastron. Moreover, the variations in the HeI profile with phase that are seen in Figure 4 indicate that the envelope is not uniformly distributed around the companion. We thus suspect that the outlier points in the envelope velocities in Figure 7 are the result of flows within the envelope that are induced by the variable tidal effects that result from the eccentric orbit and drive asymmetries in the envelope. These flows cause the velocities measured from the envelope spectrum immediately after periastron to depart from those that track the orbital trajectory of the companion.
Given the dispersion in the envelope velocities, mean velocities were calculated in 10% wide phase intervals, and these are shown as the solid red squares in Figure 7. It can be seen that taking the mean suppresses some of the scatter in Figure 7. Least squares fits were then made to the binned velocities, and the results are shown with the dashed and solid red lines in that figure. A least squares fit is appropriate given that the uncertainties in the velocities of the brighter star are much smaller than those of the other source, as is evident from the modest scatter among the velocities obtained from the bright star spectrum in Figure 6.
If the SiII emission and HeI features track the motion of the companion star then the slope of the relationships in Figure 7 is the ratio of the velocities of the two stars. In fact, the slopes defined by the HeI and SiII emission measurements are identical within their estimated uncertainties. However, given the smaller scatter, the SiII emission line measurements are adopted here to estimate K2, and these yield (all phase-binned points), and (not including the mean for phase 0.3, which corresponds to km/sec). We favor the latter slope given that it has a much smaller uncertainty, and so provides a better match to most of the envelope velocities. In either case the ratio of the component velocities indicates that the companion is more massive than the brighter star, and so mass transfer has progressed to the point where the mass ratio has been reversed – what was once the more massive star is now the less massive star.
The well-defined radial velocity curve for the brighter star indicates that K km/sec (Hutchings & Redman, 1973). The slope of the relationship in the middle panel of Figure 7 indicates that K, so that K km/sec. With K1 and K2 known then masses can be estimated. If and the period is 27.9705 days (Hutchings & Redman, 1973), then M1sin3i = 2.44M⊙ and M2sin3i = 5.33M⊙.
An estimate of the orbital inclination is required to compute final masses, and we consider two possibilities. First, Berdyugin & Tarasov (1998) estimate that degrees, such that MM⊙ and MM⊙. We consider this to be the best estimate of the system masses. The total system mass at the present day is then in excess of 20M⊙, which far exceeds the upper mass limit estimated by Davidge (2023) based on the properties of stars thought to be in a moving group with V1507 Cyg.
The second possibility assumes an upper limit for the inclination, based on the absence of eclipses in the light curve. The use of an upper limit for the inclination results in a lower limit for the masses. Adopting an upper limit of for the inclination then we find that MM⊙, and MM⊙. We further note that if the slope of the dashed line in the middle panel of Figure 7 is adopted then K km/sec. If this value of K2 is adopted then the mass of the brighter star drops by , while that of the companion drops by .
The mass estimates for the brighter star presented above suggest that it is significantly less massive than Ori, which Przybilla et al. (2006) estimate to have a mass M⊙ from comparisons with evolutionary tracks. The relative masses of Ori and the brighter star are consistent with the latter having been stripped by mass transfer. As for the companion star, an unobscured main sequence star with the mass estimated above would have M –3 to –4, and so will be intrinsically brighter than the B8 I star. However, such a star might not be seen at visible wavelengths if it is masked by an optically thick accretion disk or envelope.
6 H
There are a number of potential sources of H emission in CBSs, including an accretion disk, hot spots, jets, and circumstellar/system envelopes. Emission from these (and other) sources may combine to produce complex emission line structures. What might appear initially as a single broad H emission feature at low or moderate wavelength resolution may actually be a blend of distinct features from multiple components (e.g. Figure 16 of Broz et al., 2021).
H profiles extracted from the phase-binned spectra are shown in Figure 8. These spectra have had the contribution from the brighter star, which is the H line in the Ori spectrum scaled by a factor of 0.6, subtracted out. The scaled Ori line is small when compared with the emission line in the system spectrum, and so its removal has only a minor effect on the overall properties of the H emission from the system.
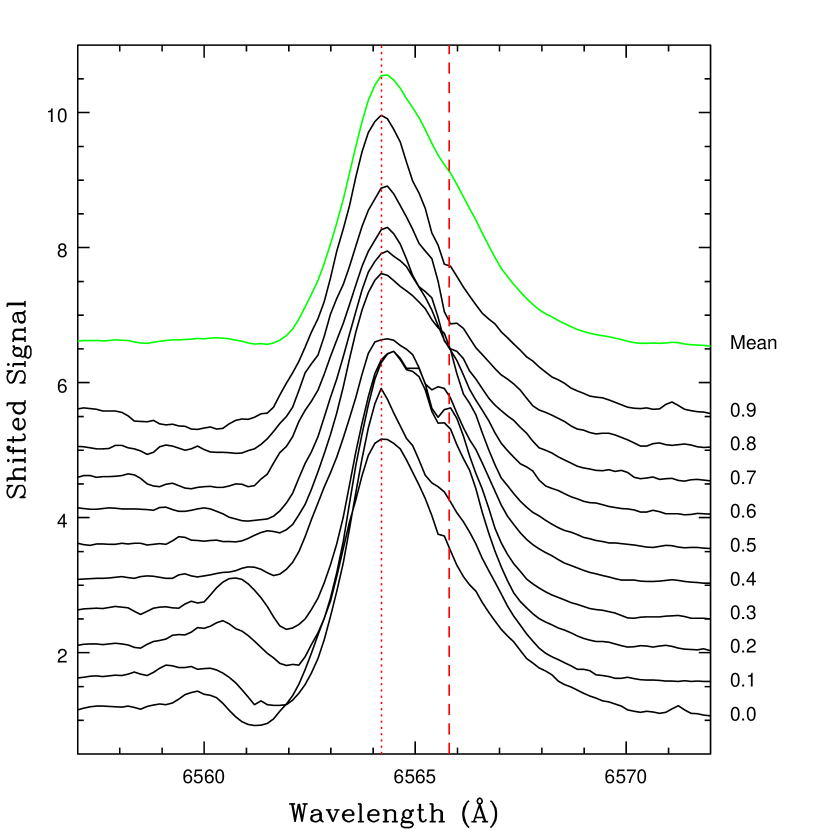
The width of the H profile changes with orbital phase. At phases 0.4 and 0.5 the FWHM of the profile is , while at other phases it is . The broadening of the profile at intermediate phases is due to a secondary peak, which we will refer to as the ’red bump’. This feature is Å redward of the main peak and is most pronounced near phases 0.3 – 0.4.
There is a trough blueward of the dominant emission feature at phases 0.0 – 0.4 that is likely due to blueshifted H absorption. Thus, it likely forms in an expanding envelope. This trough propogates to progressively longer wavelengths from phases 0.0 to 0.4, and disappears from phase 0.5 onwards. If the medium in which the trough formed was symmetrically distributed and moving with the brighter star then the trough should reappear at phases 0.8 and 0.9, which is not the case. Hence, we suspect that this feature is associated with an ouflow of material that is to one side of the brighter star.
Additional insights into the behaviour of H can be gleaned by studying departures from a reference profile. To this end, a mean H profile was constructed from the spectra in Figure 8, and the result is shown as the green line at the top of that figure. The results of subtracting this mean profile from each of the phase-binned spectra are shown in Figure 9, and the residuals show clear trends with phase.
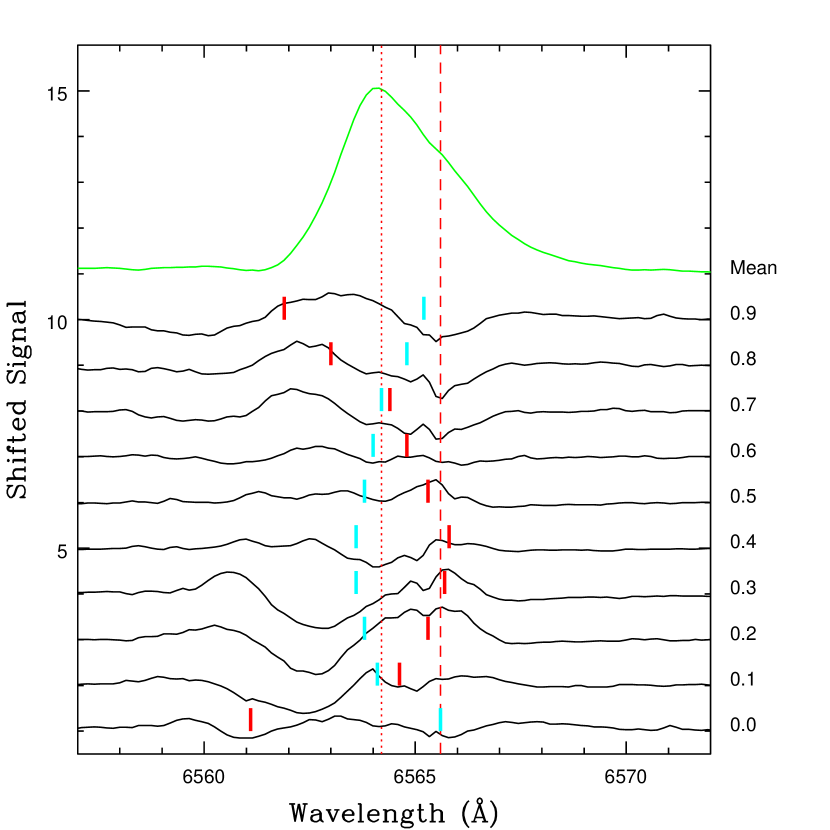
A systematic propogation of structure in the residuals with orbital phase can be seen in Figure 9. There is a peak in the residuals near 6563Å at phase 0.9, while at phase 0.2 the peak is centered near 6565Å. The expected location of H with wavelength based on the radial velocity curve of the brighter star is marked for each residual curve, and it can be seen that the peak in the residuals more-or-less propogates with phase in a manner that is consistent with the motion of the brighter star. While the agreement between the peaks in the residual curves and the expected location of H is not perfect, the results in Figure 9 suggests that the bulk of the H emission is associated with the brighter star and its environs.
There are orbit-to-orbit changes in the H profile over time scales of a few weeks. Evidence for this is presented in Figure 10, where differences in H characteristics within the narrow phase intervals that were considered in Figure 5 are examined. It should be recalled that these spectra examine the system shortly before, during, and after periastron.

It is apparent from the left hand and central panels that the red bump becomes pronounced after June 2022. This is also seen in the right hand panel, where the red bump is more pronounced in the September spectra when compared with the April spectrum. The asymmetric shape of the H profile in the spectra recorded from April to June suggest that the red bump is also present at that time, but is blended with the main H emission feature.
There are also noticeable changes in the overall height of H among the spectra in the right hand panel (i.e. a few days after periastron). These changes are in the sense that the relative strength of H emission weakens with time. These changes are accompanied by a change in the depth of the absorption trough.
The impact of periastron on the line emission in April 2022 differs from that in September 2022. This might reflect orbit-to-orbit changes in the envelope around the brighter star. The spectra in the right most panel of Figure 10 sample phases near , and models examined by Moreno et al. (2010) suggest that the impact of periastron passage is most visible following periastron.
Hutchings & Redman (1973) describe variations in the characteristics of H that occur over time scales of 10 minutes. Variations on such a short timescale might be surprising given the consistency in the overall strength of H when averaged over the minute timescales that are covered by our nightly spectra. While typically only three spectra of V1507 Cyg were recorded on any given night for this program, there were nights during which five 300 sec exposures were recorded, and the spectra from those nights were searched for evidence of flickering in the strength of H. No evidence for changes in the characteristics of H were found over the minute time interval covered by these exposures.
7 THE INTERSTELLAR MEDIUM NEAR V1507 CYG
The ISM near V1507 Cyg may provide clues into its recent past. Assuming conservative mass transfer (i.e. the present-day total system mass is the same as the total mass at the time of formation) then the mass measurements made in Section 5 indicate that the initially more massive star formed with a mass M⊙. The system then has an age that is Myr. Given this relatively young age then if V1507 Cyg formed in a cluster or an association with other massive objects then signatures in the surrounding ISM such as a supernova remnant (SNRs) might be present. We have thus searched for evidence for structures in the ISM near V1507 Cyg using the CGPS, which is a survey that mapped a large fraction of the northern Milky-Way 1420 Mhz ( cm) and 408 Mhz ( cm).
Images of the area around V1507 Cyg were downloaded from the CADC website 111https://www.cadc-ccda.hia-iha.nrc-cnrc.gc.ca/en/cgps/, and the results are shown in Figure 11 . The intrinsic angular resolution of the maps is arcmin at 1420 MHz and a few arcmin at 408 MHz. The 1420 MHz image in Figure 11 has been smoothed with a arcmin Gaussian to match the angular resolution of the 408 MHz image.
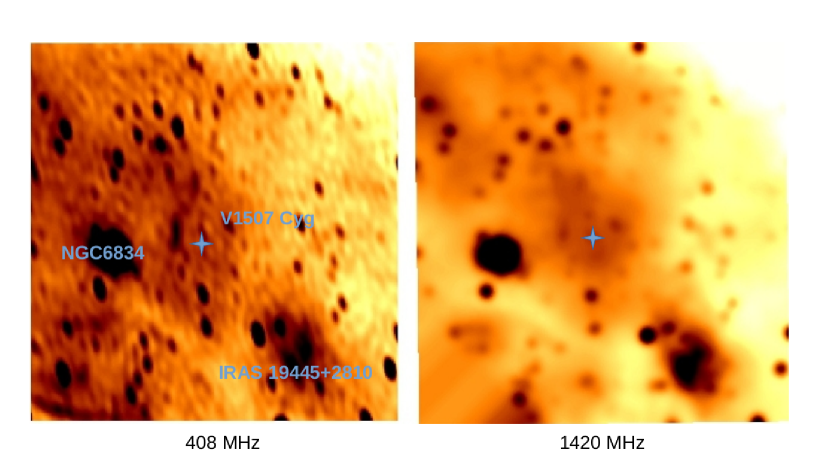
Figure 11 reveals a mix of resolved and unresolved sources on the sky close to V1507 Cyg. A complex distribution of objects at these wavelengths is not unexpected as the line of sight at low Galactic latitudes passes through the disk. Not only is the disk an area that contains a rich population of objects that might form structures in the ISM, but sources that originate over a large range of distances are also sampled. Sources that are physically unrelated may then be superimposed in Figure 11, introducing potential ambiguity in source identification; a source close to a target of interest on the sky may actually be in the foreground or background. Keeping this caveat in mind, we note that V1507 Cyg is at the center of diffuse emission at 408 MHz and 1420 MHz that has a more-or-less circular morphology.
Young stars are located close to V1507 Cyg on the sky, although their parallaxes indicate that these are background objects (Davidge, 2023). Could these be responsible for the emission centered on V1507 Cyg in Figure 11? To answer this question we briefly discuss two young objects that are viewed close to V1507 Cyg.
The 80 Myr old cluster NGC 6834 contains a number of emission line stars (Paunzen et al., 2006), and it is the brightest single source in Figure 11. This cluster is located within 50 arcmin of V1507 Cyg, and is roughly midway between V1507 Cyg and the left hand edge of Figure 11. It is clearly displaced from the HI structure that is centered on V1507 Cyg.
Another bright source is IRAS 19445+2810, which is the diffuse extended collection of objects to the north west of V1507 Cyg. This source does not appear in W1 and W2 images in the WISE survey, leading us to speculate that it is a heavily obscured – possibly massive – young cluster. However, like NGC 6834, IRAS 19445+2810 does not appear to be related to the HI emission centered on V1507 Cyg. Rather, it appears to be surrounded by its own diffuse HI halo.
There are other moderately bright sources that are close to V1507 Cyg in Figure 11. These appear to be point sources at the angular resolution of the maps, and are offset from the center of the emission. In summary, there remains ambiguity in the line-of-sight distances to V1507 Cyg and the emission that surrounds it. Still, that V1507 Cyg is at the center of an emission feature indicates that a more detailed investigation of the ISM around it may prove to be rewarding.
8 DISCUSSION & SUMMARY
Spectra that were recorded over a six month period in 2022 have been used to examine the properties of the CBS V1507 Cyg. Previous studies have considered this system in the context of a single line spectroscopic binary, and the mass function is suggestive of a massive – but faint at visible wavelengths – companion. The new spectra sample 6 complete orbital cycles and have a common wavelength coverage of m with a wavelength resolution . Prominent absorption features that can be attributed to the brighter star are present. While the spectra do not appear to contain features that originate directly in the photosphere of the companion, features that track the motion of this object have been identified, allowing new insights to be gained into the nature of this system.
8.1 System Components: Evidence of An Evolved Binary System
8.1.1 The brightest star
The deepest absorption lines in the DAO spectra are SiII 6347, SiII 6371, and HeI 6678. The SiII 6347 doublet is a resonance transition, and there is no evidence for an interstellar contribution, such as might be expected if there were an optically thick circumsystem envelope. These deep absorption lines track the motion of the brightest star, and the measured velocities are in excellent agreement with those obtained by Merrill (1949), who examined spectra that were recorded over more than two decades. The amplitude of the radial velocity curve defined by the brighter star is larger than the range in velocities measured from the envelope spectrum, indicating that the brighter star is less massive than its companion.
Models predict that the structural properties of the donor star will be affected by tidal interactions, and these can have an impact on features in the spectrum. Moreno et al. (2005) model line profiles in stars with eccentric orbits, and find that flows induced in a star during periastron passage can alter line profiles. The predicted line profiles are similar to those seen in the SiII and HeI lines in the spectrum of the brighter star near periastron.
That the orbital properties of the system have not changed over roughly a century is consistent with a system in which there is not a high rate of mass exchange at the present day. A low rate of mass transfer is consistent with the absence of a thick circumsystem envelope. Such an envelope is expected to form during the rapid phase of mass transfer when the more massive star expands to fill its Roche lobe (e.g. Deschamps et al., 2015).
The properties of the brighter star are consistent with it being in a binary system that has undergone extensive mass transfer. Comparisons with stars that cover a range of spectral types indicate that the relative depths and widths of the SiII and HeI features in the V1507 Cyg spectrum are well matched with those in the spectrum of the B8 I star Ori if that star were to contribute 60% of the V1507 Cyg light near 6500Å . Despite the similarity in spectral type, the brighter star in V1507 Cyg is fainter than expected for a B supergiant, with M as opposed to M for Ori (Przybilla et al., 2006). The radius of the brighter star is also greater than that of a main sequence star with a similar effective temperature, but smaller than that of a supergiant. That the bright star in V1507 Cyg is underluminous and undersized when compared with stars that have evolved in isolation is consistent with it having lost mass as a result of interactions with its companion.
The discrepant nature of the intrinsic luminosity and radius of the brighter star would largely disappear if its properties are compared with those of a B8 giant, rather than supergiant. However, in Section 3 it is shown that a giant luminosity class is not consistent with the relative depths of the SiII and HeI lines. The line depths clearly indicate that these transitions occur in an environment with a surface gravity that is consistent with that of a supergiant.
Given the low rate of mass exchange and the eccentric orbit, it is likely that at the present day the brighter star is not in contact with its Roche surface. If it were in contact with its Roche surface then the evolution of the system might progress at a rapid pace. To demonstrate this consider the models generated by Lajoie & Sills (2011), who used a smoothed particle hydrodynamics code to examine mass transfer in intermediate mass binaries that have a range of orbital eccentricities. While the properties of these models do not replicate those of V1507 Cyg (e.g. the stars in the models have masses that are a few times lower than those found here for V1507 Cyg), there are general results that should have a wide applicability.
As expected, the rate of mass transfer with time in the models is not constant. Mass transfer also does not occur as a discrete pulse, but is an extended event, with the peak mass transfer rate occuring well after periastron, near phases 0.55 - 0.57. This delay in the peak transfer rate is attributed to the travel time needed for particles to leave the donor star and assemble around the gaining star. Perhaps of greatest importance for V1507 Cyg is that the rate of mass transfer in the models grows with each periastron passage, as the donor star expands in response to mass lost during the preceeding encounter. The simulations follow the systems over only a few orbits, and if this trend of increasing mass transfer were to continue then it may lead to a rapid depletion of gas from the donor star. We do not see evidence of such rapid evolution in the system orbit.
8.1.2 Envelopes around the stars
Features that are attributed to the photosphere of the companion star are not detected, as visible light from this object appears to be blocked by a thick circumstellar envelope. This envelope is the likely source of the mid-infrared emission that originates from the system. Still, after subtracting out the spectrum from the brighter star there remains an emission spectrum that is dominated by SiII and FeII lines, as well as HeI 6678 in absorption and emission. Based on their wavelength behaviour with phase we attribute these features to the envelope around the companion. The radial velocities measured from the SiII emission and HeI profile are in broad agreement, thereby indicating a common kinematic heritage.
The envelope around the companion is in a dynamic state. The broad HeI trough indicates that the envelope contains a component that is rotating and expanding, and there is also a red shifted absorption component that is indicative of infall. The mean expansion velocity is km/sec if the flow is isotropic, but the actual expansion velocity will be greater if there are projection effects that are related to the inclination of the system. Variations in the shape of the HeI profile suggest that the envelope around the companion is not symmetric, and that the distribution of material at a given orbital phase changes with time.
If there is a dusty medium around the companion then light from the companion will be re-emitted at longer wavelengths. We have examined the colors of V1507 Cyg using photometry from the WISE (Wright et al., 2010) source catalogue (Wright et al., 2019), and compared these with the colors of classic W Serpentis systems, which are thought to have thick disks around the gaining stars. We find that W1–W2 and W1–W4 for V1507 Cyg. For comparison, the mean colors of V367 Cyg, W Ser, SX Cas, RX Cas, and W Cru are and , where the uncertainties are the formal errors in the mean. The MIR spectral energy distribution of V1507 Cyg is thus similar to what is seen in other interacting binary systems.
H emission is a prominent feature in the spectrum at red wavelengths. The profile of this emission has a complex shape that varies with orbital phase, containing sub-structures that suggest at least two components produce the emission. There is also a broad, blue-shifted absorption component that is visible at some phases.
Evidence has been presented that the bulk of the H emission moves in a manner that tracks the motion of the brighter star. There is also evidence that the absorption feature moves in a sense that is consistent with the brighter star. Orbit-to-orbit variations in the emission are seen after periastron, suggesting that the level of activity that powers the emission changes with time. Thus, the environment around the stars is not in an equilibrium state, but experiences cycle-to-cycle activity.
8.1.3 Component masses
The masses of both components have been estimated by assuming that the emission and absorption features that are associated with the envelope track the motion of the companion. A potential concern is that the radial velocities obtained from the SiII emission and HeI P Cygni profiles define a trend with orbital phase that departs from that expected near phases 0.3 – 0.4, although the radial velocities at other phases do not appear to be outliers (e.g. Figure 7). While the cause of the behaviour of velocities near phases 0.3 – 0.4 is a matter of speculation, one possible cause might be distortions in the disk that result from tidal effects post-periastron.
When compared against the velocities of the brighter star, the velocities obtained from SiII emission have less scatter than those measured from HeI, and so the SiII velocities were adopted for calculating component masses. When combined with the amplitude of the velocity curve of the brighter star, the SiII emission line velocities yield component masses of and M⊙ with an orbital inclination of 46 degrees, as estimated by Berdyugin & Tarasov (1998). A lower limit to the masses can be obtained given that the system is not eclipsing. If a maximum inclination of is assumed then the limits on the masses are and M⊙.
The present study thus finds that V1507 Cyg contains stars that, if they were on the main sequence, would have late B or earlier spectral types. That the companion is more massive than the brighter star is consistent with mass transfer from the brighter star – which was initially the more massive star – progressing to the point where the mass ratio has reversed. That the brighter star is less than one half the mass of the companion indicates that mass transfer must be well-advanced.
The total system mass based on this analysis exceeds the initial system mass estimated by Davidge (2023), who used the photometric properties of stars that have distances and proper motions that are similar to those of V1507 Cyg. We put forward two possible explanations for this result. The first is that the age of the moving group associated with V1507 Cyg has been overestimated, presumably due to stochastic effects in populating the regions near the main sequence turn-off. The second is that V1507 Cyg may not be related to the nearby stars that happen to have similar proper motions. V1507 Cyg would then have presumably formed in a cluster or association that was disrupted early in its evolution (e.g. Lada & Lada, 2003), or has moved significantly from its place of origin. If there was a disrupted cluster then V1507 Cyg appears to be the lone survivor along this line of sight, as the CMD of all objects within 10 parsecs of V1507 Cyg (i.e. with no limits based on proper motions) shown in Figure 6b of Davidge (2023) contains no main sequence stars with ages Gyr. As for it moving far from its place of origin, the location of V1507 Cyg on the proper motion plane is not exceptional (Figure 1b of Davidge, 2023), in the sense that it is not an obvious outlier.
8.1.4 The system light curve
V1507 Cyg does not show the large amplitude photometric activity that is seen in the light curves of many CBSs, and is most commonly attributed to accretion and the formation of hot spots. This might indicate that the mass flow rate is very low at the current epoch, and it is not even clear if the brighter star comes into contact with its Roche surface during periastron. Even if there is significant mass transfer, photometric activity can be curtailed if the mass stream has a grazing impact on the accretion disk, with the result that a prominent hot spot may not form. This has been proposed by Mennikent et al. (2016) to explain the lack of photometric activity in some CBSs.
Based on the shape and modest amplitude of the V1507 Cyg light curve, coupled with the spectral type of the brighter star, we suspect that the brighter star may be an Cyg variable, and it is that variability that is responsible for the system light curve. Cyg variables are B or early A supergiants that are experiencing non-radial pulsations. The light curves have modest amplitudes ( mag) with cycle-to-cycle variations about the mean light curve. Cyg variables also span a range of luminosities. For example, the 29 variables identified by Waelkens et al. (1998) have log(L/L⊙) between 2.78 to over 7. The variables in that sample also have periods that range from a few days to over one hundred days. If the brighter star in V1507 Cyg is an Cyg variable then its luminosity places it near the fainter end of Cyg variables.
The suggestion that the brighter star is an Cyg variable can be checked by searching its spectrum for radial velocity variations due to pulsations. A complicating factor is that the periodicity of the V1507 Cyg light curve is the same as the system orbit, and so tidal effects presumably regulate the pulsation activity. Any radial velocity variations due to pulsations would then be best detected after removing the radial velocities that are associated with the motion of the brighter star in its orbit.
8.2 The Eccentric Orbit
The eccentricity of the orbit is a key consideration when discussing the nature of V1507 Cyg, as its cause likely holds clues into the very recent evolution of the system. Eccentric orbits are not expected to be common in CBSs, as mass transfer and tidal effects will generally act to circularize the orbits of the components. Empirical evidence for the impact of tidal forces on the shape of the orbit is seen in relations between eccentricity and the relative sizes of stars when measured in the context of the separation of the components, as well as with the system age when measured in terms of the circularization timescale (e.g. Figures 1 and 8 of Mayer & Hanna, 1991). It is because of the eccentric orbit that we have not attempted to model the evolution of V1507 Cyg or compare it with existing model libraries, since an eccentric orbit suggests that the evolution has been influenced by factors other than those usually considered in models of CBS evolution. In this section we briefly discuss some of the possible causes of an eccentric orbit in an evolved CBS such as V1507 Cyg.
Models suggest that there are conditions under which mass transfer may not result in a rapid circularization of the orbit (e.g. Sepinsky et al., 2009), and that mass transfer may even counteract the tendency for tidal forces to circularize orbits (e.g. Bonacic Marinovic et al., 2008; Dosopoulou & Kalogera, 2016). In fact, there are a modest number of interacting binary systems that have an eccentric orbit (e.g. Vos et al., 2013; Boffin et al., 2016). However, with the exception of systems that contain compact objects, these systems tend to have orbital periods of many years and large eccentricities, and so the components might be subjected to greatly reduced tidal effects during a large fraction of their orbital cycles. Again with the exception of systems that contain a compact object, the author is not aware of an interacting system with stars in an eccentric orbit that has an orbital period similar to V1507 Cyg.
An eccentric orbit might be expected in a CBS if it is observed fortuitously during the earliest stages of interaction, prior to orbit circularization. However, the properties of V1507 Cyg suggest that it is a highly evolved system that has undergone mass transfer to the point where the mass ratio has reversed and the gainer is now more massive than the donor. Hence, the orbital eccentricity is likely not a property that was instilled at birth.
An eccentric orbit could be the result of an interaction with another body. In fact, many eclipsing binaries with eccentric orbits have a third body in the system (e.g. Zasche et al., 2021), and the presence of a third body may play a role in spurring interactions between the two stars that are in a tighter orbit (e.g. Toonen et al., 2020). We note that the astrometric measurements for V1507 Cyg in GAIA DR3 are assigned a re-normalized unit weight error (RUWE) of 1.5, which means that the parallax is less certain than that of isolated stars with the same apparent brightness. This could be a consequence of the orbital motions of the stars, but might also be indicative of an unresolved third body.
If a third body were responsible for producing an eccentric orbit after mass transfer then it would have to be on an orbit that would have allowed mass transfer between the brighter star and the companion to proceed uninterrupted. Assuming Case B mass transfer then the pace of mass transfer is set by the evolutionary timescale of the initially more massive star as it evolves off of the main sequence. Assuming conservative mass transfer and an initial mass ratio near unity, then the mass losing star in V1507 Cyg had an initial mass of M⊙. The timescale for the development of a convective envelope in a 10M⊙ star is years (e.g. Vick et al., 2021), and the timescale for mass transfer prior to the reversal of the mass ratio in V1507 Cyg should then be a few times this value. Given the evidence that mass transfer has happened in V1507 Cyg then the orbital period of any third body should be in excess of this timescale, otherwise repeated interactions with the third body would have disrupted mass exchange.
If a third body were present then it would also affect the orbital parameters of the binary system, such as inducing changes in the mean system velocity , which appears to have stayed constant to within km/sec over roughly a century. Limits can be placed on the nature of a supposed third body that would not change the measurements by more than this amount. The image slicer at the entrance to the 1.2 metre spectrograph covers arcsec, which corresponds to AU at the distance of V1507 Cyg. If a third body were within the area sampled by the slicer then it would only be detected if it had an intrinsic brightness that was within a few magnitudes of the brighter star, and so absorption features from stars with masses that are near or below solar would not be detected. As no such light is seen in the spectra, then if a third body is present within a few arcsec then it must have a mass M⊙. Any such third body must then have a characteristic separation of at least 100 AU from V1507 Cyg in order not to produce a noticeable shift in . However, the period of such an object would be roughly two thousand years at a distance of 100 AU, and so might disrupt mass transfer. If the typical separation is 103 AU then the period would be 6000 years, which is again too short. The upshot is that if a third body is present then it must have a separation of at least AU from the binary system.
There is as yet no firm evidence for a companion to the V1507 Cyg system that is on a wide orbit. Davidge (2023) examined the spatial volume around V1507 Cyg, and identified a modest sample of stars that have proper motions that are similar to V1507 Cyg. These stars have masses of no more than 2M⊙. However, the closest object to V1507 Cyg that has a similar parallax and proper motion is arcsec away (Davidge, 2023), corresponding to a distance of almost AU. It is not clear if such a companion would remain bound to V1507 Cyg.
A fluke flyby encounter is another mechanism that could cause an eccentric orbit. Based on the distribution of objects in proper motion space, Davidge (2023) found a loose stellar cluster within pc of V1507 Cyg. The projected distribution of stars in the volume of space around V1507 Cyg suggests that it is located near the edge of this cluster, with a proper motion that differs from that of the main body of the cluster. If V1507 Cyg had an encounter with a cluster member then such an interaction may have induced an eccentric orbit.
The final possibility that we consider is that the eccentric orbit may have been triggered by a process internal to the system, such as a supernova explosion. As discussed in Section 7, there is evidence for structure in the ISM that is centered on V1507 Cyg. If this structure is a SNR associated with V1507 Cyg then it must be relatively young. The HI bubble has a radius of arcmin, and so would have a physical radius of parsecs if at the distance of V1507 Cyg. Assuming that SNR expansion velocities fall in the range km/sec, then the SNR would have an age between 600 ( km/sec) to 6000 ( km/sec) years. SNR may persist for up to Myr (Suzuki et al., 2021), and the age of the proposed SNR fits well within the expected lifetime. Moreover, as this would have been a very recent event then the system orbit may not have had time to circularize. The proper motion of V1507 Cyg also suggests that over a 6000 year timespan the system would have moved arcmin on the sky, and so would still appear more-or-less centered on the SNR in Figure 11. Still, we emphasize that the association of the HI structure with V1507 Cyg is not ironclad, as the line of sight passes through a densely populated part of the Galactic Disk, making depth effects a major concern.
If there is a SNR associated with V1507 Cyg then what was the progenitor? One possibility is that V1507 Cyg was part of a hierarchical system, and the progenitor was a third body that was well separated from the present day V1507 Cyg system and was initially more massive than either of the components in the binary system. Hierarchical triple systems are common among massive stars (e.g. Sana et al., 2014), and dynamical measurements have hinted at the presence of a black hole around some binary systems (e.g. Qian et al., 2008; Liao & Qian, 2010; Meng et al., 2021), that presumably originated from a now defunct massive star. If there was a such a massive companion to the V1507 Cyg system then the stability of the ephemeris suggests it must be at a distance where it does not perturb the orbit of the V1507 Cyg system at the present day. Perhaps it was ejected entirely from the system by a SN kick that could result from an asymmentric explosion.
Could the companion to the brighter star in the V1507 Cyg system be a compact object, and hence the progenitor of the SNR? The mass estimated here for the companion is close to, but still within, the upper limit of the mass range expected for stellar black holes formed from a solar metallicity progenitor (Belczynski et al., 2010). Nevertheless, if the companion is a collapsed object then its progenitor would have initially been the more massive star in the system. We might then expect to see evidence of processed material in the spectrum of that star, and this should be the subject of future work. In any event, given that the mass of the black hole is near the upper limit of that observed among solar metallicity objects then the progenitor would have likely been one of the most massive stars in the Galaxy, making it an exceptional object for this part of the sky, as star-forming activity is in the foreground well behind V1507 Cyg. V1507 Cyg is also not a source of the x-ray emission, at least at the present day, that is associated with many black hole candidates. Still, while x-ray emission is expected as material is accreted onto a black hole, an opaque disk might block it from the line of sight. As the viewing angle of the system is not edge-on then any material that would block emission from the companion must engulf a large fraction of that star – even near the poles – rather than being restricted to a disk in the orbital plane. The P Cygni-like profile of HeI 6678 suggests that such an envelope might be present. Accretion onto a compact object might also be hindered if the disk is rotating rapidly, as has been suggested for the MWC 656 system by Casares et al. (2014).
8.3 Wrapping Up
Evidence has been presented that V1507 Cyg is an evolved binary system where there has been significant mass transfer. The findings that support this claim are that (1) the brighter star at visible wavelengths is underluminous and undermassive when compared with stars that have a similar spectral type, and (2) the brighter star is less than one half the mass of the obscured companion. Mass transfer has thus progressed for an extended period of time, and the mass ratio of the system has changed substantially. Assuming an initial mass ratio close to unity and conservative mass transfer, then the total mass of the system at the present day suggests that the components initially had a mid-B spectral type. The companion at the present day is likely a heavily obscured, moderately massive star.
The mass flow has presumably subsided at the present epoch, given that the eccentric orbit limits mass flow to times near periastron. In fact, it is not clear if the brighter star comes into contact with its Roche surface during periastron, and so the reservoir available for mass transfer may be limited to an extended envelope around that star. Still, the components are tidally interacting, as the signatures of periastron effects are seen in the spectra of the brighter star and the envelope around the companion.
A tacit assumption in the discussion has been that the orbits of the stars during much of the system’s past were circular. However, explaining the present day orbital eccentricity is problematic, as none of the mechanisms considered here to explain the eccentric orbit are problem-free. It is the opinion of the author that V1507 Cyg was initially part of a hierarchical system. The stars in the V1507 Cyg system were in a circular orbit when the more massive third body went SN. It was the recent demise of that third object, and its possible ejection from the system, that perturbed the orbit of the V1507 Cyg system. The emission seen at 408 MHz and 1420 MHz that is centered on the system is the presumed remnant of that event.
There are numerous avenues for future work. As a CBS with an eccentric orbit, V1507 Cyg is an important system for examining periastron effects. A comparison with model line profiles such as those constructed by Moreno et al. (2005) but for system parameters that are more appropriate for V1507 Cyg would be useful to determine the impact of tidal effects on the brighter star as well as the envelope around the companion.
Monitoring the behaviour of the system spectrum to check for periodic and non-periodic behaviour in line characteristics, especially before and after periastron, will be rewarding. Such observations would provide additional information that is useful for monitoring the mass flow at a point in the orbit when it is expected to peak. Observations near phases 0.3 and 0.4 are of particular interest to assess the behaviour of radial velocities and mass flow with time at that point in the orbit.
Spectra that cover a wider wavelength range could also be used to search for abundance anomalies in the chemical content of the brighter star. A non-solar chemical mixture might be expected if core processed material has been brought to the surface due to mixing within the star, which might be driven by tidal effects at the present day, or could be present if another star transfered mass to the B8 I star at some point in the past. Spectra of this nature could also be used to assess the proposal that the B8 I star is an Cyg variable by searching for radial velocity variations associated with pulsations. If evidence for pulsations is found then it might be possible to probe the interior structure of the brighter star.
Further examination of the material around the (as yet undetected) companion over a broad wavelength range is also of interest to provide additional insights into the system mass ratio, the nature of the envelope, and the rate of mass accretion/ejection. The latter is of interest as the HeI 6678 profile in the residual spectrum suggests that there is mass outflow from the environment around the companion, and so only a fraction of the mass transfered from the B8 I star may eventually be deposited onto the companion at the present day. Monitoring the system at x-ray wavelengths might also provide insights into the rates of mass deposition onto the companion and place limits on its strength. Given the eccentric orbit then such emission might vary with orbital phase.
Finally, studies of the environment around the system will also provide clues into its past. For example, is the HI structure detected in the CGPS images a SNR? If so, is it at the same distance as V1507 Cyg? Answers to these questions have the potential to provide insights into the origins of the eccentric orbit.
References
- Baines et al. (2018) Baines, E. K., Armstrong, J. T., Schmidt, H. R. et al. 2018, AJ, 155, 30
- Belczynski et al. (2010) Belczynski, K., Bulik, T., Fryer, C. L., Ruiter, A., Valsecchi, F., Vink, J. S., & Hurley, J. R. 2010, ApJ, 714, 1217
- Berdyugin & Tarasov (1998) Berdyugin, A. V., & Tarasov, A. E. 1998, AstL, 24, 111
- Boffin et al. (2016) Boffin, H. M. J., Hillen, M., Berger, J. P., et al. 2016, A&A, 564, A1
- Bonacic Marinovic et al. (2008) Bonacic Marinovic, A. A., Glebbeek, E., & Pols, O. R. 2008, A&A, 480, 797
- Broz et al. (2021) Broz, M., Mourard, D., Budaj, J., et al. 2021, A&A, 645, A51
- Burdge et al. (2019) Burdge, K. B., Couglin, M. W., Fuller, J. et al. 2019, Nature, 571, 528
- Burdge et al. (2020) Burdge, K. B., Couglin, M. W., Fuller, J. et al. 2020, ApJ, 905, L7
- Casares et al. (2014) Casares, J., Negueruela, I., Ribo, M., Ribas, I., Paredes, J. M., Herrero, A., & Simon-Diaz, S. 2014, Nature, 505, 378
- Clark et al. (2013) Clark, J. S., Bartlett, E. S., Coe, M. J. et al. 2013, A&A, 560, A10
- Davidge (2023) Davidge, T. J. 2023, AJ, 165, 189
- Deschamps et al. (2015) Deschamps, R., Braun, K., Jurissen, A. et al., 2015, A&A, 577, A55
- de Vaucouleurs (1978) de Vaucouleurs, G. 1978, ApJ, 233, 351
- Dosopoulou & Kalogera (2016) Dosopoulou, F., & Kalogera, V. 2016, ApJ, 825, 70
- El-Badry & Qataert (2021) El-Badry, K. & Qataert, E. 2021, MNRAS, 502, 3436
- GAIA Collaboration (2022) Gaia Collaboration, Vallenari, A., Brown, A. G. A., et al. 2022, arXiv:2208.00211
- Hamman & Persson (1992) Hamann, F. & Persson, S. E. 1992, ApJS, 82, 285
- Hill et al. (1976) Hill, G., Hilditch, R. W., & Pfannenschmidt, E. L. 1976, PDAO, 15, 1
- Hutchings & Laskarides (1972) Hutchings, J. B., & Laskarides, P. G. 1972, MNRAS, 155, 357
- Hutchings & Redman (1973) Hutchings, J. B., & Redman, R. O. 1973, MNRAS, 163, 209
- Kobayashi et al. (2020) Kobayashi, C., Karakas, A. J., & Lugaro, M. 2020, ApJ, 900, 179
- Lada & Lada (2003) Lada, C. J., & Lada, E. A. 2003, ARA&A, 41, 57
- Lajoie & Sills (2011) Lajoie, C-P & Sills, A. 2011, ApJ, 726, 67
- Liao & Qian (2010) Liao, W.-P. & Qian, S.-B. 2010, MNRAS, 405, 1930
- Martin et al. (2009) Martin, R. G., Tout, C. A., & Pringle, J. E. 2009, MNRAS, 397, 1563
- Mayer & Hanna (1991) Mayer, P., & Hanna, M A.-M. 1991, BAICz, 42, 98
- Meng et al. (2021) Meng, G., Zhang, L.-Y., Han, X. L., et al. 2021, MNRAS, 503, 324
- Mennikent et al. (2016) Mennikent, R. E., Otero, S., & Kolaczkowski, Z. 2016, MNRAS, 455, 1728
- Merrill (1949) Merrill, P. W. 1949, ApJ, 110, 59
- Monin et al. (2014) Monin, D., Saddlemyer, L., & Bohlender, D. 2014, Rev. Mexicana Astron. Astrofis., 45, 69
- Moreno et al. (2005) Moreno. E., Koenigsberger, G., & Toledano, O. 2005, A&A, 437, 641
- Moreno et al. (2010) Moreno. E., Koenigsberger, G., & Harrington, D. M.. 2010, A&A, 528, A48
- Morgan & Keenan (1973) Morgan, W. W., & Keenan, P. C. 1973, ARA&A, 11, 29
- Morton (1960) Morton, D. C. 1960, ApJ, 132, 146
- Paunzen et al. (2006) Paunzen, E., Netopil, M., Iliiev, I. Kh., Maitzen, H. M., Claret, A., & Pintado, O. I. 2006, A&A, 454, 171
- Pavlovski et al. (1979) Pavlovski, K., Harmanec, P., Horn, J., Koubsky, P., Zdarsky, F., & Kriz, S. 1979, IBVS, 1689, 1
- Plavec & Koch (1978) Plavec, M., & Koch, R. H. 1978, IBVS, 1482, 1
- Przybilla et al. (2006) Przybilla, N., Butler, K., Becker, S. R., & Kudritzki, R. P. 2006, A&A, 445, 1099
- Qian et al. (2008) Qian, S.-B., Liao, W.-P., & Fernandez Lajus, E. 2008, ApJ, 687, 466
- Ren et al. (2021) Ren, F., Chen, X., Zhang, H., et al. 2021, ApJ, 911, L20
- Rucinski (1997) Rucinski, S. M. 1997, AJ, 113, 407
- Sana et al. (2014) Sana, H., Le Bouquin, J.-B., Lacour, S., et al. 2014, ApJS, 215, 15
- Sanchez-Blazquez et al. (2006) Sanchez-Blazquez, P., Peletier, R. F., Jimenez-Vicente, J. et al. 2006, MNRAS, 371, 703
- Sepinsky et al. (2009) Sepinsky, J. F., Willems, B., Kalogera, V., & Rasio, F. A. 2009, ApJ, 702, 1387
- Smak (1962) Smak, J. 1962, Acta Astron., 12, 28
- Smith & Tombleson (2015) Smith, N., & Tombleson, R. 2015, MNRAS, 447, 598
- Stassun & Torres (2021) Stassun, K. G., & Torres, G. 2021, ApJ, 907, L33
- Stepien (2006) Stepien, K. 2006, Acta Astron., 56, 199
- Suzuki et al. (2021) Suzuki, H., Bamba, A., & Shibata, S. 2021, ApJ, 914, 103
- Taylor et al. (2003) Taylor, A. R., Gibson, S. J., Peracaula, M. et al. 2003, AJ, 125, 3145
- Toonen et al. (2020) Toonen, S., Portegies Zwart, S., Hamers, A. S., & Bandopadhyay, D. 2020, A&A, 640, A16
- Torres et al. (2010) Torres, G., Andersen, J., & Gimenez, A. 2010, A&A Rev., 18, 67
- Trimble & Thorne (1969) Trimble, V. & Thorne, K. 1969, ApJ, 156, 1013
- Vick et al. (2021) Vick, M., MacLeod, M., Lai, D., & Loeb, A. 2021, MNRAS, 503, 5569
- Vos et al. (2013) Vos, J., Ostensen, R. H., Nemeth, P., et al. A&A, 559, A54
- Waelkens et al. (1998) Waelkens, C., Aerts, C., Kestens, E., Grenon, M., & Eyer, L. 1008, A&A, 330, 215
- Wilson et al. (1984) Wilson, R. E., Rafert, J., & Markworth, N. L. 1984, IAPPP Comm., 16, 1
- Wright et al. (2010) Wright, E. L., Eisenhart, P. R. M., Mainzer, A. K., et al. 2010, AJ, 140, 1868
- Wright et al. (2019) Wright, E. L., Eisenhart, P. R. M., Mainzer, A. K., et al. 2019, WISE All-Sky Source Catalog (Pasadena, CA: IPAC)
- Zahn (1977) Zahn, J.-P. 1977, A&A, 57, 383
- Zasche et al. (2021) Zasche, P., Henzl, Z., & Masek, M. 2021, A&A, 652, A81