On the root cause of the host ‘mass-step’ in the Hubble residuals of type Ia supernovae
Abstract
It is well established that the Hubble residuals of type Ia supernovae (SNe Ia) show the luminosity step with respect to their host galaxy stellar masses. This ‘mass-step’ is taken as an additional correction factor for the SN Ia luminosity standardization. Here we investigate the root cause of the mass-step and propose that the bimodal nature of the host age distribution is responsible for the step. In particular, by using the empirical nonlinear mass-to-age relation of local galaxies, we convert the mass function of SN Ia hosts to their age distribution. We find that the age distribution shows clear bimodality: a younger ( 6 Gyr) group with lower mass ( ) and an older ( 6 Gyr) group with higher mass ( ). On the Hubble residual versus host mass plane, the two groups create the mass-step at . This leads us to conclude that the host galaxy mass-step can be attributed to the bimodal age distribution in relation to a nonlinear relation between galaxy mass and age. We suggest that the mass-step is another manifestation of the old ‘red sequence’ and the young ‘blue cloud’ observed in the galactic color–magnitude diagram.
1 Introduction
The type Ia supernovae (SNe Ia) are currently the most important standard candles in observational cosmology beyond the local universe because they allow the direct measurement of the expansion rate of the universe (Riess et al., 1998; Schmidt et al., 1998; Perlmutter et al., 1999). Contrary to the initial assumption that SNe Ia are reliable “standardizable candles”, studies over the past decade have revealed that the brightnesses of SNe Ia, even after the luminosity standardization, in fact vary depending on their host galaxy properties. The host properties suggested thus far include host stellar mass (e.g., Kelly et al., 2010; Sullivan et al., 2010), local star formation rate (e.g., Rigault et al., 2013, 2015, 2020), metallicity (e.g., Sullivan et al., 2003, 2010), dust extinction (e.g., Scolnic et al., 2018; Brout & Scolnic, 2021), and (local/global) progenitor age (e.g., Howell et al., 2009; Gupta et al., 2011; Kang et al., 2016; Lee et al., 2020, 2022; Zhang et al., 2021; Wang et al., 2023). In particular, recent studies of SN cosmology essentially include the host mass correction in the luminosity standardization of SNe Ia.
While the flux-limited host mass distribution is unimodal with slight skewness toward lower masses, the standardized brightnesses of SNe Ia show a significant difference below/above a certain host mass (). Currently, the luminosity corrections of SNe Ia follow this host ‘mass-step’ (e.g., Betoule et al., 2014; Smith et al., 2020; Johansson et al., 2021). However, given that the mass of the host galaxy has no direct relevance to the nature of SNe Ia, previous studies have suggested that this phenomenon stems from either age/metallicity (e.g., Howell et al., 2009; Sullivan et al., 2010) of underlying stellar populations or dust properties of SN Ia hosts (e.g., Brout & Scolnic, 2021; Johansson et al., 2021). Recently, Wiseman et al. (2023) proposed that the dust extinction parameter , which varies with the host age, could be the driving factor behind the host mass-step. Since the stellar mass of a galaxy is correlated with the population age (e.g., Gallazzi et al., 2005; Kang et al., 2016), the host mass-step may be an outcome of the progenitor age effect on the standardized brightnesses of SNe Ia (Kang et al., 2020; Lee et al., 2020, 2022) rather than being mainly influenced by dust (see e.g., Uddin et al., 2020; Ponder et al., 2021; Thorp & Mandel, 2022). Indeed, Childress et al. (2014) have demonstrated how the host mass-step could be driven by progenitor age, although they did not proceed to the simulation for the Hubble residual (HR) versus host mass diagram. Identifying the root cause of the mass-step is crucial as each host galaxy property evolves differently with redshift and, therefore, has a different impact on cosmology. Within the redshift range most relevant to SN cosmology (), the variations in host mass or star formation rate are either negligible or relatively weak, producing only an insignificant or limited effect on cosmology (Scolnic et al., 2018; Rigault et al., 2020). On the other hand, the variation in mean population age is significant, causing a critical impact on cosmology (Lee et al., 2022).
This paper aims to investigate the primary cause of the host galaxy mass-step, instead of a linear relationship, by employing the empirical correlation between galaxy mass and population age. This study will specifically focus on the host age among the various parameters that have been suggested to be associated with the host mass-step. We demonstrate here that the mass-step observed in SN Ia host galaxies is a natural consequence of a simple reflection from the nonlinear relation between galaxy mass and mean population age, which is also witnessed as old ‘red sequence’ and young ‘blue cloud’ in the galaxy color–magnitude diagram, as well documented in the literature.
2 The Empirical Age–Mass Relation of galaxies
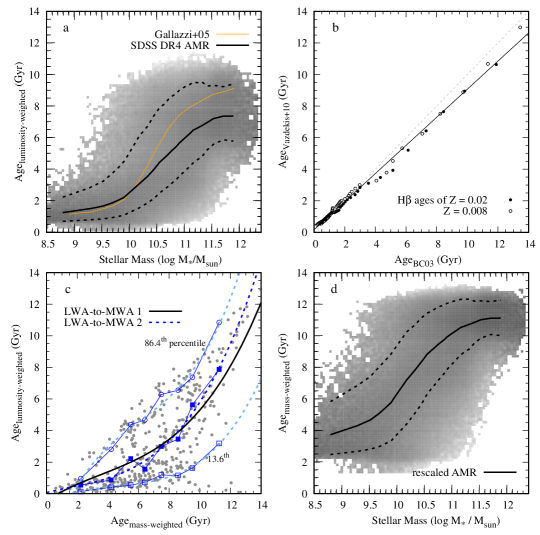
Gallazzi et al. (2005, hereafter G05) found the nonlinenar empirical age–mass relation (AMR) of galaxies by estimating the luminosity-weighted age (LWA) through and Balmer absorptions, based on the SDSS DR2. Subsequently, the G05 AMR was validated by Gallazzi et al. (2008, 2021) and Zibetti et al. (2017). To update the G05 AMR, we apply the same methodology of G05 to analyze 420,000 galaxies111https://wwwmpa.mpa-garching.mpg.de/SDSS/DR4/ from SDSS DR4. The choice of SDSS DR4 is because of its availability of the spectroscopically measured age, which is considered as an accurate method of age-dating galaxies. This sample of galaxies provides a good approximation for the AMR required in this analysis as SNe Ia arise in all types of galaxies. In Figure 1(), we present our newly derived AMR for SDSS DR4 galaxies. The age difference between massive and low-mass galaxies decreased by 10 % compared to the G05 AMR for SDSS DR2 (orange line). This difference is attributed to the mass offset between G05 (SDSS DR2) and SDSS DR4, as well as the younger galaxies of SDSS DR4 within massive galaxies around . As demonstrated, sample selection influences the resultant AMR. Nonetheless, as elaborated in subsequent discussions, the essence of the empirical AMR resides in its nonlinear relationship. Hence, we choose to employ this AMR for diverse analyses of SN Ia hosts throughout this study.
In this study, we adopt the mass-weighted age (MWA) (Lee et al., 2020) for host galaxies. Compared to the LWA, the MWA more accurately represents the mean age of stellar populations in a galaxy especially when recently formed young stars are present. Moreover, given the significant influence of the star formation history and the delay time distribution on the SN progenitor age distribution, the MWA is considered more suitable for investigating the correlation between mass and age of hosts. To convert from an LWA-based AMR to an MWA-based one, we use data from the CALIFA survey (de Amorim et al., 2017), which provides both LWA and MWA measurements. It is noteworthy that the LWA of our AMR is based on the Bruzual & Charlot (2003, hereafter BC03) model, while the CALIFA survey’s LWA is based on the Vazdekis et al. (2010, hereafter V10) model. To establish a correlation between ages acquired from the BC03 and V10 models, we obtain simple stellar population equivalent ages based on the H absorption index (for and ) in Figure 1() and derive a formula, (solid line). Using this formula, we convert the updated G05 AMR to a rescaled AMR with the age scale of the CALIFA survey.
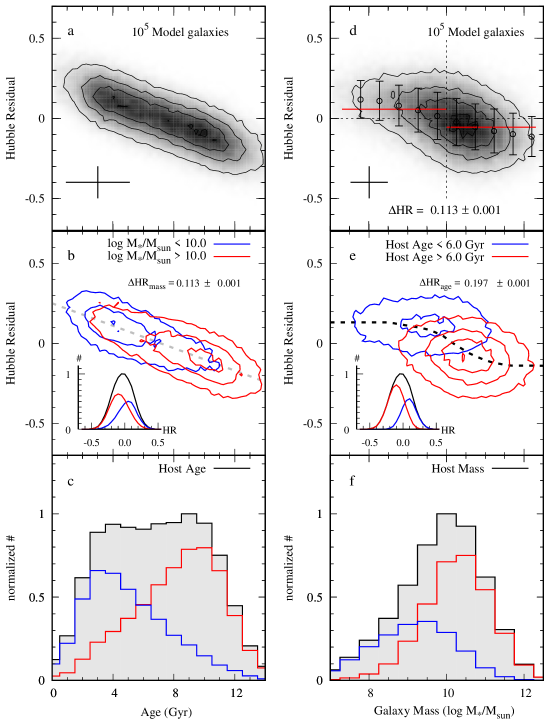
Figure 1() shows the relationship between MWA and LWA in CALIFA galaxies. We note that the galaxies with MWAs below 9 Gyr are mostly confined to LWAs of Gyr. This illustrates the effect of young stellar populations on the LWA. To obtain the LWA-to-MWA conversion relationship, we perform polynomial regressions between LWAs and MWAs and choose to use the third-order polynomial (black solid line, LWA-to-MWA conversion 1), which yields the minimum value of reduced .222To obtain the reduced value, we assigned equal weight to each age scale, given the limited information available on the error bars for both MWA and LWA. Among the 12 regressions tested (2nd to 7th order polynomials) for both MWA and LWA, the 3rd order polynomial shown in Figure 1() had the lowest reduced value. However, it is important to note that this minimum value does not signify that the regression is the optimal fit, but rather underscores its superior fit within the range of 2nd to 7th order polynomials. As an alternative approach, we divide the samples into eight groups, each consisting of 50 galaxies, and obtain the median values for each group (blue squares in the figure). Utilizing these data points, we derive a third-order polynomial regression (blue dashed line, LWA-to-MWA conversion 2). To capture the full scatter in both conversions, we further integrate conversion errors between two age scales using the 13.6th and 86.4th percentile sample distributions of LWA-to-MWA conversion 2. Note that our simulations in Figures 2-4 do not incorporate these LWA-to-MWA conversion uncertainties, as our primary focus is to illustrate typical age scale conversions. A detailed discussion on LWA-to-MWA conversion errors is provided in the Appendix. In Figure 1(), we present the MWA-based AMR (black solid line), whose shape remains almost the same as the LWA-based AMR. Regardless of the selected LWA-to-MWA conversion or the inclusion of age conversion errors, the resulting AMRs consistently exhibit a highly nonlinear ‘S’-shape with a quasi-inflection point between young and old ages. This nonlinearity recalls the colormagnitude (mass) relation in the diagnostic diagrams of galaxy evolution (e.g., Faber et al., 2007). It is noteworthy that this nonlinear relationship is also observed in the host age–mass relationship of SN Ia hosts as observed by Gupta et al. (2011). This further affirms that our AMR derived from SDSS DR4 serves as a robust approximation for a wide mass range of galaxy samples.
3 The bimodal age distribution of galaxies as the cause of the host mass-step
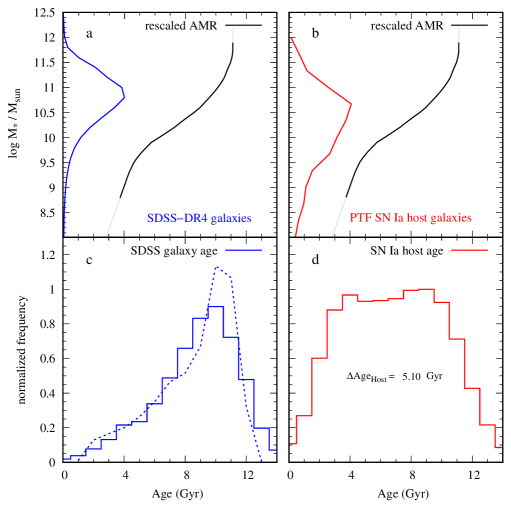
The observed AMR shows a nonlinear pattern that reflects the average relationship between galaxies’ age and mass. In order to investigate the age distribution of galaxies based on this empirical AMR, we conduct the nonlinear projection simulations.333Detailed explanation on the nonlinear projection simulation relevant to this work can be found in Yoon et al. (2006), Chung et al. (2016), and Lee et al. (2019). Figure 2(, ) shows two simulations using the observed mass distributions of () the SDSS DR4 galaxies and () the SN Ia host galaxies from the Paloma Transient Factory (PTF, Pan et al., 2014). The SN Ia host galaxies show a broader mass distribution with a higher fraction at the low-mass tail. This is attributed to SNe Ia arising more frequently in low-mass star-forming galaxies.
In Figure 2(, ), we convert the two mass distributions into the age distributions using the nonlinear AMR. Changes in the slopes of the empirical AMR can affect the concentration and dispersion of the age distribution of galaxies. Additionally, both the location of the peak and the degree of spread in a mass distribution play a role in determining the age distributions, resulting in high skewness for SDSS galaxies and strong bimodality for SN Ia hosts. As a mass distribution shifts towards lower mass or becomes wider with a greater proportion of low-mass galaxies, the age distributions become more strongly bimodal. In this regard, applying a completeness correction to the mass distribution would result in an age distribution exhibiting increased numbers of younger galaxies. However, considering the variations within the blue cloud region where low-mass galaxies predominantly reside, the overall AMR shape is anticipated to remain relatively stable. We note that, despite the AMR does not cover the entire age range, the simulated ages exhibit a distribution across the entire age span. This is due to a mild extrapolation of the rescaled AMR and the Monte Carlo simulation to introduce a random age scatter in the projection simulation. While a small number of galaxies in the young age region may appear unphysical, their contribution to the overall age distribution is negligible.
In Figure 2(), we present a validation of our projection simulation result by comparing the simulated age distribution of SDSS DR4 galaxies (blue solid histogram) with their measured age distribution (blue dashed line). The simulated age distribution exhibits a peak at an older age and a skewed tail towards younger ages, which closely resembles the measured age distribution. Therefore, in Figure 2(), our simulated age distribution for the host galaxies can be considered as a reasonable representation to their actual age distribution.
To quantify the degree of bimodality in age distributions resulting from the projection simulation, we execute the Gaussian Mixture Modeling (GMM) test (Muratov & Gnedin, 2010) with different variances, using model galaxies chosen randomly. The GMM test yields -values444The -value is defined as , where and are means for two distributions with and for standard deviations, respectively. and the fraction between two groups, which is a useful diagnostic for the separation between two distributions: a -value of at least 2.0 is necessary for a clear separation between two groups (Ashman et al., 1994). Specifically, the -value for SDSS DR4 galaxies is 2.41 but the distribution exhibits a dominant fraction of older age groups (%). In contrast, for the hosts, the GMM test shows a distinct separation between the two age groups, with a -value of 2.49, along with a comparable fraction of young (%) and old galaxies (%). Note that employing the rescaled G05 AMR results in an even more pronounced bimodal age distribution (-value = 2.88) with a similar fraction of two groups and a slightly larger mean age difference (see Appendix for the age distributions with different input ingredients and parameters).
In Figure 3, we perform Monte Carlo simulations with mock galaxies to examine whether the bimodal age distribution of SN Ia hosts can account for the observed host mass-step. For the age–HR simulation, we take into account age scatters derived from Figure 1() to the projected age while using a mass distribution from PTF. For the mass–HR simulation, each age of a mock galaxy is fixed while incorporating mass scatter derived from the SDSS DR4 data into the mass of a galaxy. In all simulations, the HR scatter is consistently maintained at a value of 0.1 mag (Pan et al., 2014). Firstly, in the left panels, we examine the luminosity difference of SNe Ia as a function of the host age. Figure 3() displays the distribution of mock galaxies in the host age versus HR plane. As noted by Lee et al. (2020), the potential effect of a nonlinear age–HR is not significant, and we adopt a linear relation555Per-object SN analysis concerning host age and HR has been presented in Kang et al. (2016, 2020) and Lee et al. (2020). To derive collective trends for HR and host age, we have incorporated the linear relationship as established in literature. with a slope of mag/Gyr (see e.g., Zhang et al., 2021; Lee et al., 2022). In Figure 3(), we divide the mock galaxies into two groups: those with the mass above (red) and below (blue) the threshold. Although there is a considerable overlap between the two mass groups, they exhibit a noticeable difference of mag. Figure 3() presents the bimodal distribution of host ages, which consists of the age distributions of the two mass groups (see also Figure 2()).
Secondly, in the right panels of Figure 3, we examine the luminosity difference of SNe Ia as a function of host mass (i.e., the mass-step). In Figure 3(), we generate the host mass versus HR distribution using the empirical AMR (as in Figure 1) and the ageHR relation (as in Figure 3(a)). On closer inspection, the HRs with respect to the host mass exhibit a step function around . To illustrate this mass-step, we follow the approach adopted in the previous studies reporting the host mass-step, and present the binned HRs (open circles) and the mean values above/below (red straight lines). This clearly demonstrates the 0.113 mag step in the HR. Similar to Figure 3(), in Figure 3(), we divide the mock galaxies into two groups but based on a host age threshold of 6.0 Gyr. Interestingly, galaxies divided at 6.0 Gyr are located at different regions in the HR versus host mass plane. The galaxies with relatively younger ages mostly fall within the upper-left region, while those with older ages are in the bottom-right region. The bimodal age distribution in the host mass-step diagram is attributed to a nonlinear mass–HR relationship stemming from the nonlinear mass–MWA relation, as shown by the black dashed line. Despite the substantial overlap in host mass between these two age groups (as shown in Figure 3()), the grouping by host age shows a more pronounced step in the HR (0.197 mag) than that by host mass (0.113 mag). This suggests that the mass-step is a manifestation of the age-driven HR difference in the host mass domain.
4 Discussion
We have demonstrated how the nonlinear empirical AMR can project a unimodal host mass distribution onto a bimodal host age distribution, thereby providing an explanation for the host mass-step of SNe Ia. The highly nonlinear empirical AMR is a different manifestation of the distribution of galaxies observed in the color–magnitude diagram. The distribution of dereddened local galaxies is primarily concentrated in the red sequence (old passive) and blue cloud regions (young star-forming) of the color–magnitude diagram. This feature has been used to infer the formation and evolutionary history of galaxies at various redshifts (e.g., Faber et al., 2007; Wyder et al., 2007; Muzzin et al., 2013; Schawinski et al., 2014). In particular, the dereddened UV-optical color, known for its sensitivity to the Balmer/ break (Wuyts et al., 2007), has been employed to classify galaxies into the red sequence or blue cloud categories. Given that the Balmer absorption and the D4000 break are well-established age indicators that are relatively insensitive to metallicity (e.g., Gallazzi et al., 2005; Chung et al., 2013), the dereddened UV-optical related colors from the and SDSS survey serve as reliable age / star formation rate indicators of galaxies in the galaxy color–magnitude diagram (e.g., Wyder et al., 2007; Schawinski et al., 2014). As the SN Ia host galaxies can be considered a subset of a larger population of galaxies, local SN Ia host galaxies are also expected to be observed in the same regions as local galaxies in the galaxy color–magnitude diagram. Therefore, the bimodal age distribution of host galaxies would be a natural consequence of the division of the red sequence and blue cloud in the galaxy color–magnitude diagram. The empirical AMR and its nonlinearity, which we have utilized to convert host mass to age, would have also been derived from the galaxy color–magnitude relation.
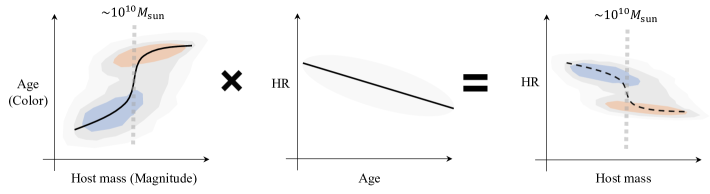
Figure 4 is a schematic diagram illustrating the convolution process by which the color–magnitude (or color–mass) diagram of local galaxies is transformed into the HR versus host mass plane. In the left panel, a typical color–magnitude diagram of local galaxies is depicted, displaying the presence of a nonlinear relationship between the two parameters. The middle panel shows a correlation between the ages of host galaxies and their corresponding SN Ia HRs. Notably, the observed host mass-step in the SN Ia host galaxies is the result of a simple convolution of these two relations, as illustrated in the right panel. In this regard, the host mass-step, which is observed to occur at approximately can also be naturally explained by the transition mass between the red sequence and blue cloud regions in the galaxy color–magnitude (mass) diagram (e.g., Faber et al., 2007). This is also in line with the findings of Roman et al. (2018), who reported a significant local color step that is comparable to the mass-step of SN Ia hosts.
| LWA-to-MWA conversions | ||
|---|---|---|
| LWA-to-MWA 1 | ||
| LWA-to-MWA 2 | ||
| LWA-to-MWA 1 w/ 1.0 Gyr age scatter | ||
| LWA-to-MWA 1 w/ conversion error | ||
| LWA-to-MWA 2 w/ conversion eeror | ||
| G05 LWA-to-MWA 1 | ||
| G05 LWA-to-MWA 2 |
The upcoming surveys, such as those from the James Webb Space Telescope, are anticipated to detect a larger number of SNe Ia at high redshifts. If our analysis is correct, the host mass-step observed in the high- SN Ia sample would show a smaller magnitude difference because the progenitor age range is reduced as the age of the red sequence becomes younger (see Figure 6 of Lee et al. 2022). In this respect, it is interesting to note that a comparison between the local sample (Kelly et al., 2010) and the SNLS sample at (Sullivan et al., 2011) already indicates a hint of this trend. Also, measuring reliable population ages for a large sample of host galaxies, both at high- and low-, would help to further elucidate the root cause of the host mass-step.
5 Appendix
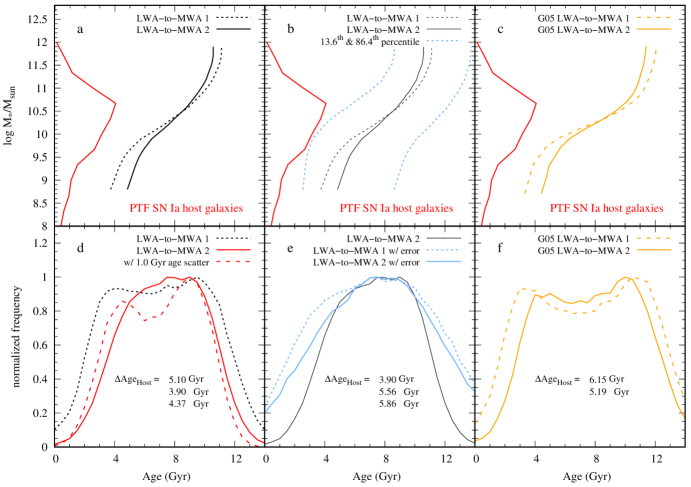
Here we show the effect of the applied AMRs and the age scatter on the projection simulations. The top panels of Figure 5 display the rescaled AMRs obtained from the LWA-to-MWA conversion 1 and 2, as well as conversion 2’s 13.6th and 84.6th percentile conversions, along with the case of the G05 AMR. Although the rescaled AMR obtained through the LWA-to-MWA conversion 2 demonstrates a smaller age difference between low- and high-mass galaxies, the resulting AMR (solid line) maintains the ‘S’-shape similar to the rescaled AMR based on the LWA-to-MWA conversion 1 (short dashed line). Our LWA-to-MWA conversion 2 resulted in the narrower age distribution (solid red histogram in panel ()) compared to that from the LWA-to-MWA conversion 1 (short dashed black histogram in the same panel), with a mean age difference of 3.90 Gyr between the two groups. However, the distribution’s -value of 2.20 and the comparable fraction (% : %) still indicates strong bimodality in age. In order to assess the impact of extreme outliers on the LWA-to-MWA conversion, we examine two additional scenarios involving age conversion errors at the 13.6th and 86.4th percentiles. Projected age distributions with these errors also result in bimodal distributions, with D-values of 2.11 and 2.00 for the LWA-to-MWA conversion 1 and 2, respectively. The proportions of old age groups for the LWA-to-MWA conversion 1 and 2 are % and %, respectively. This reaffirms the significance of nonlinear relationships in understanding the bimodal age distribution of galaxies, regardless of the age conversion errors.
We perform additional projection simulations based on the G05 AMR. Both AMRs based on the LWA-to-MWA conversion 1 and 2 for the G05 AMRs exhibit clearly bimodal age distributions with even larger age differences of 6.15 and 5.19 Gyr, respectively. The -values of the distributions are 2.88 and 2.53 with the fraction of the old age groups of % and %, respectively. On the other hand, the red dashed histogram in Figure 5() is for the simulation based on the LWA-to-MWA conversion 1 that employs the age scatter of 1.0 Gyr. The overall age distribution shows clear bimodality in comparison to Figure 2(), due to the reduced age scatter (in contrast to the age scatter employed throughout the manuscript). It is important to note that the quantitative age difference is strongly influenced by the employed stellar population models, but nonetheless, bimodality persists in the qualitative morphology of the age distributions. We have summarized the resulting values in Table 1 for various assumptions regarding LWA-to-MWA conversion and associated errors. Although minor differences exist among the different conversions and the applied errors, the simulated values consistently yield approximately mag, irrespective of the chosen conversions or conversion errors. This result further confirms the close relationship between bimodal age distributions and the host mass-steps.
References
- Ashman et al. (1994) Ashman, K. M., Bird, C. M., & Zepf, S. E. 1994, AJ, 108, 2348. doi:10.1086/117248
- Betoule et al. (2014) Betoule, M., Kessler, R., Guy, J., et al. 2014, A&A, 568, A22
- Brout & Scolnic (2021) Brout, D. & Scolnic, D. 2021, ApJ, 909, 26. doi:10.3847/1538-4357/abd69b
- Bruzual & Charlot (2003) Bruzual, G. & Charlot, S. 2003, MNRAS, 344, 1000. doi:10.1046/j.1365-8711.2003.06897.x
- Childress et al. (2014) Childress, M. J., Wolf, C., & Zahid, H. J. 2014, MNRAS, 445, 1898
- Chung et al. (2013) Chung, C., Yoon, S.-J., Lee, S.-Y., et al. 2013, ApJS, 204, 3. doi:10.1088/0067-0049/204/1/3
- Chung et al. (2016) Chung, C., Yoon, S.-J., Lee, S.-Y., et al. 2016, ApJ, 818, 201. doi:10.3847/0004-637X/818/2/201
- de Amorim et al. (2017) de Amorim, A. L., García-Benito, R., Cid Fernandes, R., et al. 2017, MNRAS, 471, 3727. doi:10.1093/mnras/stx1805
- Faber et al. (2007) Faber, S. M., Willmer, C. N. A., Wolf, C., et al. 2007, ApJ, 665, 265. doi:10.1086/519294
- Gallazzi et al. (2005) Gallazzi, A., Charlot, S., Brinchmann, J., et al. 2005, MNRAS, 362, 41. doi:10.1111/j.1365-2966.2005.09321.x
- Gallazzi et al. (2008) Gallazzi, A., Brinchmann, J., Charlot, S., et al. 2008, MNRAS, 383, 1439. doi:10.1111/j.1365-2966.2007.12632.x
- Gallazzi et al. (2021) Gallazzi, A. R., Pasquali, A., Zibetti, S., et al. 2021, MNRAS, 502, 4457. doi:10.1093/mnras/stab265
- Gupta et al. (2011) Gupta, R. R., D’Andrea, C. B., Sako, M., et al. 2011, ApJ, 740, 92
- Howell et al. (2009) Howell, D. A., Sullivan, M., Brown, E. F., et al. 2009, ApJ, 691, 661. doi:10.1088/0004-637X/691/1/661
- Johansson et al. (2021) Johansson, J., Cenko, S. B., Fox, O. D., et al. 2021, ApJ, 923, 237. doi:10.3847/1538-4357/ac2f9e
- Kang et al. (2016) Kang, Y., Kim, Y.-L., Lim, D., et al. 2016, ApJS, 223, 7. doi:10.3847/0067-0049/223/1/7
- Kang et al. (2020) Kang, Y., Lee, Y.-W., Kim, Y.-L., et al. 2020, ApJ, 889, 8
- Kelly et al. (2010) Kelly, P. L., Hicken, M., Burke, D. L., et al. 2010, ApJ, 715, 743. doi:10.1088/0004-637X/715/2/743
- Lee et al. (2019) Lee, S.-Y., Chung, C., & Yoon, S.-J. 2019, ApJS, 240, 2. doi:10.3847/1538-4365/aaecd4
- Lee et al. (2020) Lee, Y.-W., Chung, C., Kang, Y., et al. 2020, ApJ, 903, 22. doi:10.3847/1538-4357/abb3c6
- Lee et al. (2022) Lee, Y.-W., Chung, C., Demarque, P., et al. 2022, MNRAS. doi:10.1093/mnras/stac2840
- Muratov & Gnedin (2010) Muratov, A. L. & Gnedin, O. Y. 2010, ApJ, 718, 1266. doi:10.1088/0004-637X/718/2/1266
- Muzzin et al. (2013) Muzzin, A., Marchesini, D., Stefanon, M., et al. 2013, ApJ, 777, 18. doi:10.1088/0004-637X/777/1/18
- Pan et al. (2014) Pan, Y.-C., Sullivan, M., Maguire, K., et al. 2014, MNRAS, 438, 1391. doi:10.1093/mnras/stt2287
- Perlmutter et al. (1999) Perlmutter, S., Aldering, G., Goldhaber, G., et al. 1999, ApJ, 517, 565
- Ponder et al. (2021) Ponder, K. A., Wood-Vasey, W. M., Weyant, A., et al. 2021, ApJ, 923, 197. doi:10.3847/1538-4357/ac2d99
- Riess et al. (1998) Riess, A. G., Filippenko, A. V., Challis, P., et al. 1998, AJ, 116, 1009
- Rigault et al. (2020) Rigault, M., Brinnel, V., Aldering, G., et al. 2020, A&A, 644, A176. doi:10.1051/0004-6361/201730404
- Rigault et al. (2013) Rigault, M., Copin, Y., Aldering, G., et al. 2013, A&A, 560, A66. doi:10.1051/0004-6361/201322104
- Rigault et al. (2015) Rigault, M., Aldering, G., Kowalski, M., et al. 2015, ApJ, 802, 20
- Roman et al. (2018) Roman, M., Hardin, D., Betoule, M., et al. 2018, A&A, 615, A68. doi:10.1051/0004-6361/201731425
- Schawinski et al. (2014) Schawinski, K., Urry, C. M., Simmons, B. D., et al. 2014, MNRAS, 440, 889. doi:10.1093/mnras/stu327
- Schmidt et al. (1998) Schmidt, B. P., Suntzeff, N. B., Phillips, M. M., et al. 1998, ApJ, 507, 46
- Scolnic et al. (2018) Scolnic, D. M., Jones, D. O., Rest, A., et al. 2018, ApJ, 859, 101. doi:10.3847/1538-4357/aab9bb
- Smith et al. (2020) Smith, M., Sullivan, M., Wiseman, P., et al. 2020, MNRAS, 494, 4426. doi:10.1093/mnras/staa946
- Sullivan et al. (2010) Sullivan, M., Conley, A., Howell, D. A., et al. 2010, MNRAS, 406, 782
- Sullivan et al. (2003) Sullivan, M., Ellis, R. S., Aldering, G., et al. 2003, MNRAS, 340, 1057. doi:10.1046/j.1365-8711.2003.06312.x
- Sullivan et al. (2011) Sullivan, M., Guy, J., Conley, A., et al. 2011, ApJ, 737, 102. doi:10.1088/0004-637X/737/2/102
- Thorp & Mandel (2022) Thorp, S. & Mandel, K. S. 2022, MNRAS, 517, 2360. doi:10.1093/mnras/stac2714
- Uddin et al. (2020) Uddin, S. A., Burns, C. R., Phillips, M. M., et al. 2020, ApJ, 901, 143. doi:10.3847/1538-4357/abafb7
- Vazdekis et al. (2010) Vazdekis, A., Sánchez-Blázquez, P., Falcón-Barroso, J., et al. 2010, MNRAS, 404, 1639. doi:10.1111/j.1365-2966.2010.16407.x
- Wang et al. (2023) Wang, J., Huang, Z., & Huang, L. 2023, arXiv:2303.15267. doi:10.48550/arXiv.2303.15267
- Wiseman et al. (2023) Wiseman, P., Sullivan, M., Smith, M., et al. 2023, MNRAS, 520, 6214. doi:10.1093/mnras/stad488
- Wuyts et al. (2007) Wuyts, S., Labbé, I., Franx, M., et al. 2007, ApJ, 655, 51. doi:10.1086/509708
- Wyder et al. (2007) Wyder, T. K., Martin, D. C., Schiminovich, D., et al. 2007, ApJS, 173, 293. doi:10.1086/521402
- Yoon et al. (2006) Yoon, S.-J., Yi, S. K., & Lee, Y.-W. 2006, Science, 311, 1129. doi:10.1126/science.1122294
- Zhang et al. (2021) Zhang, K. D., Murakami, Y. S., Stahl, B. E., et al. 2021, MNRAS, 503, L33. doi:10.1093/mnrasl/slab020
- Zibetti et al. (2017) Zibetti, S., Gallazzi, A. R., Ascasibar, Y., et al. 2017, MNRAS, 468, 1902. doi:10.1093/mnras/stx251