NetDiffus: Network Traffic Generation by Diffusion Models through Time-Series Imaging
Abstract.
Network data analytics are now at the core of almost every networking solution. Nonetheless, limited access to networking data has been an enduring challenge due to many reasons including complexity of modern networks, commercial sensitivity, privacy and regulatory constraints. In this work, we explore how to leverage recent advancements in Diffusion Models (DM) to generate synthetic network traffic data. We develop an end-to-end framework - NetDiffus that first converts one-dimensional time-series network traffic into two-dimensional images, and then synthesizes representative images for the original data. We demonstrate that NetDiffus outperforms the state-of-the-art traffic generation methods based on Generative Adversarial Networks (GANs) by providing 66.4% increase in fidelity of the generated data and 18.1% increase in downstream machine learning tasks. We evaluate NetDiffus on seven diverse traffic traces and show that utilizing synthetic data significantly improves traffic fingerprinting, anomaly detection and traffic classification.
1. Introduction
Many network planning, monitoring, and optimization tasks depend on network data analytics in and off the network (Hussain et al., 2020; Dimopoulos et al., 2016). These tasks are often driven by Machine Learning (ML) models which require a large amount of real network measurements to train the models. However, having access to appropriate network data traces is increasingly becoming challenging (Lin et al., 2020; Yin et al., 2022; Kattadige et al., 2021a; Shahid et al., 2020). First, due to the complexity of modern networks and the sheer volume of data being transferred, deploying data collection tools requires significant expertise and cost. Second, privacy and regulatory constraints have made many types of network data inaccessible or restricted in use for other purposes such as network management (Kattadige et al., 2021a; Shahid et al., 2020). Third, due to the commercial sensitivity of the data, many organizations do not share data with others, even among different departments of the same organization, let alone with the research community (Lin et al., 2020).
To overcome these issues, synthetic data generation has become a promising alternative. While there are many techniques and tools for data packets generation such as NS-3 (NS3, 2023), and iPerf (Iperf.fr, 2023) to satisfy a given model or a distribution, they fail to faithfully mimic the intricacies of real traces. However, recent ML-based approaches are capable of learning from traces to overcome this limitation (Lin et al., 2020; Yin et al., 2022; Kattadige et al., 2021a; Xu et al., 2019; Redžović et al., [n. d.]). Among them, generative model based solutions such as DoppleGanger (Lin et al., 2020), NetShare(Yin et al., 2022), and CTGAN (Xu et al., 2019), have shown superior performance in terms of representing practical network constraints and issues. However, GANs that have been the basis for many state-of-the-art (SOTA) network traffic generation tools suffer from mode-collapse, vanishing gradients, and instability unless the hyper-parameters are properly selected (Dhariwal and Nichol, 2021).
In this work, we explore how we can leverage recent advances in Diffusion Models (DM) architectures to generate synthetic network traffic. DM has shown outstanding performance compared to generative models such as GANs in particular with controlled image generation with models such as Dall-E (OpenAI, 2023). The ability to control the generated output makes DMs ideally suited for synthetic data generation for training ML models as it allows the generation of balanced datasets. This will lead to generating more robust and accurate trained models. Nevertheless, DMs have not yet been investigated for network traffic generation. To the best of our knowledge, this is the first attempt at utilizing Diffusion Models for network data generation.
We propose NetDiffus, a framework for network traffic generation using DM leveraging time-series imaging to achieve high fidelity synthetic data. First, we convert 1D network traces to a specific image format called Grammian Angular Summation Field (GASF) (Wang and Oates, 2015) to capture important features from 1D network traces. GASF images can encode features such as packet sizes, inter-packet times and most importantly the correlation among the 1D time-series samples onto an image in 2D space making it a rich source of information for ML models. Second, to reduce the computational demand and to improve the feature learning process in DMs, we apply several simple image processing techniques such as contrast adjustment and image resizing on GASF images. Finally, this enhanced data is used to train DMs and synthetic data from the trained models are used to improve various downstream ML tasks.
The goal of this work is to generate network traffic features, either raw (e.g., packet size) or pre-processed (e.g, bytes downloaded by a group of packets (Bronzino et al., 2019)), in 2D GASF format and use it directly in improving downstream ML tasks (Wang and Oates, 2015; Shankar et al., 2020; Wan et al., [n. d.]; Garibo-i Orts et al., 2023). Note that, unlike recent works (Lin et al., 2020; Yin et al., 2022), NetDiffus does not generate meta-data at this stage.
Leveraging a wide range of network traffic: video, web and IoT, we show that a standard DM can generate data with higher fidelity surpassing the baseline compared. For example, NetDiffus achieves 28.0% and 85.6% fidelity improvement compared to SOTA GAN based models, DoppelGanger (Lin et al., 2020) and NetShare (Yin et al., 2022) respectively. Moreover, we utilize these synthetic data to train ML models related to different network-related tasks, such as traffic fingerprinting, anomaly detection, and classifications in data-limited scenarios. Even without combining with original data, NetDiffus can achieve almost the same accuracy of original data or improved accuracy of 1–57% in those tasks. Comparing with the baselines above, NetDiffus synthetic data can improve classification performance by 4.7–32.3% in the corresponding ML tasks. Artifacts are –hidden for double blind review–.
2. Background and Related work
Synthetic network traffic generation: A Plethora of work has been done in data generation domain (Yin et al., 2022; Lin et al., 2020; Kattadige et al., 2021a; Goodfellow et al., 2020; Croitoru et al., 2023). Markov models and recurrent neural networks are commonly utilized in prior network traffic generation models (Redžović et al., [n. d.]; Lin et al., 2020). Despite the generalization they provide, their fidelity in domain-specific generative tasks remains limited. In the recent past, Generative Adversarial Network (GAN) based models have revolutionized network traffic synthesis, offering powerful capabilities. Generator and discriminator architecture used in GANs can effectively extract the characteristics of network traces with further modification to preserve temporal attributes (Goodfellow et al., 2020; Lin et al., 2020; Yin et al., 2022; Kattadige et al., 2021a; Xu et al., 2019). Despite their promise, GANs suffer from major issues such as mode collapsing, and unstable and inflexible training (Lin et al., 2020; Dhariwal and Nichol, 2021).
Imaging Time Series Data: Converting 1D data into 2D images is widely studied in many works (Wang and Oates, 2015; Said and Erradi, 2019; Fukino et al., 2016; Smith and Smith, 2020, 2021). One motivation for such conversion is the improved performance in downstream analysis tasks, especially in ML-based classification (Wang and Oates, 2015). Also, such image representations are rich with information for ML tasks (Smith and Smith, 2021). Using Gramian matrix and Markov Transition Fields (MTF), the authors in (Wang and Oates, 2015) have converted 1D data into specific images formats called Gramian Angular Summation Field (GASF) and Gramian Angular Difference Field (GADF). These data formats are derivatives of Gramian Angular Field (GAF), generated by converting the time series into a polar coordinate system and mapping the correlation between the 1D samples.
DM and its promise in data generation: DM falls into likelihood-based methods which have more distribution coverage, scalability and stability in training and is a solution for issues such as mode collapse, instability and less flexibility in GAN models (Dhariwal and Nichol, 2021; Guarnera et al., 2023; Rombach et al., 2022). In the forward pass, DM gradually adds Gaussian noise to the input image until it becomes pure noise. Then a DNN model is trained to denoise the image to recover the original image. This trained DNN acts as a generative model which produces images from pure noise distributions. Many recent works have used DMs in tasks such as image, audio, text-to-image and image-to-text generation, nevertheless have not been used in network traffic generation with various network traffic types (Dhariwal and Nichol, 2021; Corvi et al., 2023; Zhang et al., 2022; Croitoru et al., 2023).
In contrast to the previous work, we demonstrate how DMs can be used for network traffic generation by converting time series distribution to 2D GASF images. These images accurately capture feature distributions including correlations between 1D sample points further supporting downstream ML tasks.
3. Design of NetDiffus
3.1. Capturing important feature attributes
DNNs are designed to learn hidden features of input data. However, identifying subtle features such as correlation between the samples, frequency-related patterns from 1D signals or time series, etc., requires complex models and rigorous training processes. Manually extracting such features prior to model training is non-trivial as it can enable the model to learn those features efficiently and improve the data fidelity. To achieve this, in NetDiffus, we convert 1D signals into 2D image format, GASF, following the method in (Wang and Oates, 2015). GASF images map features such as amplitudes, inter-packet gaps and temporal correlations on to one 2D space.
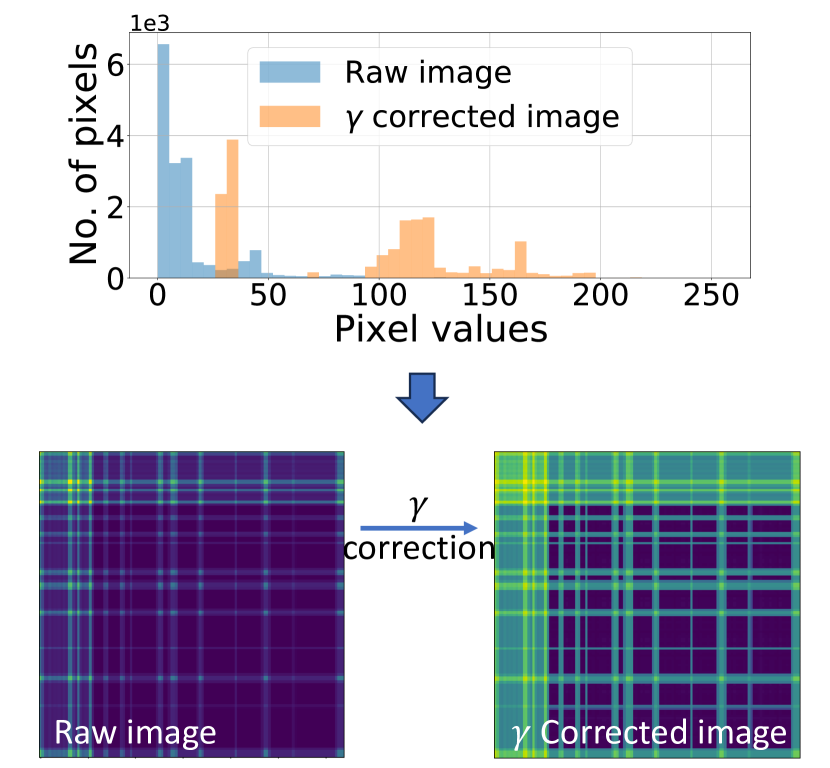
Given a 1D signal of a network feature (e.g., bytes dl (downloaded)), we first convert it to polar coordinates followed by creating the corresponding Grammian matrix. Here, elements of the Grammian matrix denote the inner product between the cosine angles of the samples from the time series in the polar coordinate system, which is the base of the GAF. By taking the inner product, the matrix further represents a correlation map between the sample points in the 1D trace (Wang and Oates, 2015). Then, we create GASF images by taking the summation of all the pairs of elements in row and column directions to remove the dependency on the radius in GAF data. Appendix A further explains GASF conversion. Fig. 1(b) shows a sample GASF image. The width () and height () of the image are equal to the trace length. The main diagonal of the image corresponds to the time-series signal and contains encoded feature amplitudes, inter-packet gaps, etc.
3.2. Highlighting hidden features
As we operate in 2D domain, enhancing the contrasts of GASF images can further highlight subtle feature variations that can be effectively learnt by DMs and improve the fidelity. We leverage standard gamma correction on raw GASF images according to the equation, , where , , and are gamma corrected image, raw image, a constant and gamma variable respectively. We empirically set and . Fig. 1(a) shows the histogram distribution of sample raw and gamma-corrected images. We notice that this process separates the pixel values into distinct ranges increasing the image contrasts and emphasizing the feature variations.
3.3. Supporting fast and stable training
DMs typically require high computational power and time. Hence, keeping the GASF image size similar to the trace length can lead to a longer training time and insufficient resources. As a solution, we resize the images to a fixed smaller resolution and feed low resolution images for DM training. We use OpenCV.resize() method with INTER_AREA interpolation method which resamples image pixels based on area relations and is the preferred method for image decimation (OpenCV, 2023). We empirically decide the image size without affecting the downstream ML performance as image resizing can potentially drop high-frequency information from the images. Also, we max normalize GASF pixel range to [0,1] dividing each pixel by the global maximum value, 255. This makes DM training process faster and more stable. Note that we leverage vectorized operations in Python-numpy to speed up these pixel level operations.
3.4. Overall design of NetDiffus
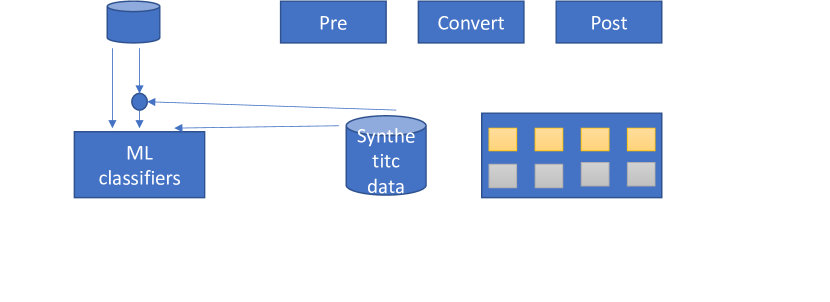
Fig. 1(b) presents the overall process of NetDiffus. We start with time-series feature extraction from related datasets and max normalization. Then, the 1D signals are converted to GASF images which are further enhanced by gamma conversion and resizing the images. Finally, we use these original GASF images to train DMs. Unless otherwise noted, from each dataset, we use the first 80% of the data for synthetic data generation and keep the remaining as the test dataset for the downstream ML tasks. We set diffusion steps to 1000 and a standard U-Net model with 5 layers for the denoising process. The synthesized GASF images are used to improve various downstream ML tasks combined with original GASF data. We will release all the model details with the artefacts.
Interestingly, we observe that a basic DM architecture suffices to generate GASF images with high fidelity. At this stage of NetDiffus, we do not construct the corresponding 1D traces from the GASF images for downstream analysis, on the one hand, for a variety of ML-based analysis, a 2D image is a suitable format (Wang and Oates, 2015; Shankar et al., 2020; Wan et al., [n. d.]; Garibo-i Orts et al., 2023). On the other hand, we observed improved ML classification performance with 2D GASF data compared to its 1D counterpart as described in Appendix B. However, reconstruction of 1D traces can be easily done by applying the Equation: . Here is the vector consisting of the elements in the main diagonal of GASF image (Wang and Oates, 2015; Shankar et al., 2020). We keep further evaluations with reconstructed 1D data in our future work.
4. Evaluation and results
4.1. Setup
4.1.1. Dataset
We collected two main datasets (D1) and D3) and selected one publicly available dataset (D2) to address diverse conditions present in networks.
D1: Streaming videos: We selected videos from YouTube (YT), Stan and Netflix, 20 from each with 3 min duration, and streamed each video multiple times to generate 100 traces. While streaming, we passively captured network packets which are binned into non-overlapping 0.25 s bins to extract Total bytes dl feature in each bin. Binning can highlight different video-specific features (e.g., quality switching) in network traces and increase the performance in downstream ML tasks (Kattadige et al., 2021b; Bronzino et al., 2019). The intended ML task is to fingerprint a given trace into one of the 20 videos from a given platform.
D2: Accessing web pages: We selected publicly available web surfing dataset from (Sirinam et al., 2018) which has 20 websites. The extracted features include packet direction (i.e., (+1) for uplink and (-1) for downlink packets), inter-packet gaps. Each trace has 5000 fixed number of samples. Traces with over 5000 samples, it is truncated and otherwise 0 padded up to 5000 samples. Each traffic trace is classified into one of the 20 classes (i.e., website) as a website fingerprinting task.
D3: Traffic generated by IoT smart-home devices We collected this dataset by passively monitoring the network traffic from two smart home assistance devices Google Home (Google, [n. d.]) and Amazon alexa (Alexa, [n. d.]) smart home devices. A user gives 10 different commands for each device and the device communicates with its cloud server to execute the related activity. By repeating each command, we collected 1000 traces and each trace is kept at 300 packet length following the same trace truncation and 0 padding approach in D2. Captured features include packet size, direction and inter-packet gaps. The ML task is to classify each trace into one of the activities.
The datasets we selected consist of a wide range of features, for example from raw packet sizes to aggregated Total bytes dl values by bins that can be used for a wide range of ML tasks. This further verifies the robustness of NetDiffus for different network-related feature generation along with the efficacy of GASF-based synthetic data for downstream tasks. Based on how we utilize the data for ML training, there are three main scenarios; i) original: use only original data, ii) synth: use only synthetic data, iii) ori+synth: combine original data with synthetic. Unless otherwise noted, we separate data (i.e., network traffic traces) from each class from each dataset into 80%-20% train - test splits which are used to train and test both DMs in data generation and ML models in downstream tasks.
4.1.2. Benchmark models
DoppelGanger (DG) (Lin et al., 2020): A GAN based approach which generates both metadata and traffic features of the traces while finding their correlations.
We train NetDiffus using one of their datasets, Wikipedia Web Traffic (WW), first, to compare DG with NetDiffus while preserving its original attributes, and second, to show the robustness of NetDiffus to different datasets.
NetShare (Yin et al., 2022): SOTA GAN-based method for packet/flow header generation taking them as time-series data compared to tabular format.
Though the base model considered is DG, the authors claim that with the proposed packet/flow data epochs merging mechanism, the scalability of the generation has been increased with improved fidelity in synthetic data. We train Netshare using D3-Google and D3-Alexa datasets as these datasets are compatible with packet-level data generation in Netshare.
Note: DG and NetShare have outperformed many other ML based and statistical approaches (Esteban et al., 2017; Yoon et al., 2019; Cheng, 2019; Xu et al., 2020), and therefore, we exclude other GAN methods and ML based approaches from the comparison. Since these models synthesize 1D data, we convert 1D synthetic traces from those models to GASF images before the comparison.
4.2. Analysis of data fidelity
We use the metric FID (Frechet Inception Distance) (Chong and Forsyth, 2020) to evaluate fidelity in synthetic traces.111FID is a metric used to measure fidelity in images. FID values are commonly observed for high fidelity data (Song and Ermon, 2020; Ravuri and Vinyals, 2019; Chong and Forsyth, 2020). A lower FID score means that the original and synthetic images have a close distribution and vice-versa. In these experiments, we pair-wise compare randomly selected synthetic traces from each class with corresponding original traces used to train the model. Fig. 2(a) shows that, overall, D1 data has a lower FID score compared to others which is less than 9 on average. D3–Alexa, shows the highest FID score, 25.8 (11.9), because of the overlap in the features between classes for some traces in the original dataset. We further analyze the histogram distribution between original and synthetic data in Appendix C.1.
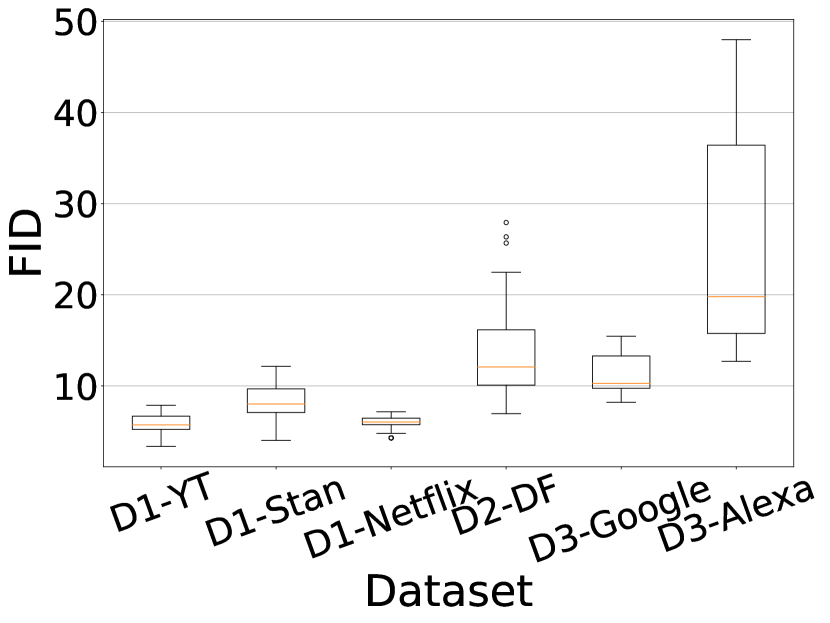
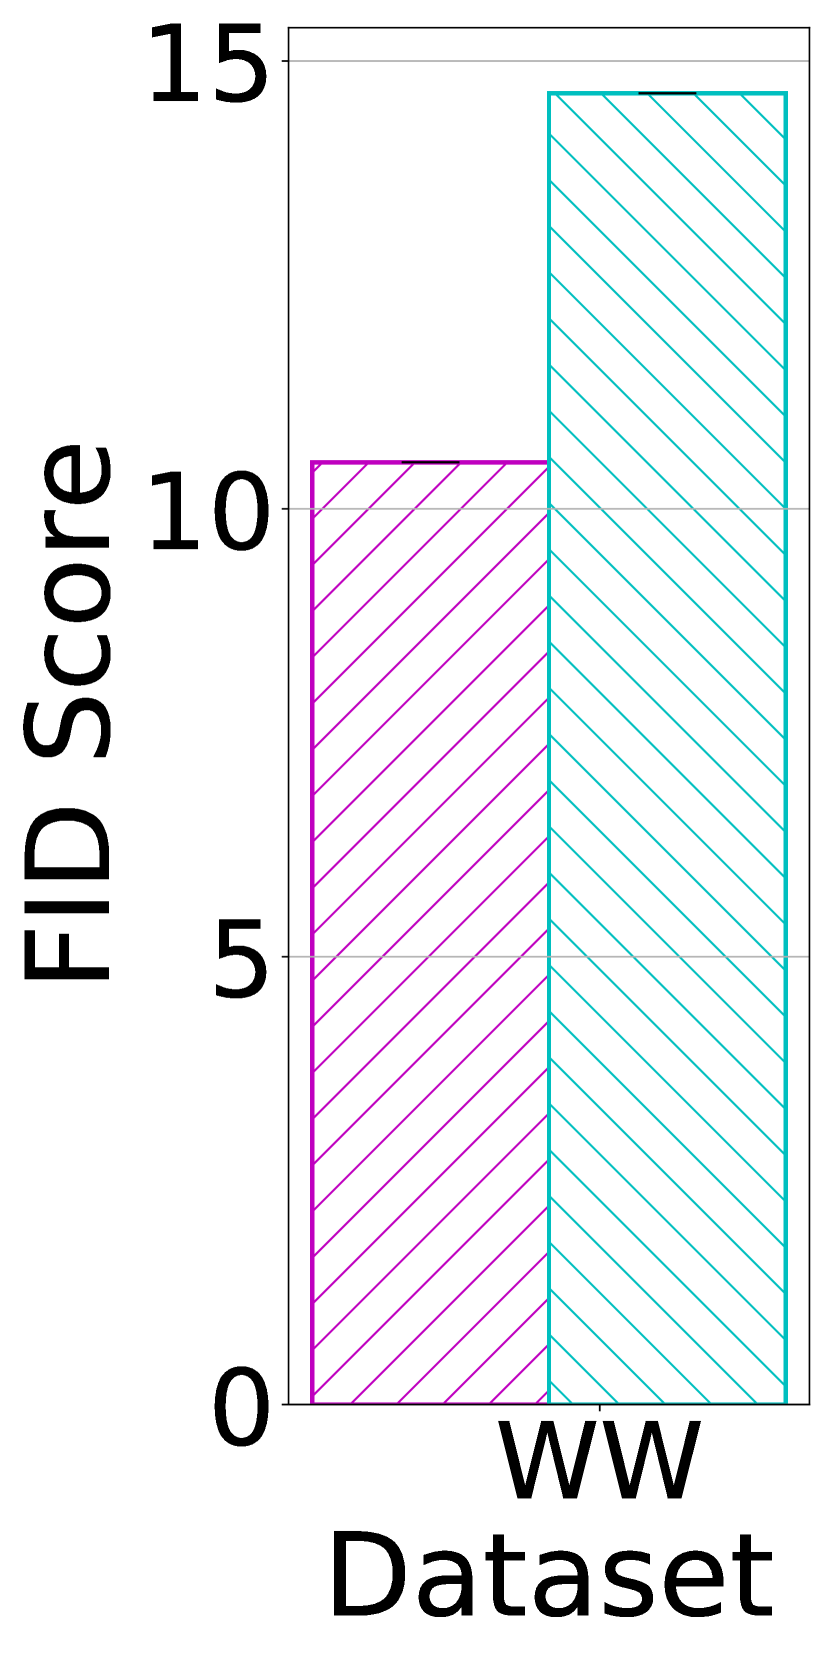
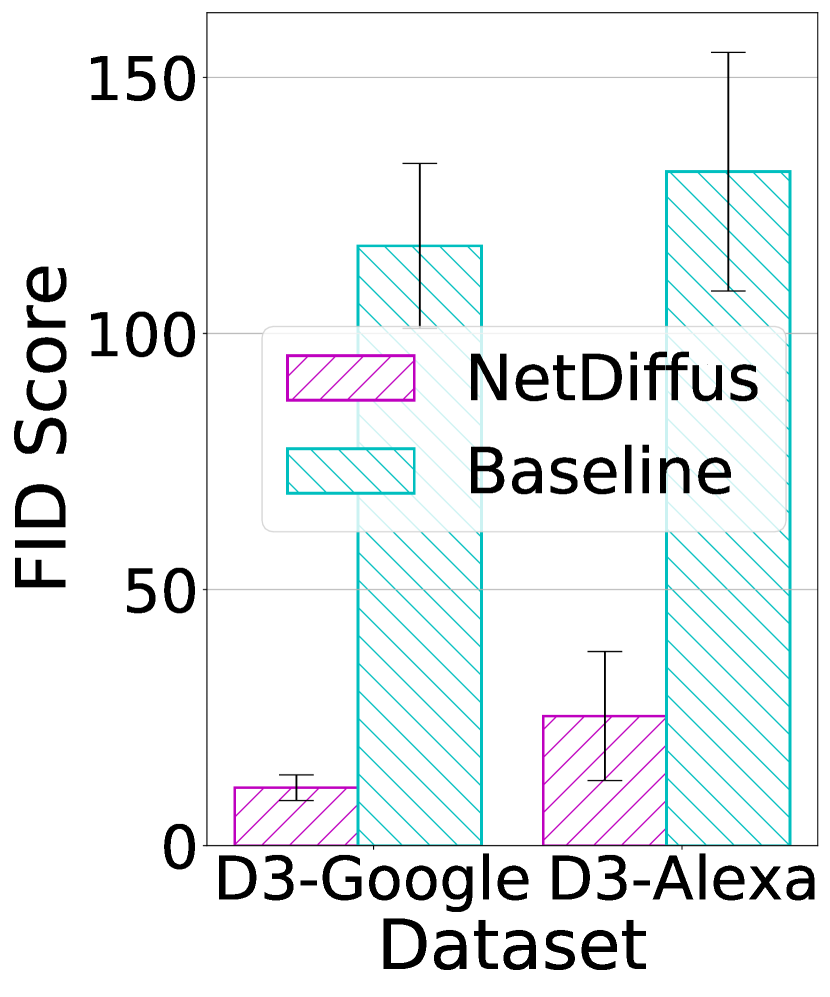
Fig. 2(b) and Fig. 2(c) compares the FID scores between NetDiffus and the baselines: DG and Netshare respectively. Overall, NetDiffus outperforms all the baselines by an average FID value difference of 72.8 which is equivalent to 66.4% gain. NetDiffus surpasses DG by 4.1 (i.e., a gain of 28%) showing its applicability to new datasets, and the model significantly outperforms Netshare by around 105 of average FID score difference (i.e., a gain of 85.6%). The main reason for lower fidelity in Netshare is that the model is not able to learn packet size distributions and correlations over a wide range (e.g., 0-1500 bytes) despite the model robustness claimed (Yin et al., 2022). Though we do not evaluate NetDiffus fidelity in 1D domain after reversing GASF conversion, the higher fidelity in 2D GASF format indicates the high fidelity in 1D domain as well.
4.3. Performance in downstream ML models
4.3.1. ML accuracy comparison with baselines:
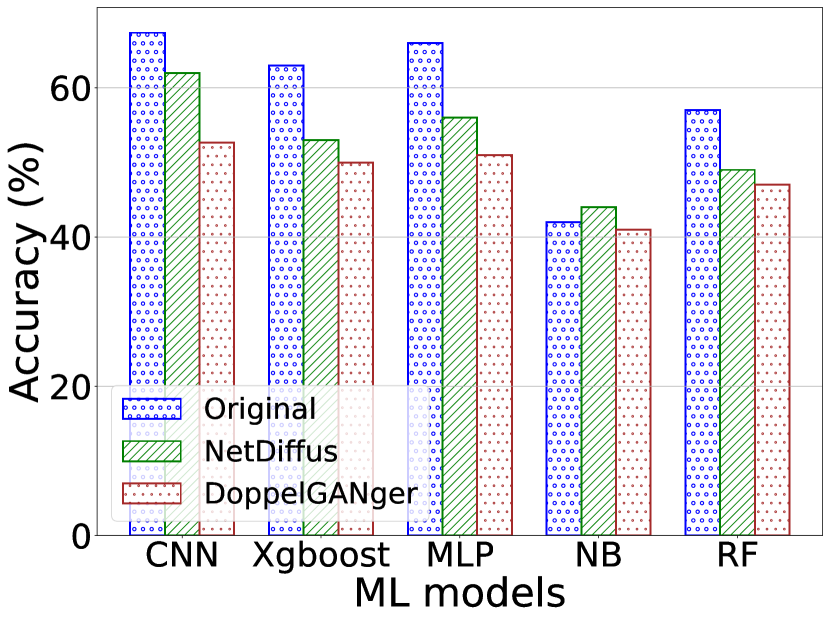
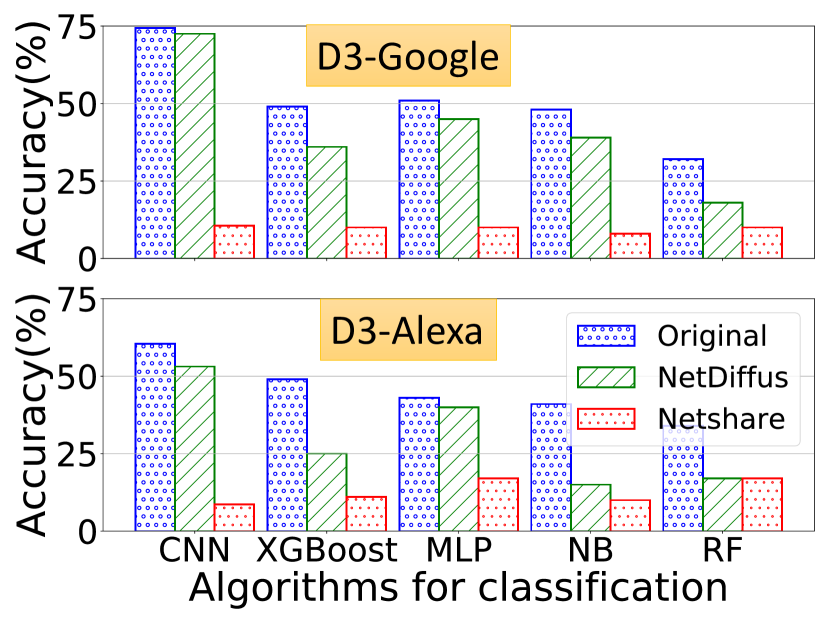
Fig. 3(a) compares the NetDiffus with DG model using five classification ML algorithms (Convolutional Neural Network (CNN), XGBoost, Multi-Layer Perceptron (MLP), Naive Bayes (NB), Random Forest (RF)). We classify the type of access to Wiki pages, e.g. mobile, desktop, etc. in WW trace for original and synth scenarios taking an equal number of synthetic samples from NetDiffus and DG. In all ML models, NetDiffus exceeds the DG accuracy, which is 4.67% on average. Similarly, in Fig. 3(b), for both D3-Google and D3-Alexa datasets, NetDiffus outperforms Netshare by an average difference of 32.3% and 17.3% respectively. These results indicates that NetDiffus can outperform many SOTA data generation models.
4.3.2. Performance in different downstream ML models:
By considering multiple downstream ML algorithms in Fig. 3, we further show that NetDiffus synthetic data can be used to evaluate different downstream ML algorithms as well. This is important when utilizing synthetic data to tune models in load balancing, cluster scheduling etc. (Lin et al., 2020). A key property of synthetic data to achieve this goal is they should have accuracy trends similar to that of original data in different algorithms. Except for the D3-Alexa-MLP evaluation in Fig. 3(b)-bottom, NetDiffus synthetic data follows similar accuracy patterns to its original data in all other cases. For example, in Fig. 3(a), CNN, XGBoost and MLP show higher classification accuracy with both original and NetDiffus data and both datasets show lower accuracy with NB.
4.4. Improved ML performance in use-cases
4.4.1. Surveillance through traffic fingerprinting
ML has been widely applied for the surveillance of network traffic, nonetheless, it can show limited performance due to the shortage of training data. In this use-case, we analyze how traffic fingerprinting tasks can be optimized by NetDiffus synthetic data. We leverage a hierarchical ML classifier under three types of classification : L1: Traffic type (e.g., video, web or IoT), L2: Platform type (e.g., YT, Stan), and L3: Individual classes (e.g., individual video, website).
Results and observation: Table 1 reports classification accuracy. We observe both L1 and L2 provide over 95% accuracy in both original and synth scenarios. L3 is a challenging task compared to L1 and L2 due to the higher number of classes and the similarities in traces we notice between the classes. In D1, video fingerprinting task we see 3.5–6.5% accuracy improvement in synth scenario compared to original data mainly due to the high fidelity in synthetic data Though we see 5.83% average accuracy drop in D2 and D3 in synth scenarios compared to original, referring to recent literature (Lin et al., 2020; Yin et al., 2022) and considering the difficulty in tasks, we believe such accuracy levels are still acceptable. However, by combining original with synthetic data, we achieve improved accuracy compared to original scenario by 1–8%.
| Layer (type) | Data used | original | synth | ori+synth |
| L1 (Traffic) | D1+D2+D3 | 99.0 | 100.0 | 100.0 |
| L2 (Platform) | D1 | 100.0 | 100.0 | 100.0 |
| D3 | 97.0 | 96.5 | 98.5 | |
| L3 (Class) | D1-YT | 84.5 | 91.0 | 92.5 |
| D1-Stan | 92.5 | 98.5 | 99.5 | |
| D1-Netflix | 97.5 | 100.0 | 100.0 | |
| D2-DF | 92.0 | 83.8 | 93.64 | |
| D3-Google | 74.4 | 72.5 | 77.0 | |
| D3-Alexa | 60.5 | 53.1 | 62.0 |
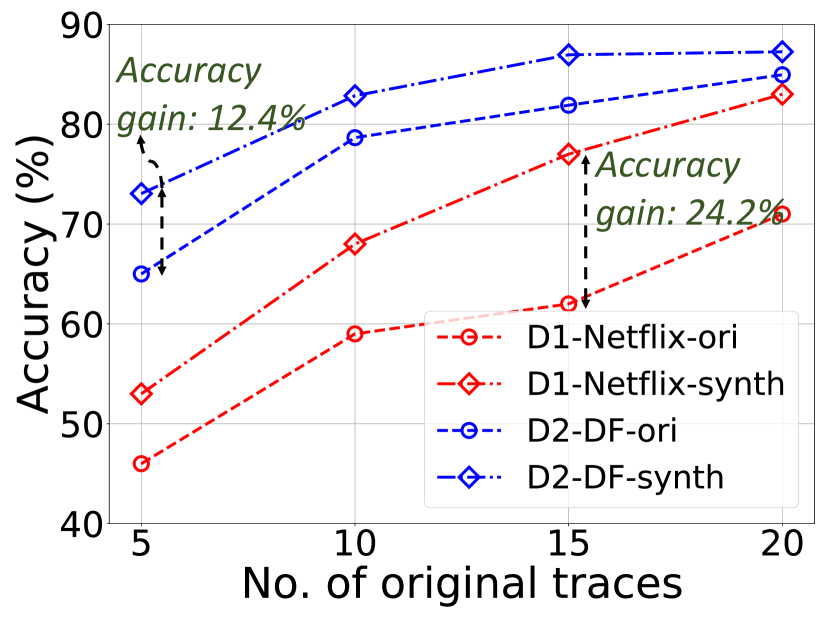
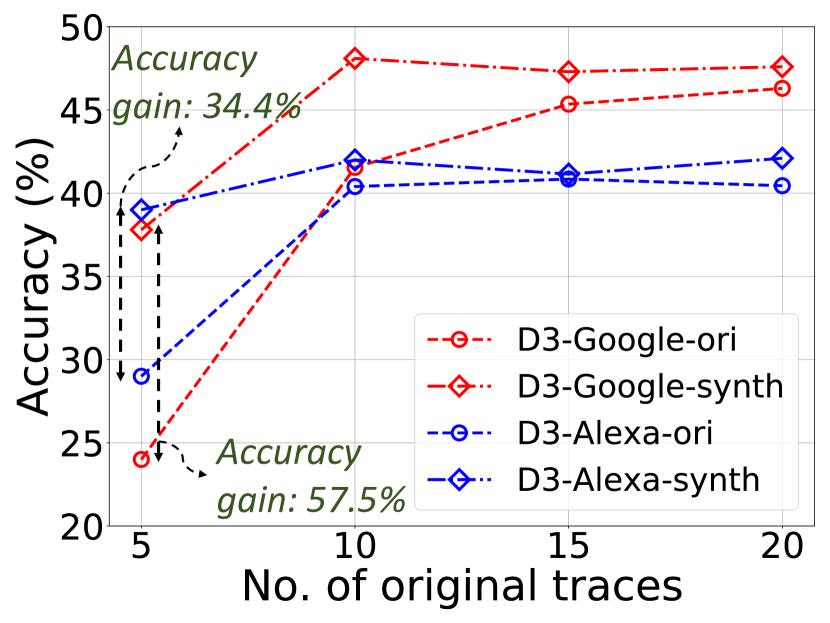
A limited number of original traces is a challenging scenario which hinders the above ML performance. To see the support by NetDiffus to improve the downstream ML accuracy, we change the number of original traces on NetDiffus data generation and add the resulting synthetic traces to train the ML models. Fig. 4 reveals that when the number of original traces is limited, NetDiffus synthetic traces can exceed the accuracy of original data. In Fig. 4(a), D2-DF synth achieves 12.4% accuracy gain and, in Fig. 4(b), D3-Google synth obtain 57.5% accuracy gain compared to corresponding original scenarios. This is in contrast to the lower performances in synth scenario in Table 1 and highlights the advantages of NetDiffus in data-limited use cases.
4.4.2. Anomaly detection:
Anomaly detection often struggles with collecting sufficient malicious data to train models. We extend the D1 video fingerprinting at L3 while creating a class imbalance when training the ML models to mimic real world anomaly detection. We assume that randomly selected two classes with a limited number of traces are anomalies and another set of five classes with all available training traces are legitimate.
We analyze two sub-cases. i) sub-case 1: Ground truth data is available for both legitimate and anomaly classes. In this case, we simply calculate the accuracy of anomaly trace classification. To mimic the shorter duration and further generalize anomalous behaviour, we limit the trace length from 180s (Full trace) to first 45s. ii) sub-case 2: Ground truth labels are available only for legitimate classes. During the test phase, we measure the uncertainty of classification based on the entropy of classification results following a deep ensembling approach (Sensoy et al., 2018). For the legitimate and anomaly traces, a lower and a higher uncertainty are expected respectively.
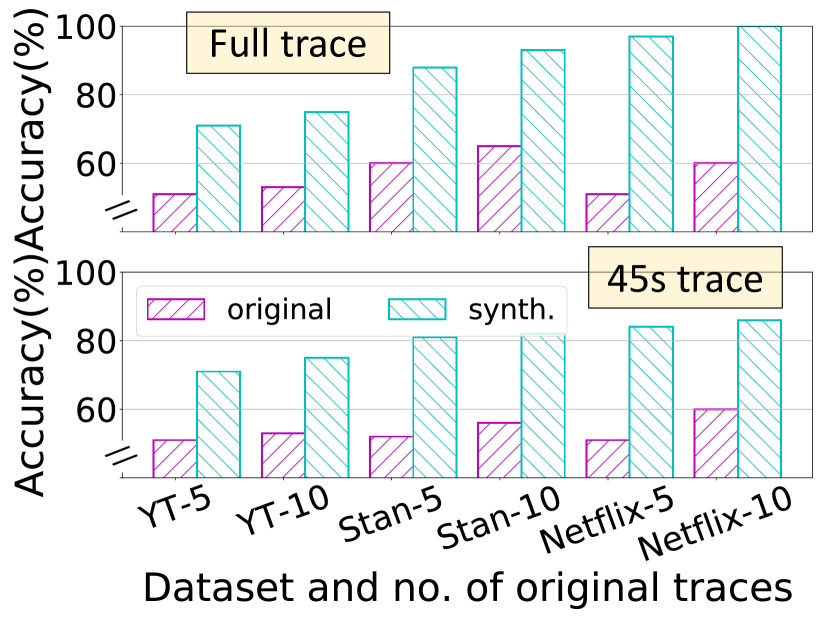
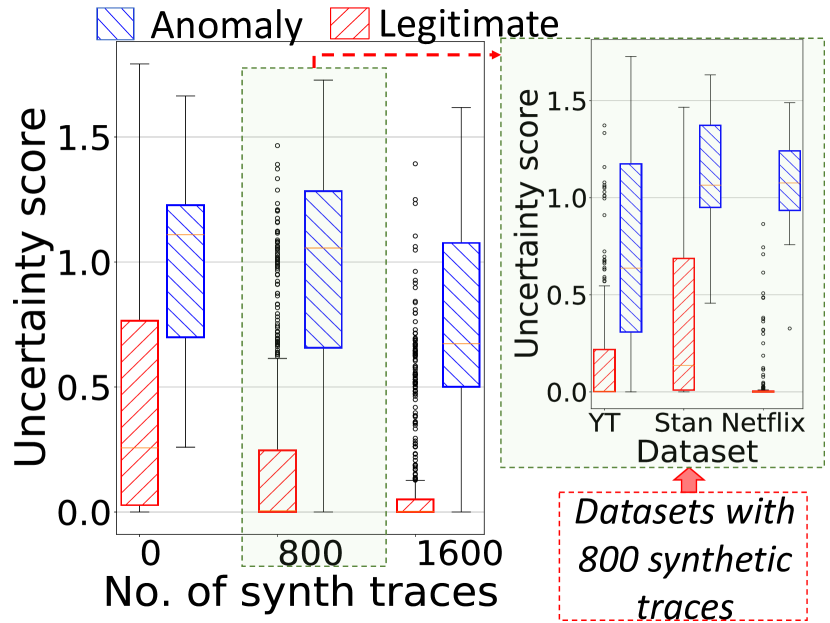
Results and observation: In sub-case 1 (Fig. 5(a)), for Full and 45s lengths, adding synthetic traces provide 54.6(18.3)% and 48.5(9.0)% of average gain respectively, compared to having only original data. We see that gain achieved is higher when the number of original data is limited. For example, Netflix-5 achieves 90.2% average accuracy gain compared to Netflix-10 which has only 66.7%. Fig. 5(b) presents the uncertainty comparison for legitimate and anomaly detection. In a gist, synthetic traces reduce the uncertainty of the predictions for legitimate samples (e.g., 0.75 on average at 1600 synth traces), whereas, the uncertainty for anomaly samples remains high. This higher uncertainty score is an indication to decide whether a given trace is an anomaly (Sensoy et al., 2018). This is further verified in the extended graph showing the score for different datasets at 800 synth data step. We notice a 0.74 and 1.01 average uncertainty difference between legitimate and anomaly data for Stan and Netflix respectively further evidencing the support of NetDiffus for anomaly detection.
4.4.3. Near real-time classification
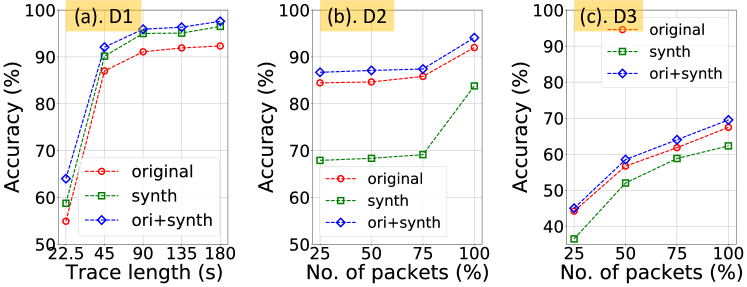
We analyze the NetDiffus support for near real-time classification representing a scenario in which only a part of the network trace is extracted without waiting for the entire trace. We assume that we can identify the beginning of the network trace. The corresponding GASF images are generated by cropping the initial GASF images from the bottom and right directions representing the 1D trace with limited data. We leverage L3 classification in Section 4.4.1. We train multiple classifiers for different trace lengths which are measured in trace length for D1 and percentage number of packets for D2 and D3.
Results and observation: Fig. 6(a) shows that with having only 45s worth of data, D1 data can achieve over 92% accuracy in ori+synth scenario which is 5.7% accuracy gain compared to original. Though synth accuracy is less than the original scenario, on the one hand, ori+synth accuracy always outperforms original scenario in D2 and D3 data in Fig. 6(b) and Fig. 6(c) respectively. On the other hand, synth accuracy follows the same increasing trend in original and ori+synth, and eventually, reducing the accuracy gap with original, for example in D2. Empirically, we observe GASF conversion takes time in the millisecond range (i.e., around 10 ms) without affecting overall inference process.
4.5. Comparison with 1D DM
We compare L3 classification for D1-Netflix and D3-Google between synthetic data from 1D and 2D DMs from NetDiffus. We follow, a similar architecture to NetDiffus DM when developing corresponding 1D DM and use the 1D traces to train them. Once the 1D synthetic traces are generated, we convert them to 2D GASF images for downstream ML classification. Table 2 reports that in all scenarios, synthetic data from 2D DMs in NetDiffus overpass the data from 1D DMs and achieves almost the same original accuracy. For instance, in synth scenario, NetDiffus data achieve 37.8% and 30.2% accuracy improvement over 1D DMs data for D1-Netflix and D3-Google respectively. We further measure a lower FID score for 2D DMs data which is 77% and 36% less than synthetic data from 1D DM in D1-Netflix and D3-Google respectively. These results reveal that 2D DMs in NetDiffus can perform better than its 1D counterpart.
| Dataset | original (%) | synth (%) | ori+synth (%) | ||
| 1D | 2D | 1D | 2D | ||
| D1-Netflix | |||||
| D3-Google | |||||
5. Conclusion
We presented NetDiffus, a diffusion model (DM) based network traffic generation tool. It converts time-series network traffic data into a specific image format called Grammian Angular Summation Field (GASF). While addressing multiple challenges related to synthetic network traffic generation to achieve higher data fidelity, we also demonstrate the effectiveness of synthetic data in GASF format in various downstream ML tasks to improve their classification performance. Furthermore, we show that NetDiffus exceeds the performance of SOTA GAN-based approaches and 1D DMs.
Although we have considered only single-variate time series, we can easily extend NetDiffus for multi-variate time series and also accommodate metadata with a suitable mapping to integer values, by stacking up channels to a single image. At this stage, NetDiffus deals with fixed lower image size to reduce the DM training time and to improve the scalability. To add more variability in image sizes to represent different 1D trace lengths, we aim to leverage the stable/latent diffusion models which use lower dimensional embeddings of the input data (Blattmann et al., 2023; Schramowski et al., 2023). This can improve the scalability as well as the fidelity of the data. Privacy is yet another aspect we have not evaluated at this stage of NetDiffus. We plan to introduce differentially private noise in the denoising process of DMs to synthesise privacy-aware datasets.
Appendices
Appendix A GASF conversion in detail
First, a , a normalized 1D signal (i.e., value range is between 0–1) where and is the number of samples, will be converted to polar coordinates as in Eq. (1) and Eq. (2).
| (1) |
| (2) |
where, is the timestamp of sample and is a constant factor to regularize the radius.
Then, in the polar coordinate system, the angular perspective can be easily exploited by considering the trigonometric sum between each point to identify the temporal correlation within different time intervals. Eq. 3 shows how the GASF is formed. Here denotes the unit row vector, , is the transpose of and
| (3) |
Further, setting [0,1] as the sample range of GASF images will add a bijective property to GASF images and hence, the time series can be traced back from the image.
Appendix B Improvement in ML by imaging network traces
Table 3 reports the classification accuracy for D1 dataset comparing original 1D traces and its corresponding GASF conversion. 1D and 2D classification models have the same architecture except the 1D and 2D convolutional layers in the respective models. For all proportions of training data, 2D GASF exceeds the 1D time series accuracy by 1.5–13% showing the improved performance by GASF conversion.
| Platform | 80% data | 40% data | 20% data | |||
| D1- | 1D | 2D | 1D | 2D | 1D | 2D |
| YT | 90.5 | 92.5 | 85.5 | 87.0 | 71.0 | 75.0 |
| Stan | 91.0 | 99.0 | 96.0 | 98.0 | 90.0 | 93.0 |
| Netflix | 83.0 | 100.0 | 84.0 | 97.0 | 78.0 | 88.0 |
Appendix C Further analysis
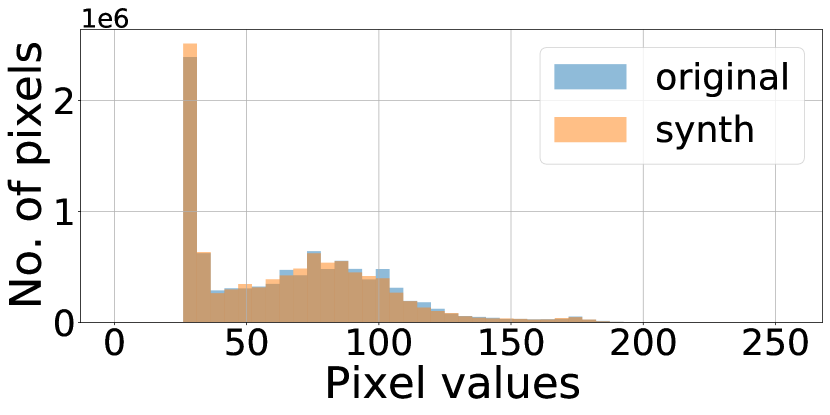
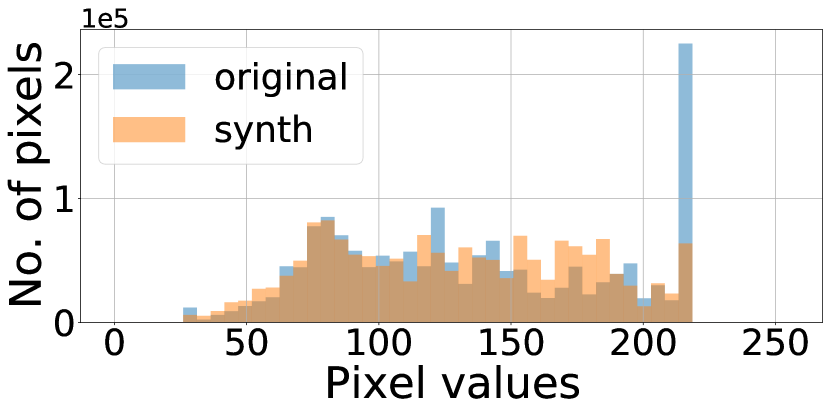
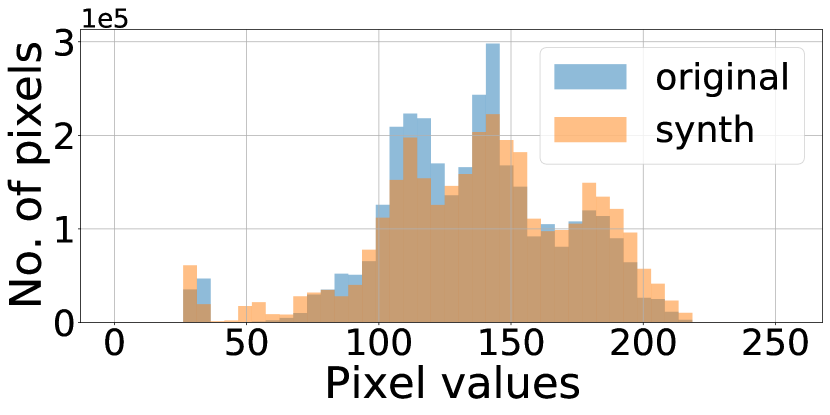
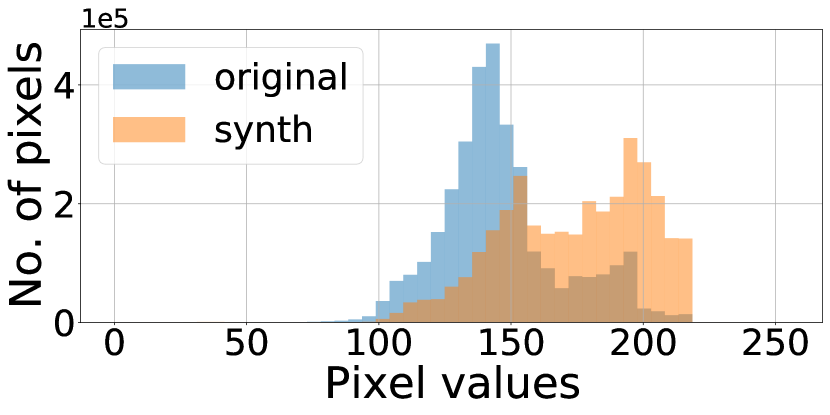
C.1. Histograms of D3 original and synth
We compare the histograms between original and synth GASF images from D1, D2 and D3 in Fig. 7. Overall, original and synthetic data have a similar distribution preserving a wide range of pixel values. We observe a noticeable difference in the distribution of D3-Alexa in Fig. 7(d). This is due to the higher similarity between the classes that has hindered DMs learning unique differences between D3-Alexa classes. These high overlaps between histograms verify that attributes such as packet size, and temporal correlations that were mapped onto the original GASF images are still maintained in NetDiffus synthetic data.
C.2. Impact of adding synthetic data
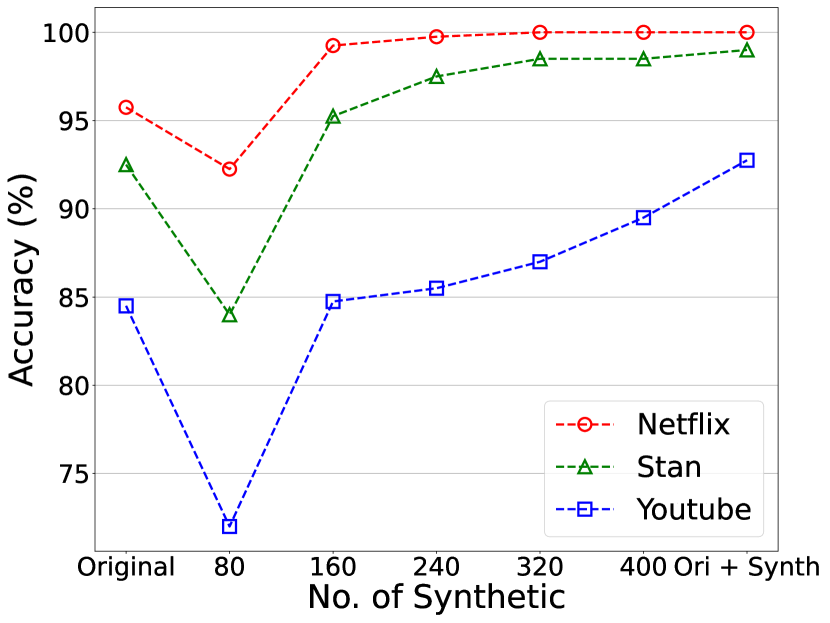
Fig. 8 illustrates the accuracy variation when gradually adding the synthetic data. We start from the original scenario and the numerical values in the x-axis show the number of synthetic images added in synth scenario (i.e., having only synthetic images). Last index in the x-axis indicates the ori+synth scenario. Fig. 8(a) shows that even with 160 synthetic data all three datasets in D1 can surpass or achieve the same accuracy of original data. Though we observe a sudden drop in synth scenario for D3 data, adding synthetic data shows a gradual increase in accuracy for D3 data in Fig. 8(b), and eventually exceeds the original accuracy in ori+synth scenario.

References
- (1)
- Alexa ([n. d.]) Alexa. [n. d.]. Amazon alexa. https://alexa.amazon.com/
- Blattmann et al. (2023) Andreas Blattmann, Robin Rombach, Huan Ling, Tim Dockhorn, Seung Wook Kim, Sanja Fidler, and Karsten Kreis. 2023. Align your latents: High-resolution video synthesis with latent diffusion models. In Proceedings of the IEEE/CVF Conference on Computer Vision and Pattern Recognition. 22563–22575.
- Bronzino et al. (2019) Francesco Bronzino, Paul Schmitt, Sara Ayoubi, Guilherme Martins, Renata Teixeira, and Nick Feamster. 2019. Inferring streaming video quality from encrypted traffic: Practical models and deployment experience. Proceedings of the ACM on Measurement and Analysis of Computing Systems 3, 3 (2019), 1–25.
- Cheng (2019) Adriel Cheng. 2019. PAC-GAN: Packet generation of network traffic using generative adversarial networks. In 2019 IEEE 10th Annual Information Technology, Electronics and Mobile Communication Conference (IEMCON). IEEE, 0728–0734.
- Chong and Forsyth (2020) Min Jin Chong and David Forsyth. 2020. Effectively unbiased fid and inception score and where to find them. In Proceedings of the IEEE/CVF conference on computer vision and pattern recognition. 6070–6079.
- Corvi et al. (2023) Riccardo Corvi, Davide Cozzolino, Giada Zingarini, Giovanni Poggi, Koki Nagano, and Luisa Verdoliva. 2023. On the detection of synthetic images generated by diffusion models. In ICASSP 2023-2023 IEEE International Conference on Acoustics, Speech and Signal Processing (ICASSP). IEEE, 1–5.
- Croitoru et al. (2023) Florinel-Alin Croitoru, Vlad Hondru, Radu Tudor Ionescu, and Mubarak Shah. 2023. Diffusion models in vision: A survey. IEEE Transactions on Pattern Analysis and Machine Intelligence (2023).
- Dhariwal and Nichol (2021) Prafulla Dhariwal and Alexander Nichol. 2021. Diffusion models beat gans on image synthesis. Advances in Neural Information Processing Systems 34 (2021), 8780–8794.
- Dimopoulos et al. (2016) Giorgos Dimopoulos, Ilias Leontiadis, Pere Barlet-Ros, and Konstantina Papagiannaki. 2016. Measuring video QoE from encrypted traffic. In Proceedings of the 2016 Internet Measurement Conference. 513–526.
- Esteban et al. (2017) Cristóbal Esteban, Stephanie L Hyland, and Gunnar Rätsch. 2017. Real-valued (medical) time series generation with recurrent conditional gans. arXiv preprint arXiv:1706.02633 (2017).
- Fukino et al. (2016) Miwa Fukino, Yoshito Hirata, and Kazuyuki Aihara. 2016. Coarse-graining time series data: Recurrence plot of recurrence plots and its application for music. Chaos: An Interdisciplinary Journal of Nonlinear Science 26, 2 (2016), 023116.
- Garibo-i Orts et al. (2023) Òscar Garibo-i Orts, Nicolas Firbas, Laura Sebastiá, and J Alberto Conejero. 2023. Gramian angular fields for leveraging pretrained computer vision models with anomalous diffusion trajectories. Physical Review E 107, 3 (2023), 034138.
- Goodfellow et al. (2020) Ian Goodfellow, Jean Pouget-Abadie, Mehdi Mirza, Bing Xu, David Warde-Farley, Sherjil Ozair, Aaron Courville, and Yoshua Bengio. 2020. Generative adversarial networks. Commun. ACM 63, 11 (2020), 139–144.
- Google ([n. d.]) Google. [n. d.]. Compare smart displays. https://store.google.com/au/magazine/compare_nest_hub?hl=en-GB
- Guarnera et al. (2023) Luca Guarnera, Oliver Giudice, and Sebastiano Battiato. 2023. Level Up the Deepfake Detection: a Method to Effectively Discriminate Images Generated by GAN Architectures and Diffusion Models. arXiv preprint arXiv:2303.00608 (2023).
- Hussain et al. (2020) Fatima Hussain, Syed Ali Hassan, Rasheed Hussain, and Ekram Hossain. 2020. Machine learning for resource management in cellular and IoT networks: Potentials, current solutions, and open challenges. IEEE Communications Surveys & Tutorials 22, 2 (2020), 1251–1275.
- Iperf.fr (2023) Iperf.fr. 2023. iPerf - The ultimate speed test tool for TCP, UDP and SCTP. https://iperf.fr/. [Online; accessed 19-June-2023].
- Kattadige et al. (2021a) Chamara Kattadige, Shashika R Muramudalige, Kwon Nung Choi, Guillaume Jourjon, Haonan Wang, Anura Jayasumana, and Kanchana Thilakarathna. 2021a. VideoTrain: A generative adversarial framework for synthetic video traffic generation. In 2021 IEEE 22nd International Symposium on a World of Wireless, Mobile and Multimedia Networks (WoWMoM). IEEE, 209–218.
- Kattadige et al. (2021b) Chamara Kattadige, Aravindh Raman, Kanchana Thilakarathna, Andra Lutu, and Diego Perino. 2021b. 360NorVic: 360-degree video classification from mobile encrypted video traffic. In Proceedings of the 31st ACM Workshop on Network and Operating Systems Support for Digital Audio and Video. 58–65.
- Lin et al. (2020) Zinan Lin, Alankar Jain, Chen Wang, Giulia Fanti, and Vyas Sekar. 2020. Using GANs for sharing networked time series data: Challenges, initial promise, and open questions. In Proceedings of the ACM Internet Measurement Conference. 464–483.
- NS3 (2023) NS3. 2023. NS-3 Network Simulator. https://www.nsnam.org/. [Online; accessed 19-June-2023].
- OpenAI (2023) OpenAI. 2023. DALL-E@. https://openai.com/dall-e-2. [Online; accessed 19-June-2023].
- OpenCV (2023) OpenCV. 2023. Geometric Image Transformations. https://docs.opencv.org/3.4/da/d54/group__imgproc__transform.html. [Online; accessed 19-June-2023].
- Ravuri and Vinyals (2019) Suman Ravuri and Oriol Vinyals. 2019. Classification accuracy score for conditional generative models. Advances in neural information processing systems 32 (2019).
- Redžović et al. ([n. d.]) Hasan Redžović, Aleksandra Smiljanić, and Milan Bjelica. [n. d.]. IP Traffic Generator Based on Hidden Markov Models. parameters 1, 2 ([n. d.]), 1.
- Rombach et al. (2022) Robin Rombach, Andreas Blattmann, Dominik Lorenz, Patrick Esser, and Björn Ommer. 2022. High-resolution image synthesis with latent diffusion models. In Proceedings of the IEEE/CVF Conference on Computer Vision and Pattern Recognition. 10684–10695.
- Said and Erradi (2019) Ahmed Ben Said and Abdelkarim Erradi. 2019. Deep-Gap: A deep learning framework for forecasting crowdsourcing supply-demand gap based on imaging time series and residual learning. In 2019 IEEE International Conference on Cloud Computing Technology and Science (CloudCom). IEEE, 279–286.
- Schramowski et al. (2023) Patrick Schramowski, Manuel Brack, Björn Deiseroth, and Kristian Kersting. 2023. Safe latent diffusion: Mitigating inappropriate degeneration in diffusion models. In Proceedings of the IEEE/CVF Conference on Computer Vision and Pattern Recognition. 22522–22531.
- Sensoy et al. (2018) Murat Sensoy, Lance Kaplan, and Melih Kandemir. 2018. Evidential deep learning to quantify classification uncertainty. Advances in neural information processing systems 31 (2018).
- Shahid et al. (2020) Mustafizur R Shahid, Gregory Blanc, Houda Jmila, Zonghua Zhang, and Hervé Debar. 2020. Generative deep learning for Internet of Things network traffic generation. In 2020 IEEE 25th Pacific Rim International Symposium on Dependable Computing (PRDC). IEEE, 70–79.
- Shankar et al. (2020) Anand Shankar, Hnin Kay Khaing, Samarendra Dandapat, and Shovan Barma. 2020. Epileptic seizure classification based on Gramian angular field transformation and deep learning. In 2020 IEEE Applied Signal Processing Conference (ASPCON). IEEE, 147–151.
- Sirinam et al. (2018) Payap Sirinam, Mohsen Imani, Marc Juarez, and Matthew Wright. 2018. Deep fingerprinting: Undermining website fingerprinting defenses with deep learning. In Proceedings of the 2018 ACM SIGSAC Conference on Computer and Communications Security. 1928–1943.
- Smith and Smith (2020) Kaleb E Smith and Anthony O Smith. 2020. Conditional GAN for timeseries generation. arXiv preprint arXiv:2006.16477 (2020).
- Smith and Smith (2021) Kaleb E Smith and Anthony O Smith. 2021. A spectral enabled gan for time series data generation. arXiv preprint arXiv:2103.01904 (2021).
- Song and Ermon (2020) Yang Song and Stefano Ermon. 2020. Improved techniques for training score-based generative models. Advances in neural information processing systems 33 (2020), 12438–12448.
- Wan et al. ([n. d.]) Xiangkui Wan, Jing Luo, Yang Liu, Jiale Xu, Xiaoyu Mei, and Yunfan Chen. [n. d.]. A Novel Arrhythmia Classification Method Based on GASF and Optimized Inception-Resnet-v2. Available at SSRN 4176688 ([n. d.]).
- Wang and Oates (2015) Zhiguang Wang and Tim Oates. 2015. Imaging time-series to improve classification and imputation.
- Xu et al. (2019) Lei Xu, Maria Skoularidou, Alfredo Cuesta-Infante, and Kalyan Veeramachaneni. 2019. Modeling tabular data using conditional gan. Advances in Neural Information Processing Systems 32 (2019).
- Xu et al. (2020) Shengzhe Xu, Manish Marwah, and Naren Ramakrishnan. 2020. Stan: Synthetic network traffic generation using autoregressive neural models. In arXiv preprint arXiv:2009.12740.
- Yin et al. (2022) Yucheng Yin, Zinan Lin, Minhao Jin, Giulia Fanti, and Vyas Sekar. 2022. Practical gan-based synthetic ip header trace generation using netshare. In Proceedings of the ACM SIGCOMM 2022 Conference. 458–472.
- Yoon et al. (2019) Jinsung Yoon, Daniel Jarrett, and Mihaela Van der Schaar. 2019. Time-series generative adversarial networks. Advances in neural information processing systems 32 (2019).
- Zhang et al. (2022) Mingyuan Zhang, Zhongang Cai, Liang Pan, Fangzhou Hong, Xinying Guo, Lei Yang, and Ziwei Liu. 2022. Motiondiffuse: Text-driven human motion generation with diffusion model. arXiv preprint arXiv:2208.15001 (2022).