Comparative study of light storage in antirelaxation-coated and buffer-gas-filled alkali vapor cells
Abstract
We perform a comparative study of light storage in antirelaxation-coated and buffer-gas-filled alkali vapor cells using electromagnetically induced transparency (EIT) in warm rubidium vapor. The use of a buffer-gas-filled cell resulted in 10-fold improvement in storage time and efficiency compared to antirelaxation-coated cells. We achieve up to sixfold enhancement in buffer-gas-filled memory efficiency, while maintaining a similar memory lifetime, by employing a near-resonant EIT -scheme instead of a resonant one. Our findings contribute to the development of field-deployable quantum memories.
I I. Introduction
The ability to store and retrieve light pulses on demand has spurred the development of quantum memory (QM), a core enabling device of most common quantum repeater schemes designed to enable the realization of long-distance quantum communication [1]. Further perspective applications of QMs include synchronization of single photon sources [2], producing multiphoton states [3], linear optical computing, metrology, magnetometry, and single photon detection [4].
QMs are used to store and retrieve single photons, i.e. non-classical light, and are characterized by several figures of merit, such as fidelity, storage efficiency, storage time, and bandwidth. Several systems and different protocols have been used to implement QMs [9, 10]. Laser-cooled atomic ensembles [8, 6, 7], and atomic ensembles in rare-earth-ion doped crystals [5] achieve long storage times, high fidelity and efficiency. However, they are very complex in terms of technical performance, and therefore not field-deployable and scalable.
QMs implemented in the warm atomic vapors are receiving growing attention in the literature [21, 11, 22, 13, 14]. They demonstrate promising memory performances, are compatible with single-photon sources, and are technologically simple. At the heart of such a memory is the atomic vapor cell. In order to reduce the decoherence of the ground state due to the collisions of atoms with the cell walls, vapor cells filled with a buffer gas or vapor cells with an antirelaxation coating deposited on the inner surfaces of the cell can be used.
In the most common realizations of QMs, buffer-gas-filled alkali vapor cells are used. For example, in [13] the fidelity retrieval of at storage efficiency and up to 1 ms storage time has been demonstrated for QM operating with few photons, while in [14] the storage and retrieval of single photons has been demonstrated, but with limited memory performance (680 ns lifetime and efficiency). The authors of both papers suggested that memory performance could be improved by using alkali vapor cells with antirelaxation coating instead of cells filled with buffer gas. That suggestion is reasonable, given that buffer-gas-induced collisional dephasing of the alkali metal excited electronic state results in incoherent photon scattering [15] which increases the read-out noise, i.e. degrades the quality of the retrieved photons. On the other hand, the experiments with classical light, which laid the foundation of QMs, have demonstrated that for antirelaxation-coated cells the stored light efficiency is low, although the storage time can be long [16]. This indicates that the proposed solution is not unambiguous and raises the question of the utility of antirelaxation coated cells for single photon storage.
In order to resolve the aforementioned dilemma, it is necessary to compare the performance of light storage for these two types of cells using the same experimental conditions. In that case, the contributions of memory performance degradation due to other decoherence mechanisms such as transit-time effects, inelastic atom-atom collisions, residual Doppler broadening and stray magnetic field will be the same for both cell types, and the difference in performance will be solely due to the influence of buffer gas or antirelaxation coating. Considering that the realization of QM is experimentally demanding, we sought a proof-of-principle demonstration in classical light storage experiments, i.e. in optical memories. However, although extensive studies of classical light storage in antirelaxation-coated [17] and buffer-gass-filled alkali vapor cells [20, 19, 18] can be found in literature, and a comprehensive review can be found in [16], to our knowledge, there is no comparative study in which the storage performance is measured for both cell types using the same experimental conditions. Therefore, motivated by the importance of the alkali vapor cells for the development of future field-deployable high performance quantum memories, we perform a comparative study of light storage in antirelaxation-coated and buffer-gas-filled alkali vapor cells.
Our optical memory is implemented using the electromagnetically induced transparency (EIT) effect in warm rubidium vapor contained in three types of vapor cells: paraffin-coated, alkene-coated, and paraffin-coated cell filled with a few Torr of neon buffer gas. We measured EIT linewidths of a few kHz for the buffer-gas-filled cell and several tens of kHz for the paraffin- and alkene-coated cells. We employ a theoretical model based on optical Bloch equations which includes the realistic atomic energy level structure, i.e. all hyperfine levels. The results of the theoretical model agree very well with the EIT experiment, which indicates that the use of the simplified three-level approximation is not sufficient for realistic analysis even in the case of classical light. This finding is even more significant for the theoretical treatment of QMs, given that quantum states are very fragile and a real analysis of the effects of noise on the storage of quantum states is required. The best light storage performance was obtained for the neon-filled gas cell, where in near-resonant EIT condition an storage efficiency of and a storage time of up to 1.2 ms is measured.
The manuscript is structured as follows. Sec. II details the experimental setup. In Sec. III, we present EIT measurements together with the results of theoretical model. The performance of our optical memories is outlined in Sec. IV. We conclude in Sec. V and discuss future research directions.
II II. Experimental setup
Our optical memory is based on EIT in the hyperfine scheme in warm 85Rb atoms, see Fig.1 for relevant energy levels and an optical layout of the experiment.
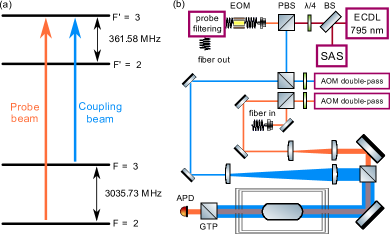
In our study, we utilized a set of three cylindrical quartz cells, each with a length of 75 mm and a diameter of 25 mm, containing isotopically enriched 85Rb atoms. Two of these cells were evacuated and had their inner walls coated with paraffin and alkene antirelaxation coating, respectively. The third cell was paraffin-coated and filled with 5 Torr of Ne buffer gas. To minimize the influence of stray magnetic fields, we encased the rubidium cell within three layers of mu-metal magnetic shielding. The cell’s temperature is adjustable, ranging from room temperature to 60oC, achieved through a heater composed of two aluminum blocks connected by copper heat pipes. This temperature variation allowed us to control the rubidium vapor optical depth (OD), from OD=0.75 at room temperature to OD=6 at 45 oC.
Our experimental procedure consisted of several steps. First, we measured the EIT spectra for each of the three cells (paraffin-coated, alkene-coated, and parafin-coated Ne buffer-gas-filled). Subsequently, we demonstrated the storage of light pulses and quantified the storage time and memory efficiency for each cell, all under the same experimental conditions. These conditions included matching EIT linewidth, shape and duration of the input probe pulse, rubidium vapor OD, probe and coupling laser frequencies, as well as the measurement protocol itself. Finally, we focused on investigating the temperature dependence of storage time and efficiency for the cell that showed the best storage performance, particularly under near-resonant EIT conditions.
II.1 EIT spectra measurement
The EIT measurement protocol starts by fixing the coupling laser frequency using an AOM. We then scan the probe laser frequency with a separate AOM around the two-photon resonance and concurrently measure the probe transmission. For a given set of experimental conditions, we record three key measurements: the EIT transmission spectrum (), off-resonant probe transmission (), and the background signal (). The off-resonant probe light is obtained by selecting the red-shifted sideband by transmitting it through the filtering cavity. Meanwhile, the background signal is acquired with the probe light turned off, and is the result of leakage of the coupling beam through the Glan-Thompson polarizer to the probe detector. To calculate the optical depth for the probe light, which represents the EIT absorption spectrum, we apply the Beer-Lambert law, expressed as . We perform this measurement protocol 30 times under identical experimental conditions and subsequently calculate the average to obtain the final EIT spectrum.
In the case of resonant EIT, we adjust the coupling laser to the transition frequency. The probe intensity is maintained at a constant level of 2.8 W/cm2, and the intensity of the coupling beam is varied between 0.15 and 2.5 mW/cm2, corresponding to probe and coupling Rabi frequencies of 2 50.6 kHz and 2 0.5 to 2 1.5 MHz, respectively.
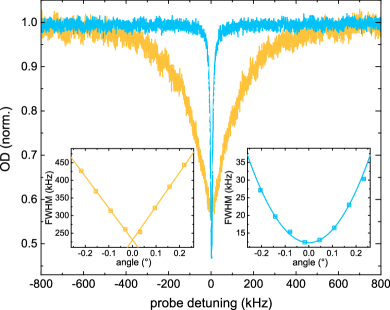
In Fig. 2, we present EIT spectra measured for the buffer-gas-filled cell (blue) and a reference cell (yellow) that lacks anti-relaxation coating on the walls and contains no buffer gas. These measurements were conducted with room temperature rubidium vapor under resonant EIT condition, with a coupling beam intensity of 0.29 mW/cm2. The EIT spectrum obtained in the reference cell exhibits a cusp-like lineshape described by the function e, where represents the probe detuning, and is the transit time [23, 26]. By fitting this exponential function to the measured EIT spectra, we determine a transit time of 7.2 s. Transit time represents the average interaction time of atoms with the probe light field and results from the transverse motion of atoms within the finite-sized probe beam. The cusp-like lineshape shown in Fig. 2 has a full width at half maximum (FWHM) of approximately 190 kHz, and it is a result of the transit time broadening. The dominance of the transit time broadening is understandable because other broadening mechanisms stemming from magnetic field inhomogeneities, power broadening, and atomic collisions are on the order of a few kHz or less (see Sec. III). Additionally, the residual Doppler broadening is almost completely canceled by using coupling into an optical fiber after the cell as a way to overlap the probe and coupling beams. The residual Doppler broadening is given by , where and are the coupling and probe wave vectors, respectively. Residual Doppler broadening of 1.7 kHz is expected in the case of a perfect overlap of the probe and coupling beams, i.e., for , where represents the angle between the probe and coupling beams, and = = 170 m/s is the RMS thermal velocity. In evacuated cells, for a -scheme with close-lying coupling and probe frequencies, and small , the residual Doppler broadening is proportional to [23, 25]. The left inset of Fig. 2 illustrates this relationship by showing measured EIT linewidths as a function of (symbols) and the linear fits to the data (lines).
To increase the interaction time, and thus reduce transit time broadening, antirelaxation-coated and buffer-gas-filled cells are used. In antirelaxation-coated cells, the inner walls of the cell are coated with an anti-relaxation material that significantly reduces the likelihood of decoherence after a collision with the cell wall. In other words, following a collision with the wall, the atom remains coherent and can pass through the probe beam multiple times before decoherence occurs. Alternatively, a buffer gas is introduced into the vapor cell to induce velocity-changing collisions that prevent atoms from leaving the probe beam. For instance, the resonant EIT spectrum measured using a buffer-gas-filled cell approximates a Lorentzian distribution (see Sec. III for a more detailed discussion) and exhibits a 14.5-fold reduction in EIT linewidth compared to the reference cell, see Fig. 2. Frequent velocity-changing collisions with the buffer gas lead to diffusive motion of rubidium atoms. The transit time broadening depends on the pressure of the buffer gas and the rubidium diffusion coefficient , estimated to be approximately 104 ms or 6 kHz under our experimental conditions, using a relation from Ref. [27]. Due to Dicke narrowing, residual Doppler broadening is proportional to [23, 25], making it much less sensitive to the alignment of the coupling and probe beams. The right inset of Fig. 2 illustrates this by showing Dicke-narrowed EIT linewidths as a function of measured for rubidium vapor contained in the buffer-gas-filled cell (symbols) and a quadratic fit to the data (line).
In the case of near-resonant EIT, we vary the detuning of the coupling laser from the transition, denoted as , within a range of -1000 to 1000 MHz. To achieve these detuned frequencies we no longer use saturation absorption spectroscopy to stabilize the ECDL output frequency, but rather stabilize it using a wavelength meter. In Fig. 3, we present EIT spectra obtained for different values of , using room temperature rubidium vapor within the buffer-gas-filled cell, with a coupling beam intensity of 2.5 mW/cm2. The EIT resonance is symmetric when the coupling laser is precisely tuned to the optical transition, and begins to show asymmetry as the coupling laser detuning increases. Upon further increase or decrease of the coupling laser frequency beyond the natural linewidth of 5.75 MHz [31], the EIT feature initially shows not only a decrease in absorption, but also an increase. Eventually, it fully transforms into an absorption resonance.
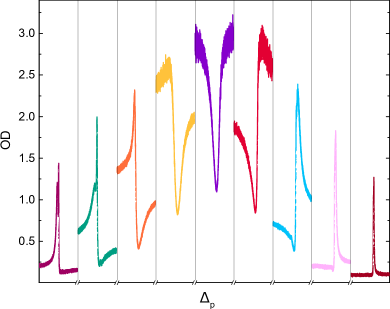
For a given , the near-resonant EIT spectra exhibit opposite symmetry for the blue and red-detuned coupling beams. In other words, when the coupling beam is red-detuned, the EIT resonance occurs at a higher probe frequency than the absorption resonance, and vice versa for the blue-detuned coupling beam. Furthermore, the complete transformation of the EIT feature into an absorption resonance occurs at smaller values when using a blue-detuned coupling beam. This behavior is attributed to the contribution of the fourth hyperfine level to the EIT signal when the coupling beam is red-detuned from the transition, as shown in Fig. 1(a).
II.2 Optical memory measurement
For the implementation of an optical memory, i.e., light storage and retrieval, we apply a commonly used protocol [20, 16]. The coupling and the probe lasers have fixed frequencies that satisfy the two-photon EIT resonance. First, we turn on the coupling beam, after which we apply an exponential probe beam pulse with a duration of 10 s, which is optimized for the highest memory efficiency using protocol described in [32]. At the peak of the probe pulse, we shut off the probe and coupling beams simultaneously. After waiting for a variable storage time, we turn on the coupling beam and monitor the intensity of the retrieved probe pulse with an avalanche photodiode placed after the rubidium cell, see Fig. 1. The shaping of the probe and coupling pulses as well as the precise time sequence of the experimental protocol is achieved using the probe and coupling beams AOMs controlled by a common two-channel RF synthesizer. We repeat the measurement protocol 1000 times for identical experimental conditions, and subsequently average the measured traces to obtain the retrieved pulse for a given storage time.
Finally, we calculate the storage efficiency as the ratio of the retrieved and incident pulse areas.
III III. Results and discussion
The light storage performance is closely related to the EIT linewidth and contrast. Indeed, for EIT optical memories based on a scheme, the EIT linewidth contains information about the spin coherence of the ground hyperfine levels which is directly related to the memory storage time. Therefore, in order to benchmark the light storage performance, we first measure the EIT linewidths for all three cells (paraffin-coated, alkene-coated, and parafin-coated Ne buffer-gas-filled) in identical experimental conditions.
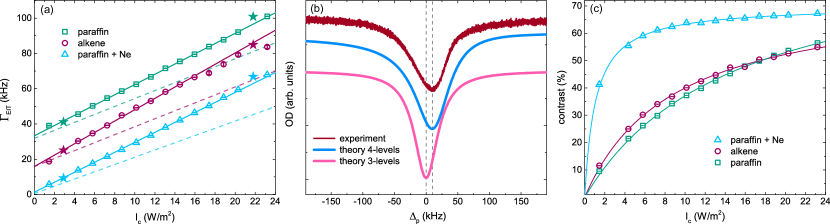
In Fig. 4(a), we present EIT linewidths as a function of the coupling light intensity for all three cells, all measured at room temperature using 85Rb vapor. For the lowest coupling laser intensity, we observe EIT linewidths ranging from a few kHz (Ne-filled cell) to tens of kHz (alkene- and paraffin-coated cells).
Various broadening mechanisms contribute to the EIT linewidth, including magnetic field inhomogenities, power broadening, atomic collisions, atomic transit-time, and residual Doppler broadening [23, 24]. In our experiment, the dominant contributions are associated with power broadening, atomic transit-time, and residual Doppler broadening. We can disregard the influence of magnetic field non-uniformities since we employ a hyperfine scheme within a magnetically shielded cell. Atomic collision broadening resulting from Rb-Rb atom collisions is on the order of a few Hz [33, 34], making it negligible in comparison to the other broadening mechanisms. The contribution of power broadening is evident in Fig. 4(a), as the EIT linewidth increases linearly with the coupling laser intensity. To resolve the effect of power broadening, we fit a linear function (solid line in Fig. 4(a)) to the measured EIT linewidths (represented by squares, circles, and triangles in Fig. 4(a)). By examining the line intercepts, we can extract the EIT linewidths limited only by transit-time broadening and residual Doppler broadening. For perfectly co-propagated coupling and probe beams, the residual Doppler broadening contribution is 1.7 kHz, as discussed in Sec. II. The line intercepts yield values of kHz for the Ne-filled cell, kHz for the alkene-coated cell, and kHz for the paraffin-coated cell. These results indicate that residual Doppler broadening is the primary contributing mechanism in the Ne-filled cell, while transit-time broadening dominates in the anti-relaxation-coated cells.
The linear dependence of the EIT linewidth on the coupling laser intensity is theoretically predicted in a three-level system under the weak probe approximation [23, 24]. This relationship directly link the intercept to the decoherence rate of the ground spin states. However, as seen in Fig. 4(b), the simplified three-level approximation may not be sufficient to describe a realistic experiment where additional energy levels contribute to the EIT signal. This is the case with 85Rb atoms, where the hyperfine level is situated approximately 362 MHz below the level, as shown in Fig. 1(a).
III.1 Numerical model
To theoretically investigate the EIT signals for a realistic system, we employ standard density matrix formalism in a four-level 85Rb atom interacting with two continuous-wave (cw) laser fields (coupling - and probe - ), as depicted in Fig. 1(a). The Hamiltonian of the system, denoted as , comprises two components: the free atom Hamiltonian and the interaction Hamiltonian . The latter describes the interaction of the atom with the two laser fields, specifically, . In the dipole approximation, parts of the interaction Hamiltonian can be expressed as and , where and and denote the transition dipole moments of the relevant transitions, numbered according to Fig. 1(a) and calculated from Ref. [29].
Temporal evolution of the system is given by the density matrix equations of motion [30]:
| (1) | |||||
where the subscripts refer to the hyperfine levels numbered from the lowest to highest energy level (see Fig. 1). gives the population decay rate from level to level , while is the damping rate of the coherence given by
| (2) |
Here and denote the total population decay rates of level and . In our system , and MHz [31]. are calculated from and following Fermi’s golden rule [29]. The depend on the particular alkali cell used. The of optical transitions, i.e., , arise from Doppler broadening, 500 MHz, for anti-relaxation coated and Ne-filled cells, and from the Rb collisions with the Ne gas, 25 MHz, for cell filled with 5 Torr of Ne gas [24]. The of non-allowed transitions, i.e. = are decoherence rates of ground and excited hyperfine levels, respectively, and their values are taken from measurements shown in Fig. 4(a), i.e. as b/2 in accordance with [23, 24].
The system of Eqs. (1) is solved by invoking the rotating-wave approximation and introducing the laser electric fields , and , together with the slowly varying coherences and , where . Here, and are coupling and probe laser frequencies defined as , , where and correspond to the and transitions, respectively. and are the amplitudes of the coupling and probe laser fields. Stationary solutions for atomic populations and coherences are obtained from the set of coupled differential equations, Eqs. (1). The probe absorption coefficient is proportional to .
III.2 Comparison of measured and calculated EIT spectra
For fixed = 0, = 3 V/m and a given , we calculated the probe absorption coefficient, , for different probe field detunings, . From the calculated absorption spectra, we obtained the EIT FWHM and compared it to the experiment. The agreement between the measured EIT linewidths and the calculated ones is excellent. For enhanced clarity, Fig. 4(a) displays calculated EIT linewidths for only two coupling electric fields (stars), specifically, = 23 V/m and = 64 V/m, corresponding to 2.9 W/m2 and 21.8 W/m2, where the intensity is calculated using the relation , with equal to the speed of light, the index of refraction, and the permittivity of vacuum. The same figure also shows the EIT linewidths calculated with a simplified three-level model. These calculations employ the same parameters as the four-level model, except that = 0. The results indicate that with increasing coupling light intensity, a significant discrepancy arises between the three-level theory and the experimental data.
The failture of the three-level model to reproduce the measured EIT signals is further supported by Fig. 4(b) where the measured (red) and calculated EIT spectra are presented as a function of probe detuning. Consistent with predictions from the literature [24], the probe absorption calculated using the three-level model (violet) takes the form of a Lorentzian centered at . However, the measured EIT spectrum takes on an asymmetric lineshape with its center shifted to larger probe detuning, a behavior that is well reproduced by the four-level model (blue).
In Fig. 4(c) we show measured EIT contrasts, or amplitude of the transparency, (symbols) as a function of the coupling light intensity for all three cells measured at room temperature 85Rb vapor. The solid curve is a fit to the measured data of the form , where is a free parameter. The functional form is in accordance with the theory, however, the measured contrast is lower than predicted. This can be atributed to the reduction of the steady state atoms in the dark state due to different dephasing mechanisms, such as population leakage, and absorption [24]. The Ne-filled cell exhibited the highest contrast, approximately 68, while the alkene- and paraffin-coated cells showed similar contrasts, reaching up to 50.
III.3 Comparative study of light storage in antirelaxation-coated and buffer-gas-filled alkali vapor cells
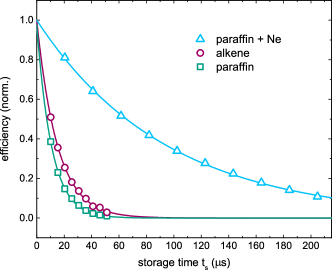
Light storage is achieved using the optical memory protocol described in Sec. II. In Fig. 5 we show the measured normalized storage efficiency as a function of the storage time for paraffin-coated, alkene-coated, and Ne-filled cells. The measurements were performed for 85Rb vapor at 33 oC, resonant EIT () with a FWHM of 100 kHz. We fit an exponential decay function to the measured data, where denotes the memory lifetime, and find = (95 3) s for the Ne-filled cell, = (14.9 0.9) s for the alkene-coated cell, and = (10.3 0.6) s for the paraffin-coated cell. The obtained memory lifetimes agree well with the decoherence times of ground hyperfine levels, calculated as . The shorter memory lifetime observed in the the Ne-filled cell with respect to the lifetime expected from the measured EIT linewidth suggests that the initial coherent ground state preparation may not be optimized for the short probe pulses. The measured memory efficiencies are relatively low for all three cells, for the Ne-filled cell and for alkene- and paraffin- coated cells.
III.4 Optimal light storage in buffer-gas-filled alkali vapor cell
From the previously presented results, it is evident that the Ne-filled cell shows better memory performance than the antirelaxation-coated cells. Therefore, going further, we limit our investigation to the Ne-filled cell memory and optimize its performance by increasing the temperature of the rubidium vapor, and using a near-resonant EIT -scheme.
As seen in Fig. 6(a), an optimal temperature exists for a given detuning of the coupling laser. The memory efficiency initially increases as temperature is increased, due to the increase of the concentration of atoms, i.e. due to the increased number of atoms prepared in a coherent state. A maximum memory efficiency is obtained at a specific temperature, at which the decoherence mechanisms, such as radiation trapping, spin-exchange collisions, stimulated Raman scattering, and four-wave mixing, [19], prevail causing efficiency to drop with temperature.
For a given temperature, higher memory efficiency is obtained when the coupling laser is detuned from the transition frequency, i.e. for smaller OD. We achieve approximately a sixfold enhancement in memory efficiency when the near-resonant EIT -scheme with -700 MHz is used instead of a resonant one, as indicated by the violet symbols in Fig. 6(a). Upon further increase of the detuning of the coupling laser the memory efficiency drops, and falls to zero for detunings beyond the Doppler broadened single-photon linewidth. The observed sweet spot in memory efficiency is observed for the coupling laser detuning at which the EIT feature fully transforms into an absorption two-photon Raman resonance [35], see Fig. 3 and the discussion related to it.
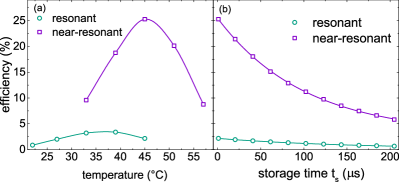
It is worth noting that the increase in memory efficiency is not accompanied by an increase in memory lifetime. For a given vapor temperature, similar memory lifetimes are observed for both resonant and near-resonant EIT memory. For instance, in Fig. 6(b), we show the measured memory efficiency as a function of storage time, from which we extract memory lifetimes of s and s for resonant and near-resonant EIT, respectively.
In addition, for a given temperature, a similar memory efficiency is observed when the coupling laser is red- or blue- detuned from the atomic resonance, which is reasonable considering that amplitudes of EIT and two-photon absorption resonances shown in Fig. 3, are comparable for a given .
Finally, we find the optimal memory performance, with efficiency and storage times of up to 1.2 ms, in the near-resonant EIT scheme with - 700 MHz at a vapor temperature of C.
IV IV. Conclusion
In summary, our study compares light storage in antirelaxation-coated and buffer-gas-filled warm rubidium vapor cells using electromagnetically induced transparency (EIT). The buffer-gas-filled cell demonstrates approximately a tenfold improvement in both storage time and efficiency when compared to the antirelaxation-coated cells in the same experimental conditions. By employing a near-resonant EIT -scheme instead of a resonant one, we achieve approximately a sixfold enhancement in memory efficiency while maintaining a similar memory lifetime.
Through optimization of buffer-gas-filled memory performance, we obtain an efficiency of 25, with storage times extending up to 1.2 milliseconds.
Our work sheds new light on some open questions in the field and paves the way for the development of high-performance, field-deployable quantum memories. We recommend employing a buffer-gas-filled cell in a near-resonant EIT -scheme for future implementations of quantum memories in warm alkali vapors.
V V. Acknowledgements
The authors acknowledge support from the Croatian Science Foundation (Slovenia-Croatia bilateral research project ”Development of building blocks for new European quantum communication network” - IPS-2020-01-2616 and project ”Frequency comb cooling of atoms” - IP-2018-01-9047). In addition, this work was supported by the project Centre for Advanced Laser Techniques (CALT), co-funded by the European Union through the European Regional Development Fund under the Competitiveness and Cohesion Operational Programme (Grant No. KK.01.1.1.05.0001). The authors acknowledge Vjekoslav Vulić for his contribution in building a filtering cavity.
References
- [1] N. Sangouard, C. Simon, H. de Riedmatten, and N. Gisin, Rev. Mod. Phys. 83, 33 (2011).
- [2] F. Kaneda, F. Xu, J. Chapman, and P. G. Kwiat, Optica 4, 1034 (2017).
- [3] J. Nunn, N. K. Langford, W. S. Kolthammer, T. F. M. Champion, M. R. Sprague, P. S. Michelberger, X.-M. Jin, D. G. England, and I. A. Walmsley, Phys. Rev. Lett. 110, 133601 (2013).
- [4] F. Bussières, N. Sangouard, M. Afzelius, H. de Riedmatten, C. Simon, and W. Tittel, J. Mod. Opt. 60, 1519 (2013).
- [5] M. Jin, Y.-Z. Ma, Z.-Q. Zhou, C.-F. Li, and G.-C. Guo, Sci. Bull. 67, 676 (2022).
- [6] Y. Wang, J. Li, S. Zhang, K. Su, Y. Zhou, K. Liao, S. Du, H. Yan, and S.-L. Zhu, Nat. Photonics 13, 346 (2019).
- [7] E. Saglamyurek, T. Hrushevskyi, A. Rastogi, L. W. Cooke, B. D. Smith, and L. J. LeBlanc, New J. Phys. 23, 043028 (2021).
- [8] B. Zhao, Y.-A. Chen, X.-H. Bao, T. Strassel, C.-S. Chuu, X.-M. Jin, J. Schmiedmayer, Z.-S. Yuan, S. Chen, and J.-W. Pan, Nat. Phys. 5, 95 (2009).
- [9] K. Heshami, D. G. England, P. C. Humphreys, P. J. Bustard, V. M. Acosta, J. Nunn, and B. J. Sussman, J. Mod. Opt. 63, 2005 (2016).
- [10] L. Ma, O. Slattery, and X. Tang, J Opt. 19, 043001 (2017).
- [11] K. F. Reim, P. Michelberger, K. C. Lee, J. Nunn, N. K. Langford, and I. A. Walmsley, Phys. Rev. Lett. 107, 053603 (2011).
- [12] S. E. Thomas, T. M. Hird, J. H. D. Munns, B. Brecht, D. J. Saunders, J. Nunn, I. A. Walmsley, and P. M. Ledingham, Phys. Rev. A 100, 033801 (2019).
- [13] Y. Wang, A. N. Craddock, R. Sekelsky, M. Flament, and M. Namazi, Phys. Rev. Appl. 18, 044058 (2022).
- [14] G. Buser, R. Mottola, B. Cotting, J. Wolters, and P. Treutlein, PRX Quantum 3, 020349 (2022).
- [15] S. Manz, T. Fernholz, J. Schmiedmayer, and J.-W. Pan, Phys. Rev. A 75, 040101(R) (2007)..
- [16] I. Novikova, R. L. Walsworth, and Y. Xiao, Laser Photonics Rev. 6, 333 (2012).
- [17] O. Katz, and O. Firstenberg, Nat Commun 9, 2074 (2018).
- [18] M. Hosseini, B.M. Sparkes, G. Campbell, P.K. Lam, and B.C. Buchler, Nat. Commun. 2, 174 (2011).
- [19] N. B. Phillips, A. V. Gorshkov, and I. Novikova, Phys. Rev. A 78, 021802 (2008).
- [20] D. F. Phillips, A. Fleischhauer, A. Mair, R. L. Walsworth, and M. D. Lukin, Phys. Rev. Lett. 86, 783 (2001).
- [21] M. Eisaman, A. André, F. Massou, M. Fleischhauer, A. S. Zibrov, and M. D. Lukin, Nature 438, 837 (2005).
- [22] R. Finkelstein, E. Poem, O. Michel, O. Lahad, and O. Firstenberg, Sci. Adv. 4, eaap8598 (2018).
- [23] R. Finkelstein, S. Bali, O. Firstenberg, and I. Novikova, New J. Phys. 25, 035001 (2023).
- [24] K. DeRose, K. Jiang, J. Li, M. Julius, L. Zhuo, S. Wenner, and S. Bali, Am. J. Phys. 91, 193 (2023).
- [25] K. DeRose, PhD, Miami University (2019.)
- [26] J. E. Thomas, and W. W. Quivers Jr, Phys. Rev. A 22, 2115 (1980).
- [27] E. Arimondo, Phys. Rev. A 54, 2216 (1996).
- [28] Nicole Allard, and John Kielkopf, Rev. Mod. Phys. 54, 1103 (1982) Rev. Mod. Phys. 54, 1103 (1982).
- [29] O. Axner, J. Gustafsson, N. Omenetto, and J. Winefordner, Spectrochim. Acta B: At. Spectrosc. 59, 1 (2004).
- [30] R. Boyd, Nonlinear Optics, Nonlinear Optics Series (Elsevier Science, 2008).
- [31] D. A. Steck, Rubidium 85 D Line Data.
- [32] I. Novikova, A. V. Gorshkov, D. F. Phillips, Y. Xiao, M. Klein, and R. L. Walsworth, Proc. of SPIE 6842, 64820M, (2007).
- [33] W. Harper, Rev. Mod. Phys. 44, 169 (1972).
- [34] J. Vanier, A. Godone, and F. Levi, Phys. Rev. A 58, 2345 (1998).
- [35] S. E. Thomas, J. H. D. Munns, K. T. Kaczmarek, C. Qiu, B. Brecht, A. Feizpour, P. M. Ledingham, I. A. Walmsley, J. Nunn, and D. J. Saunders, New J. Phys. 19, 063034 (2017).