Serendipitous detection of the dusty Type IIL SN 1980K with JWST/MIRI
Abstract
We present mid-infrared (mid-IR) imaging of the Type IIL supernova (SN) 1980K with the James Webb Space Telescope (JWST) more than 40 yr post-explosion. SN 1980K, located in the nearby ( Mpc) “SN factory” galaxy NGC 6946, was serendipitously captured in JWST/MIRI images taken of the field of SN 2004et in the same galaxy. SN 1980K serves as a promising candidate for studying the transitional phase between young SNe and older SN remnants and also provides a great opportunity to investigate its the close environment. SN 1980K can be identified as a clear and bright point source in all eight MIRI filters from F560W up to F2550W. We fit analytical dust models to the mid-IR spectral energy distribution that reveal a large amount () of Si-dominated dust at K (accompanied by a hotter dust/gas component), and also computed numerical SED dust models. Radiative transfer modeling of a late-time optical spectrum obtained recently with Keck discloses that an even larger ( M⊙) amount of dust is needed in order for selective extinction to explain the asymmetric line profile shapes observed in SN 1980K. As a conclusion, with JWST, we may see i) pre-existing circumstellar dust heated collisionally (or, partly radiatively), analogous to the equatorial ring of SN 1987A, or ii) the mid-IR component of the presumed newly-formed dust, accompanied by much more colder dust present in the ejecta (as suggested by the late-time the optical spectra).
keywords:
infrared: stars – supernovae: general – supernovae: individual: SN 1980K – dust, extinction1 Introduction
Core-collapse supernovae (CCSNe), the cataclysmic endings of evolved massive stars, are unique astrophysical laboratories. Due to their particularly energetic final explosions, they affect their closer and broader environments and enable us to uncover details about the pre-explosion stellar evolution processes.
CCSNe have long been considered as crucial sources of dust in the Universe, potentially accounting for the origin of dust at high redshifts during the epoch of reionisation (Maiolino et al., 2004; Dwek et al., 2007; Gall et al., 2011). Recent far-infrared (far-IR) and sub-mm observations of Galactic SN remnants – e.g., Cas A (Barlow et al., 2010; Sibthorpe et al., 2010; Arendt et al., 2014) and Crab (Gomez et al., 2012; Temim & Dwek, 2013; De Looze et al., 2019) – and the very nearby ( kpc) SN 1987A (Matsuura et al., 2011, 2019; Indebetouw et al., 2014) seem to confirm that massive (–1 M⊙) cold reservoirs may be hiding significant quantities of dust. Such long-wavelength studies, however, cannot be carried out for other extragalactic CCSNe owing to the limited sensitivity of previous far-IR instruments. Dust masses estimated by follow-up Spitzer Space Telescope (hereafter Spitzer) observations resulted in 2–3 orders of magnitude smaller dust masses; nevertheless, these data tended to probe only the warmer dust components ( K) and/or earlier epochs ( yr). In addition to their thermal radiation, dust grains in the SN ejecta preferentially absorb light in the receding part of the ejecta, attenuating the red wing of emission lines at optical wavelengths. Applying this method, several authors (Bevan & Barlow, 2016; Bevan et al., 2017; Niculescu-Duvaz et al., 2022) also found large ( M⊙) dust masses in years- or decades-old CCSNe; however, this kind of analysis gives information only on the mass of dust, but not on its temperature.
Observed dust in CCSNe may form either in the (unshocked) ejecta or in a cold dense shell (CDS) across the contact discontinuity between the shocked circumstellar matter (CSM) and shocked ejecta (see, e.g., Chugai et al., 2004; Pozzo et al., 2004; Smith et al., 2008a, 2009; Mattila et al., 2008). A late-time mid-IR excess may also emerge from heated pre-existing dust grains. While in the shocked CSM, heating can be collisional, and grains in the more distant, unshocked CSM are assumed to be radiatively heated by the peak SN luminosity or by energetic photons generated during CSM interaction, thereby forming an IR echo (see, e.g., Bode & Evans, 1980; Dwek, 1983; Graham & Meikle, 1986; Sugerman, 2003; Smith et al., 2008b; Kotak et al., 2009; Fox et al., 2010; Andrews et al., 2011). In these cases, dust can be a helpful probe of the CSM characteristics and the pre-SN mass loss from either the progenitor or companion star (see, e.g., Gall et al., 2011, for a review).
Multiwavelength follow-up observations of the evolution of the expanding SN ejecta and their interaction with the ambient medium plays an essential role in this research. Beyond gathering optical and near-IR data using ground-based infrastructure, mid-IR observations offer numerous advantages for following the late-time evolution of SNe owing to the increased sensitivity to the expanding and cooling ejecta and the lower impact of interstellar extinction. This wavelength region also covers atomic and molecular emission lines generated by shocked, cooling gas (Reach et al., 2006). Moreover, mid-IR data are sensitive to warm dust either in the SN ejecta or in the pre-existing CSM.
In the last two decades, the prime source of mid-IR SN data was NASA’s now-decommissioned Spitzer, which provided valuable data during both its cryogenic (2003–2009) and post-cryogenic (2009-2020) missions. Beyond a few large-scale SN surveys — e.g., the SPIRITS project (SPitzer InfraRed Intensive Transients Survey, a systematic study of transients in nearby galaxies; see Tinyanont et al., 2016; Kasliwal et al., 2017; Jencson et al., 2019), or other studies focused on CSM-interacting (Type IIn) SNe (Fox et al., 2011, 2013) — and several single-object studies, many other objects appeared in nontargeted archival Spitzer images. Szalai et al. (2019); Szalai et al. (2021) presented the most extensive analyses of mid-IR SN data, including positively detected objects from SN sites imaged by Spitzer.
These latter studies focus primarily on the comprehensive examination of 3.6 m and 4.5 m photometric datasets of SNe obtained with the InfraRed Array Camera (IRAC) detector of Spitzer. A limited number of longer-wavelength measurements were obtained during the cryogenic mission with IRAC (5.8 m and 8.0 m), the Multiband Imaging Photometer (MIPS; 24 m), and the InfraRed Spectrograph for Spitzer (IRS; –16 m). Detailed works based on extended mid-IR datasets have been published for several Type IIP SNe (e.g., Kotak et al., 2009; Fabbri et al., 2011; Meikle et al., 2011; Szalai et al., 2011; Szalai & Vinkó, 2013), but also Type IIn SN 1978K (Tanaka et al., 2012), Type IIb SN 1993J (Zsíros et al., 2022), and the famous, peculiar Type II SN 1987A (Bouchet et al., 2006; Dwek et al., 2010; Arendt et al., 2016, 2020).
The James Webb Space Telescope (JWST) offers a new opportunity to detect the late phases of cool (–200 K) dust in extragalactic SNe beyond SN 1987A. JWST offers unique sensitivity to (i) cooler dust grains at wavelengths m, (ii) the 10 m silicate feature that can distinguish grain compositions, and (iii) faint emission from the SN at very late ( days) epochs that would have gone undetected by Spitzer and any other mid-IR spacecraft. In its first half year, the new space telescope has begun to revolutionise this field. During Cycle 1 General Observers (GO) program 2666 (PI O. Fox; DOI: \doi[10.17909/8kkm-fr55]http://dx.doi.org/10.17909/8kkm-fr55), JWST has already detected dust in SNe IIP 2004et and 2017eaw. In SN 2004et, the observations have uncovered the largest newly-formed ejecta dust masses in an extragalactic SN other than SN 1987A, with M⊙ dust residing at K (Shahbandeh et al., 2023).
Here we present the serendipitous detection of another CCSN, SN 1980K, with JWST during the analysis of images obtained originally for SN 2004et. This paper is organised as follows. In Section 2, we present our observations and data reduction. Section 3 describes the steps of measuring dust masses via modeling the mid-IR spectral energy distribution (SED) and the red-blue line-profile asymmetries in a newly-obtained late-time optical spectrum. We interpret the results in Section 4, discuss the possible origin and heating mechanisms of dust, and provide our concluding remarks.
2 Observations and data reduction
2.1 SN 1980K
SN 1980K, discovered on 1980 Oct. 28 (UTC dates are used throughout this paper) in the nearby ( Mpc) “SN factory” galaxy NGC 6946 (Wild & Barbon, 1980), has long been a target of multiwavelength studies. Based on the early-time photometric and spectroscopic observations showing the presence of medium-strong H lines and a linearly (in magnitudes) declining light curve, it was classified as a prototype Type II-linear (IIL) SN (Buta, 1982; Barbon et al., 1982). However, note that despite some obvious photometric and spectral differences, there are doubts on whether Type IIL and more slowly-evolved, H-rich Type II-plateau (IIP) SNe truly originate from different types of progenitors (see, e.g., Anderson et al., 2014; Valenti et al., 2016). Regarding SN 1980K, there is no direct information on the progenitor star (or stellar system). Based on the nondetection of the progenitor on a pre-explosion image, Thompson (1982) determined an upper mass limit of 18 M⊙, while Williams et al. (2018) and Koplitz et al. (2021) found a progenitor mass range of 7–15 M⊙ (giving 7.5–9 M⊙ as the most probable value) from an analysis of the local stellar population.
About 2 months after the discovery, a narrow H emission line with a weak blueshifted absorption component appeared in the spectrum of SN 1980K (Barbieri et al., 1982), indicating an ongoing SN shock-CSM interaction (just as revealed in the case of SN 1979C, another SN IIL discovered a year before SN 1980K). Long-term follow-up spectroscopy of SN 1980K showed only a small (%) decline of the H flux over a decade (Uomoto & Kirshner, 1986; Leibundgut et al., 1991; Fesen et al., 1995, 1999). Spectra obtained yr and 30 yr after the explosion also revealed the presence of broad ( km s-1) emission lines of [O i] and [O ii] (Milisavljevic et al., 2012). Similar findings were presented by Long et al. (2019) in the case of a Gemini Multi-Object Spectrograph (GMOS) spectrum taken yr post-explosion, confirming the slow decline of the H flux at later times. The slow rate of change of spectral features — as well as the presence of late-time IR emission — can be also explained by scattered and thermal light echoes from extended circumstellar or interstellar matter (Dwek, 1983; Sugerman et al., 2012, see details later).
As further evidence of CSM interaction, radio and X-ray emission were detected from SN 1980K about a month after maximum optical brightness (Canizares et al., 1982; Weiler et al., 1986). Radio observations of SN 1980K were continued extensively in the following years (Weiler et al., 1992; Montes et al., 1998; Eck et al., 2002), resulting in positive detections but showing declining fluxes. However, as discussed by Montes et al. (1998), the sharp drop in radio emission seemed to indicate a notable change in the CSM density, with the shock presumably entering a different CSM regime. In the X-ray, a more limited dataset exists; however, it is worth highlighting that the SN was detected by ROSAT (Schlegel, 1994) and Chandra (Soria & Perna, 2008; Fridriksson et al., 2008) more than 10 and 20 yr after the explosion, respectively.
2.2 Mid-IR photometry on JWST/MIRI images
As part of GO-2666,we obtained images of NGC 6946 with the JWST Mid-Infrared Instrument (MIRI; Bouchet et al. 2015; Ressler et al. 2015; Rieke et al. 2015; Rieke & Wright 2022) on 2022 Sep. 20.9, originally targeting Type IIP SN 2004et. The observations were acquired in the F560W, F1000W, F1130W, F1280W, F1500W, F1800W, F2100W, and F2550W filter bands, using the FASTR1 readout pattern in the FULL array mode and a 4-point extended source dither pattern. The detailed calibration process of the JWST/MIRI images, together with the analysis of SN 2004et, has been recently published by Shahbandeh et al. (2023).
Serendipitously, the MIRI field of view also contains the site of SN 1980K (, ; Van Dyk et al., 1996). The object can be identified as a clear and bright point source at all wavelengths from 5.6 to 25.5 m (see in Figs. 1 and 2), for which high-resolution Hubble Space Telescope (HST) images — obtained in 2008 January showing the environment of SN 1980K (Milisavljevic et al., 2012) — proved to be highly useful. We used the JWST HST Alignment Tool (JHAT, Rest et al., 2023) to align the JWST and HST images to each other.
To measure the fluxes of SN 1980K on JWST/MIRI images, we followed the method described in detail by Shahbandeh et al. (2023). We performed point-spread-function (PSF) photometry on background-subtracted level-two data products using WebbPSF (Perrin et al., 2014). In order to calibrate the flux, we applied flux offsets by measuring the PSF of all the stars in the field and comparing them to the corresponding catalogues created by the pipeline. The fluxes of all four dithers of each filter were then averaged. The final results of JWST/MIRI photometry of SN 1980K are presented in Table 1.
| (m) | (Jy) |
|---|---|
| 5.6 | 99.800 0.565 |
| 10.0 | 74.700 0.169 |
| 11.3 | 73.400 0.572 |
| 12.8 | 100.198 0.570 |
| 15.0 | 144.222 0.761 |
| 18.0 | 269.199 1.570 |
| 21.0 | 291.572 2.080 |
| 25.5 | 312.250 6.460 |
aObtained from JWST/MIRI images on 2022 Sep. 20.9 ( yr post-explosion).
2.3 Mid-IR photometry on archival Spitzer images
NGC 6946, the nearby host galaxy of SN 1980K, was imaged several times with Spitzer, especially during its Warm Mission Phase (as part of SPIRITS program; Tinyanont et al., 2016). Based on IRAC and MIPS data obtained between 2005 and 2008, Sugerman et al. (2012) carried out a detailed analysis of SN 1980K; however, the complete Spitzer dataset of the SN had not been published. Thus, we reanalysed all of the Spitzer IRAC and MIPS data obtained between 2004 and 2019. We downloaded the post-basic calibrated (PBCD) images of SN 1980K from the Spitzer Heritage Archive (SHA)111https://sha.ipac.caltech.edu/applications/Spitzer/SHA/.
Despite the limitations of the spatial and spectral resolution, on most of the images a faint source can be detected at the position of the SN. At the spatial resolution of Spitzer, the region of the SN seems to be complex and a nearby bright source (see in Fig.1) also makes single-aperture photometry difficult. Therefore, we applied a photometric method described by Fox et al. (2011) that uses a set of single apertures to measure the background and source fluxes individually. It allows us to manually eliminate the effect of nearby bright sources and sample only the local background of the SN.
We carried out the photometry using the phot task of IRAF Image Reduction and Analysis Facility) software package222https://iraf.noao.edu. For the IRAC and MIPS images, we used an aperture radius of 2.4″ and 5″, respectively. To obtain monochromatic fluxes, we applied aperture corrections: according to the IRAC333https://irsa.ipac.caltech.edu/data/SPITZER/docs/irac/iracinstrumenthandbook/ and MIPS444https://irsa.ipac.caltech.edu/data/SPITZER/docs/mips/mipsinstrumenthandbook/ Instrument Handbooks, we used values of 1.213, 1.234, 1.379, and 1.584 for the IRAC 3.6, 4.5, 5.8, and 8.0 m channels, respectively, and 2.12 for the MIPS 24.0 m channel.
Based on our analysis, the SN does not show significant evolution over the course of 15 yr of Spitzer observations (see in Fig. 3). Hence, we compared the average IRAC and MIPS fluxes with the MIRI data and found them to be similar. However, since Spitzer data have large uncertainties owing to their low spatial resolution compared to that of JWST/MIRI, we do not include them later in our analysis. Note that both the IRAC and MIPS photometry have high uncertainties (Fig. 3), and the obtained fluxes also depend on the applied aperture configuration. Thus, we only used them to determine whether the data shows a trend in time and also to estimate the late-time fluxes at shorter wavelengths (3.6m and 4.5m).
2.4 Late-time optical spectrum
A late-time optical spectrum of SN 1980K was obtained with the Keck Low Resolution Imaging Spectrometer (LRIS; Oke et al., 1995) on 2022 Nov. 19 (at an epoch of yr); it is shown in Figure 4. The spectrum was acquired with the slit oriented at or near the parallactic angle to minimise slit losses caused by atmospheric dispersion (Filippenko, 1982). The LRIS observations utilised the -wide slit, 600/4000 grism, and 400/8500 grating to produce a similar spectral resolving power (–1200) in the red and blue channels.
Data reduction followed standard techniques for CCD processing and spectrum extraction using the LPipe data-reduction pipeline (Perley, 2019). Low-order polynomial fits to comparison-lamp spectra were used to calibrate the wavelength scale, and small adjustments derived from night-sky lines in the target frames were applied. The spectrum was flux calibrated using observations of appropriate spectrophotometric standard stars observed on the same night, at similar airmasses, and with an identical instrument configuration.
Beyond the H and [O i] 6300, 6363 lines, of which we carried out a detailed profile analysis (Sect. 3.3), we also identified, following Milisavljevic et al. (2012), [O iii] 5007, [Fe ii] 7155 (associated probably with [Ar iii]), and [O ii] 7300. Moreover, owing to also covering the longer-wavelength part of the spectrum with a good signal-to-noise ratio, we also see [Fe ii] 8617 and [S iii] 9069, 9531 lines (Fig. 4).
3 Analysis
3.1 Analytical models of the mid-IR SED
During the analytical modeling of the JWST/MIRI SED of SN 1980K, we assume that the source of the observed late-time mid-IR flux is the thermal radiation from local dust grains. We basically followed the method described by Shahbandeh et al. (2023), adopting the widely-used model of Hildebrand (1983), which assumes only the thermal emission of an optically thin dusty shell at a single equilibrium temperature and distance , with a dust mass of and particle radius of . The observed flux of the dust can be written as
| (1) |
where is the Planck function and is the dust mass absorption coefficient as a function of the dust grain radius defined by
| (2) |
where is the emission efficiency and (for silicates 3.3 g cm-3 Sarangi, 2022) is the bulk density. Note that, while Shahbandeh et al. (2023) adopted a more general formalism of Dwek et al. (2019) allowing for the presence of optically thick dust, we focused only on the optically thin case because of (i) the decades-long age of the SN remnant, and (ii) the likely presence of silicate emission at m would be suppressed by optically thick dust.
During the modeling process, we calculated filter-integrated fluxes using Eq. 1 convolved with the JWST/MIRI filters transmission profile and fit them to the JWST data. As described in Sec. 2.3, we also measured Spitzer fluxes obtained between 2004 and 2019. The last Spitzer data, taking into account the age of the SN, are roughly contemporaneous with the JWST measurements; however, owing to their large uncertainties, we did not use them when fitting the data.
Because of the lack of any mid-IR spectra, there is a limitation on finding the true chemical composition of the assumed dust in SN 1980K. Based on the very recent models of the evolution of SN ejecta dust (Sarangi, 2022), as well as on previous studies of well-studied SNe, such as SN 1987A (Bouchet et al., 2006; Dwek et al., 2010; Arendt et al., 2014) or SN 1993J (Zsíros et al., 2022), either silicates or carbonaceous dust can be present in a CCSN — or, in its environment — a few decades after explosion. Thus, we tested both cases in this study. Just as in Shahbandeh et al. (2023), the absorption and emission properties for silicate and amorphous carbon grains are obtained from Draine & Li (2007) and Zubko et al. (2004), respectively (see Sarangi (2022) for the values of absorption coefficients ). Fox et al. (2010) and Sarangi, 2022 showed that assuming small ( m) grains does not result in significantly different models and has a small impact on the inferred dust mass and temperature. We also tested models with smaller grains in the case of SN 1980K and found negligible differences in the model parameters. Therefore, we applied a 0.1 m grain size throughout our analysis (as also applied by, e.g., Szalai et al., 2019; Zsíros et al., 2022).
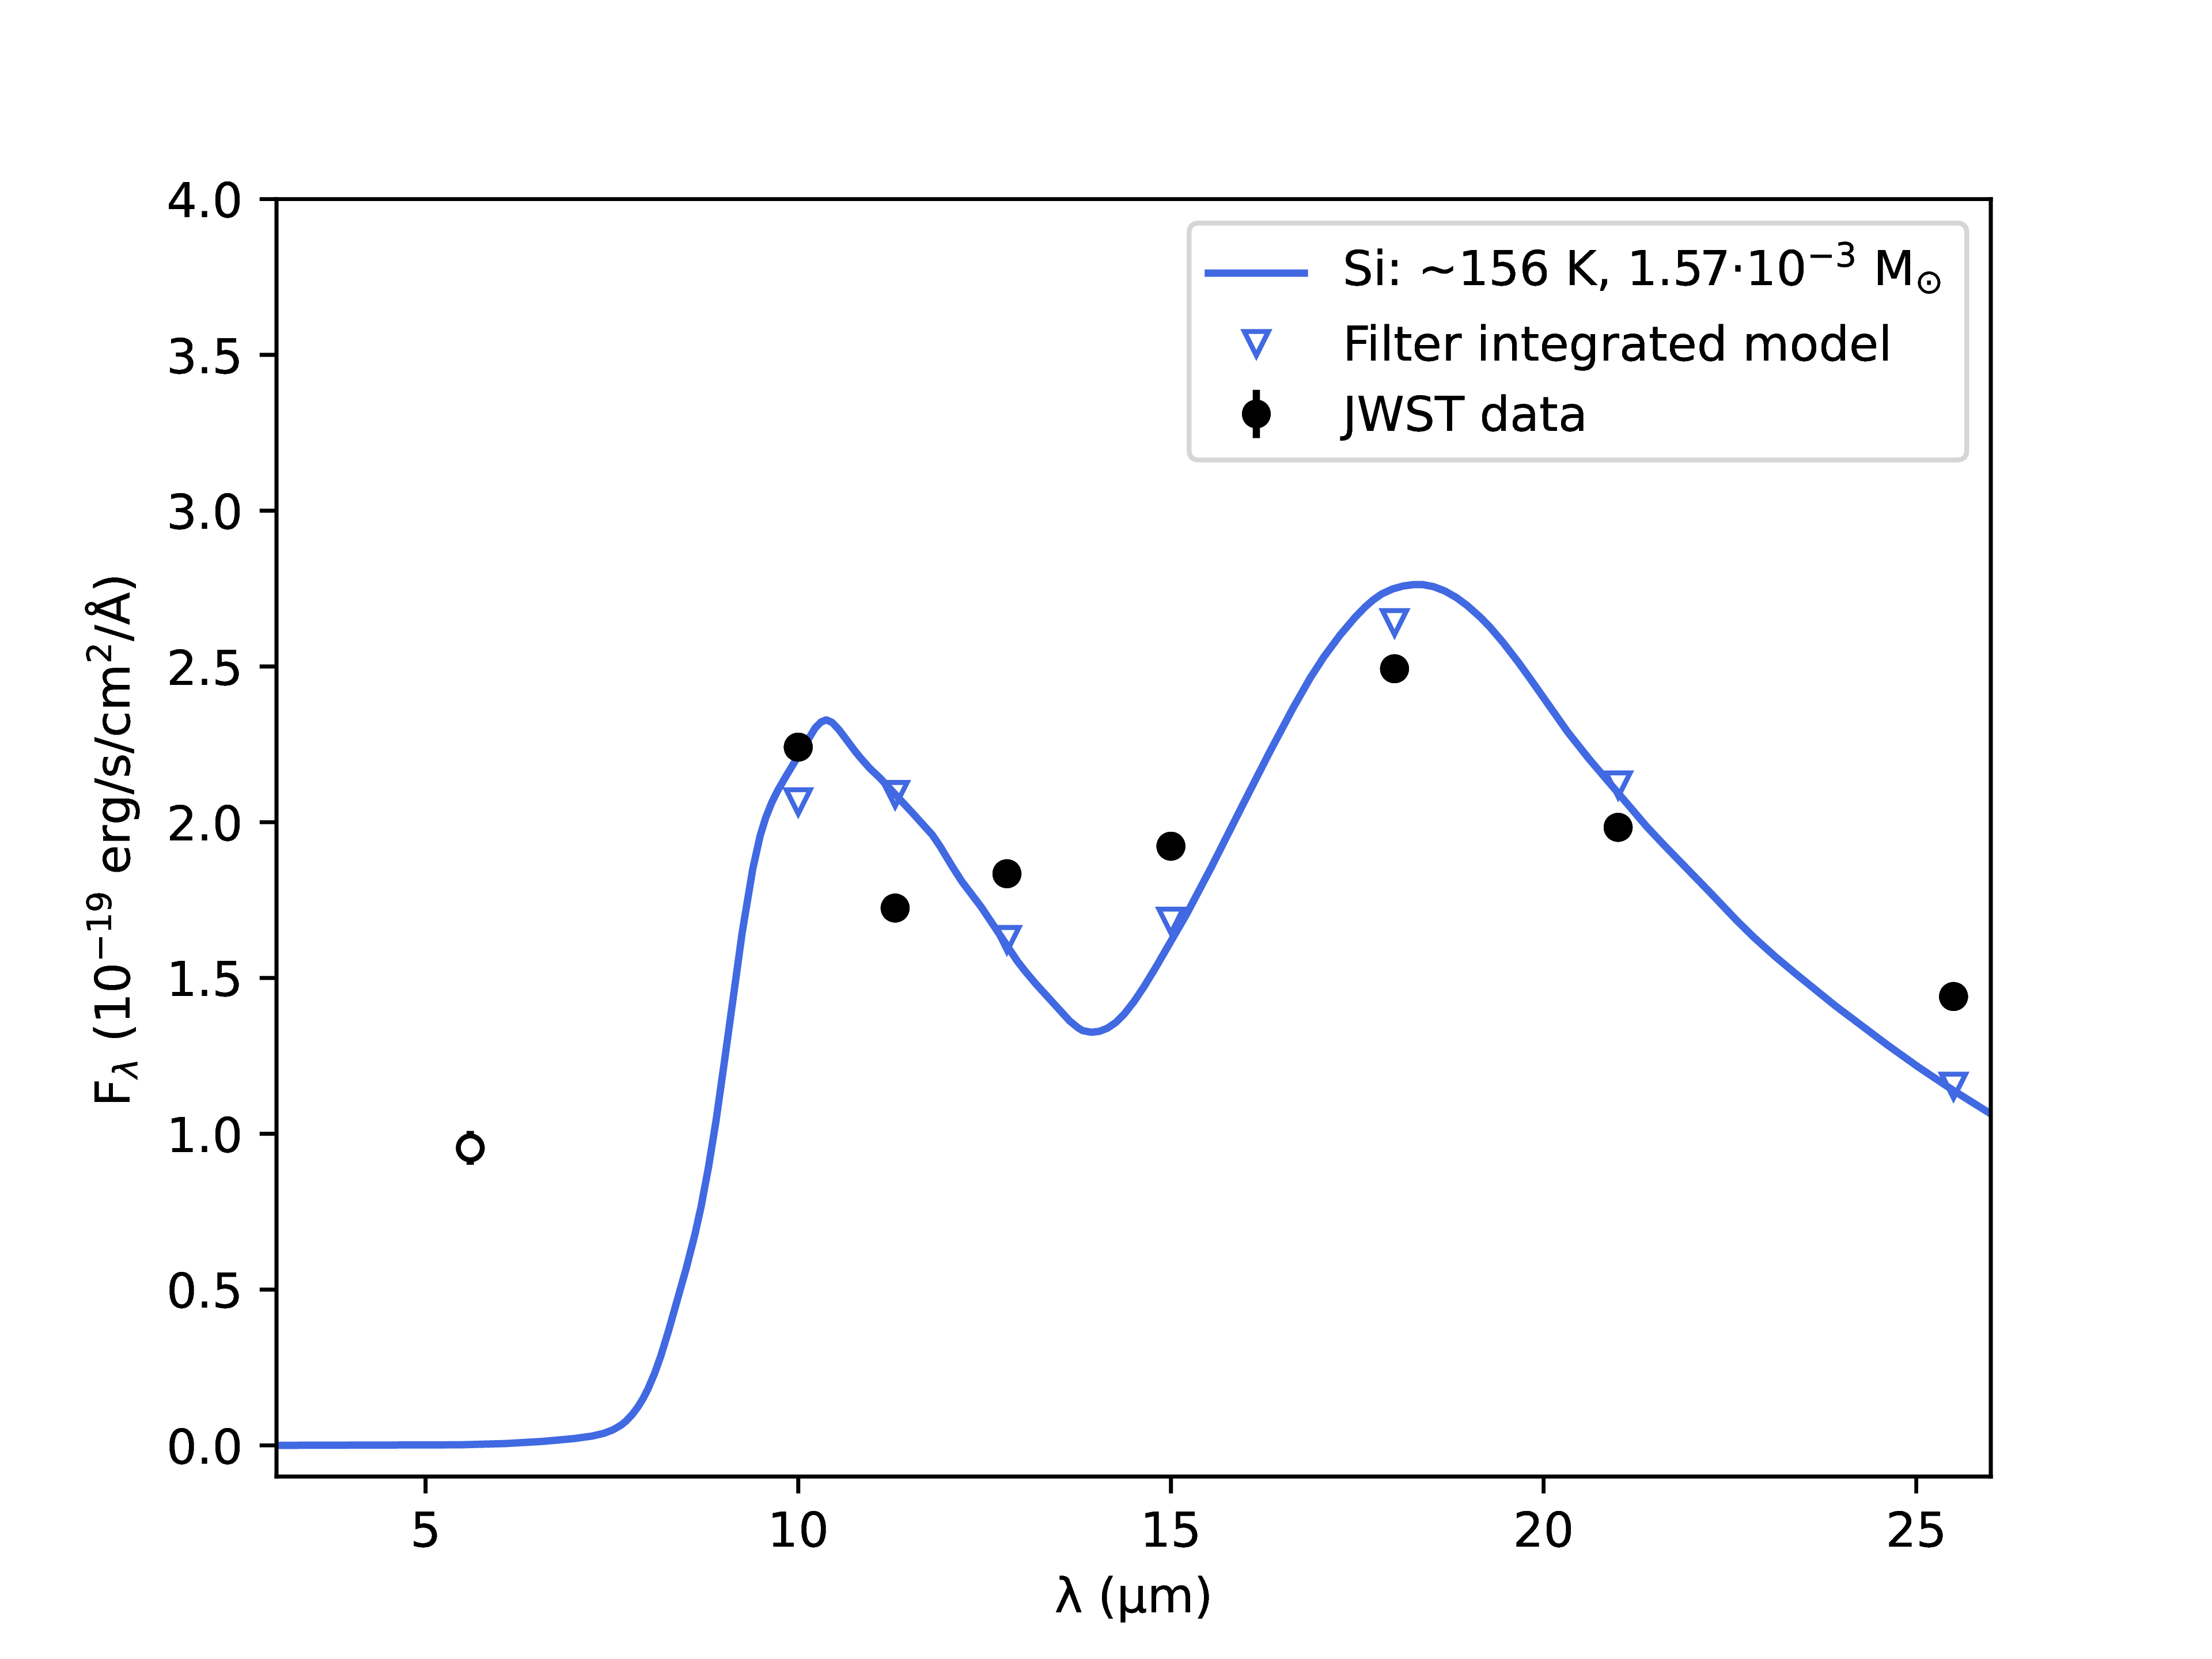
First, we found that the full eight-point JWST/MIRI SED of SN 1980K cannot be properly fitted with either one- or two-component dust models, primarily because of the flux excess found at the 5.6 m data point. Thus, in the following approach, we excluded the 5.6 m data point — this can be explained with another, hot component, see in Sections 3.1 and 3.2 — and fit one-component silicate models to the rest of the seven MIRI fluxes. This step seemed more promising; however, at some wavelengths, model fluxes still do not match sufficiently well with observed ones (see left panel of Fig. 5). Including 2–3 more dust components may result in a proper fit of the SED, but assuming more components with slightly different temperatures is difficult to explain and requires too many free parameters.
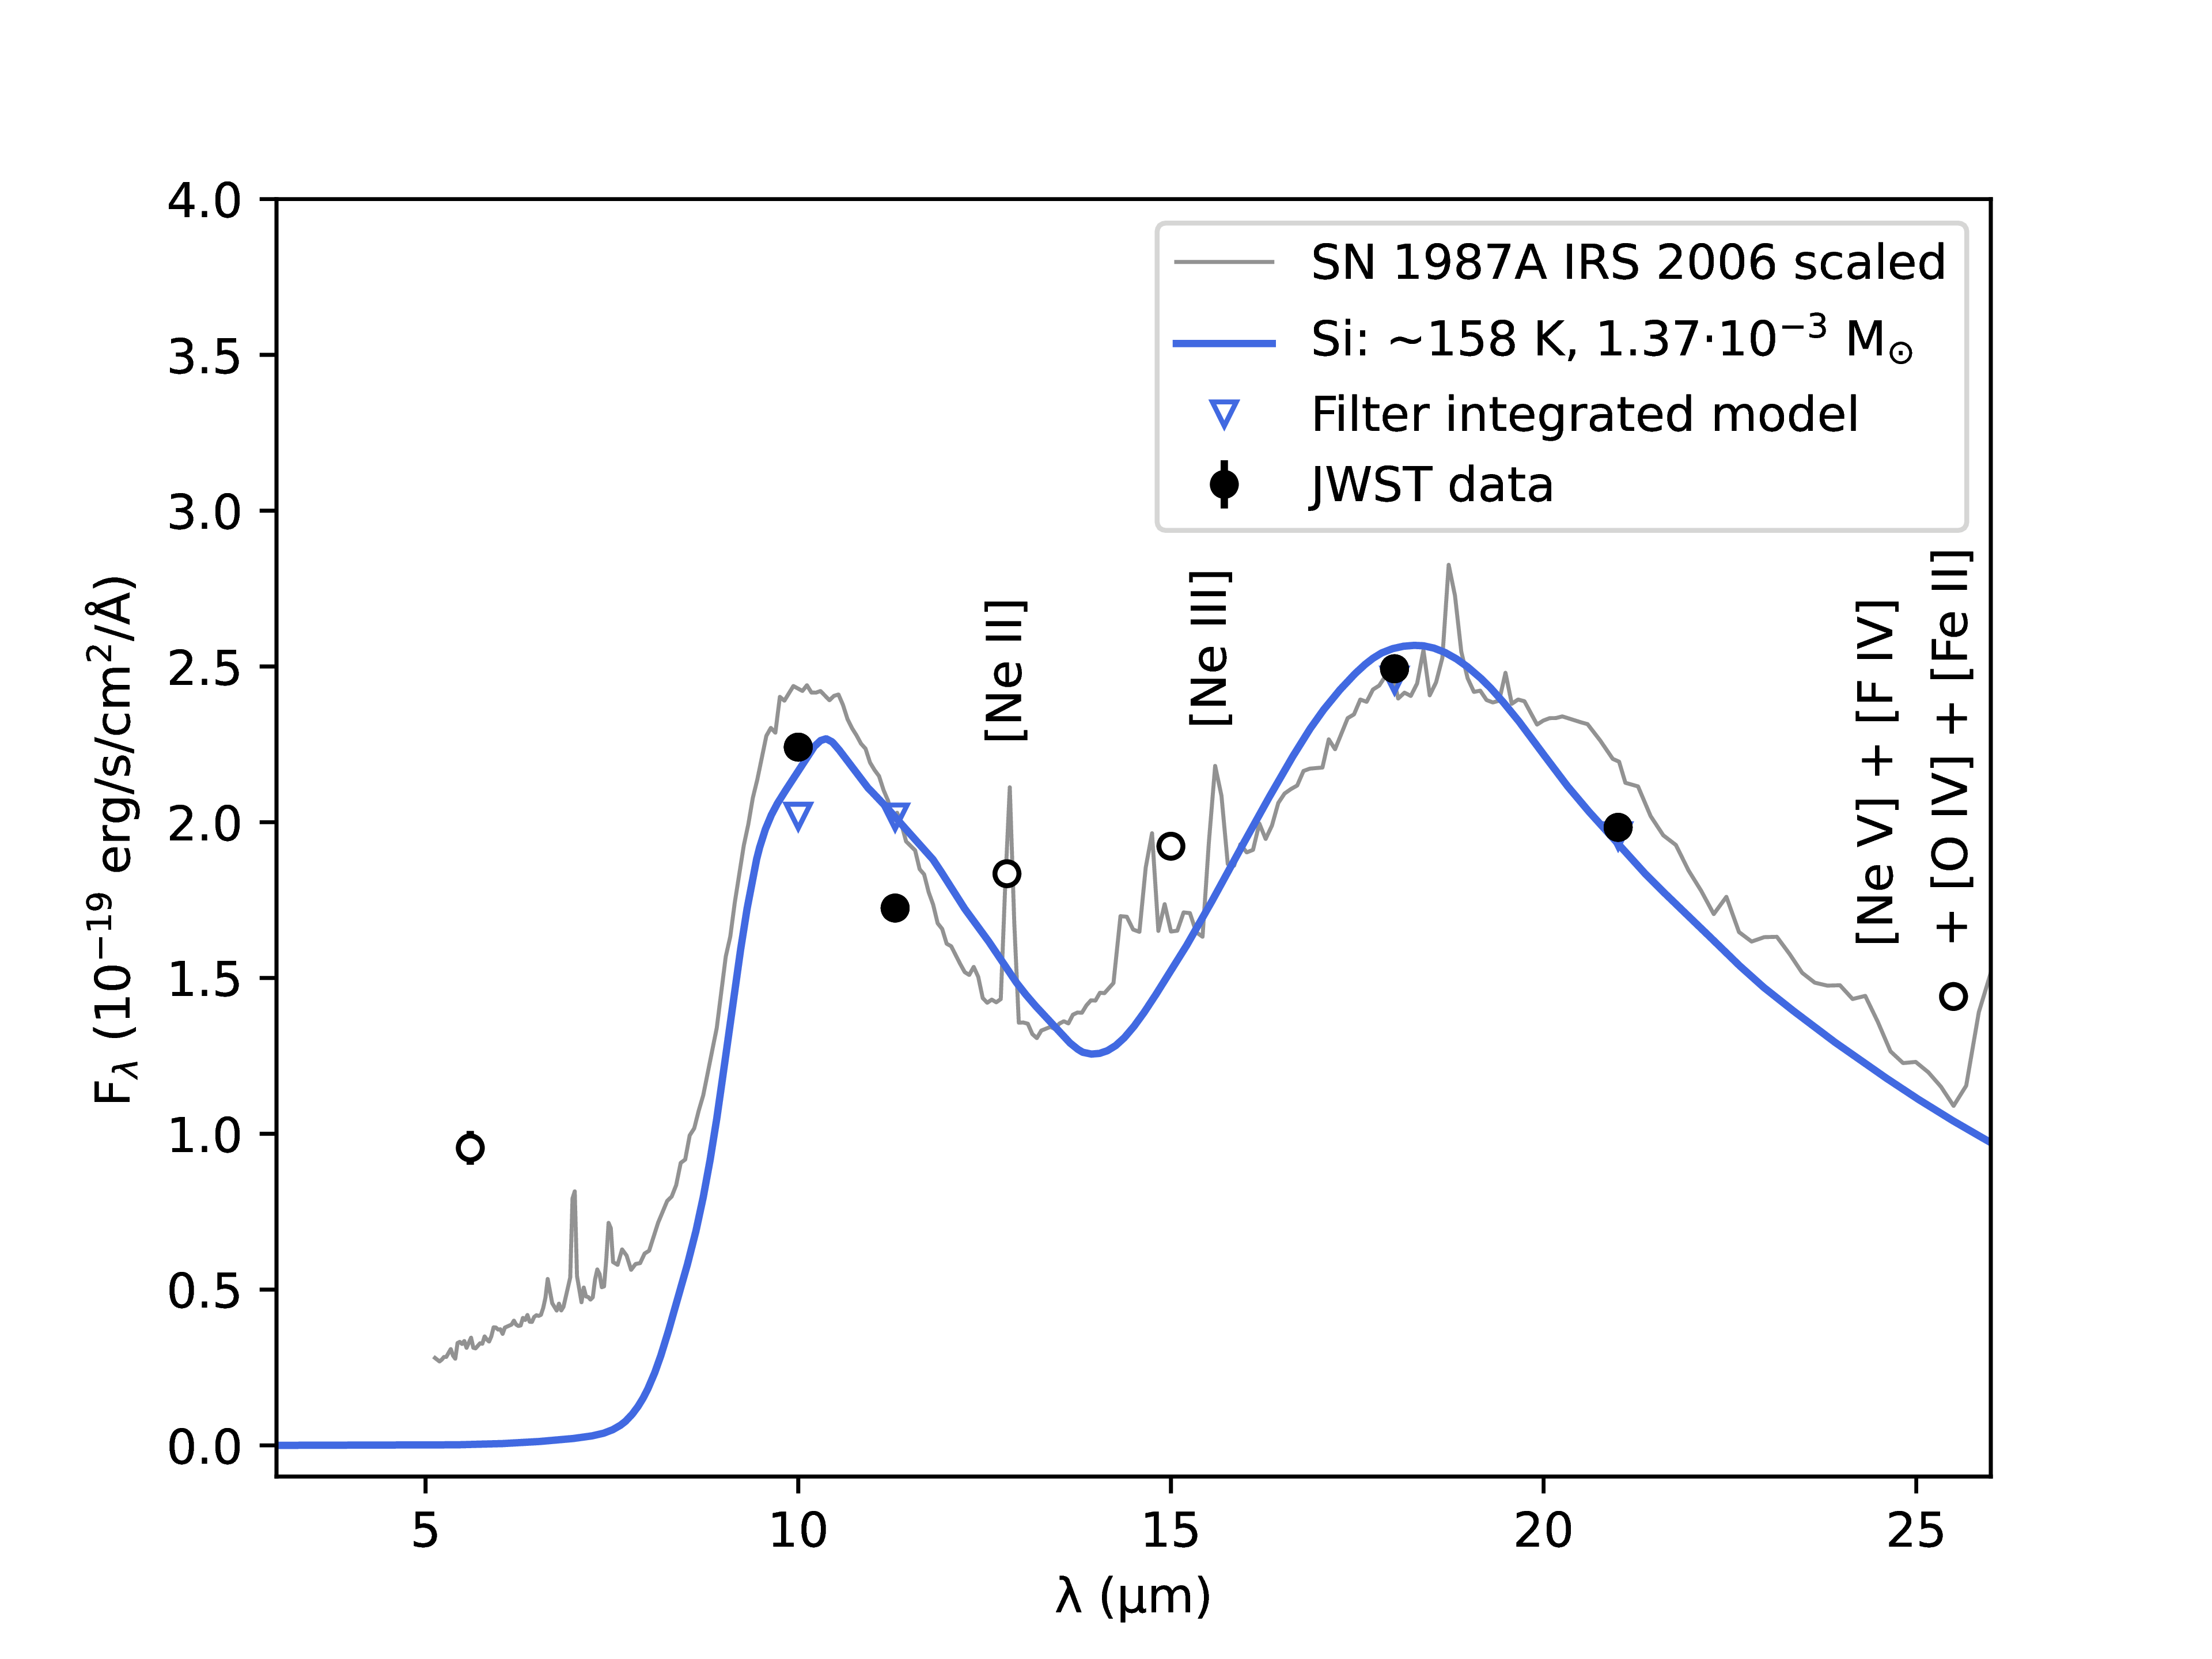
Alternatively, since we are assuming an optically thin case, we checked the possibility of a line-emission contribution to the mid-IR SED. As mentioned above, there are no available mid-IR spectra of SN 1980K or any other SNe decades after explosion except Spitzer/IRS spectra of SN 1987A and the Type IIb SN 1993J. While the only late-time IRS spectrum of SN 1993J (Zsíros et al., 2022) is quite noisy and covers only the 5–14 m range, we used an IRS spectrum of SN 1987A dominated by emission of circumstellar dust located in the equatorial ring (ER) (obtained in 2006, at an age of yr; Bouchet et al., 2006) for comparison. After correcting for distances (adopting kpc for SN 1987A from Bouchet et al., 2006) and rescaling the temperature of the spectrum of SN 1987A from 180 K to 160 K (by multiplying the flux of SN 1987A by the ratio of the Planck function at 160 K to that at 180 K), we found a reasonably good match between the two datasets – except for the quite different flux levels (due to the very different dust masses; see below).
Following the spectrum of SN 1987A, the flux excess around 12.8, 15.0, and 25.5 m seen in the JWST/MIRI data of SN 1980K could be well explained by the line emission of [Ne ii] 12.81 m, [Ne iii] 15.56 m, and a complex contribution of [Ne v], [F iv], [O iv], and [Fe ii] around 25.5 m, based on Bouchet et al. (2006). Excluding these three points from the fitting (still using a one-component Si-dust model), we obtain a dust temperature and mass similar to the previous one, while achieving a better match for the remaining wavelengths (see the right panel in Fig. 5).
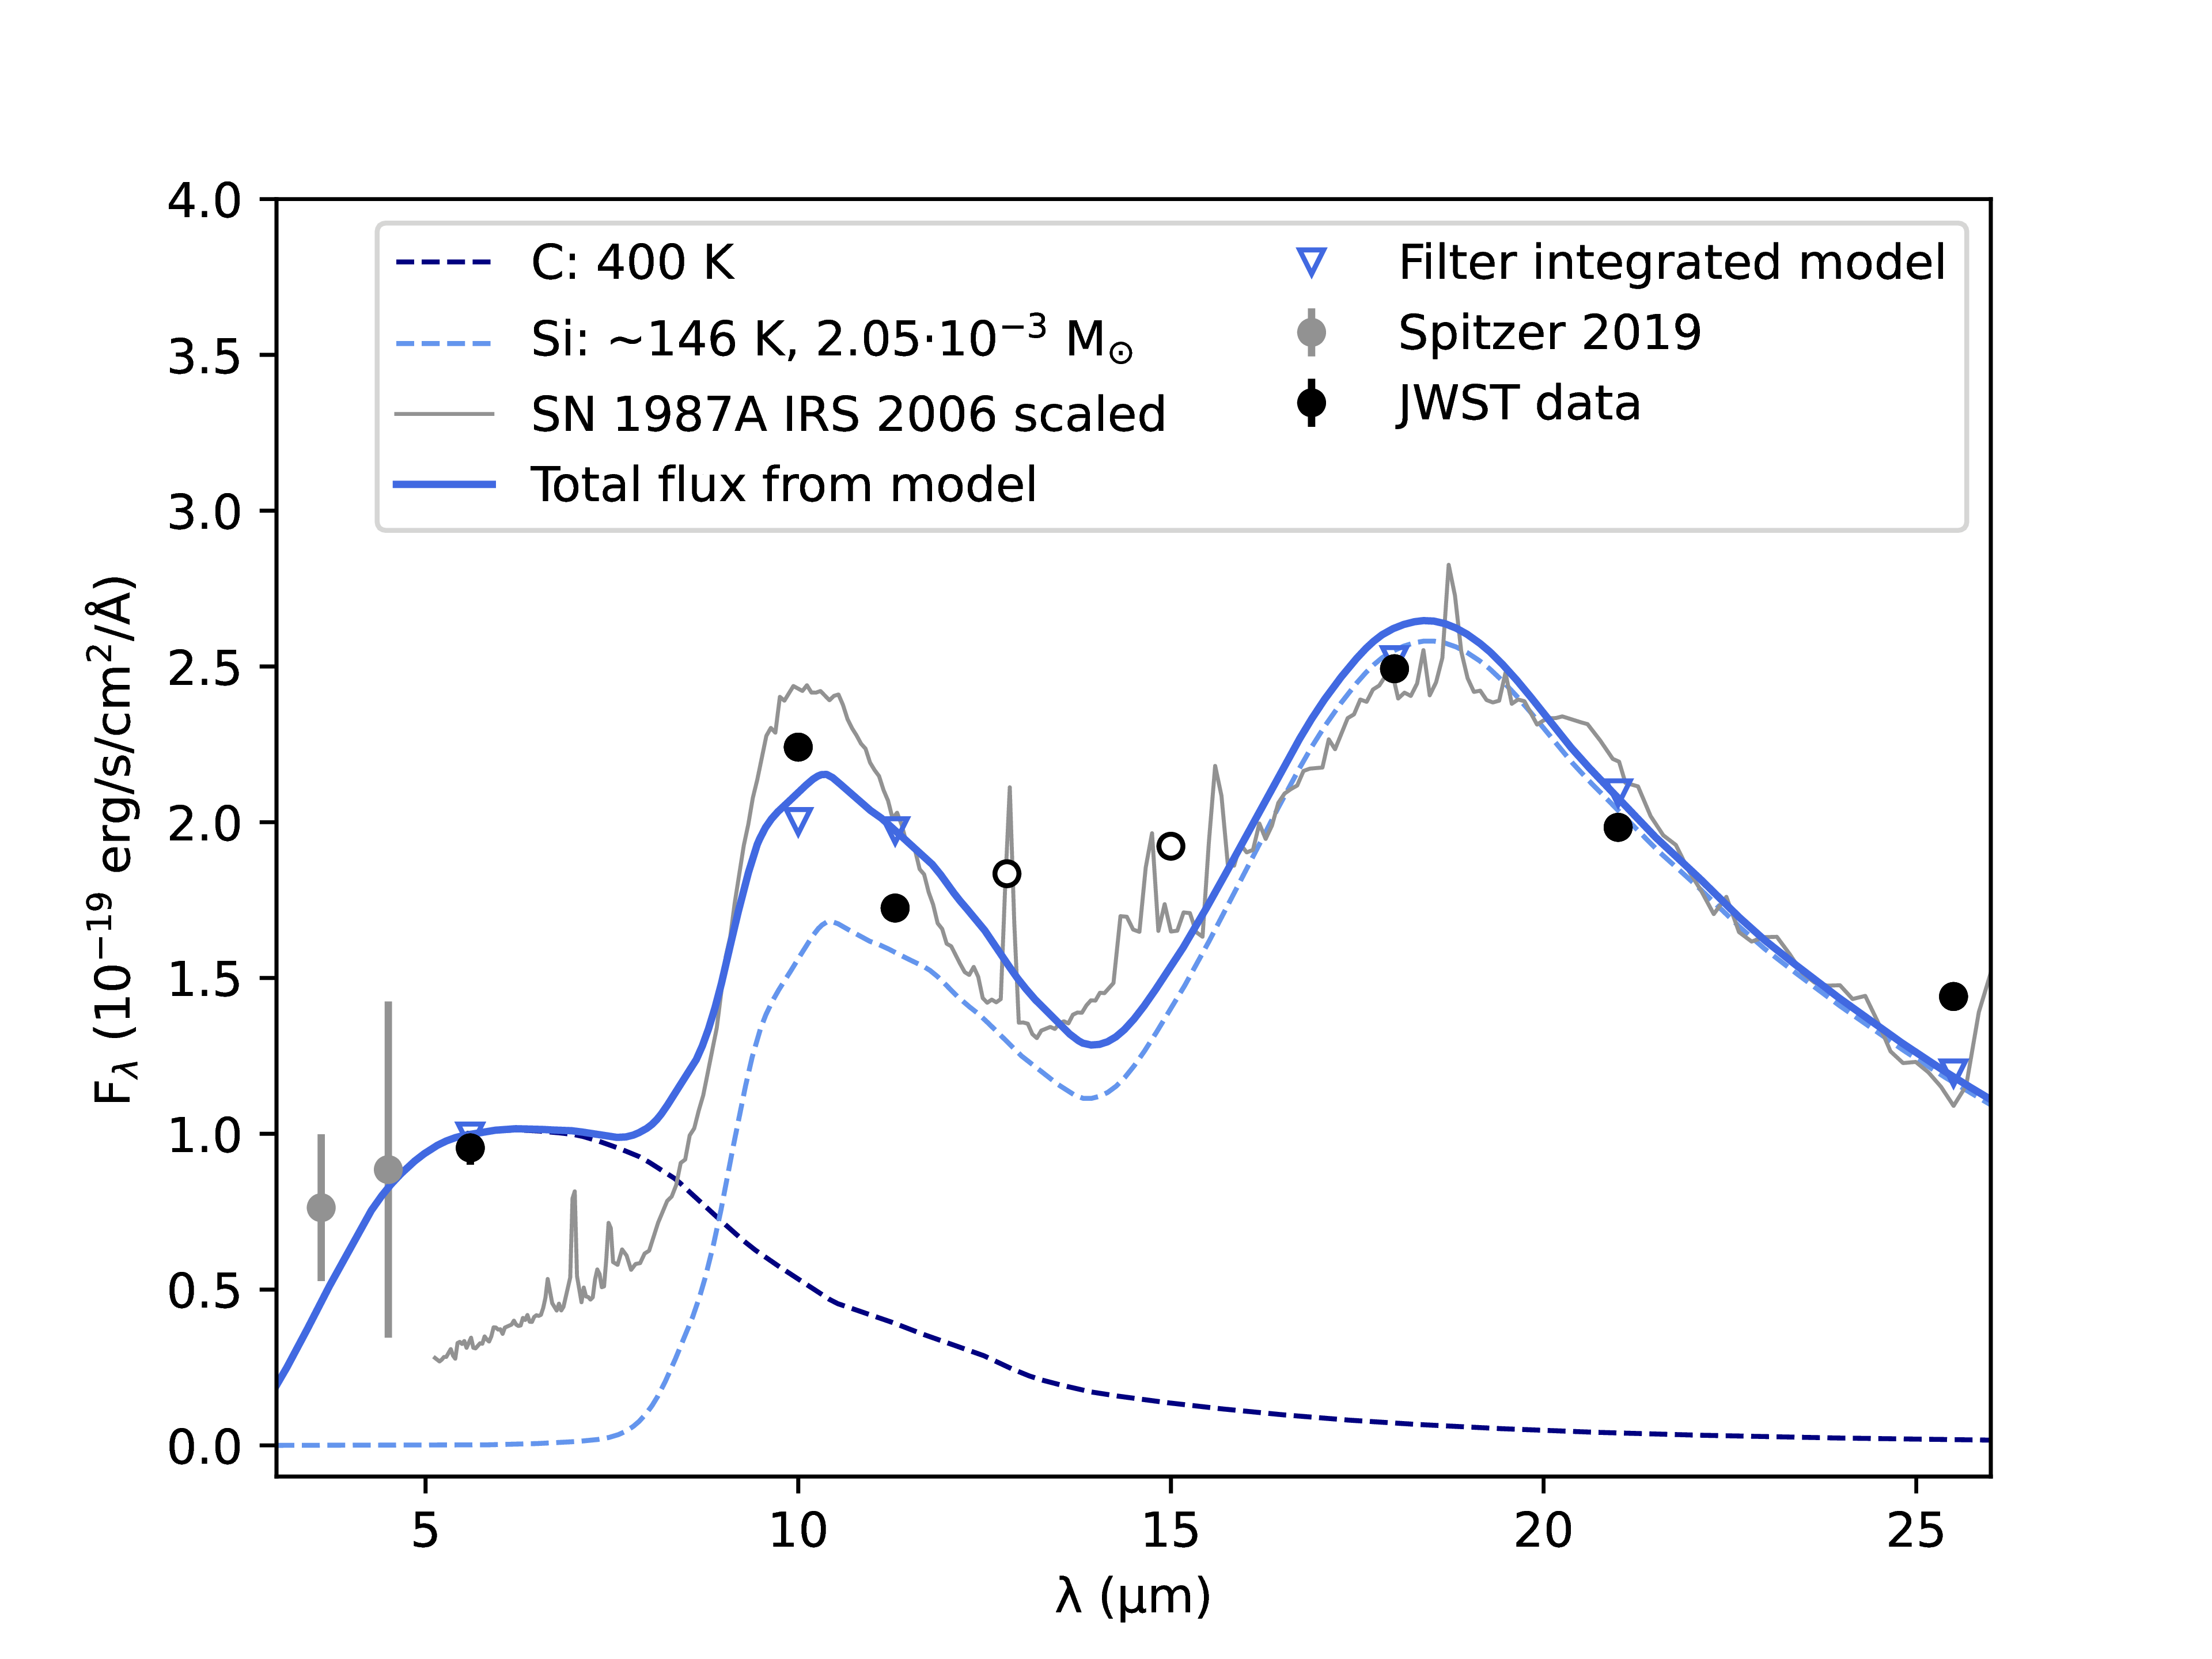
Lastly, we added a fixed temperature hot amorphous carbon component to fit the 5.6 m data. Dwek et al. (2010) found that part of the late-time mid-IR spectra of SN 1987A below m can be only fit with a secondary, significantly higher-temperature ( K) dust component arising from the ER. Similar cases were found by Shahbandeh et al. (2023), who used a K hot carbon dust component in order to fit the 5.6 m MIRI fluxes of both SN 2004et and SN 2017eaw. Thus, we performed fits with two different hot-component temperatures ( K and 1000 K).
We calculated the confidence intervals for the parameters using lmfit.conf_interval555https://lmfit.github.io/lmfit-py/confidence.html. Moreover, applying two-component models implies that estimating the uncertainty from the covariance matrix is not appropriate (also see, e.g., Shahbandeh et al., 2023). Our best-fit models are presented with a confidence interval in Fig. 6 (see Table 2). The primary (silicate) component has a mass of M⊙ and a temperature of K.
The fixed secondary component ( K and 1000 K in the two different models) helps provide a better fit at 5.6 m. Using either of the two hot components contributes only slightly to the longer-wavelength part of the mid-IR SED and results in the same values of the cold-component parameters within uncertainties. Based on JWST data alone, we cannot conclusively determine the temperature of the warm component. If we consider the additional Spitzer 3.6 m and 4.5 m fluxes (which are not involved into the fit), K seems to be a more plausible choice. Nevertheless, both the high uncertainties of the Spitzer data and our numerical models (see later) allow the presence of a hot component with an even higher temperature.
We should also point out further limitations of the applied dust model. This model is based on the assumption that the observed flux arises from an optically thin dust shell, which may not be the case in general. This assumption may lead to an underestimation of the total dust mass (Priestley et al., 2020). Moreover, Dwek et al. (2019) discussed that a large amount of dust could fit the data in the case of an increasing optical depth. However, to check the self-consistency of our models (see also Fox et al., 2010; Zsíros et al., 2022), we calculated the optical depth as follows (Lucy et al., 1989):
| (3) |
where we used cm2 g-1 estimated for 0.1 m silicate grains (based on grain properties published by Draine & Li, 2007; Sarangi, 2022). In the case of optically thin dust, the blackbody radius sets the minimum shell size of an observed dust component. Computing this blackbody radius, , for the primary (silicate) dust component, we get cm. Using this value and the dust mass from our best model described above, we find ; thus, we obtained an optically thin dust shell, which is in accordance with our initial assumption.
However, analytical model components describe only the total dust mass at an average dust temperature without reference to its relative geometry. Even if we assume that the primary (cool) dust component is located in the ejecta, its temperature ( K) is too high not to involve any extra heating mechanisms. As described in detail by e.g. Sarangi (2022), dust grains in the ejecta are heated radiatively from the decay of radioactive isotopes, and, much less dominantly, through collisions with the ambient gas. Decades after explosion, the radioactive heating of the SN is dominated by the decay of 44Ti (and, less dominantly, of 60Co); for SN 1987A, a total luminosity of less than L⊙ was calculated by (for example) Fransson & Kozma (2002) and Seitenzahl et al. (2014). This value is generally used as an order-of-magnitude approximation for CCSNe at the transitional phase (see, e.g., Tanaka et al., 2012; Shahbandeh et al., 2023); thus, we also use it as an upper limit for the contribution of radioactive heating to the late-time luminosity of SN 1980K. The total luminosity calculated from the observed mid-IR SED is an order of magnitude higher ( erg s-1, i.e. L⊙), thus, it is necessary to invoke additional heating sources — such as back-scattered high-energy photons from the CSM interaction — or assume that the dust we see in the mid-IR is located in the CSM and is heated collisionally/radiatively. We discuss further details in Section 4.
Since certain dust-forming and heating processes take place in different regions of (or, outside) the expanding remnant, the location of the dust plays an important role in identifying its origin. In order to draw conclusions on the location of the assumed dust grains, we computed numerical models with a radiative-transfer code and also investigated the critical radii of the SN together with the possible dust-forming and heating channels.
| (K) | () | (K) | () |
|---|---|---|---|
| 400 | 6.6 | ||
| 1000 | 0.1 |
aWe assumed a cool silicate component and an additional fixed-temperature hot amorphous carbon component, and used a 0.1 m grain size, for all models. Best-fit values are presented with (%) confidence interval as reported by lmfit.conf_interval. The temperature of the hot component was fixed throughout the fitting process.
3.2 Numerical modeling of the mid-IR SED
For a consistency check of our analytical models and also to determine the possible geometry of the dust, we applied the mocassin666 https://mocassin.nebulousresearch.org/ (MOnte CArlo SimulationS of Ionized Nebulae, Ercolano et al., 2003; Ercolano et al., 2005; Ercolano et al., 2008) three-dimensional (3D) Monte Carlo photoionization and dust radiative-transfer code. The code was originally developed to describe photoionization regions, but has been also applied in several cases for modeling dusty SNe (e.g., Ercolano et al., 2007; Wesson et al., 2015; Wesson & Bevan, 2021).
In mocassin, the radiation field is described with a discrete number of energy packets, and the mean intensity is calculated from the possible light-matter interactions of these energy packets. The code follows the absorption and re-emission on account of particles in the gas and the absorption, scattering, and re-emission owing to dust grains (Ercolano et al., 2005). Dust grains with different sizes and species can be included and treated separately throughout the modeling. Numerous dust geometrical configurations can be considered in the code, including spherically symmetric, shell-like, and torus-like structures. The code can also take into account smooth and clumpy dust density distributions and handle various clump parameters.
Various models with mocassin were computed to find similar outputs to the observed mid-IR SED of SN 1980K. We examined a spherical shell of dust, choosing a central illuminating source with a simple blackbody continuum, following other mocassin-based SN studies (e.g., Ansari et al., 2022). (As described above, radioactive decay cannot heat the dust to the temperatures that we observe, implying that there is no special need to choose a diffuse heating source.) In this framework, the luminosity, the temperature of the illuminating source, and the size of the dust shell are not independent parameters. However, we found that the shape of the IR SED is mainly insensitive to the temperature of the central source; similar results were presented in the case of SN 1987A on day 8515 after explosion (Wesson et al., 2015). Moreover, we were able to fix the luminosity of the central source close to the observed mid-IR luminosity of the SN ( erg s-1), while its temperature was finally set to 4800 K (giving a mid-IR SED with a shape being similar to the observed one).
We assumed both silicate and amorphous carbon composition with a grain radius of 0.1 m, and a particle density distribution proportional to . The same extinction, absorption, and scattering coefficients used in the case of analytical models (Sarangi, 2022) were applied. We fixed the dust mass at as an average value for the amount of cold dust originating from our final analytical models.
After doing these steps, we were allowed to compute models in a large range of potential shell sizes, varying the values of the outer radius and the ratio of inner and outer radii. Since we do not know the true nature of the heating source of the dust grains in SN 1980K, we cannot be sure how realistic these sizes are; nevertheless, we were able to test, at a given total luminosity and dust mass, what (if any) kind of dust geometry provides outputs comparable to the observed mid-IR SEDs.
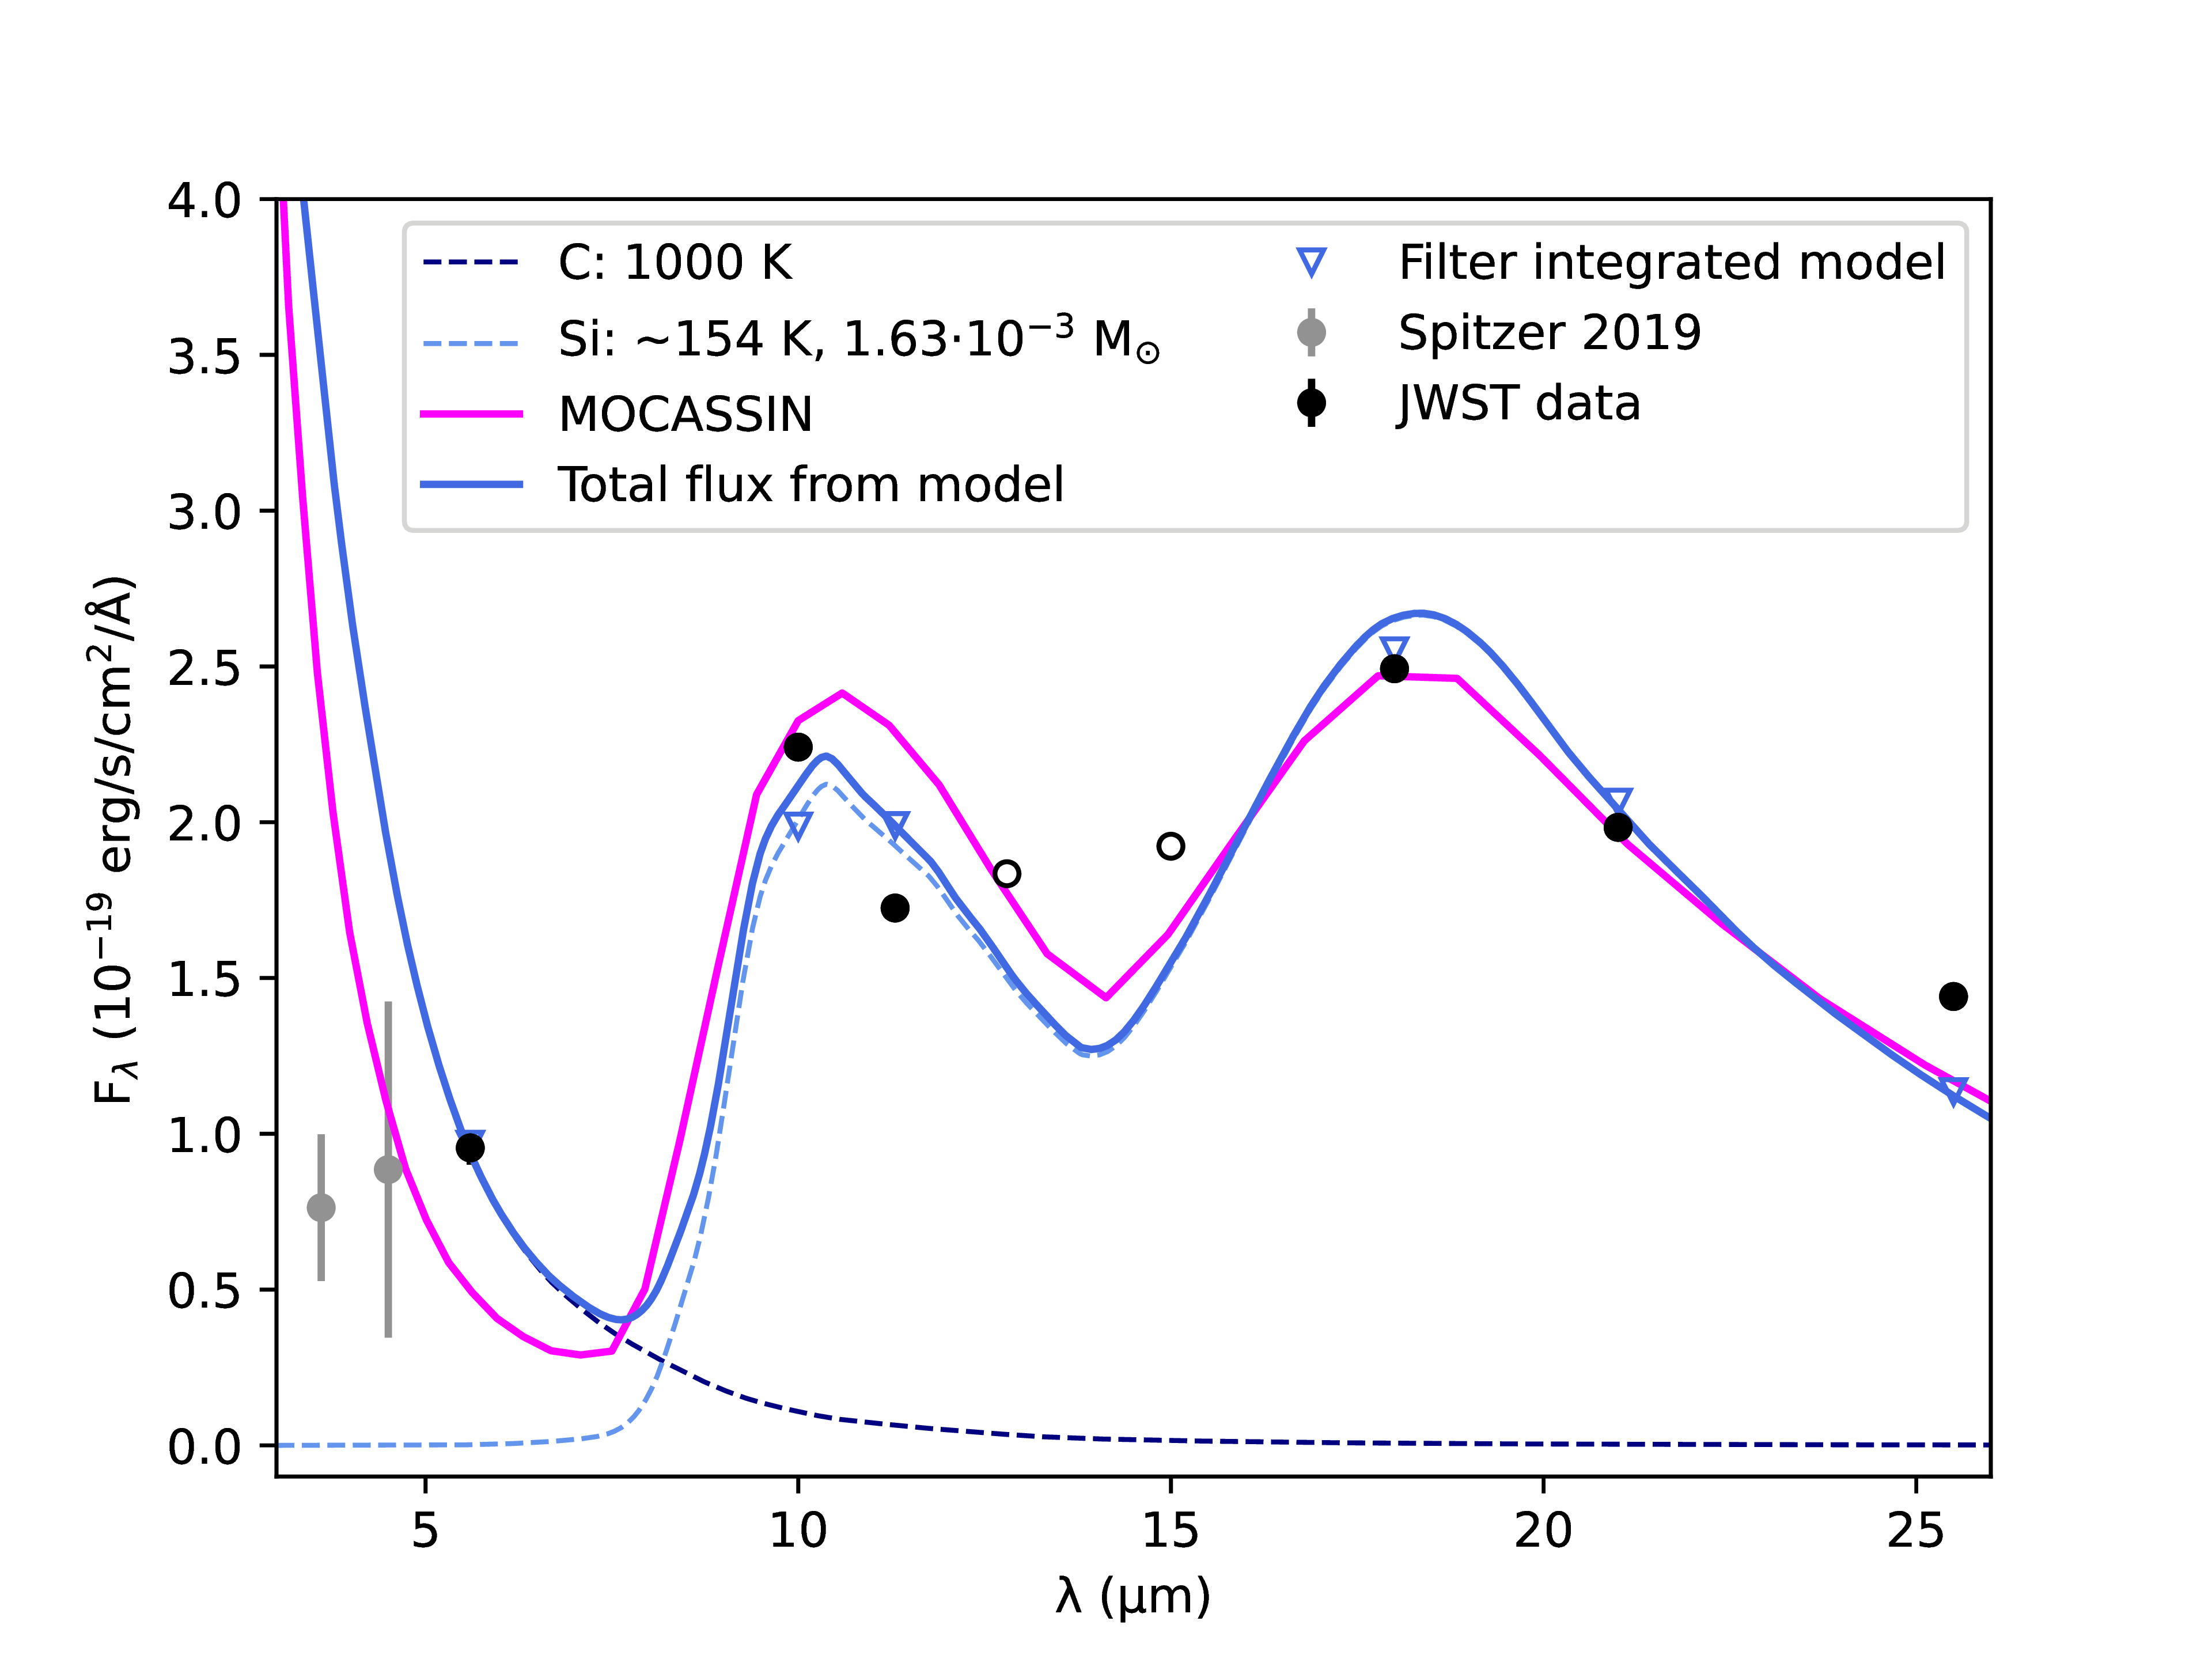
Similarly to the results of our analytical modeling (see in Fig. 6), mocassin models do not match the JWST data in the case of carbon composition dust. Thus, numerical models strengthen the conclusion that the dust in the environment of SN 1980K is presumably dominated by silicates. We found that the SN can be described with an outer radius of cm, and a ratio of the inner and outer radii of , implying that the presumed dust shell can be quite thick. This configuration results in a very low optical depth, strengthening the optically thin assumption we applied during our analytical modeling.
We also found that, at shorter wavelengths, mocassin models show a large flux excess, regardless of the values of the assumed parameters. This aligns well with the results of our analytical models. In the right panel of Fig. 6, we compare a silicate-based mocassin model with our best-fit two-component analytical model containing a 1000 K hot component.
3.3 Modeling optical line-profile asymmetries
Another essential part of this study is the analysis of the late-time optical spectrum of SN 1980K (see Sec. 2.4), in order to find further clues about local dust and to compare the results with those of the mid-IR SED analysis. It is a general assumption that red-blue asymmetries in optical and near-IR emission-line profiles may be associated with the presence of newly-formed dust in the (inner) ejecta of CCSNe (Lucy et al., 1989; Milisavljevic et al., 2012; Bevan & Barlow, 2016; Bevan et al., 2017; Niculescu-Duvaz et al., 2022). In this picture, the presence of SN dust results in an extended red wing and/or a blueshifted peak due to scattering and absorption effects. Specifically, dust in the ejecta affects light only from the receding part of the ejecta, causing the red wing of the line profile to be suppressed. Crucially, CSM dust does not do this, being exterior to the expanding ejecta; it absorbs light from both the approaching and receding gas. As an alternative explanation, red-blue asymmetries of the line profiles may originate from intrinsic asymmetries in the SN explosion; however, if this were true, we would see a statistically homogeneous sample of redshifted and blueshifted emission-line peaks in SN spectra — and this is not the case (Niculescu-Duvaz et al., 2022).
Bevan & Barlow (2016) present a code called damocles (Dust Affected Models Of Characteristic Line Emission in Supernovae) to model the effect of dust on line profiles of CCSNe. With damocles, it is possible to investigate the effect of dust internal to SNe (hence located in the shocked and/or unshocked ejecta) on the line shapes and determine the dust properties. damocles is based on a Monte Carlo approach and can handle various grain species and sizes with smooth and clumpy dust density profiles. The recent Keck spectrum provides a great opportunity to draw conclusions about the dust parameters from the optical line profiles and also a comparison of our findings with those of previous studies (Milisavljevic et al., 2012; Bevan et al., 2017; Niculescu-Duvaz et al., 2022).
The code does not use an entirely self-consistent procedure; instead, it assumes that all absorbed energy packets may be re-emitted outside of the explored wavelength range. Moreover, the optical extinction due to dust is considered to be temperature independent and the total energy is not conserved in the examined wavelength range, the code retains the signature of the normalised line profiles (Bevan & Barlow, 2016).
The ejecta are assumed to be in a 3D Cartesian grid with a particular composition and density distribution. The gas functions as an initial emission source, and dust properties are considered throughout the analysis (Bevan & Barlow, 2016). We coupled the gas and dust and did not included electron scattering. If we assume a constant SN induced mass-flow rate, the velocity and the dust density exponents become dependent upon each other (Bevan & Barlow, 2016).
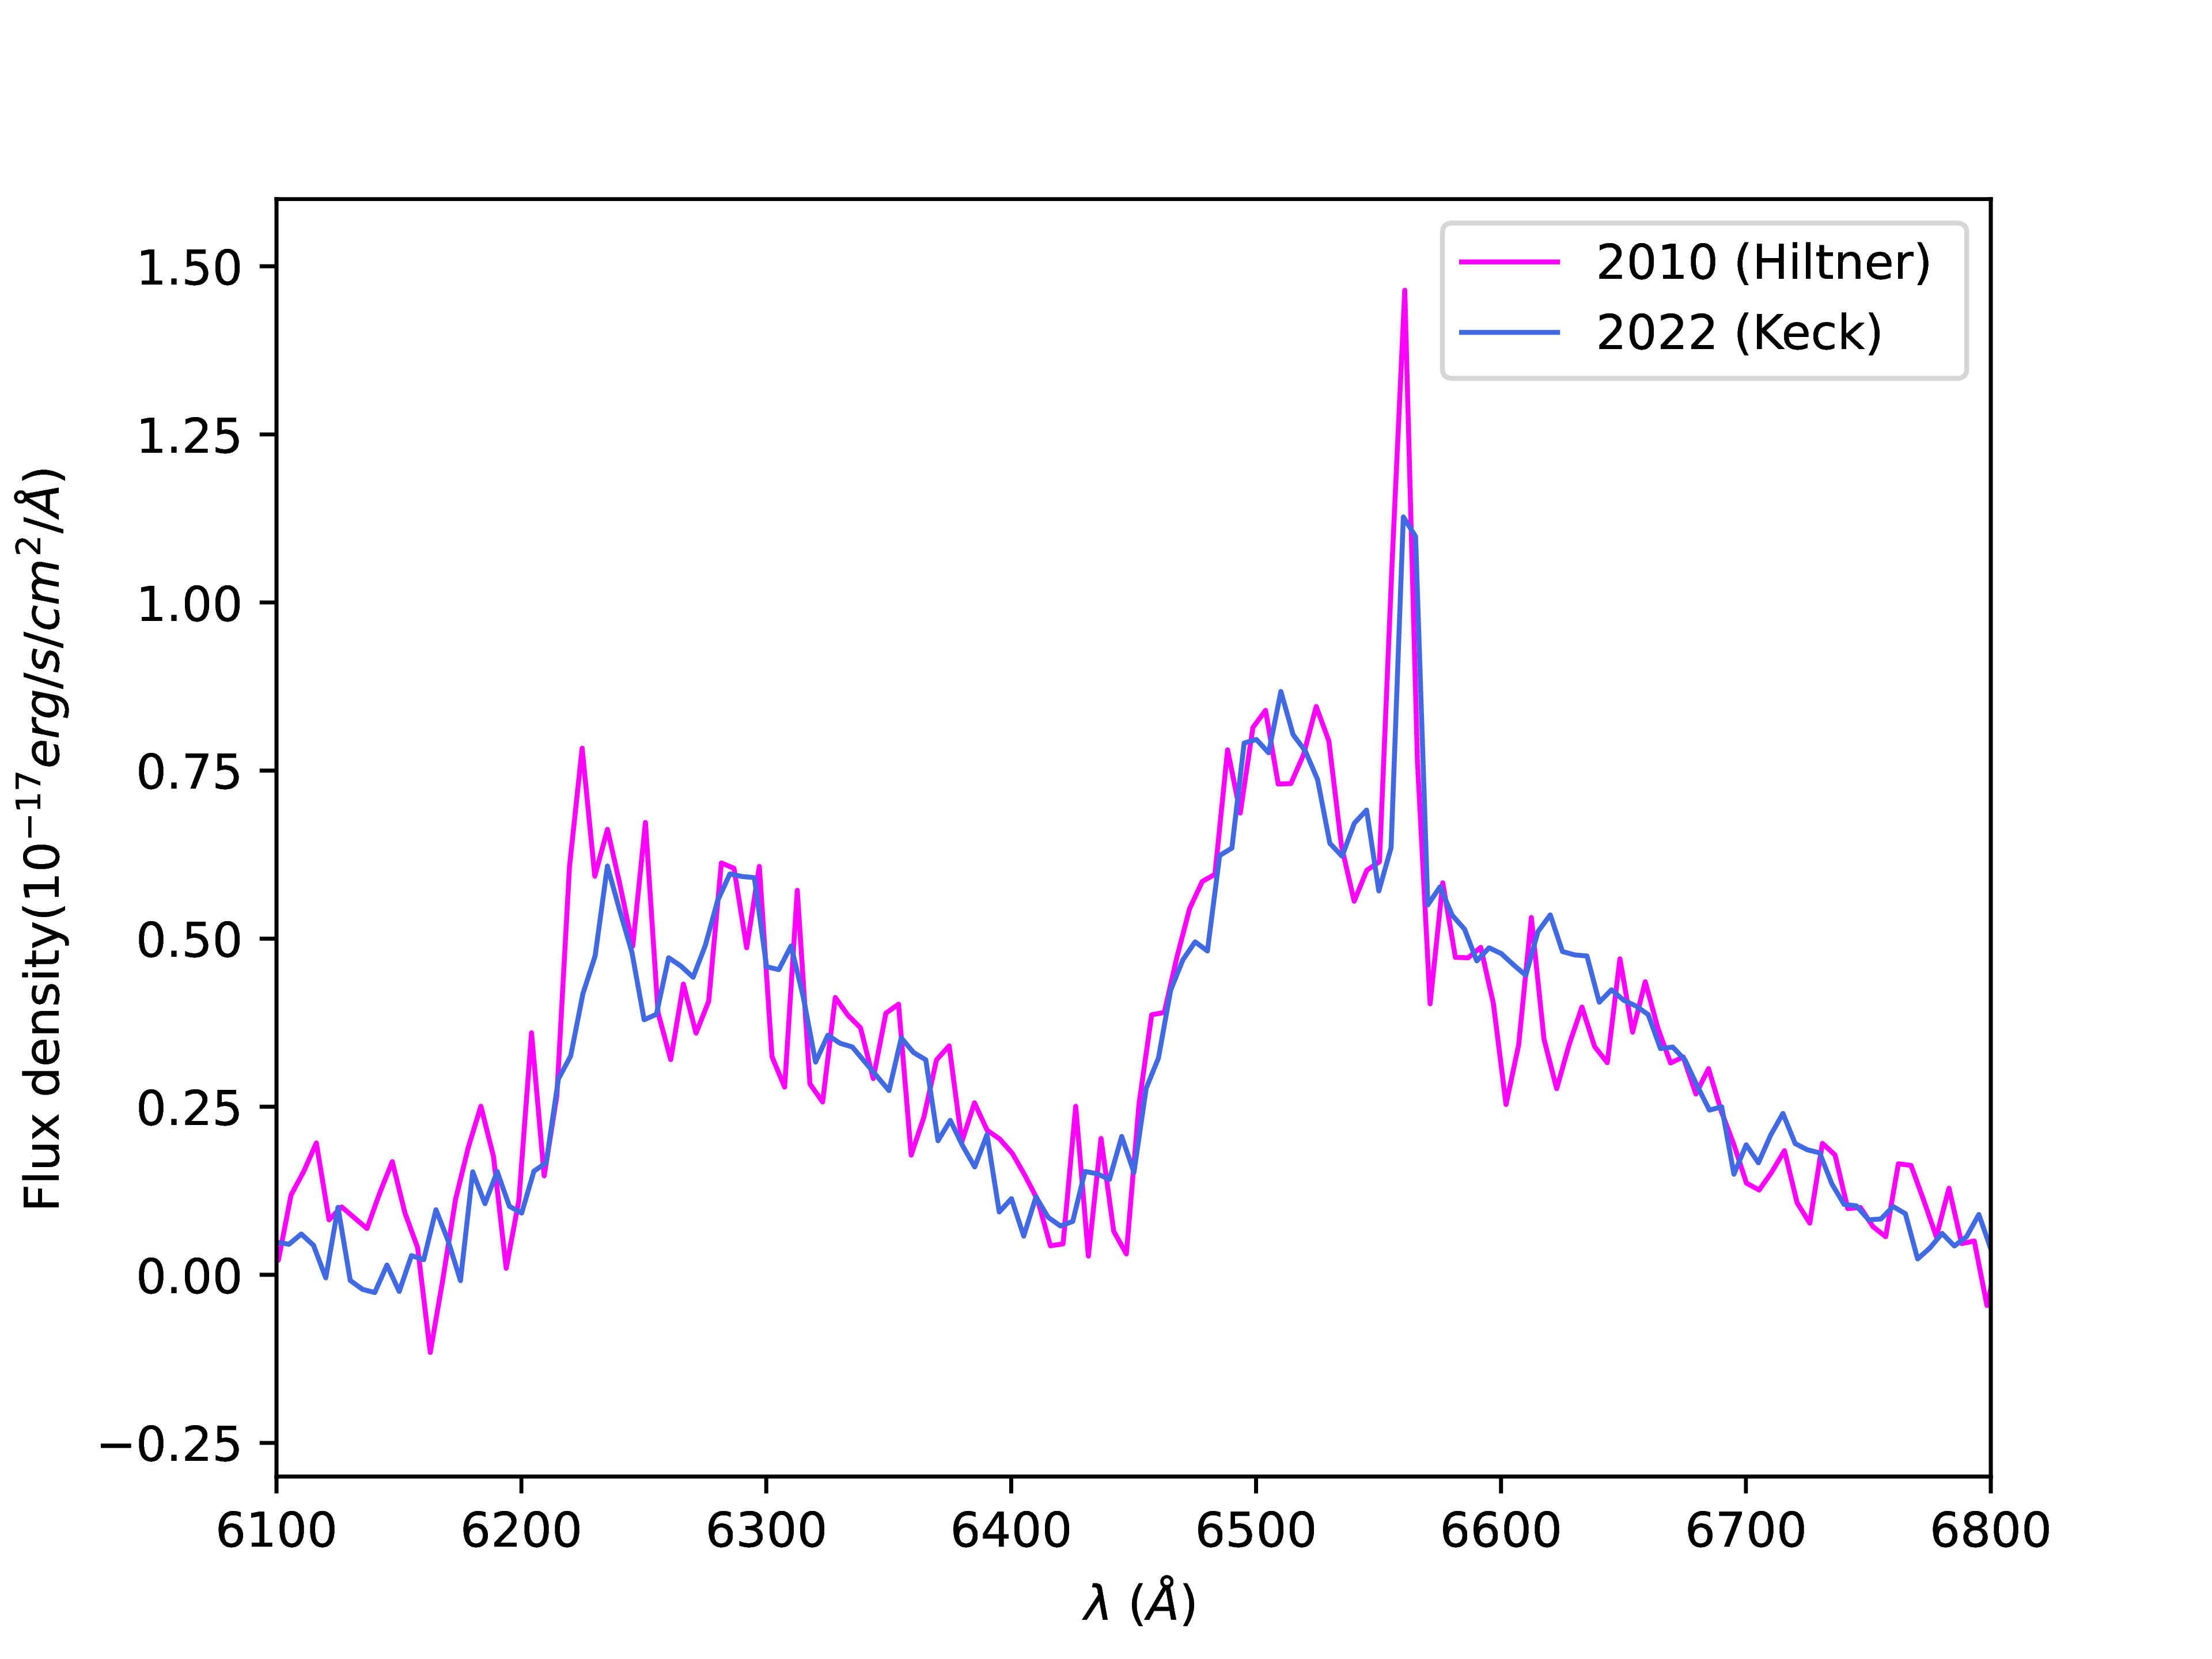
Following the previous studies, we investigate the H and [O i] 6300, 6363 line profiles for modeling with damocles. Our modeling approaches basically follow the methods described by Bevan & Barlow (2016) (also applied by Bevan et al., 2017; Niculescu-Duvaz et al., 2022). Before investigating the models, we compared the new Keck spectrum of SN 1980K to the ones obtained in 2010 (Milisavljevic et al., 2012; Bevan et al., 2017) and during 2016–2018 (Niculescu-Duvaz et al., 2022). We found that our recently obtained spectrum is very similar to previous ones (Fig. 7); however, there were some absolute flux calibration and signal-to-noise-ratio issues between the 2016–2018 average spectrum presented by Niculescu-Duvaz et al. (2022) and our one. Thus, we used only the 2010 spectrum and the work of Bevan et al. (2017) as a reference during the next steps of damocles modeling. Nevertheless, the dust masses presented by Niculescu-Duvaz et al. (2022) (0.2 and 0.6 M⊙ in the case of smooth and clumpy line-profile models for both lines, respectively) basically agree with our results (Table 3).
Note that the dust masses depend on several model parameters, especially in the case of clumpy models. Furthermore, the [O i] 6300, 6363 line already has a complex profile. Thus, we focused on retrieving the minimal dust masses required to match the shape of the line profile with the observed spectra. Comparing the H and [O i] 6300, 6363 line profiles of the two spectra in detail, we only found a small change in the velocities of [O i] lines (5000 km s-1 instead of 5500 km s-1), while for the H line, we defined the same outer expansion velocity (5500 km s-1) as Bevan et al. (2017). We assumed free expansion and calculated the outer radius of the emitting region from the velocity profile. Since both lines are optically thin recombination lines, we considered the emissivity distribution proportional to the square of the local gas density (Bevan & Barlow, 2016).
Both amorphous carbon and silicate compositions were tested with smooth and clumpy density distributions, exploring the parameter space manually. Dust grains are more likely to accumulate in clumps (e.g. Wesson et al., 2015), however, in this case, radiation is exposed to less scattering and to less absorption. Thus, clumpy Damocles models yield less of the scattering wing and attenuate the red wing less than expected for a smooth model and require a factor of 1.5–3 larger dust masses and also a small adjustment to the grain sizes (Niculescu-Duvaz et al., 2022). We applied grains with 0.1 m radius, according to both our analytical and mocassin models, and previous Damocles models (Bevan et al., 2017; Niculescu-Duvaz et al., 2022). Contrary to the radiative-transfer modelling of the IR SED — where greater grain sizes typically lead to lower dust masses to fit the IR regime (see Wesson et al., 2015) — in the case of optical line-profile analysis, larger dust masses are needed to fit the same amount of absorption in the case of larger grain sizes (Bevan & Barlow, 2016).
First, we tested line-profile models adopted from Bevan et al. (2017) taken 10,964 days post-explosion and evolved to 15,388 days post-explosion to describe the Keck spectrum. We found that in the case of smooth and clumpy density distributions, a higher dust mass is required to fit both the H and [O i] 6300, 6363 line profiles of the Keck spectrum, while other parameters needed fine-tuning. Bevan et al. (2017) reported 0.1 M⊙ and 0.12 M⊙ of dust in the case of H line-profile models, and 0.2 M⊙ and 0.3 M⊙ dust in the case of [O i] 6300, 6363 line-profile models, for smooth and clumpy dust density distributions, respectively. To find the best model, we also varied all the examined parameters. First, we identified the outer expansion velocity that describes the width of the broadened line. Then, we set the corresponding density profile index (defined by ) and dust mass based on the steepness of the red wing.
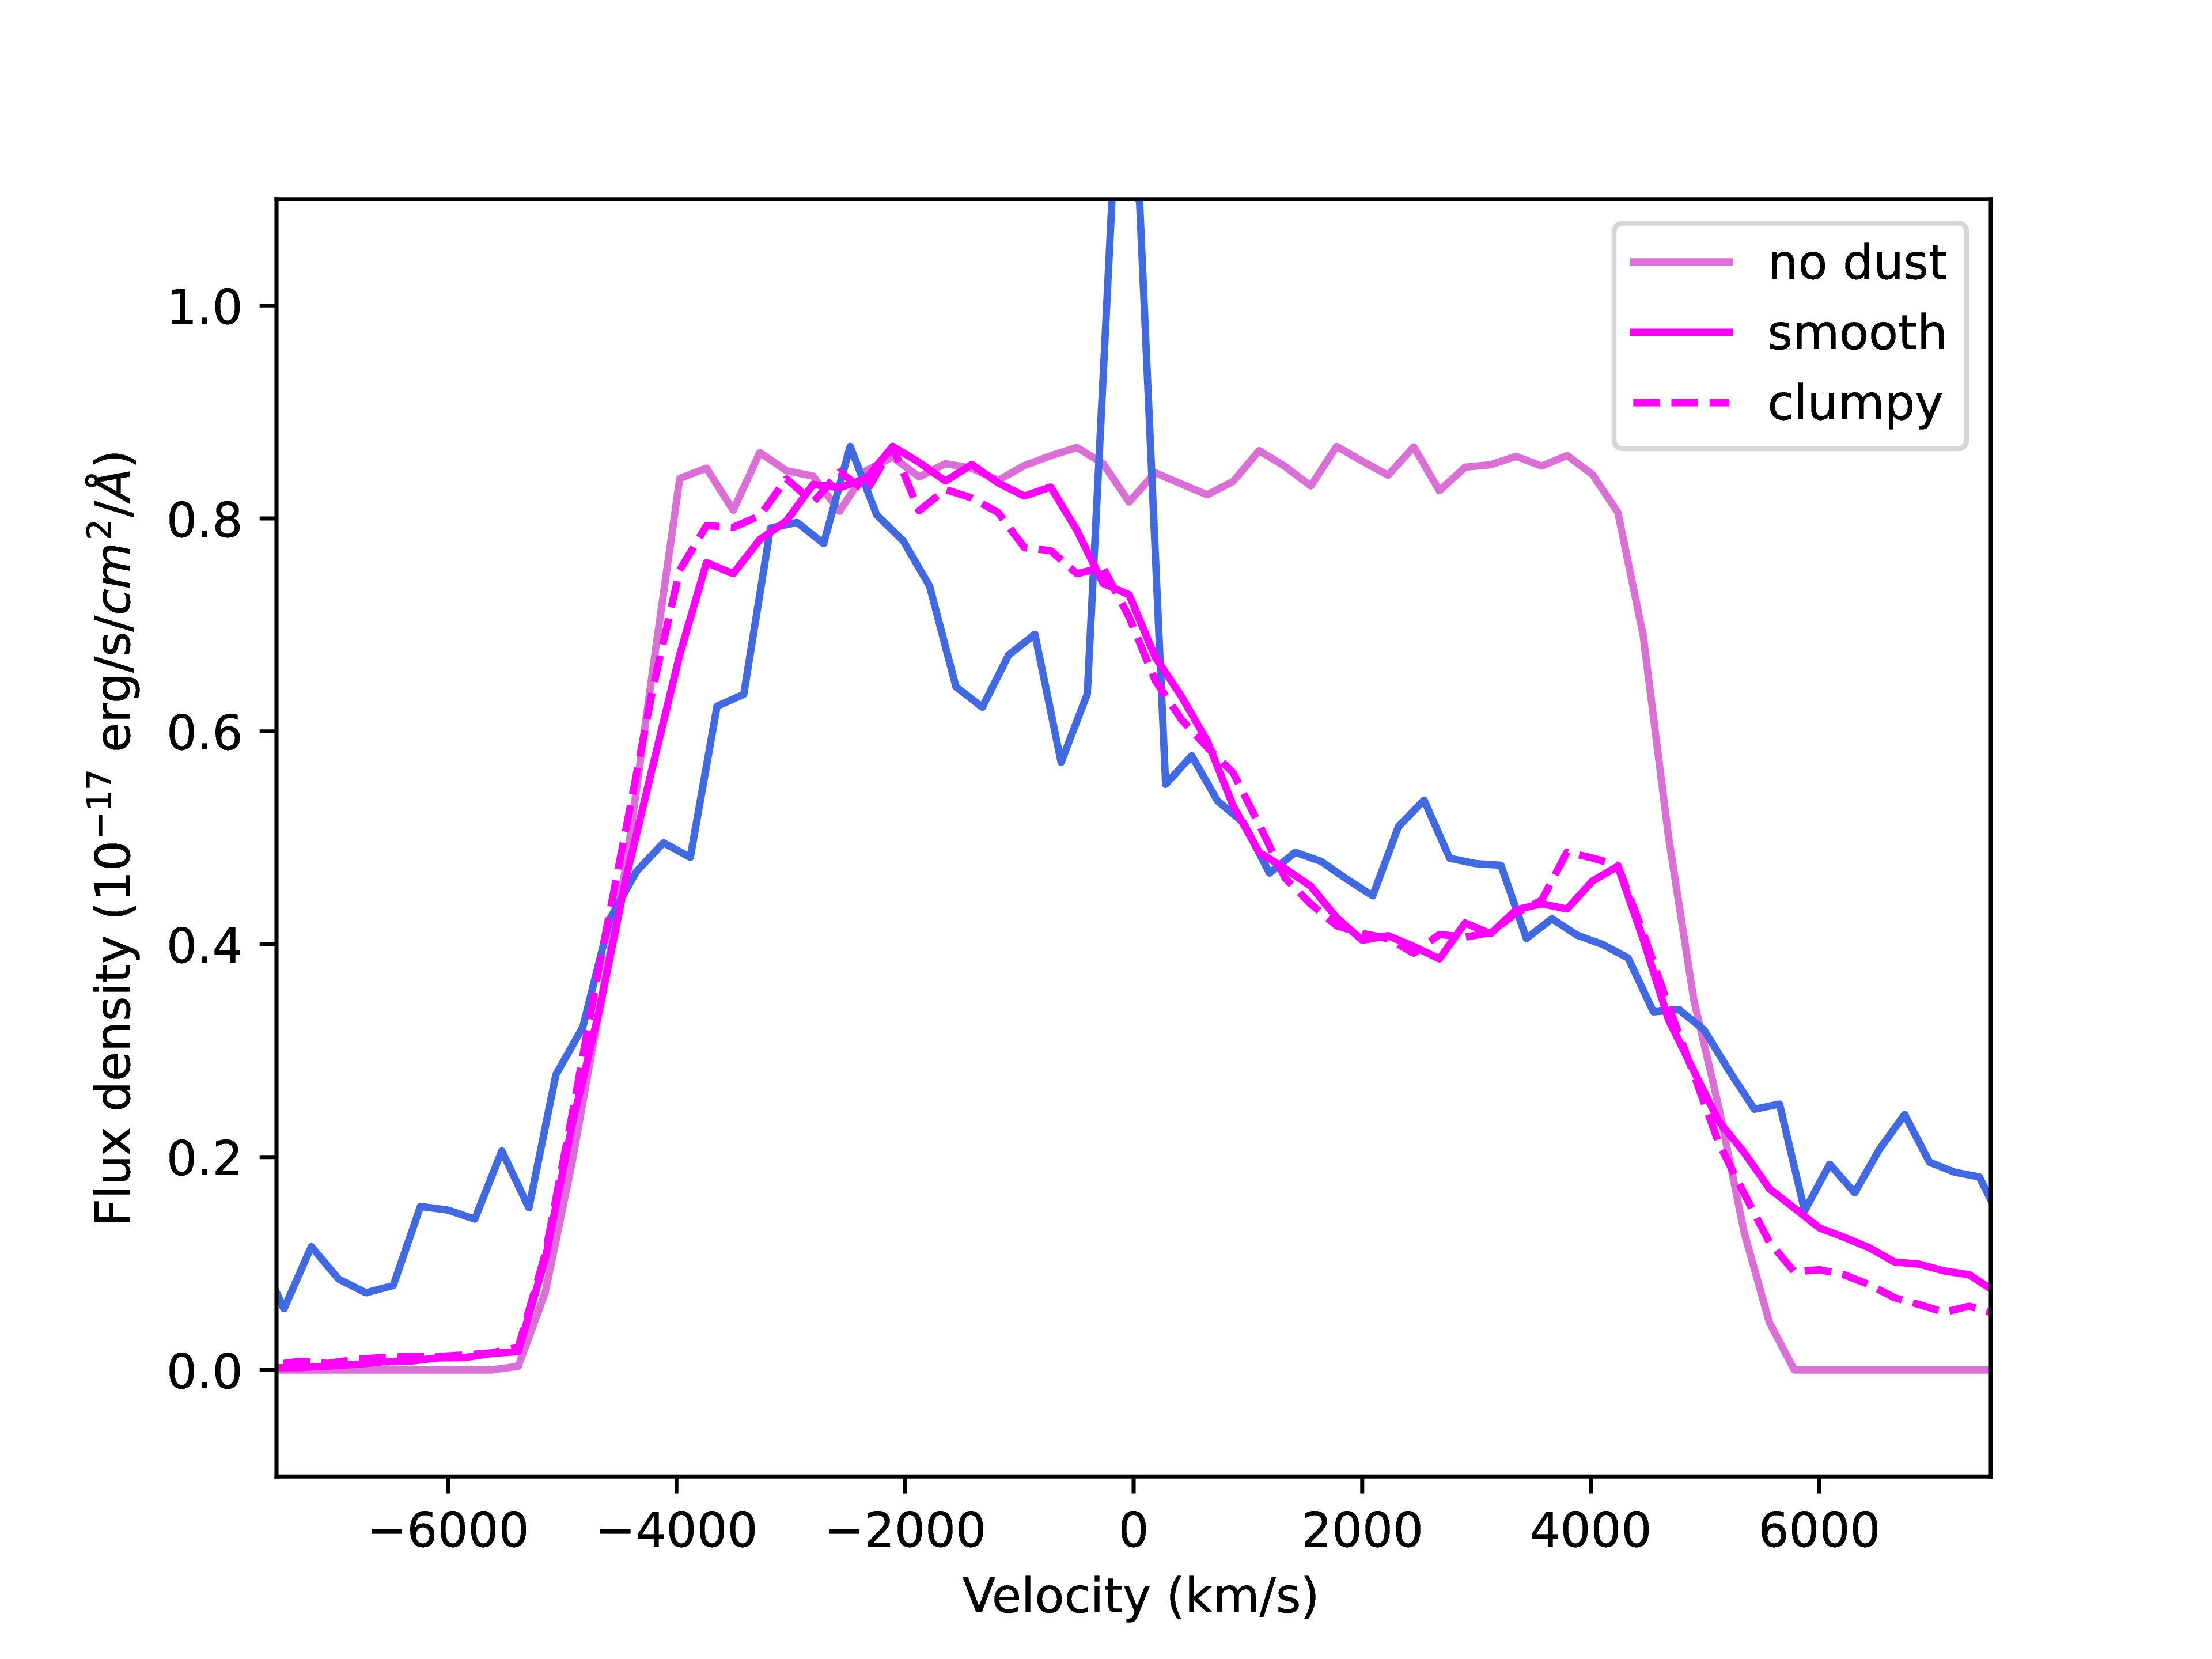
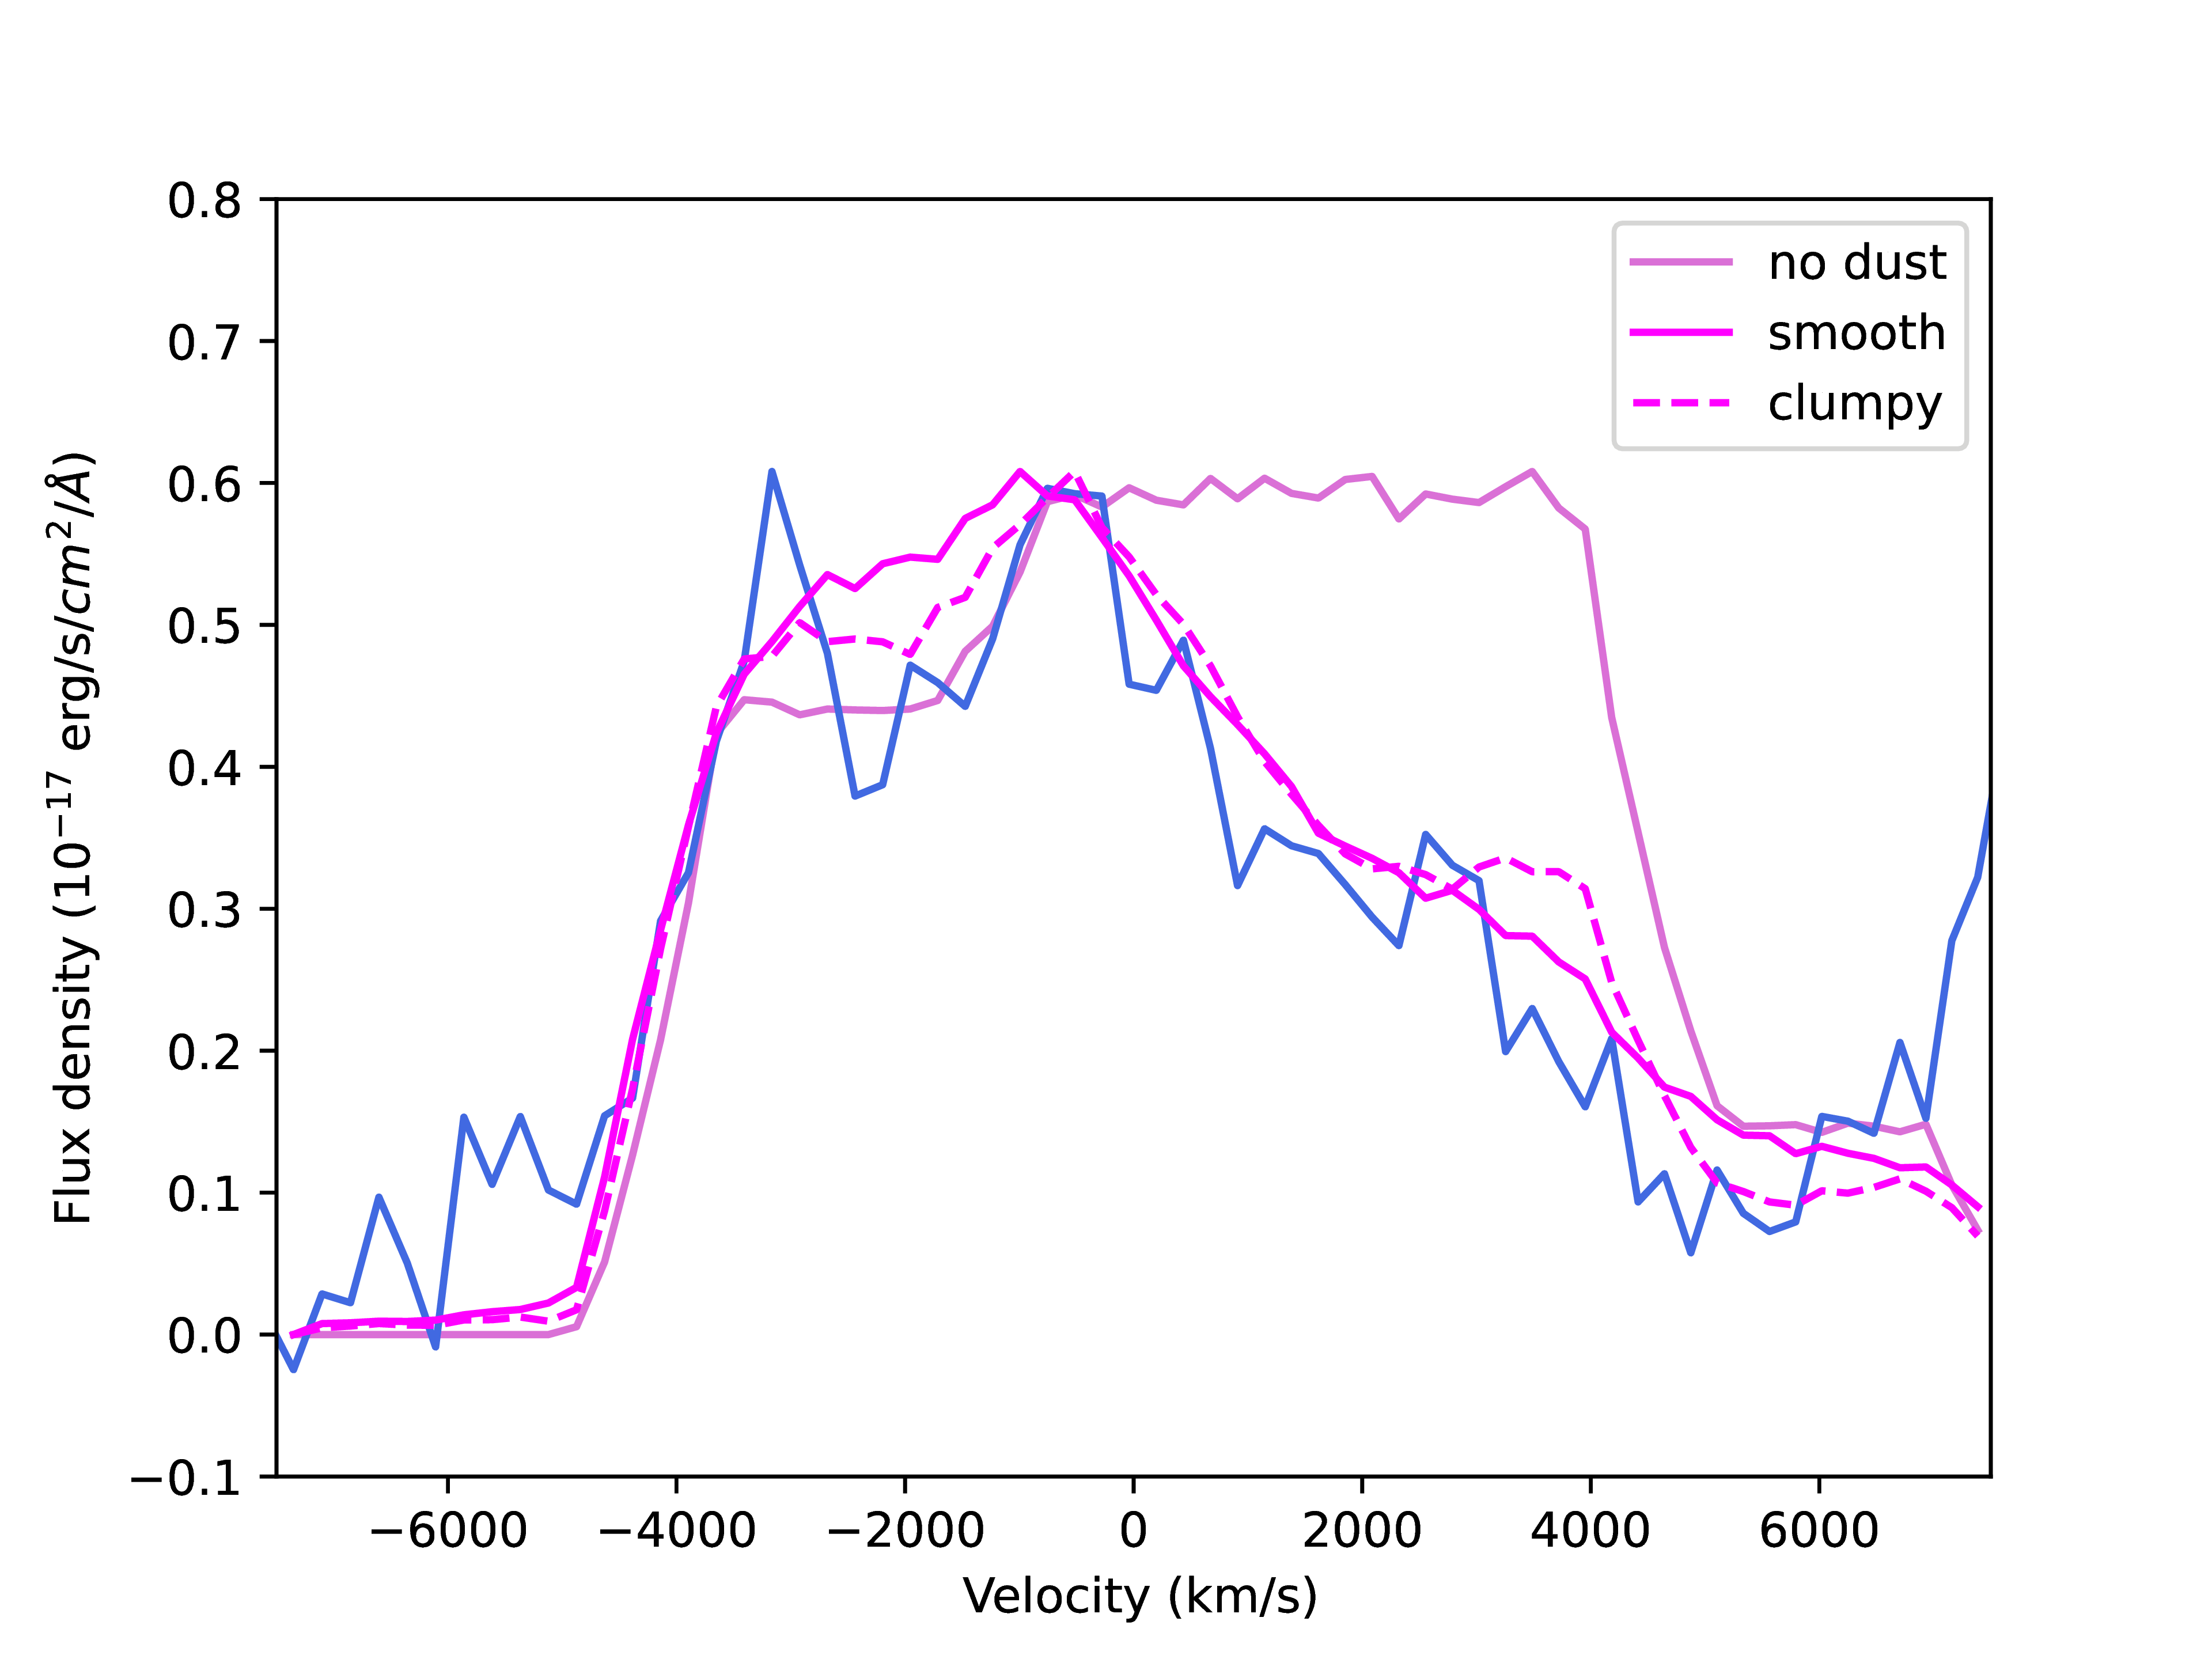
Our line-profile models align very well with those presented by Bevan et al. (2017). Our best line-profile models are shown in Fig. 8. In the case of the best H line-profile models, we found 0.24 M⊙ and 0.38 M⊙ of dust for smooth and clumpy density distributions, respectively. In the case of the best [O i] 6300, 6363 line-profile models, we found about a factor of two larger dust masses: 0.37 M⊙ and 0.58 M⊙ dust for smooth and clumpy density distributions, respectively. While the overall H line profile remains unchanged, the [O i] 6300, 6363 line profiles show definite evolution compared to the yr spectrum. We also found that [O i] 6300, 6363 line-profile models result in lower velocities than the H models, so the line-forming regions are more likely located in a more inward part of the ejecta for the [O i] lines.
| Line | Clumpy | ||||||
|---|---|---|---|---|---|---|---|
| (km s-1) | ( cm) | ( cm) | (M⊙) | ||||
| H | no | 5500 | 0.75 | 7.3 | 5.5 | 2.0 | 0.24 |
| H | yes | 5500 | 0.75 | 7.3 | 5.5 | 2.0 | 0.38 |
| no | 5000 | 0.75 | 6.6 | 5.0 | 2.0 | 0.37 | |
| yes | 5000 | 0.75 | 6.6 | 5.0 | 2.0 | 0.58 |
aWe assumed 100% silicate dust for all models with 0.1 m grain size. A 3.1 doublet intensity ratio was adopted for the [O i] 6300, 6363 lines. In the case of clumpy models, we used filling factor , and the model grids were divided into 40 steps in each axis.
Bevan et al. (2017) found that the H and [O i] 6300, 6363 line profiles are widely similar, but the oxygen models definitely require larger dust masses. Thus, they suggest that dust-forming regions may be focused in the vicinity of oxygen-rich zones (the same as found in the case of SN1987A; Bevan & Barlow, 2016). In this way, a more complex model, assuming diffuse hydrogen and clumped oxygen with a decoupled distribution of dust and gas, possibly could resolve the discrepancy in the dust masses (Bevan et al., 2017). However, these points are beyond the scope of this work.
4 Discussion & Conclusions
In this section, we summarise all of our conclusions regarding the amount, origin, and geometry of the dust located in (or, around) SN 1980K.
Determining the possible location of the presumed dust shell(s) is a vital step to revealing the potential origin of the dust. Newly-formed grains could be located in the inner (unshocked) ejecta and in the CDS between the outer (shocked) ejecta and shocked CSM. On the other hand, more distant pre-existing dust can be heated collisionally (i.e., via direct interaction with the forward shock) or radiatively (by the peak SN luminosity — however this option does not seem significant more than 40 yr post-explosion — and/or by energetic photons arising from CSM interaction).
4.1 Collisionally heated CSM dust scenario
The similarity between the late-time mid-IR SED of SN 1980K and the Spitzer/IRS spectrum of SN 1987A (described in detail in Sec. 3.1) leads us to examine the possibility of collisionally heated CSM dust as the first step. In a sequence of papers, Dwek et al. (2010), Arendt et al. (2016), and Arendt et al. (2020) found that the mid-IR (–30 m) component of the radiation of SN 1987A probably originates from the collisional interaction of the SN shock and some pre-existing matter located in an ER around the SN. This portion of the SED of SN 1987A was fitted by the cited authors with a dust component showing a very similar temperature ( K) to what we found in the case of SN 1980K; however, the mass of this dust component is orders of magnitudes larger in the case of SN 1980K. It is also in agreement with the evolution of mid-IR fluxes: since, in the case of SN 1987A, 5–30 m fluxes rise and fall between yr and yr post-explosion (i.e., as the SN’s blast wave has run into and through the pre-existing circumstellar ER), the level of mid-IR emission is still high in the case of SN 1980K more than 40 yr post-explosion (and, based on the detailed analysis of both the Spitzer dataset and the optical spectra, degree of interaction could be more or less constant in the last yr, see above).
So, if we accept the scenario of collisionally heated pre-existing dust (at least in the case of the M⊙ dust we see with JWST), then we potentially see a similar case to SN 1987A’s ER but at a larger scale.
In order to examine whether pre-existing dust grains can be really heated by the post-shocked gas due to the collision of the ejecta and the CSM in the case of SN 1980K, we follow the method presented by Fox et al. (2010) and also applied by others(e.g., Fox et al., 2011; Tinyanont et al., 2016; Zsíros et al., 2022) for estimating the mass of dust processed by the forward shock of the SN. Pre-existing grains are expected in regions farther from the SN, characterised by the dust-free cavity and the outer dust shell. Following a SN explosion, its peak luminosity destroys innermost pre-existing dust grains, thereby creating a dust-free cavity around the SN, and heats the remaining dust grains located between the created dust-free cavity and the outer radius of the external dust shell. The vaporisation radius () can be calculated from the peak UV-visual luminosity of the SN (Dwek, 1985). Unfortunately, there are no applicable estimations for in early-time data, so we cannot draw conclusions on the size of the dust-free cavity. Based on previous studies (see, e.g., Fox et al., 2010; Zsíros et al., 2022), this value is likely around a few times 1016 cm, similar to the value we determined above for SN 1980K. However, the size of the evaporation radius does not have significance, since the shock passed it a long time ago.
Fox et al. (2010) assume that the hot, post-shocked gas heats the dust shell and the total gas mass can be determined by the volume of the emitting shell applying the equations characterizing grain sputtering. Considering a dust-to-gas mass ratio of 0.01, the mass of dust is
| (4) |
where is the shock velocity (assumed to be constant), is the time post explosion, and is the dust grain size. We used km s-1 and 15,000 km s-1 (respectively) for the lower and upper limits of the shock velocity (taking the lower limit from our optical line analysis and the upper limit from Fox et al., 2010). We applied 0.005 m and 0.1 m for the lower and upper limits, respectively. On the basis of these assumptions, we find that 42 yr after explosion, the dust mass that can be heated collisionally is in the range 0.001–0.5 M⊙. The lower end is close to the mass we deduce from our best-fit analytic dust models. Thus, these results seem to support (or, at least, not to exclude) the possibility of the collisional heating of pre-existing grains.
We also compared our predictions for the dust emission with the mass-loss-rate estimates for SN 1980K by Rizzo Smith et al. (2023). They present a mass-loss rate of M⊙ yr-1, which is considered to be a typical value for average CCSNe. However, the velocity from the H line ( km s-1, obtained from the late-time optical spectra) suggest a considerable deceleration of the shock over the yr of evolution, which requires a higher mass-loss rate. Also, Weiler et al. (1992) report a larger mass-loss rate and therefore it cannot be excluded for the early phases.
Moreover, we make some additional comments on the hot (dust) component in the mid-IR SED of SN 1980K. As mentioned above, in the cases of both SNe 1980K and 1987A, we see at least two components in the 5–30 m SED: one with a temperature of K (180 K) and one with K (or, with an even higher temperature in the case of SN 1980K; see Sec. 3.1). Based on studying contemporaneous IR and X-ray data of SN 1987A, Dwek et al. (2010) and Arendt et al. (2016) concluded that the colder (Si-dominated) component is probably collisionally heated by the hot circumstellar gas in the ER, while they did not find clear evidence for the origin of the hotter component (but excluded gas or the synchrotron emission mechanism as potential sources). In the case of SN 1980K, we do not have either direct images of an ER or late-time X-ray data; thus, the situation can be the same as in the case of SN 1987A, but it is also a possibility that the hotter (dust) component has a collisional heating source, while the colder component is coming from radiative heating of the pre-existing grains, or, from newly-formed dust in the ejecta (see below). Nevertheless, for a more detailed investigation, further data would be necessary — especially in the range of –5 m to cover the assumed thermal radiation of the hot dust component.
4.2 Radiatively heated CSM dust scenario
If we assume the presence of CSM dust, another necessary step is to examine the possibility of radiative heating of the pre-existing dust grains around SN 1980K. Considering a simple IR light-echo model of Bode & Evans (1980) and Dwek (1983), as showed by Fox et al. (2010, 2011), we can investigate the possibility of the presence of an IR echo. If the dust is located in a shell between the vaporisation and echo radii (defined by , where is the duration of the echo (see, e.g., Fox et al., 2010, 2011), the late-time optical luminosity from the CSM interaction heats the grains. As mentioned above, unfortunately, we cannot determine the size of the dust-free cavity because of a lack of data. Nevertheless, the size of vaporization radius only has an importance when we assume that the pre-existing dust shell is heated by the SN peak luminosity. However, more than 40 yr post-explosion, the SN peak luminosity cannot be considered a significant heating source: assuming this type of heating and a radius of the dust shell being cm (estimated based on coming from our numerical SED modeling), it yields a few hundred-day-long light echo, which is not compatible with the current age of SN 1980K.
On the other hand, seeing the obvious signs of long-term ongoing CSM interaction in the environment of SN 1980K, a CSM echo (i.e., reprocessing of the optical emission by the dust) may be a viable option. To examine this option in detail, we can follow again the method presented by Fox et al. (2010, 2011). First, we approximate the inner shell radius from the optical luminosity,
| (5) |
where is the effective SN blackbody temperature, is the grain size, is the dust bulk density, and is the echo radius. We used K (however, the results are relatively insensitive to the temperature; see Fox et al., 2011), m, and g cm-3 (as previously for the silicate-based dust).
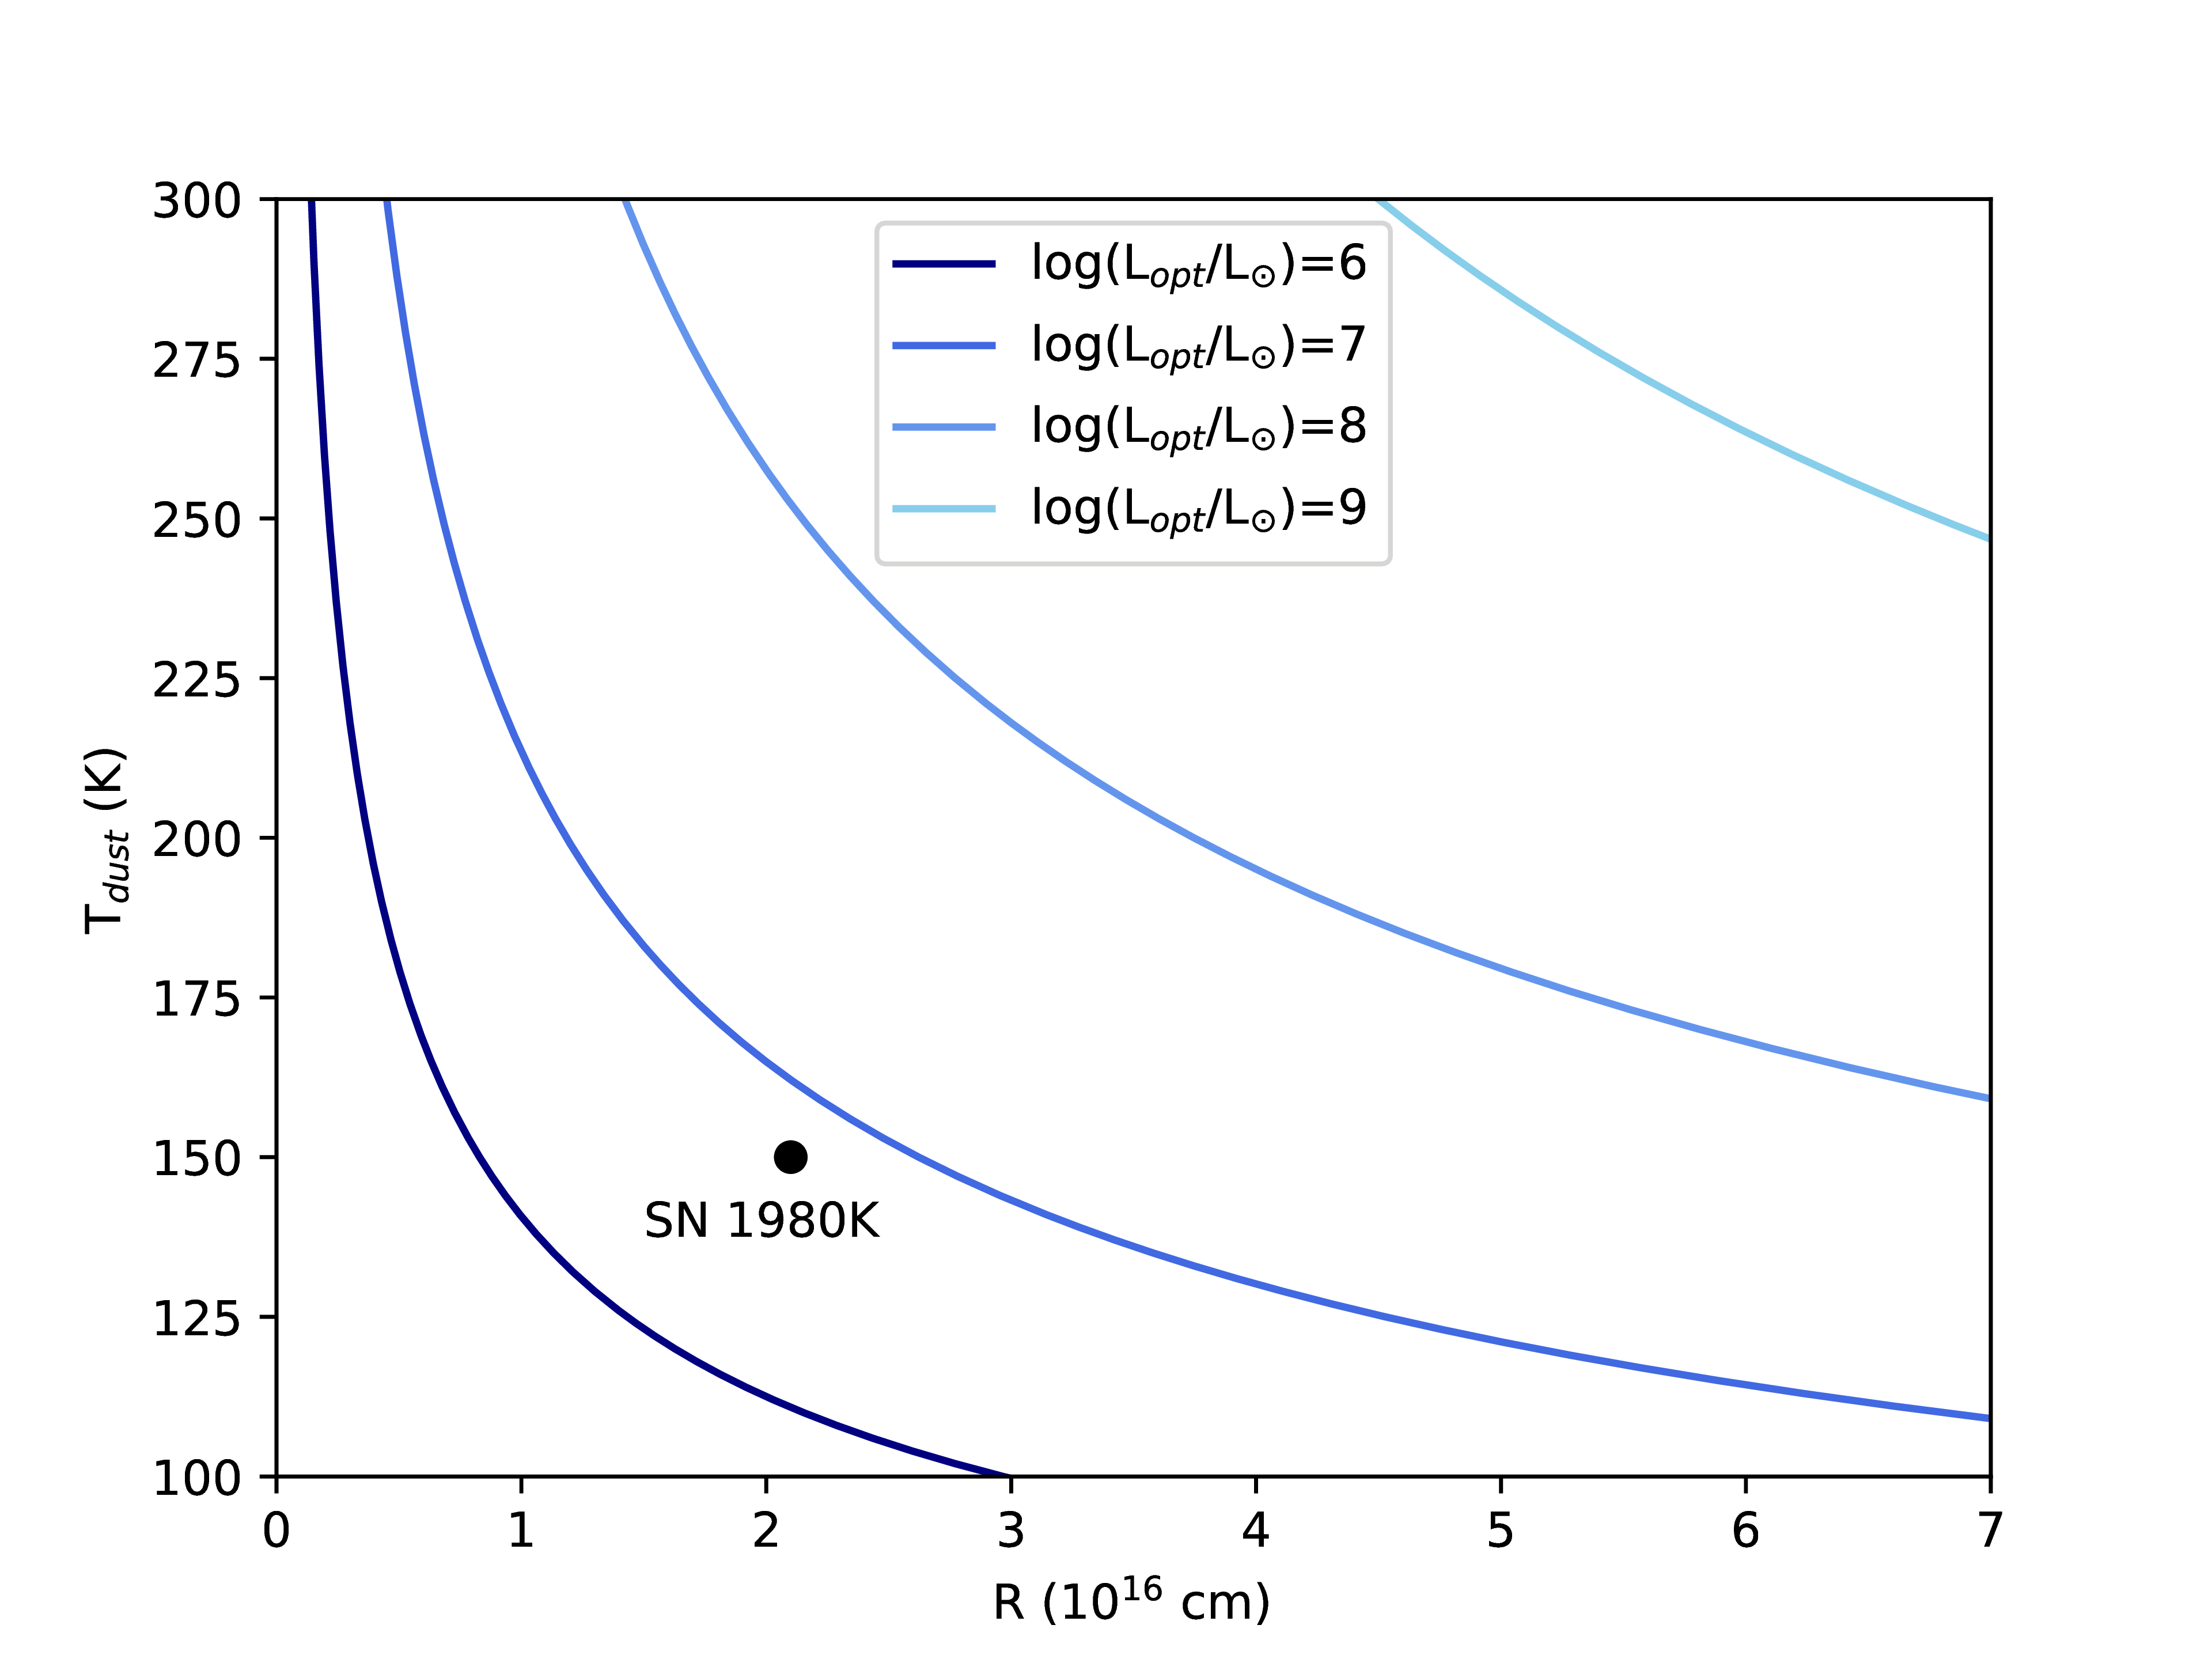
Following Fox et al. (2011), to test the possibility of radiative heating by the CSM interaction, we compared the results of these calculations with the minimal (blackbody) dust radius () we determined during our analytical SED modeling. Based on these calculations, a dust shell with a radius of cm and a temperature of 150 K (heated by CSM interaction) requires a late-time optical luminosity of (see Fig. 9). Such large late-time optical luminosities are questionable in the case of SN 1980K since the integrated optical luminosity calculated from the Keck spectrum is only (while the observed mid-IR luminosity, as described above, is ).
However, Dessart & Hillier (2022) found that the shock power from the CSM interaction emerges primarily in the UV, and only a few percent of that emerges in the optical. Their models indicate that an optical luminosity of L⊙ agrees with a UV luminosity of the CSM radiation of L⊙. While this value is still too low, continuous CSM interaction could be a contributing heating source for dust (being located even in the CSM or in the ejecta; see below).
As a further possibility, according to optical and mid-IR (Spitzer/IRAC and MIPS) data taken between 2004 and 2008, Sugerman et al. (2012) suggest scattered and thermal light echoes off of more extended CSM in the environment of SN 1980K. They found that the SN shows a slow and monotonic fading which can be explained with echoes from a thin circumstellar shell 14–15 light year (–1.4 cm) from the progenitor containing of carbon-rich dust. While the JWST data on SN 1980K do not contradict the possibility of such extended light echoes, we highlight here that the reanalysis of the full Spitzer dataset of the SN (see Fig. 3) does not support the monotonic fading predicted by Sugerman et al. (2012), thus weakening the hypothesis of scattered light echoes. Moreover, in another recent study, Radica et al. (2020) found no evidence of scattered light echoes in the vicinity of the SN according to spectral data of the SITELLE Imaging Fourier Transform Spectrometer on the Canada-France-Hawaii Telescope.
4.3 Newly-formed ejecta dust scenario
Based on the recent detailed calculations by Sarangi (2022), newly-formed dust should form at velocities km s-1 in (Type IIP) CCSN ejecta. Using this velocity as an upper limit, we get a radius of a dust-forming region cm at 15,300 days. This value is (much) larger than the calculated blackbody radius ( cm), and agrees well with the outer shell radius from mocassin models assuming a spherical shell of dust heated by a central source ( cm). Thus, it seems to support the assumption that all of the M⊙ dust we see in the mid-IR can be placed within the ejecta and therefore can be purely newly-formed.
However, the temperature of the dust imposes further constraints on our calculations, as we noted above. Taking a look again at the calculations by Sarangi (2022), the temperature of ejecta dust (assuming any kind of composition) should decrease below K up to 3000 days after explosion (the point at which the calculations end). Here, based on the mid-IR SED of SN 1980K, we see a primary (Si-dominated) dust component with a temperature of K more than 40 yr after explosion; this means that some additional source of heat is needed. Similar results were shown by Shahbandeh et al. (2023) for SNe 2004et and 2017eaw, where they mark the source of this extra energy as the interaction between the SN forward shock and the ambient CSM (emerging in the form of not just optical, but presumably also X-ray and UV photons even at these late epochs). In the case of ejecta dust being heated by an external shock, the temperature and the total IR luminosity of dust depends on the relative radii of the dusty sphere and the shock. Simple back-of-the-envelope calculations show that silicate dust in the ejecta, confined within 2500 km s-1, will be at a temperature of K when heated by an external forward shock that has a velocity of km s-1 (with reference to Fox et al. 2011; see Dessart & Hillier (2022) for more details on shock luminosities). In these terms, the dust in SN ejecta is in agreement with the energetics required to produce the observed IR fluxes.
Beyond that, a further question remains open regarding the hot component we used to fit the 5.6 m point of the mid-IR SED (can be K, or even 1000 K, see Section 3.1). This component, if it truly originates from dust, is difficult to connect to any heating processes in the ejecta at such late times; however, as we noted in Section 4.1, it may have a circumstellar origin (or, does not connect to the expanding SN ejecta at all).
Switching to the results of optical line-profile analysis (Sec. 3.3), these suggest an even larger amount (–0.58 M⊙) of dust to be present in the ejecta. From damocles modeling, we do not obtain any information on the dust temperature; thus, it is required that all of the dust is in the ejecta and we see only the “warm” ( M⊙, K) component with JWST (the “tip of the iceberg”), with much more colder dust only visible at longer wavelengths.
The location of the dust seems to be somewhat problematic here, since damocles models place the dust at (5.0–6.6) and (5.5–7.3) cm — from the analysis of the [O i] and H lines, respectively (see Table 3) — assuming respective minimal velocities of 3750 and 4125 km s-1 (which are too high compared to the calculations of Sarangi, 2022). At that point, it is worth examining the possibility of newly-formed dust in the CDS. Considering that the CDS is formed behind the reverse shock (in the Lagrangian reference frame), and that broad optical emission lines basically originate from the H-rich ejecta heated by the reverse shock, then both the front-side and back-side line emission would be absorbed by the dust; however, hydrodynamic mixing results in a clumpy CDS and enables some emission to pass through it (Milisavljevic et al., 2012). Again, assuming a lower limit on the forward shock velocity to be km s-1 (see above), a dense shell being present close to km s-1 could be a reasonable estimate. However, the forward shock generally is nonradiative, but radiative shocks can occur in this region if the circumstellar gas is very clumpy (Chugai & Danziger, 1994; Milisavljevic et al., 2012). Moreover, it also remains a matter of debate whether the CDS in such SNe can have enough mass of gas to host more than 0.1 M⊙ of dust.
Nevertheless, as described in detail in Section 3.3, these values are the results of coupled gas-dust damocles models, and improved modeling via decoupling the two components might solve this problem. We also note that the calculations of Sarangi (2022) we use here pertain to Type IIP explosions. There are no such detailed calculations for Type IIL events (mainly because the parameters of their progenitors are still uncertain); thus, it is a possibility that dust grains can form at even higher velocities than expected for SNe IIP.
In summary, we conclude that the late-time mid-IR radiation of SN 1980K, observed serendipitously with JWST/MIRI in September 2022, can be described with a K, M⊙ silicate dust component and an additional hotter dust/gas component. Results of analytical and numerical modeling of the mid-IR SED show that this dust can be entirely newly-formed and located in the ejecta. We also obtained an optical spectrum of the SN with Keck I 10 m telescope in November 2022, showing strong emission lines of H and [O i] with asymmetric blueshifted profiles, very similar to those seen in other spectra of SN 1980K obtained in the last several years. Results of radiative-transfer modeling of these optical line profiles agree well with that of similar examinations published before (Bevan et al., 2017; Niculescu-Duvaz et al., 2022), showing a total dust mass of –0.58 M⊙ presumably located in the ejecta. Putting these two conclusions together, we could see only part of any ejecta dust with JWST, and there should be much colder dust present.
The presence of asymmetries in the recently observed optical line profiles implies that there must be a dust component internal to the shock; however, in the mid-IR, we may see pre-existing dust heated collisionally by the SN shock wave. This possibility is strengthened by (i) the close similarity of the mid-IR SED of SN 1980K to the yr scaled Spitzer/IRS spectrum of SN 1987A (thought to originate from heated dust located in the ER around 87A), and (ii) the presence of the hot ( K) dust/gas component presumably does not connect to decades-old SN ejecta. Well, in this case — since mass of the primary mid-IR dust component ( K, M⊙) is 2–3 orders of magnitudes higher than what is seen in the ER of SN 1987A, we shall imagine a kind of a ”super-ring” (or, a different geometry/distribution of dust) in the case of SN 1980K.
Moreover, radiative heating of dust by energetic photons originating from the ongoing CSM interaction can also play a role in heating the SN dust. While, however, the late-time optical luminosity measured in SN 1980K is too low for heating the dust to the observed temperature alone, theoretical predictions suggest that contribution from more energetic photons could solve this discrepancy.
For a more detailed investigation, further data would be necessary: either a mid-IR spectrum to view the spectral features in detail (and, thus, to better determine the chemical composition and geometry of dust in SN 1980K), or a near-IR (–5 m) dataset for revealing the true nature of thermal radiation of the hot (dust) component, as well as UV/X-ray observations on getting deeper insight into the ongoing CSM interaction.
Acknowledgements
We thank Richard G. Arendt for his valuable comments and for providing the Spitzer/IRS spectrum of SN 1987A. This work is based on observations made with the NASA/ESA/CSA James Webb Space Telescope. The data were obtained from the Mikulski Archive for Space Telescopes at the Space Telescope Science Institute, which is operated by the Association of Universities for Research in Astronomy, Inc., under NASA contract NAS 5-03127 for JWST. These observations are associated with program GO-2666. Some of the data presented herein were obtained at the W. M. Keck Observatory, which is operated as a scientific partnership among the California Institute of Technology, the University of California, and NASA; the observatory was made possible by the generous financial support of the W. M. Keck Foundation.
This project has been supported by NKFIH/OTKA grant FK-134432. S.Z. is supported by the National Talent Programme under NTP-NFTÖ-22-B-0166 Grant. T.S. is supported by the János Bolyai Research Scholarship of the Hungarian Academy of Sciences and by the New National Excellence Program (UNKP-22-5) of the Ministry for Innovation and Technology from the source of the National Research, Development and Innovation Fund. I.D.L. has received funding from the European Research Council (ERC) under the European Union’s Horizon 2020 research and innovation programme DustOrigin (ERC-2019-StG-851622) and the Belgian Science Policy Office (BELSPO) through the PRODEX project “JWST/MIRI Science exploitation” (C4000142239). A.V.F.’s supernova group at U.C. Berkeley is supported by the Christopher R. Redlich Fund, Alan Eustace (W.Z. is a Eustace Specialist in Astronomy), Frank and Kathleen Wood (T.G.B. is a Wood Specialist in Astronomy), and numerous other donors.
Data Availability
JWST photometric data underlying this article are available in the article. Spectroscopic data will be publicly released via WIseREP (https://www.wiserep.org/).
References
- Anderson et al. (2014) Anderson J. P., et al., 2014, ApJ, 786, 67
- Andrews et al. (2011) Andrews J. E., et al., 2011, AJ, 142, 45
- Ansari et al. (2022) Ansari Z., Gall C., Wesson R., Krause O., 2022, A&A, 666, A176
- Arendt et al. (2014) Arendt R. G., Dwek E., Kober G., Rho J., Hwang U., 2014, The Astrophysical Journal, 786, 55
- Arendt et al. (2016) Arendt R. G., Dwek E., Bouchet P., Danziger I. J., Frank K. A., Gehrz R. D., Park S., Woodward C. E., 2016, AJ, 151, 62
- Arendt et al. (2020) Arendt R. G., Dwek E., Bouchet P., John Danziger I., Gehrz R. D., Park S., Woodward C. E., 2020, ApJ, 890, 2
- Barbieri et al. (1982) Barbieri C., Bonoli C., Cristiani S., 1982, A&A, 114, 216
- Barbon et al. (1982) Barbon R., Ciatti F., Rosino L., 1982, A&A, 116, 35
- Barlow et al. (2010) Barlow M. J., et al., 2010, Astronomy & Astrophyiscs, 518, L138
- Bevan & Barlow (2016) Bevan A., Barlow M. J., 2016, MNRAS, 456, 1269
- Bevan et al. (2017) Bevan A., Barlow M. J., Milisavljevic D., 2017, MNRAS, 465, 4044
- Bode & Evans (1980) Bode M. F., Evans A., 1980, MNRAS, 193, 21P
- Bouchet et al. (2006) Bouchet P., et al., 2006, ApJ, 650, 212
- Bouchet et al. (2015) Bouchet P., et al., 2015, PASP, 127, 612
- Buta (1982) Buta R. J., 1982, PASP, 94, 578
- Canizares et al. (1982) Canizares C. R., Kriss G. A., Feigelson E. D., 1982, ApJ, 253, L17
- Chugai & Danziger (1994) Chugai N. N., Danziger I. J., 1994, MNRAS, 268, 173
- Chugai et al. (2004) Chugai N. N., et al., 2004, MNRAS, 352, 1213
- De Looze et al. (2019) De Looze I., et al., 2019, MNRAS, 488, 164
- Dessart & Hillier (2022) Dessart L., Hillier D. J., 2022, A&A, 660, L9
- Draine & Li (2007) Draine B. T., Li A., 2007, ApJ, 657, 810
- Dwek (1983) Dwek E., 1983, ApJ, 274, 175
- Dwek (1985) Dwek E., 1985, ApJ, 297, 719
- Dwek et al. (2007) Dwek E., Galliano F., Jones A. P., 2007, The Astrophysical Journal, 662, 927
- Dwek et al. (2010) Dwek E., et al., 2010, ApJ, 722, 425
- Dwek et al. (2019) Dwek E., Sarangi A., Arendt R. G., 2019, ApJ, 871, L33
- Eck et al. (2002) Eck C. R., Cowan J. J., Branch D., 2002, ApJ, 573, 306
- Ercolano et al. (2003) Ercolano B., Barlow M. J., Storey P. J., Liu X. W., 2003, MNRAS, 340, 1136
- Ercolano et al. (2005) Ercolano B., Barlow M. J., Storey P. J., 2005, MNRAS, 362, 1038
- Ercolano et al. (2007) Ercolano B., Barlow M. J., Sugerman B. E. K., 2007, MNRAS, 375, 753
- Ercolano et al. (2008) Ercolano B., Young P. R., Drake J. J., Raymond J. C., 2008, ApJS, 175, 534
- Fabbri et al. (2011) Fabbri J., et al., 2011, MNRAS, 418, 1285
- Fesen et al. (1995) Fesen R. A., Hurford A. P., Matonick D. M., 1995, AJ, 109, 2608
- Fesen et al. (1999) Fesen R. A., et al., 1999, AJ, 117, 725
- Filippenko (1982) Filippenko A. V., 1982, PASP, 94, 715
- Fox et al. (2010) Fox O. D., Chevalier R. A., Dwek E., Skrutskie M. F., Sugerman B. E. K., Leisenring J. M., 2010, ApJ, 725, 1768
- Fox et al. (2011) Fox O. D., et al., 2011, ApJ, 741, 7
- Fox et al. (2013) Fox O. D., Filippenko A. V., Skrutskie M. F., Silverman J. M., Ganeshalingam M., Cenko S. B., Clubb K. I., 2013, AJ, 146, 2
- Fransson & Kozma (2002) Fransson C., Kozma C., 2002, New Astron. Rev., 46, 487
- Fridriksson et al. (2008) Fridriksson J. K., Homan J., Lewin W. H. G., Kong A. K. H., Pooley D., 2008, ApJS, 177, 465
- Gall et al. (2011) Gall C., Hjorth J., Andersen A. C., 2011, A&ARv, 19, 43
- Gomez et al. (2012) Gomez H. L., et al., 2012, The Astrophysical Journal, 760, 96
- Graham & Meikle (1986) Graham J. R., Meikle W. P. S., 1986, MNRAS, 221, 789
- Hildebrand (1983) Hildebrand R. H., 1983, QJRAS, 24, 267
- Indebetouw et al. (2014) Indebetouw R., et al., 2014, ApJL, 782, L2
- Jencson et al. (2019) Jencson J. E., et al., 2019, ApJ, 886, 40
- Kasliwal et al. (2017) Kasliwal M. M., et al., 2017, ApJ, 839, 88
- Koplitz et al. (2021) Koplitz B., Johnson J., Williams B. F., Long K. S., Blair W. P., Murphy J. W., Dolphin A., Hillis T., 2021, ApJ, 916, 58
- Kotak et al. (2009) Kotak R., et al., 2009, ApJ, 704, 306
- Leibundgut et al. (1991) Leibundgut B., Kirshner R. P., Pinto P. A., Rupen M. P., Smith R. C., Gunn J. E., Schneider D. P., 1991, ApJ, 372, 531
- Long et al. (2019) Long K. S., Winkler P. F., Blair W. P., 2019, ApJ, 875, 85
- Lucy et al. (1989) Lucy L. B., Danziger I. J., Gouiffes C., Bouchet P., 1989, in Tenorio-Tagle G., Moles M., Melnick J., eds, , Vol. 350, IAU Colloq. 120: Structure and Dynamics of the Interstellar Medium. p. 164, doi:10.1007/BFb0114861
- Maiolino et al. (2004) Maiolino R., Schneider R., Oliva E., Bianchi S., Ferrara A., Mannucci F., Pedani M., Sogorb M. R., 2004, Nature, 431, 533
- Matsuura et al. (2011) Matsuura M., et al., 2011, Science, 333, 1258
- Matsuura et al. (2019) Matsuura M., et al., 2019, MNRAS, 482, 1715
- Mattila et al. (2008) Mattila S., et al., 2008, MNRAS, 389, 141
- Meikle et al. (2011) Meikle W. P. S., et al., 2011, ApJ, 732, 109
- Milisavljevic et al. (2012) Milisavljevic D., Fesen R. A., Chevalier R. A., Kirshner R. P., Challis P., Turatto M., 2012, ApJ, 751, 25
- Montes et al. (1998) Montes M. J., Van Dyk S. D., Weiler K. W., Sramek R. A., Panagia N., 1998, ApJ, 506, 874
- Niculescu-Duvaz et al. (2022) Niculescu-Duvaz M., et al., 2022, MNRAS, 515, 4302
- Oke et al. (1995) Oke J. B., et al., 1995, PASP, 107, 375
- Perley (2019) Perley D. A., 2019, PASP, 131, 084503
- Perrin et al. (2014) Perrin M. D., Sivaramakrishnan A., Lajoie C.-P., Elliott E., Pueyo L., Ravindranath S., Albert L., 2014, in Oschmann Jacobus M. J., Clampin M., Fazio G. G., MacEwen H. A., eds, Society of Photo-Optical Instrumentation Engineers (SPIE) Conference Series Vol. 9143, Space Telescopes and Instrumentation 2014: Optical, Infrared, and Millimeter Wave. p. 91433X, doi:10.1117/12.2056689
- Pozzo et al. (2004) Pozzo M., Meikle W. P. S., Fassia A., Geballe T., Lundqvist P., Chugai N. N., Sollerman J., 2004, MNRAS, 352, 457
- Priestley et al. (2020) Priestley F. D., Bevan A., Barlow M. J., De Looze I., 2020, Monthly Notices of the Royal Astronomical Society, 497, 2227
- Radica et al. (2020) Radica M. C., Welch D. L., Rousseau-Nepton L., 2020, MNRAS, 497, 3297
- Reach et al. (2006) Reach W. T., et al., 2006, AJ, 131, 1479
- Ressler et al. (2015) Ressler M. E., et al., 2015, PASP, 127, 675
- Rest et al. (2023) Rest A., Pierel J., Correnti M., Canipe A., Hilbert B., Engesser M., Sunnquist B., Fox O., 2023, arminrest/jhat: The JWST HST Alignment Tool (JHAT), doi:10.5281/zenodo.7892935, https://doi.org/10.5281/zenodo.7892935
- Rieke & Wright (2022) Rieke G., Wright G., 2022, Nature Astronomy, 6, 891
- Rieke et al. (2015) Rieke G. H., et al., 2015, PASP, 127, 584
- Rizzo Smith et al. (2023) Rizzo Smith M., Kochanek C. S., Neustadt J. M. M., 2023, MNRAS, 523, 1474
- Sarangi (2022) Sarangi A., 2022, A&A, 668, A57
- Schlegel (1994) Schlegel E. M., 1994, AJ, 108, 1893
- Seitenzahl et al. (2014) Seitenzahl I. R., Timmes F. X., Magkotsios G., 2014, ApJ, 792, 10
- Shahbandeh et al. (2023) Shahbandeh M., et al., 2023, arXiv e-prints, p. arXiv:2301.10778
- Sibthorpe et al. (2010) Sibthorpe B., et al., 2010, The Astrophysical Journal, 719, 1553
- Smith et al. (2008a) Smith N., Foley R. J., Filippenko A. V., 2008a, ApJ, 680, 568
- Smith et al. (2008b) Smith N., et al., 2008b, ApJ, 686, 485
- Smith et al. (2009) Smith N., et al., 2009, ApJ, 695, 1334
- Soria & Perna (2008) Soria R., Perna R., 2008, ApJ, 683, 767
- Sugerman (2003) Sugerman B. E. K., 2003, AJ, 126, 1939
- Sugerman et al. (2012) Sugerman B. E. K., et al., 2012, ApJ, 749, 170
- Szalai & Vinkó (2013) Szalai T., Vinkó J., 2013, A&A, 549, A79
- Szalai et al. (2011) Szalai T., Vinkó J., Balog Z., Gáspár A., Block M., Kiss L. L., 2011, A&A, 527, A61
- Szalai et al. (2019) Szalai T., Zsíros S., Fox O. D., Pejcha O., Müller T., 2019, ApJS, 241, 38
- Szalai et al. (2021) Szalai T., et al., 2021, ApJ, 919, 17
- Tanaka et al. (2012) Tanaka M., et al., 2012, ApJ, 749, 173
- Temim & Dwek (2013) Temim T., Dwek E., 2013, ApJ, 774, 8
- Thompson (1982) Thompson L. A., 1982, ApJ, 257, L63
- Tinyanont et al. (2016) Tinyanont S., et al., 2016, ApJ, 833, 231
- Uomoto & Kirshner (1986) Uomoto A., Kirshner R. P., 1986, ApJ, 308, 685
- Valenti et al. (2016) Valenti S., et al., 2016, MNRAS, 459, 3939
- Van Dyk et al. (1996) Van Dyk S. D., Hamuy M., Filippenko A. V., 1996, AJ, 111, 2017
- Weiler et al. (1986) Weiler K. W., Sramek R. A., Panagia N., van der Hulst J. M., Salvati M., 1986, ApJ, 301, 790
- Weiler et al. (1992) Weiler K. W., Van Dyk S. D., Panagia N., Sramek R. A., 1992, ApJ, 398, 248
- Wesson & Bevan (2021) Wesson R., Bevan A., 2021, ApJ, 923, 148
- Wesson et al. (2015) Wesson R., Barlow M. J., Matsuura M., Ercolano B., 2015, MNRAS, 446, 2089
- Wild & Barbon (1980) Wild P., Barbon R., 1980, IAU Circ., 3532, 1
- Williams et al. (2018) Williams B. F., Hillis T. J., Murphy J. W., Gilbert K., Dalcanton J. J., Dolphin A. E., 2018, ApJ, 860, 39
- Zsíros et al. (2022) Zsíros S., Nagy A. P., Szalai T., 2022, MNRAS, 509, 3235
- Zubko et al. (2004) Zubko V., Dwek E., Arendt R. G., 2004, ApJS, 152, 211