Mel-Band RoFormer for Music Source Separation
Abstract
Recently, multi-band spectrogram-based approaches such as Band-Split RNN (BSRNN) have demonstrated promising results for music source separation. In our recent work, we introduce the BS-RoFormer model which inherits the idea of band-split scheme in BSRNN at the front-end, and then uses the hierarchical Transformer with Rotary Position Embedding (RoPE) to model the inner-band and inter-band sequences for multi-band mask estimation. This model has achieved state-of-the-art performance, but the band-split scheme is defined empirically, without analytic supports from the literature. In this paper, we propose Mel-RoFormer, which adopts the Mel-band scheme that maps the frequency bins into overlapped subbands according to the mel scale. In contract, the band-split mapping in BSRNN and BS-RoFormer is non-overlapping and designed based on heuristics. Using the MUSDB18HQ dataset for experiments, we demonstrate that Mel-RoFormer outperforms BS-RoFormer in the separation tasks of vocals, drums, and other stems.
1 Introduction
Music source separation (MSS) [1, 2] aims to separate a music recording into musically distinct sources. Following the definition of the 2015 Signal Separation Evaluation Campaign (SiSEC) [3], the task is focused on the 4-stem setting: vocals, bass, drums, and other. The MUSDB18 dataset [4] has been used to benchmark the performance.
Different from CNN-based approaches [5, 6, 7] that make no assumptions on weighting different frequency bands, Band-Split RNN (BSRNN) [8] directly splits the input frequency space into multiple subbands and models different subbands as a sequence. This multi-band approach has demonstrated promising results for MSS. In our recent work, we introduce the BS-RoFormer model [9] which inherits the idea of band-splitting at the front-end. Then the model employs the hierarchical Transformer with Rotary Position Embedding (RoPE) to model the inner-band and inter-band representations as hierarchical sequences for multi-band mask estimation. Training a BS-RoFormer with MUSDB18HQ and 500 extra songs has achieved an average SDR of 11.99 dB, largely advancing the state-of-the-art performance of MUSDB18HQ. We submitted the system to the Music Separation track of Sound Demixing Challenge 2023 (SDX’23).111https://www.aicrowd.com/challenges/sound-demixing-challenge-2023/ Our system ranked the first place and outperformed the second best by a large margin in SDR [10]. In ablation study [9], we demonstrate that RoPE is crucial in Transformer, and that a smaller BS-RoFormer model trained solely on MUSDB18HQ can also achieve very promising results, outperforming all existing systems that are trained without extra training data .
From Psychoacoustics [11], we learn that human auditory system tends to prefer higher resolution at lower frequencies, and is less sensitive at higher frequencies. This sets the basic principle when designing the band-split module in BS-RoFormer. However, such band-split scheme is defined empirically without analytic supports from the literature. In this paper, we explore the mel scale [12], which has a long history as the fundamental reference for acoustic feature design (e.g., MFCC and mel-spectrogram) in the field of audio signal processing. By replacing the band-split module with the so-called Mel-band projection module, we develop the Mel-RoFormer model. In experiments, we show that Mel-RoFormer outperforms BS-RoFormer in the separation tasks of vocals, drums, and other stems.
| Vocals | Bass | Drums | Other | Average | # Param | |
| HDemucs [13] | 8.04 | 8.67 | 8.58 | 5.59 | 7.72 | |
| BSRNN [8] | 10.01 | 7.22 | 9.01 | 6.70 | 8.24 | |
| TFC-TDF-UNet-V3 [14] | 9.59 | 8.45 | 8.44 | 6.86 | 8.34 | |
| BS-RoFormer (=6) | 10.78 | 11.43 | 9.61 | 7.86 | 9.92 | 72.2M |
| Mel-RoFormer (=6) | 11.21 | 9.64 | 9.91 | 7.81 | 9.64 | 84.2M |
| BS-RoFormer (=9) | 11.02 | 11.58 | 9.66 | 7.80 | 10.02 | 82.8M |
| Mel-RoFormer (=9) | 11.60 | - | 9.34 | 7.93 | - | 94.8M |
2 Mel-Band Projection Module
The Mel-band projection module relies on a mapping that projects relevant frequency bins to each specific band according to the mel scale, which is designed following a quasi-logarithmic function of acoustic frequency such that perceptually similar pitch intervals (e.g., octaves) have equal width over the full hearing range.
Given the number of Mel-bands for Mel-RoFormer, the center frequency of each Mel-band can be calculated on the mel scale. The width of a Mel-band is two times the distance between its center and its previous Mel-band’s center. This makes the second half of a Mel-band overlaps its next Mel-band, and so forth until the last Mel-band. On the contrary, as a result of the band-split module in BS-RoFormer, the frequency ranges of different subbands are non-overlapping. Figure 1 illustrates an example of the Mel-band projection with 16 bands. In this case, a windows size of 2048 is used for FFT computation, so the length of frequency bins is 1024. During the multi-band mask estimation, each Mel-band representation is projected back to the original frequency space. Different from BS-RoFormer [9], the projected mask estimation values of the overlapped frequency bins are averaged accordingly to produce the final mask. Note that since we use the complex spectrogram as features, the Mel-band projection is applied to both real and imaginary values.
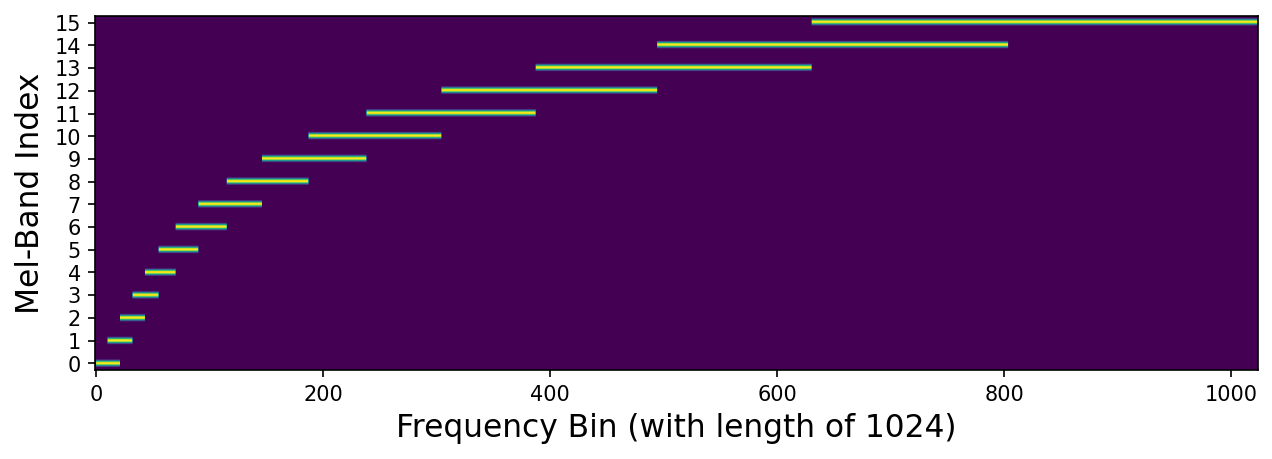
To retrieve the frequency-to-Mel-band index mapping, we utilize the implementation of Mel filter-bank in librosa [15], where the mel-frequency replicates the behavior of the function in MATLAB Auditory Toolbox [16]. By calling librosa.filters.mel we obtain the mapping matrix with a triangle filter for each Mel-band. Then, we binarize this matrix by setting all non-zero values to 1 to discard the triangle filters. Such result yields the example in Figure 1. Technically speaking, the Mel-band projection module can be seen as a learnable Mel filter-bank, since its MLP-layers serve as the mechanism to learn the filters.
3 Experiment
3.1 Configuration
Our experiment focuses on validating the effectiveness of Mel-RoFormer and if it can outperform the baseline BS-RoFormer. As training a larger model with more data takes a long time, we opt for smaller sizes of model configuration and use only MUSDB18HQ [4] without adding any extra data. Specifically, we compare different models of using =6 and =9 for the RoPE Transformer block. We use 60 Mel-bands, as it is similar to the number of subbands, i.e., 62, adopted by BS-RoFormer. For deframing method, “overlap & average” with a hop of half chunk is used for all models. All other configuration remains the same between Mel-RoFormer and BS-RoFormer [9]. In terms of hardware, we use 16 Nvidia V100-32GB GPUs, and this leads to an effective batch size of 96 (i.e., 6 for each GPU) using accumulate_grad_batches=2.
3.2 Results
Table 1 presents the results. We use the signal-to-distortion ratio (SDR) [17] implemented by museval [18] as the evaluation metric. The median SDR across the median SDRs over all 1 second chunks of each test song is reported, following prior works. It is clear that the Mel-band projection can help the separation of vocals, improving the performance largely against the band-split module (e.g., by 0.43 dB and 0.58 dB for =6 and =9 models, respectively). This makes sense because the mel scale has been well proven to be useful in modeling human voices. Mel-RoFormer also outperform BS-RoFormer in the separation tasks of ‘drums’ and ‘other’ stems, but a deeper model (=9) does not seem to help for drums. Qualitative analysis indicates that Mel-RoFormer can produce smoother vocal sounds with more consistent loudness. We will present more audio examples to attendees at the conference.
However, the Mel-band mapping is less successful for modeling the bass stem as compared to our band-split setting [9]. We found the training progress became very slow when using Mel-RoFormer for bass, so we only report the result for =6 model. Such observation is reasonable because bass is a unique instrument among the 4 stems that specifically focuses on low frequency. We also tried removing the overlapped frequency bins throughout the Mel-bands or using less Mel-bands, but the adjustments did not seem to help. This may indicate that the mel scale is an imperfect scheme to well characterize the timbres of bass.
4 Conclusion
We have shown that Mel-band projection is a promising scheme for multi-band MSS approaches for non-bass instruments. For future work, we plan to explore other supervised MIR tasks such as multi-instrument transcription [19, 20], chord recognition, beat/downbeat tracking [21], and structure segmentation [22] using Mel-RoFormer.
References
- [1] Z. Rafii, A. Liutkus, F.-R. Stöter, S. I. Mimilakis, D. FitzGerald, and B. Pardo, “An overview of lead and accompaniment separation in music,” IEEE/ACM Trans. Audio Speech Lang. Process., vol. 26, no. 8, pp. 1307–1335, 2018.
- [2] Y. Mitsufuji, G. Fabbro, S. Uhlich, F.-R. Stöter, A. Défossez, M. Kim, W. Choi, C.-Y. Yu, and K.-W. Cheuk, “Music demixing challenge 2021,” Frontiers in Signal Processing, 2022.
- [3] A. Liutkus, F.-R. Stöter, Z. Rafii, D. Kitamura, B. Rivet, N. Ito, N. Ono, and J. Fontecave, “The 2016 signal separation evaluation campaign,” in 13th International Conference on Latent Variable Analysis and Signal Separation, 2017, pp. 323–332.
- [4] Z. Rafii, A. Liutkus, F.-R. Stöter, S. I. Mimilakis, and R. Bittner, “The MUSDB18 corpus for music separation,” Dec. 2017, https://doi.org/10.5281/zenodo.1117372.
- [5] P. Chandna, M. Miron, J. Janer, and E. Gómez, “Monoaural audio source separation using deep convolutional neural networks,” in Latent Variable Analysis and Signal Separation (LVA/ICA), 2017, pp. 258–266.
- [6] Q. Kong, Y. Cao, H. Liu, K. Choi, and Y. Wang, “Decoupling magnitude and phase estimation with deep resunet for music source separation,” in ISMIR, 2021.
- [7] A. Jansson, E. Humphrey, N. Montecchio, R. Bittner, A. Kumar, and T. Weyde, “Singing voice separation with deep U-Net convolutional networks,” in ISMIR, 2017.
- [8] Y. Luo and J. Yu, “Music Source Separation With Band-Split RNN,” IEEE/ACM Trans. Audio Speech Lang. Process., vol. 31, pp. 1893–1901, 2023.
- [9] W.-T. Lu, J.-C. Wang, Q. Kong, and Y.-N. Hung, “Music source separation with Band-Split RoPE Transformer,” arXiv preprint arXiv:2309.02612, 2023.
- [10] G. Fabbro, S. Uhlich, C. Lai, W. Choi, M. Martinez-Ramirez, W. Liao, I. Gadelha, G. Ramos, E. Hsu, H. Rodrigues et al., “The sound demixing challenge 2023–music demixing track,” arXiv preprint arXiv:2308.06979, 2023.
- [11] G. Ballou, Handbook for sound engineers. Taylor & Francis, 2013.
- [12] S. S. Stevens, J. Volkmann, and E. B. Newman, “A scale for the measurement of the psychological magnitude pitch,” The journal of the acoustical society of america, vol. 8, no. 3, pp. 185–190, 1937.
- [13] A. Défossez, “Hybrid spectrogram and waveform source separation,” arXiv preprint arXiv:2111.03600, 2021.
- [14] M. Kim and J. H. Lee, “Sound demixing challenge 2023–music demixing track technical report,” arXiv preprint arXiv:2306.09382, 2023.
- [15] B. McFee, C. Raffel, D. Liang, D. P. Ellis, M. McVicar, E. Battenberg, and O. Nieto, “librosa: Audio and music signal analysis in python,” in Proceedings of the 14th python in science conference, vol. 8, 2015, pp. 18–25.
- [16] M. Slaney, “Auditory toolbox,” Interval Research Corporation, Tech. Rep, vol. 10, no. 1998, p. 1194, 1998.
- [17] E. Vincent, R. Gribonval, and C. Févotte, “Performance measurement in blind audio source separation,” IEEE Trans. Audio Speech Lang. Process., vol. 14, no. 4, pp. 1462–1469, 2006.
- [18] F.-R. Stöter, A. Liutkus, and N. Ito, “The 2018 signal separation evaluation campaign,” in LVA/ICA, 2018, pp. 293–305.
- [19] W.-T. Lu, J.-C. Wang, M. Won, K. Choi, and X. Song, “SpecTNT: A time-frequency transformer for music audio,” in ISMIR, 2021.
- [20] W.-T. Lu, J.-C. Wang, and Y.-N. Hung, “Multitrack music transcription with a time-frequency perceiver,” in IEEE ICASSP, 2023.
- [21] Y.-N. Hung, J.-C. Wang, X. Song, W.-T. Lu, and M. Won, “Modeling beats and downbeats with a time-frequency transformer,” in IEEE ICASSP, 2022, pp. 401–405.
- [22] J.-C. Wang, Y.-N. Hung, and J. B. Smith, “To catch a chorus, verse, intro, or anything else: Analyzing a song with structural functions,” in IEEE ICASSP, 2022, pp. 416–420.