J0107a: A Barred Spiral Dusty Star-forming Galaxy at
Abstract
Dusty Star-Forming Galaxies (DSFGs) are amongst the most massive and active star-forming galaxies during the cosmic noon. Theoretical studies have proposed various formation mechanisms of DSFGs, including major merger-driven starbursts and secular star-forming disks. Here, we report J0107a, a bright ( mJy at observed-frame 888 m) DSFG at that appears to be a gas-rich massive disk and might be an extreme case of the secular disk scenario. J0107a has a stellar mass , molecular gas mass , and a star formation rate (SFR) of yr-1. J0107a does not have a gas-rich companion. The rest-frame 1.28 m JWST NIRCam image of J0107a shows a grand-design spiral with a prominent stellar bar extending kpc. ALMA band 7 continuum map reveals that the dust emission originates from both the central starburst and the stellar bar. 3D disk modeling of the CO(4-3) emission line indicates a dynamically cold disk with rotation-to-dispersion ratio . The results suggest a bright DSFG may have a non-merger origin, and its vigorous star formation may be triggered by bar and/or rapid gas inflow.
1 Introduction
The cosmic star formation rate density increases from early times to its peak at , called cosmic noon, and then decreases steadily to the present day (for a review, see Madau & Dickinson, 2014). During cosmic noon, dusty star-forming galaxies (DSFGs) populate the massive and high-SFR end of star-forming galaxies, with and SFR yr-1(e.g., da Cunha et al., 2015; Miettinen et al., 2017; Dudzevičiūtė et al., 2020). The large infrared luminosity of DSFGs makes them easy to be detected with submillimeter/millimeter observations, and they are often referred to as submillimeter galaxies (SMGs; e.g., Smail et al., 1997; Hughes et al., 1998; Casey et al., 2014)
The origin of DSFGs has been debated since their discovery. Based on insights from studying local ultraluminous infrared galaxies (ULIRGs), which are exclusively late-stage major mergers (e.g., Sanders & Mirabel, 1996), and observations of high-z DSFGs, many authors have argued that bright DSFGs (or classical SMGs with mJy) are mainly major mergers (e.g., Tacconi et al., 2008; Engel et al., 2010; Chen et al., 2022a). Early theoretical models demonstrated that major mergers can indeed power bright DSFGs (e.g., Narayanan et al., 2010; Hayward et al., 2011), but it was unclear whether there were enough major mergers to account for the observed number counts of bright DSFGs. Hayward et al. (2011, 2012, 2013) argued that the high-z bright DSFG population is heterogeneous, with merger-driven starbursts dominating at the bright end and ‘quiescently star-forming’ disks dominating at fainter submm fluxes. Others have argued that the DSFG population is predominantly gas-rich massive disks (i.e. not ongoing major mergers) that sustain high SFRs due to high gas accretion rates from the cosmic web (e.g., Dekel et al., 2009; Davé et al., 2010; Narayanan et al., 2015; Lovell et al., 2021).
Morphological information can thus place critical constraints on the formation channels of DSFGs by distinguishing disks and mergers. Previous studies using deep Hubble Space Telescope (HST) imaging have revealed a prevalence of disturbed morphology (e.g., Chen et al., 2015), inline with interaction or merger. However, due to the high redshift and heavy dust obscuration of DSFGs, the rest-frame UV/optical emission observed with HST might not be an ideal tracer of stellar distribution.
The advent of James Webb Space Telescope (JWST) makes rest-frame optical-to-NIR imaging with unprecedented sensitivity and spatial resolution available for DSFGs. Recent JWST studies of submm-selected galaxies have found a large fraction of isolated disks (Chen et al., 2022b; Cheng et al., 2023), in contrast to more clumpy and irregular shapes in HST bands. JWST rest-frame NIR imaging will provide a more robust view of the stellar distribution of DSFGs and hints for their possibly diverse formation channels.
In this paper, we report J0107a, a DSFG with a clear barred spiral structure in JWST/NIRCam images and bright dust continuum and CO/[CI](1-0) line emission. We describe the observation in Section 2 and data analyses and results in Section 3. We discuss the results and summarize in Section 4. Throughout this paper we assume the Chabrier (2003) IMF and Planck 2018 cosmology ( km s-1 Mpc-1, and ; Planck Collaboration et al., 2020).
2 DATA
2.1 The Target
The target of this study, J0107a was first identified by Tamura et al. (2014) as a serendipitously detected line emitter at the observed frequency of 99.75 GHz in ALMA band 3 observation towards the local galaxy merger VV114 at . Based on photometric redshift, the line is identified as CO(3-2) at . The redshift is confirmed by Mizukoshi et al. (2021) with CO(3-2), CO(4-3), and [CI](1-0) emission lines (Figure 1a). J0107a is also detected in continuum with flux densities of mJy at 1.3 mm and mJy at m, which satisfy the selection criteria of a classical SMG.
2.2 ALMA Data
J0107a has been covered by the ALMA campaigns toward VV114. In this study, we include ALMA band 3 (Project code 2013.1.00469.S and 2013.1.01057.S), band 4 (2013.1.01057.S), band 6 (2015.1.00973.S and 2015.1.00902.S), and band 7 (2013.1.00740.S) data. Data reduction and imaging are conducted with CASA (CASA Team et al., 2022) in a standard manner following Mizukoshi et al. (2021), except for band 3 and 4, additional spectral cubes with natural weighting are made to maximize sensitivity. The integrated 1D ALMA spectra of J0107a are shown in Figure 1a.
2.3 JWST Data
JWST observations of the VV114 field have been conducted as part of the GOALS-JWST survey (Evans et al., 2022; Linden et al., 2023), with NIRCam imaging in the F150W, F200W, F356W, and F444W filters and MIRI imaging in the F560W, F770W, and F1500W filters. 111The JWST data presented in this paper were obtained from the Mikulski Archive for Space Telescopes (MAST) at the Space Telescope Science Institute. The specific observations analyzed can be accessed via https://doi.org/10.17909/g4k8-3922 (catalog DOI: 10.17909/g4k8-3922). We obtain images from the MAST archive and align the astrometry to GAIA DR3 (Gaia Collaboration et al., 2016, 2023). To remove the foreground emission from VV114, we first apply standard background subtraction, then identify point sources with a flux ratio as bright stars in VV114 and subtract them using the point spread function (PSF) model built with the WebbPSF222https://github.com/spacetelescope/webbpsf package before performing photometry.
3 Analysis and Results
3.1 JWST and ALMA Look at J0107a
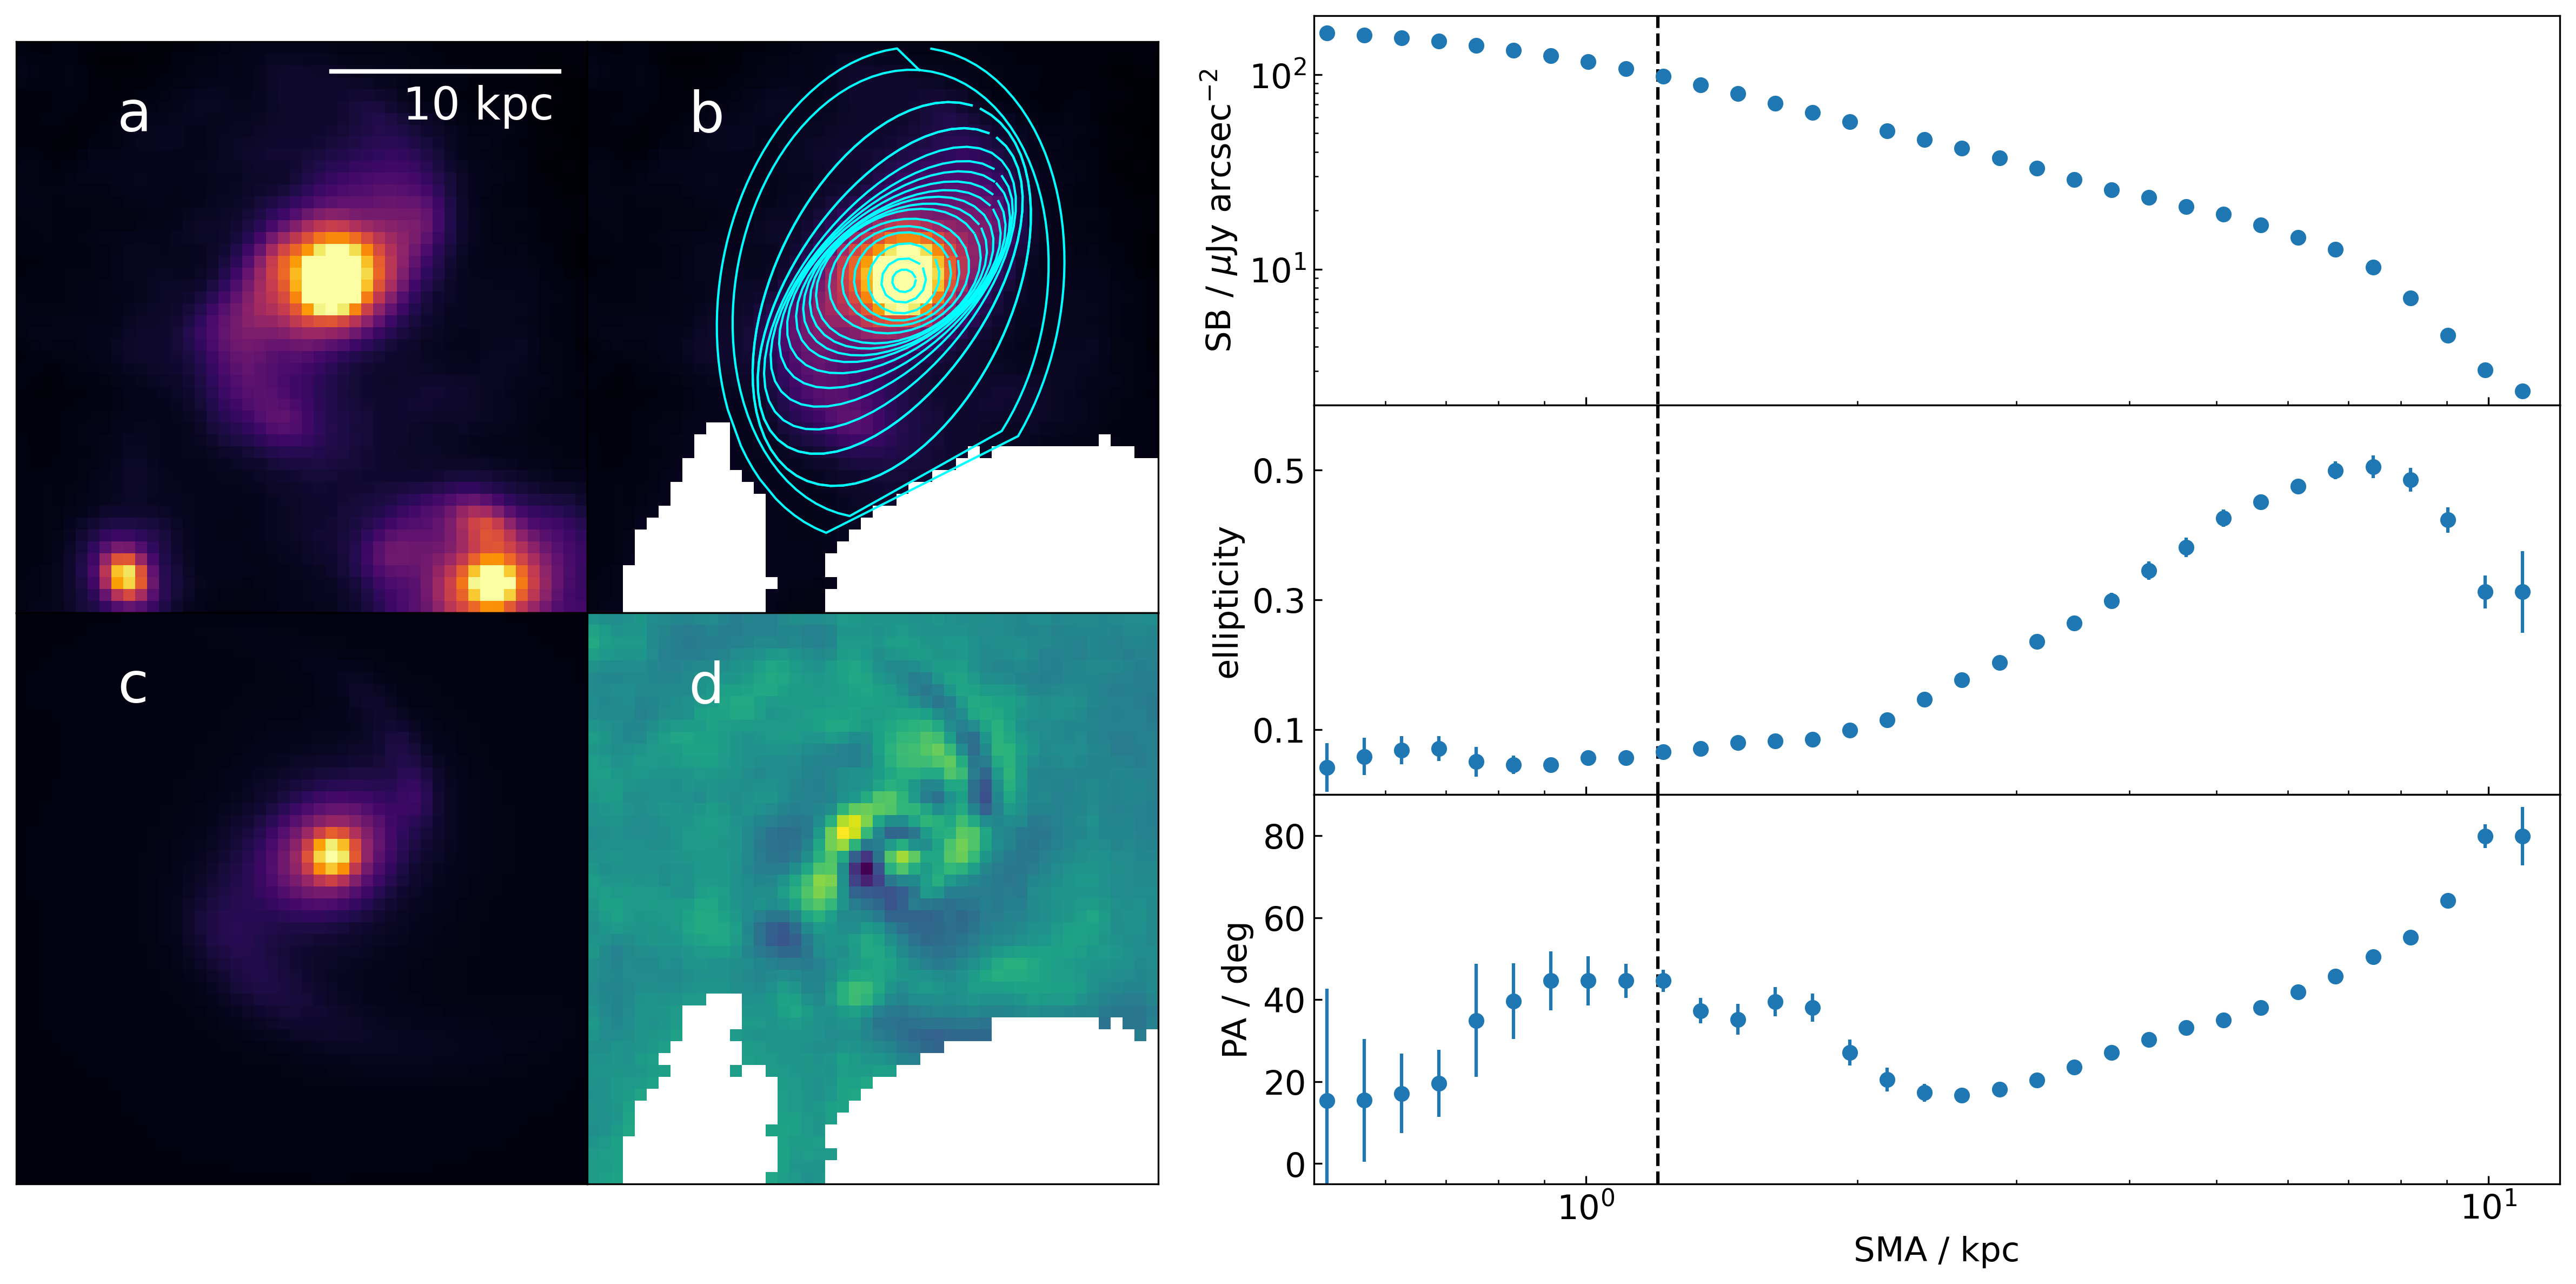
The left panel of Figure 1b shows the NIRCam image of J0107a. J0107a is clearly resolved, showing a grand-design barred spiral structure with two arms and a blue central point-like source, in line with an active galactic nucleus (AGN) as indicated by its X-ray detection in Chandra ACIS-S data (Grimes et al., 2006). The bar structure is also visible in the ALMA band 7 continuum image with beam size, implying star formation in the bar (Figure 1b, the middle panel). To quantify the bar structure, we fit ellipse isophotes to the F444W image (Figure 2). The projected bar size is determined as the semimajor axis (SMA) at maximum ellipticity . For J0107a’s stellar bar, we find an SMA of 7.5 kpc and . The is similar to that measured by Guo et al. (2023) for barred galaxies in the CEERS survey, but the SMA is longer. We also perform parametric modeling of the F444W image, assuming a PSF model for the AGN, three Sérsic profiles for the bar, bulge, and disk, and two logarithmic curves for the arms (Kennicutt, 1981). We implement the models using the numpy, scipy, and astropy packages, then use the dynesty code (Speagle, 2020) to sample the joint posterior probability density function (PDF) of model parameters. The best-fit model and residual are shown in panels c and d of Figure 2, respectively. The rest-frame NIR light is dominated by the three Sérsic components with light fraction of , and for the AGN, sum of Sérsic components, and spiral arms, respectively.
J0107a is detected with three different molecular gas tracers, namely CO, [CI], and dust continuum. The derived ranges from using the CO(3-2) line to using the dust continuum, assuming SMG/ULIRG-like CO excitation and conversion factors (Mizukoshi et al., 2021). If normal star-forming galaxies-like conversions (Daddi et al., 2010, 2015; Decarli et al., 2016) are adopted, the will be . Therefore, J0107a is a very gas-rich DSFG with gas fraction . No companion of J0107a is found in the band 3 cube. Assuming /(K km s-1 pc2), and a Gaussian line profile with FWHM of 300 km s-1, the sensitivity of 1.45 mJy beam-1 in 50 km s-1 channels translates to an upper limit of , implying the absence of any companion with molecular gas mass comparable with that of J0107a.
3.2 Photometry and Spectral Energy Distribution Modeling
To derive the photometry in JWST bands, we first combine the F356W and F444W images and then run source detection routines in the photutils package to generate Kron apertures for J0107a and the two neighboring galaxies in the combined cutout image. The fluxes are measured with the Kron apertures and corrected for aperture loss using the PSF in each band. Flux uncertainties are estimated from sky by taking the standard deviations of fluxes in 1000 apertures randomly placed at blank positions within radius from J0107a.
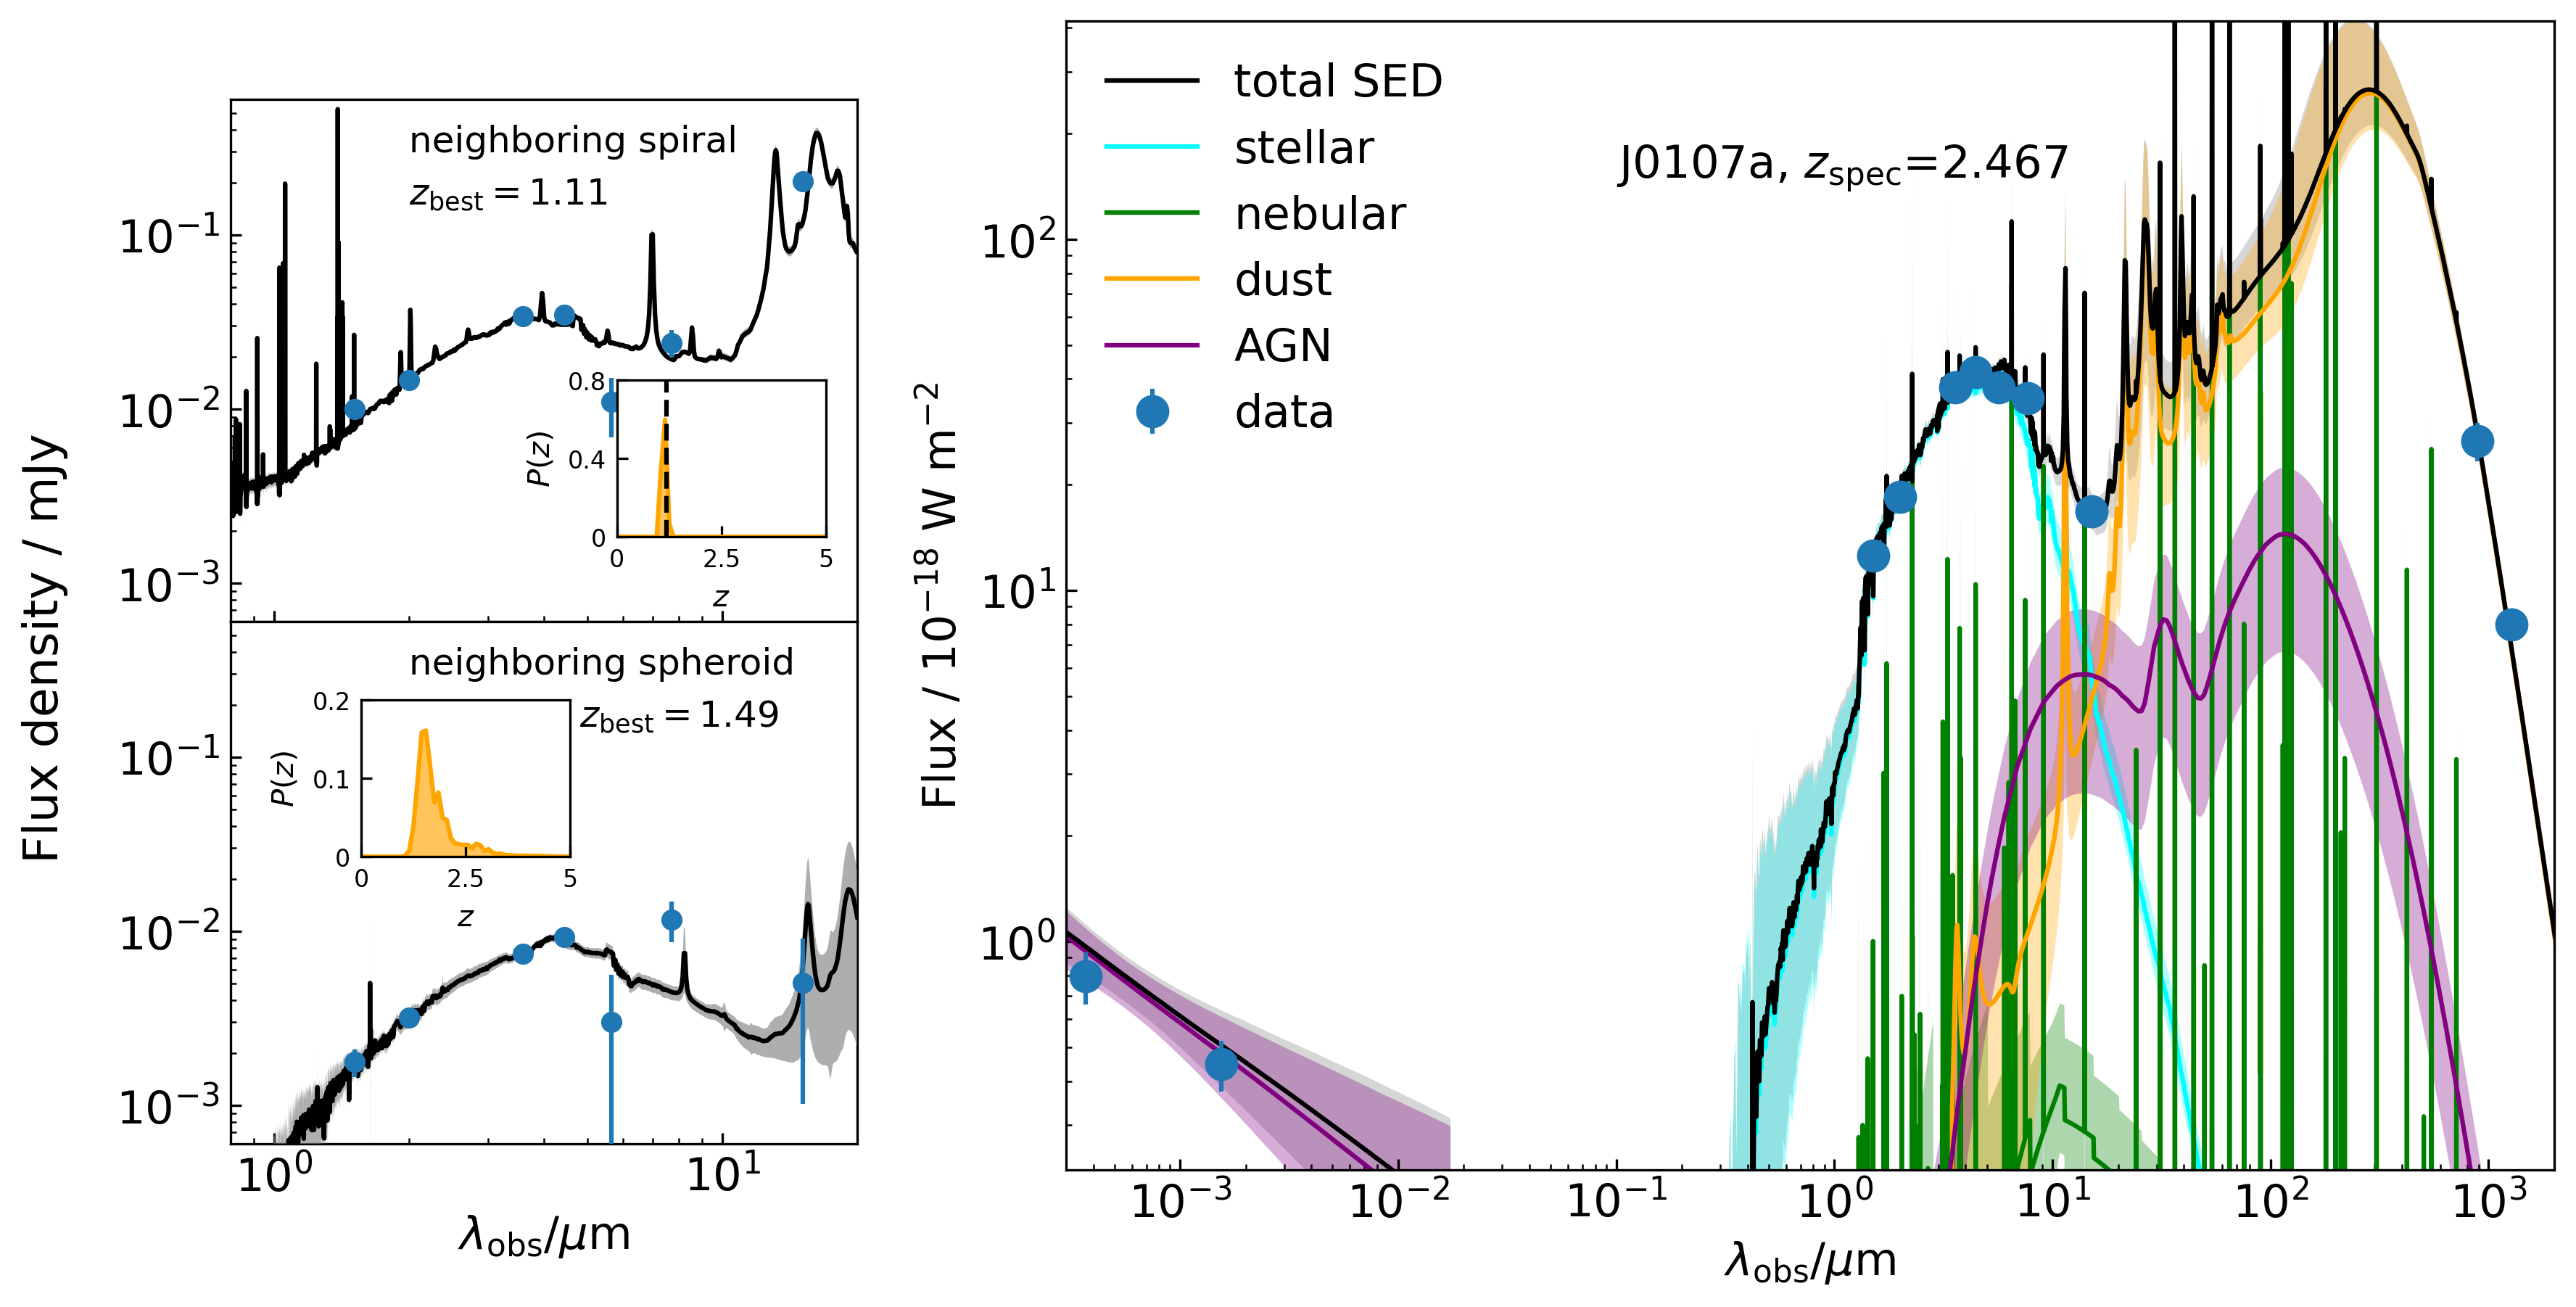
We fit the observed spectral energy distribution (SED) of J0107a using the CIGALE code (Boquien et al., 2019). In addition to the JWST data, we include ALMA band 6/7 continuum and Chandra X-ray fluxes taken from Tamura et al. (2014) and Mizukoshi et al. (2021). We assume a nonparametric star formation history (Leja et al., 2019) and adopt Noll et al. (2009) dust attenuation laws. The AGN emission is modeled with a power-law X-ray component plus the SKIRTOR library (Stalevski et al., 2016). For dust emission, we use the Draine et al. (2014) templates. We fix the redshift of J0107a at in CIGALE SED fitting.
The SED fit of J0107a is shown in the right panel of Figure 3. From SED fitting we derive the basic physical parameters of J0107a as follows: , SFR= yr-1, dust mass , and rest-frame 2-10 keV luminosity of erg s-1. The SFR of J0107a is times of the main sequence value of star-forming galaxies with the same redshift and (Speagle et al., 2014).
3.3 Properties of the Two Neighboring galaxies and Association with J0107a
Two neighboring galaxies are visible within from J0107a. The spiral galaxy southwest of J0107a exhibits a single-peaked redshift PDF (Figure 3, the top-left panel). This PDF, derived from the SED fit of the JWST photometry using the EAZY333https://github.com/gbrammer/eazy-py (Brammer et al., 2008) code, yields a photometric redshift of . An emission line at the central frequency of 105.458 GHz is detected at the position of the southwest spiral galaxy in the ALMA band 3 spectral cube (Figure 1b, the middle panel), with the direction of velocity gradient aligning with the NIR major axis. Therefore, we are able to identify the emission line as redshifted CO(2-1) and derive spectroscopic redshift for this galaxy. The neighboring spheroid galaxy southeast to J0107a has from the redshift PDF (Figure 3, the bottom-left panel) and no line or continuum detection in the ALMA data, so its relation with J0107a remains uncertain. If this spheroid galaxy is at the same redshift of J0107a, the and SFR derived from SED fit of the JWST data will be and yr-1, respectively, and the stellar mass ratio of 1:6 does not satisfy the definition of a major merger.
3.4 Dynamical Modeling
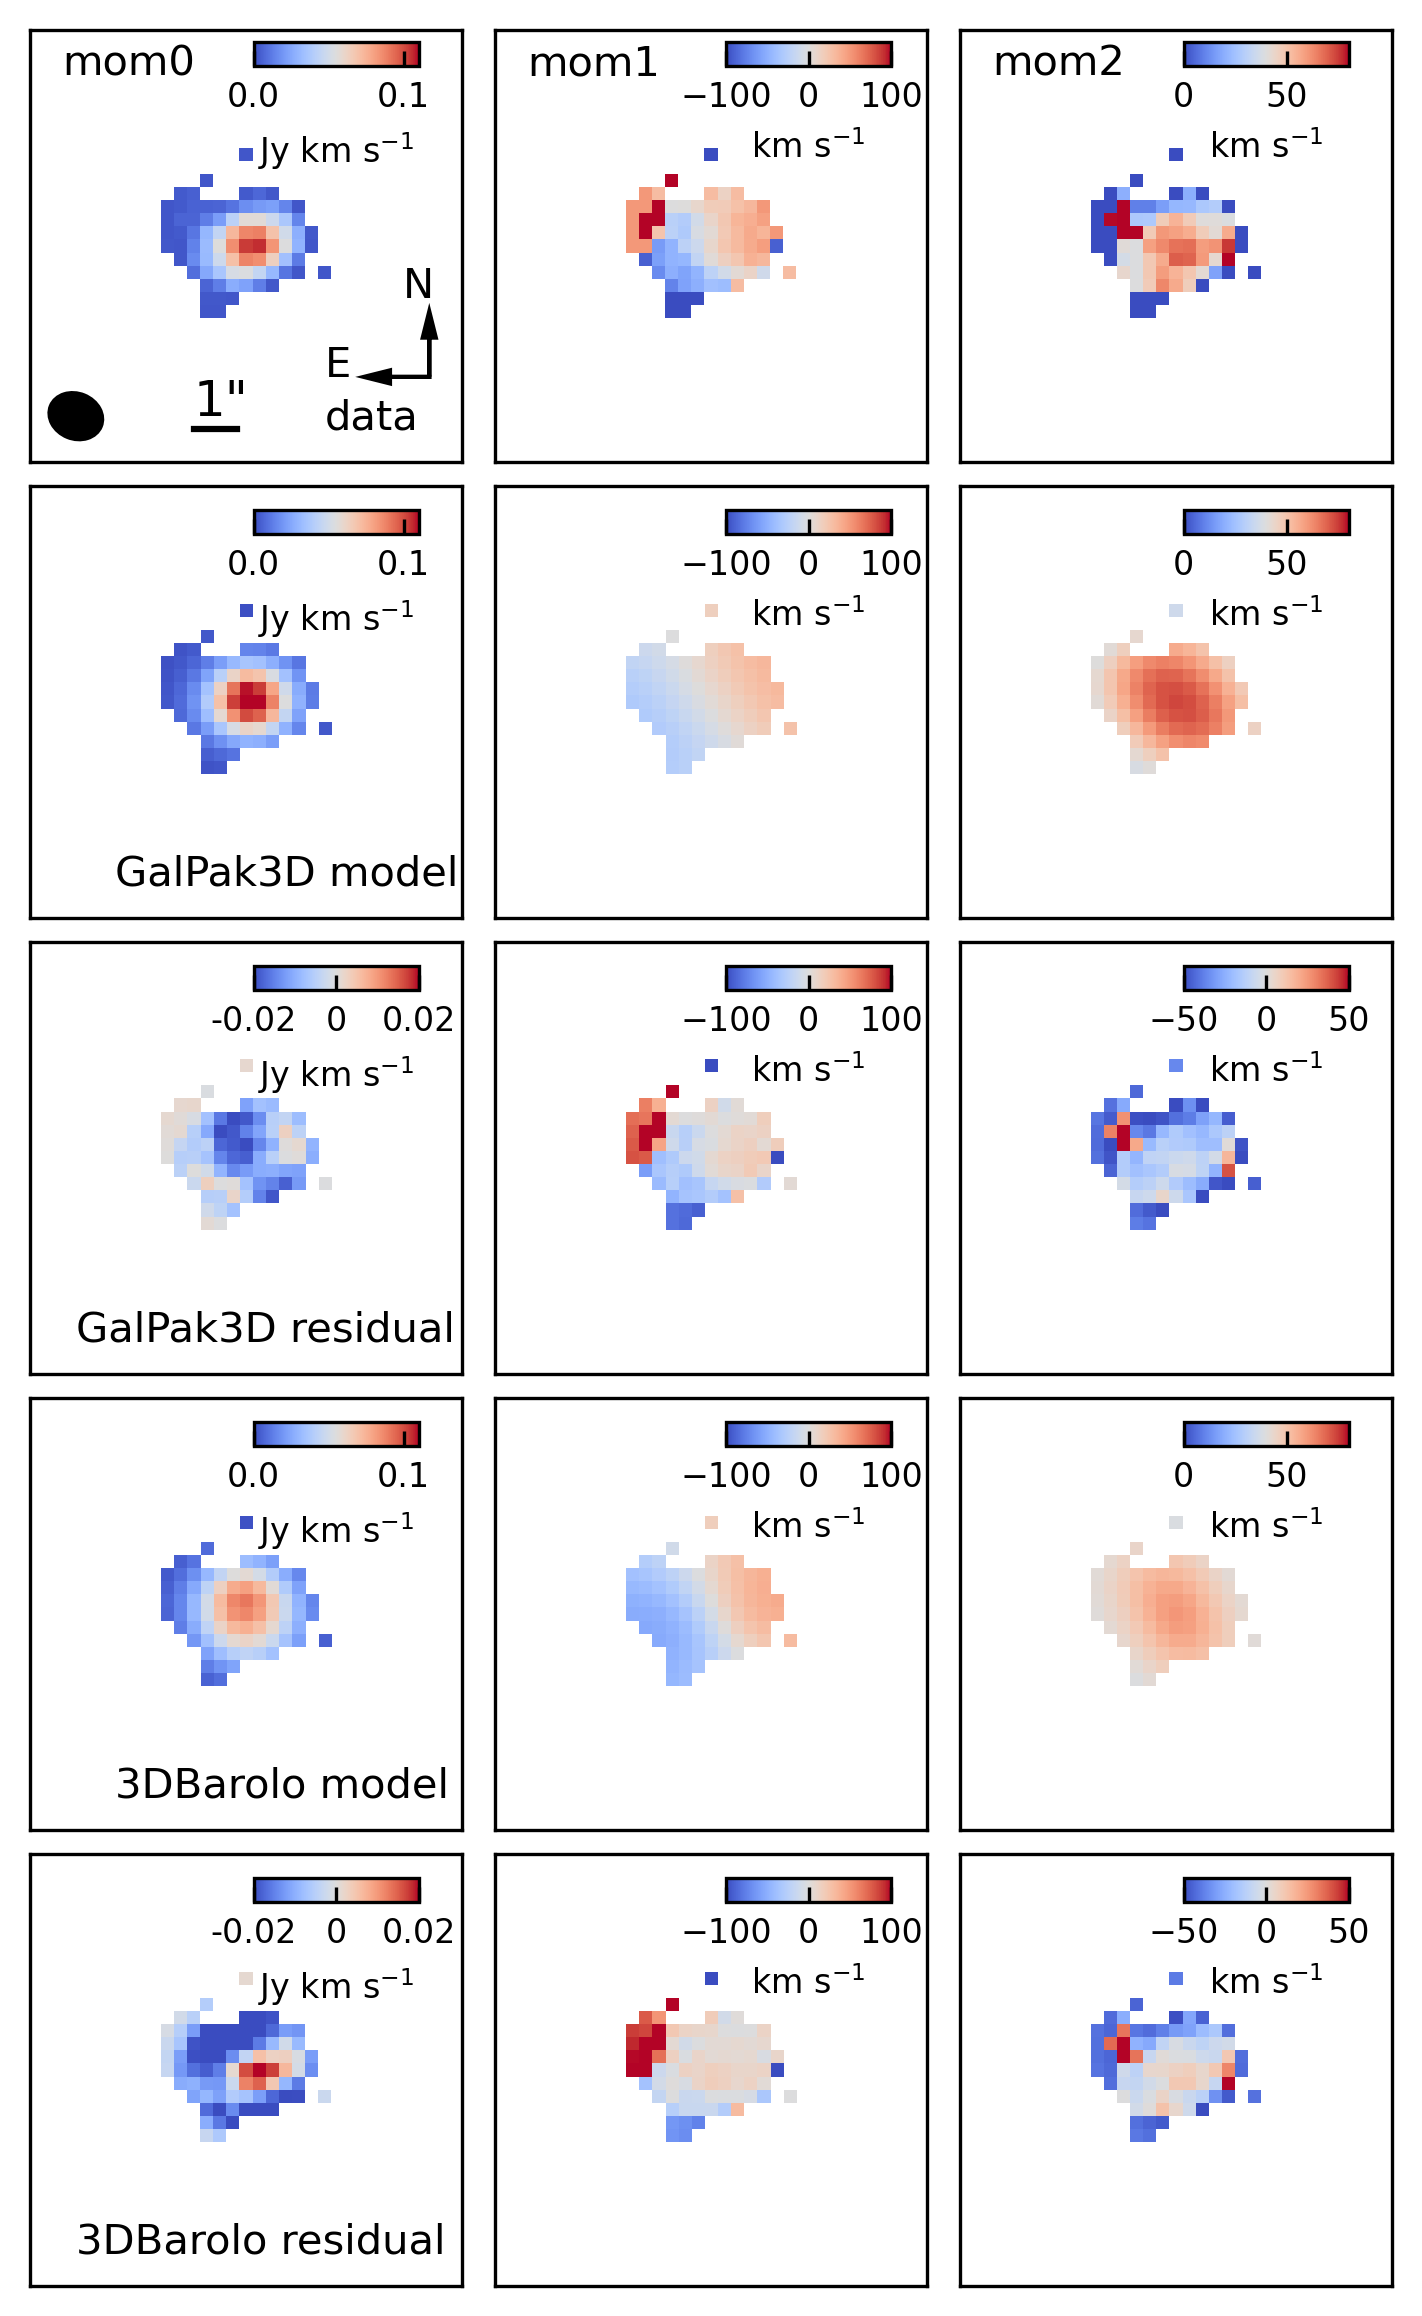
A clear velocity gradient is seen in the velocity fields of all three spectral lines (Figure 4, see also Mizukoshi et al. (2021)). We choose CO(4-3) to perform kinematic modeling because it has the highest S/N. We create a cutout cube centered at J0107a with km s-1 channel width and model the data with the GalPak3D code (Bouché et al., 2015), assuming an exponential disk profile and arctan rotation curve. This gives an inclination of , half-light radius , maximum rotation velocity km s-1, and intrinsic velocity dispersion km s-1. In addition, we fit the data with the 3D-Barolo code (Di Teodoro & Fraternali, 2015) and find consistent values of an inclination of , maximum rotation velocity of km s-1 and intrinsic velocity dispersion of 31 km s-1. The best-fit models and residual maps are shown in Figure 4. These results show J0107a has a dynamically cold gas disk with .
The dynamical mass within a radius of kpc at can be calculated as:
| (1) |
where is the gravitational constant and is the circularized velocity (Burkert et al., 2010) computed using the results from GalPak3D modelling. The resulting of is less than the sum of and , indicating the total mass within a radius of 10 kpc is dominated by baryon.
Previous analysis in Mizukoshi et al. (2021) reported a dynamical mass of based on similar velocity dispersion but a much lower km s-1, and their conflicts with and , mainly because of their initial guess of inclination of . We have tested initial guesses of , , and , and let the value vary from to . For initial guesses of , , the fit converges to the same results presented above, while for the initial guess of , the fit converges to . Apparently, the inclination cannot be constrained alone with the resolution CO data even the peak S/N reaches , and the new low inclination solution seems more appropriate. The outermost isophote of J0107a has an ellipticity of which translates to an inclination of . The inclination from isophote fitting should be treated as an upper limit because of distortion of the isophotes by strong spiral arms (Yu & Ho, 2020) and insufficient depth of the F444W image to detect the underlying smooth stellar disk. We caution that the current estimate can still have large uncertainty due to the low inclination, beam smearing effect, and a possible more complex rotation pattern due to the bar. Future high-resolution CO observations are needed to better constrain the dynamics and mass distribution.
4 Discussion and Conclusion
A bright DSFG with a flux density of mJy at the observed wavelength of 888 m is expected to be the product of a gas-rich major merger according to the conventional wisdom. Nonetheless, J0107a’s symmetric barred spiral morphology, lack of massive and gas-rich companion, and large dynamically cold gas disk all support a non-merger origin. Instead of merger-induced starburst, a more plausible formation channel would be cold mode accretion via inflowing gas streams from the cosmic web which penetrate the hot medium in the host halo and reach the central galaxy to fuel star formation and AGN activity (e.g., Kereš et al., 2009). Assuming the stellar-to-halo mass ratio ranges from dex to dex (Stach et al., 2021), J0107a has a halo mass of , which lies at the boundary between hot and cold in hot modes of accretion (Dekel & Birnboim, 2006) and represents the most efficient normal star-forming galaxy in converting gas into stars at this redshift. The predicted baryon accretion rate is yr-1 (Dekel et al., 2009), which is sufficient to supply J0107a’s star formation. If J0107a is indeed fed by such streams, it will be an extreme case with the maximum allowed accretion rate, thus an ideal target to directly detect such streams onto a bright DSFG and demonstrate their heterogeneous origins.
The large stellar bar of J0107a is of particular interest in the context of galaxy assembly. J0107a has the highest redshift among known galaxies with a clear stellar bar identified (e.g., Simmons et al., 2014; Guo et al., 2023), but also see a lensed case at (Smail et al., 2023) and potential gas/dust bars at (Hodge et al., 2019; Tsukui et al., 2023). In local strongly barred galaxies, the global SFR is suppressed compared to unbarred spiral galaxies with similar mass (e.g., Gavazzi et al., 2015; Géron et al., 2021), while J0107a lies above the star-forming main sequence. This may be interpreted as the bar-accelerated stellar mass build-up in the past (e.g., Kim et al., 2017; Fraser-McKelvie et al., 2020) due to the effective gas redistribution as we will discuss below, and J0107a is caught in the early starburst phase of a massive barred galaxy.
In addition to the stellar bar, the 888 m dust continuum map suggests the presence of a dust/gas bar (Figure 1b, the middle panel), which is the site of star formation. The dust emission shows three peaks and is reminiscent of the enhancement of SFR at the galactic center and the bar ends in local barred galaxies (Maeda et al., 2023). Elevated central star formation is common in local barred galaxies (e.g., Chown et al., 2019; Lin et al., 2020) and explained by theoretical studies as a consequence of gas being funneled by the bar toward the center and feeds the star formation and supermassive black hole (e.g., Carles et al., 2016). The higher central molecular gas concentration observed in local barred spiral galaxies (Kuno et al., 2007; Yu et al., 2022b) provides direct evidence for bar-driven gas inflow, and Yu et al. (2022b) also suggest the spiral arms can playing a role in transporting gas to the center. On the other hand, barred galaxies with suppressed central SFR often exhibit weak to nearly vanished spiral arms (Wang et al., 2020; Yu et al., 2022a). J0107a possesses a strong stellar bar and pronounced spiral arms, and the high SFR may be triggered by gas inflow driven by stellar structures in its gas-rich disk.
Numerical simulations have shown that an isolated baryon-dominated and dynamically cold disk allows bar formation at early times (Rosas-Guevara et al., 2022; Bland-Hawthorn et al., 2023), though it has also been suggested that a high gas fraction can weaken the bar and slows down its formation (e.g., Athanassoula et al., 2013). Alternative formation channels of barred spiral structures include interaction with a companion galaxy (e.g., Elmegreen et al., 1990; Oh et al., 2008). The photometric redshift of the southeast spheroid galaxy does not exclude the possibility of it being a companion of J0107a. From the analysis of the JWST data, the spheroid galaxy will have of J0107a and a distance of 13 kpc to J0107a if it is at , which is sufficient to affect J0107a’s disk. While the southeast spiral arm indeed seems brighter, tidal features were not found. Furthermore, J0107a’s CO disk is dynamically cold and dominated by ordered rotation (). Considering that cold accretion can also bring a low component (Ho, 2007), secular bar formation is thus favored and consistent with the first massive and well-ordered disks emerging in the cosmic noon (Simons et al., 2017).
Previous simulations of bar formation have neither covered the parameter space with , SFR, and gas fraction as high as J0107a, nor gas accretion from the surrounding environment. Refined simulations reproducing the properties of J0107a are needed to understand the formation mechanisms of stellar and gas bars in the earliest massive disks. In terms of observations, deep high-resolution spectroscopy is needed to confirm the isolated disk nature of J0107a and to investigate the interplay between bar, gas, and star formation.
Finally, J0107a has been mis-identified as a strongly lensed SMG magnified by approximately ten times in Mizukoshi et al. (2021) to explain the bright CO(4-3) emission with narrow line FWHM (FWHM = km s-1; Jy km s-1). However, it is now clear that this is caused by a low inclination of , as the regular morphology and absence of a nearby massive source can rule out strong gravitational lensing effect. While the empirical relation between CO line FWHM and velocity-integrated intensity (e.g., Harris et al., 2012; Bothwell et al., 2013) is a natural consequence of the virial theorem for large samples of unlensed galaxies, the use of such relations to identify individual lensed source should be careful as the result is sensitive to the unknown inclination.
References
- Astropy Collaboration et al. (2018) Astropy Collaboration, Price-Whelan, A. M., Sipőcz, B. M., et al. 2018, AJ, 156, 123, doi: 10.3847/1538-3881/aabc4f
- Athanassoula et al. (2013) Athanassoula, E., Machado, R. E. G., & Rodionov, S. A. 2013, MNRAS, 429, 1949, doi: 10.1093/mnras/sts452
- Bland-Hawthorn et al. (2023) Bland-Hawthorn, J., Tepper-Garcia, T., Agertz, O., & Freeman, K. 2023, ApJ, 947, 80, doi: 10.3847/1538-4357/acc469
- Boquien et al. (2019) Boquien, M., Burgarella, D., Roehlly, Y., et al. 2019, A&A, 622, A103, doi: 10.1051/0004-6361/201834156
- Bothwell et al. (2013) Bothwell, M. S., Smail, I., Chapman, S. C., et al. 2013, MNRAS, 429, 3047, doi: 10.1093/mnras/sts562
- Bouché et al. (2015) Bouché, N., Carfantan, H., Schroetter, I., Michel-Dansac, L., & Contini, T. 2015, AJ, 150, 92, doi: 10.1088/0004-6256/150/3/92
- Bradley et al. (2022) Bradley, L., Sipőcz, B., Robitaille, T., et al. 2022, astropy/photutils: 1.5.0, 1.5.0, Zenodo, Zenodo, doi: 10.5281/zenodo.6825092
- Brammer et al. (2008) Brammer, G. B., van Dokkum, P. G., & Coppi, P. 2008, ApJ, 686, 1503, doi: 10.1086/591786
- Burkert et al. (2010) Burkert, A., Genzel, R., Bouché, N., et al. 2010, ApJ, 725, 2324, doi: 10.1088/0004-637X/725/2/2324
- Carles et al. (2016) Carles, C., Martel, H., Ellison, S. L., & Kawata, D. 2016, MNRAS, 463, 1074, doi: 10.1093/mnras/stw2056
- CASA Team et al. (2022) CASA Team, Bean, B., Bhatnagar, S., et al. 2022, PASP, 134, 114501, doi: 10.1088/1538-3873/ac9642
- Casey et al. (2014) Casey, C. M., Narayanan, D., & Cooray, A. 2014, Phys. Rep., 541, 45, doi: 10.1016/j.physrep.2014.02.009
- Chabrier (2003) Chabrier, G. 2003, PASP, 115, 763, doi: 10.1086/376392
- Chen et al. (2015) Chen, C.-C., Smail, I., Swinbank, A. M., et al. 2015, ApJ, 799, 194, doi: 10.1088/0004-637X/799/2/194
- Chen et al. (2022a) Chen, C.-C., Liao, C.-L., Smail, I., et al. 2022a, ApJ, 929, 159, doi: 10.3847/1538-4357/ac61df
- Chen et al. (2022b) Chen, C.-C., Gao, Z.-K., Hsu, Q.-N., et al. 2022b, ApJ, 939, L7, doi: 10.3847/2041-8213/ac98c6
- Cheng et al. (2023) Cheng, C., Huang, J.-S., Smail, I., et al. 2023, ApJ, 942, L19, doi: 10.3847/2041-8213/aca9d0
- Chown et al. (2019) Chown, R., Li, C., Athanassoula, E., et al. 2019, MNRAS, 484, 5192, doi: 10.1093/mnras/stz349
- da Cunha et al. (2015) da Cunha, E., Walter, F., Smail, I. R., et al. 2015, ApJ, 806, 110, doi: 10.1088/0004-637X/806/1/110
- Daddi et al. (2010) Daddi, E., Bournaud, F., Walter, F., et al. 2010, ApJ, 713, 686, doi: 10.1088/0004-637X/713/1/686
- Daddi et al. (2015) Daddi, E., Dannerbauer, H., Liu, D., et al. 2015, A&A, 577, A46, doi: 10.1051/0004-6361/201425043
- Davé et al. (2010) Davé, R., Finlator, K., Oppenheimer, B. D., et al. 2010, MNRAS, 404, 1355, doi: 10.1111/j.1365-2966.2010.16395.x
- Decarli et al. (2016) Decarli, R., Walter, F., Aravena, M., et al. 2016, ApJ, 833, 70, doi: 10.3847/1538-4357/833/1/70
- Dekel & Birnboim (2006) Dekel, A., & Birnboim, Y. 2006, MNRAS, 368, 2, doi: 10.1111/j.1365-2966.2006.10145.x
- Dekel et al. (2009) Dekel, A., Birnboim, Y., Engel, G., et al. 2009, Nature, 457, 451, doi: 10.1038/nature07648
- Di Teodoro & Fraternali (2015) Di Teodoro, E. M., & Fraternali, F. 2015, MNRAS, 451, 3021, doi: 10.1093/mnras/stv1213
- Draine et al. (2014) Draine, B. T., Aniano, G., Krause, O., et al. 2014, ApJ, 780, 172, doi: 10.1088/0004-637X/780/2/172
- Dudzevičiūtė et al. (2020) Dudzevičiūtė, U., Smail, I., Swinbank, A. M., et al. 2020, MNRAS, 494, 3828, doi: 10.1093/mnras/staa769
- Elmegreen et al. (1990) Elmegreen, D. M., Elmegreen, B. G., & Bellin, A. D. 1990, ApJ, 364, 415, doi: 10.1086/169424
- Engel et al. (2010) Engel, H., Tacconi, L. J., Davies, R. I., et al. 2010, ApJ, 724, 233, doi: 10.1088/0004-637X/724/1/233
- Evans et al. (2022) Evans, A. S., Frayer, D. T., Charmandaris, V., et al. 2022, ApJ, 940, L8, doi: 10.3847/2041-8213/ac9971
- Fraser-McKelvie et al. (2020) Fraser-McKelvie, A., Merrifield, M., Aragón-Salamanca, A., et al. 2020, MNRAS, 499, 1116, doi: 10.1093/mnras/staa2866
- Gaia Collaboration et al. (2016) Gaia Collaboration, Prusti, T., de Bruijne, J. H. J., et al. 2016, A&A, 595, A1, doi: 10.1051/0004-6361/201629272
- Gaia Collaboration et al. (2023) Gaia Collaboration, Vallenari, A., Brown, A. G. A., et al. 2023, A&A, 674, A1, doi: 10.1051/0004-6361/202243940
- Gavazzi et al. (2015) Gavazzi, G., Consolandi, G., Dotti, M., et al. 2015, A&A, 580, A116, doi: 10.1051/0004-6361/201425351
- Géron et al. (2021) Géron, T., Smethurst, R. J., Lintott, C., et al. 2021, MNRAS, 507, 4389, doi: 10.1093/mnras/stab2064
- Grimes et al. (2006) Grimes, J. P., Heckman, T., Hoopes, C., et al. 2006, ApJ, 648, 310, doi: 10.1086/505680
- Guo et al. (2023) Guo, Y., Jogee, S., Finkelstein, S. L., et al. 2023, ApJ, 945, L10, doi: 10.3847/2041-8213/acacfb
- Harris et al. (2012) Harris, A. I., Baker, A. J., Frayer, D. T., et al. 2012, ApJ, 752, 152, doi: 10.1088/0004-637X/752/2/152
- Harris et al. (2020) Harris, C. R., Millman, K. J., van der Walt, S. J., et al. 2020, Nature, 585, 357, doi: 10.1038/s41586-020-2649-2
- Hayward et al. (2012) Hayward, C. C., Jonsson, P., Kereš, D., et al. 2012, MNRAS, 424, 951, doi: 10.1111/j.1365-2966.2012.21254.x
- Hayward et al. (2011) Hayward, C. C., Kereš, D., Jonsson, P., et al. 2011, ApJ, 743, 159, doi: 10.1088/0004-637X/743/2/159
- Hayward et al. (2013) Hayward, C. C., Narayanan, D., Kereš, D., et al. 2013, MNRAS, 428, 2529, doi: 10.1093/mnras/sts222
- Ho (2007) Ho, L. C. 2007, ApJ, 668, 94, doi: 10.1086/521270
- Hodge et al. (2019) Hodge, J. A., Smail, I., Walter, F., et al. 2019, ApJ, 876, 130, doi: 10.3847/1538-4357/ab1846
- Hughes et al. (1998) Hughes, D. H., Serjeant, S., Dunlop, J., et al. 1998, Nature, 394, 241, doi: 10.1038/28328
- Hunter (2007) Hunter, J. D. 2007, Computing in Science & Engineering, 9, 90, doi: 10.1109/MCSE.2007.55
- Kennicutt (1981) Kennicutt, R. C., J. 1981, AJ, 86, 1847, doi: 10.1086/113064
- Kereš et al. (2009) Kereš, D., Katz, N., Fardal, M., Davé, R., & Weinberg, D. H. 2009, MNRAS, 395, 160, doi: 10.1111/j.1365-2966.2009.14541.x
- Kim et al. (2017) Kim, E., Hwang, H. S., Chung, H., et al. 2017, ApJ, 845, 93, doi: 10.3847/1538-4357/aa80db
- Kuno et al. (2007) Kuno, N., Sato, N., Nakanishi, H., et al. 2007, PASJ, 59, 117, doi: 10.1093/pasj/59.1.117
- Leja et al. (2019) Leja, J., Johnson, B. D., Conroy, C., et al. 2019, ApJ, 877, 140, doi: 10.3847/1538-4357/ab1d5a
- Lin et al. (2020) Lin, L., Li, C., Du, C., et al. 2020, MNRAS, 499, 1406, doi: 10.1093/mnras/staa2913
- Linden et al. (2023) Linden, S. T., Evans, A. S., Armus, L., et al. 2023, ApJ, 944, L55, doi: 10.3847/2041-8213/acb335
- Lovell et al. (2021) Lovell, C. C., Geach, J. E., Davé, R., Narayanan, D., & Li, Q. 2021, MNRAS, 502, 772, doi: 10.1093/mnras/staa4043
- Madau & Dickinson (2014) Madau, P., & Dickinson, M. 2014, ARA&A, 52, 415, doi: 10.1146/annurev-astro-081811-125615
- Maeda et al. (2023) Maeda, F., Egusa, F., Ohta, K., Fujimoto, Y., & Habe, A. 2023, ApJ, 943, 7, doi: 10.3847/1538-4357/aca664
- Miettinen et al. (2017) Miettinen, O., Delvecchio, I., Smolčić, V., et al. 2017, A&A, 606, A17, doi: 10.1051/0004-6361/201730762
- Mizukoshi et al. (2021) Mizukoshi, S., Kohno, K., Egusa, F., et al. 2021, ApJ, 917, 94, doi: 10.3847/1538-4357/ac01cc
- Narayanan et al. (2010) Narayanan, D., Hayward, C. C., Cox, T. J., et al. 2010, MNRAS, 401, 1613, doi: 10.1111/j.1365-2966.2009.15790.x
- Narayanan et al. (2015) Narayanan, D., Turk, M., Feldmann, R., et al. 2015, Nature, 525, 496, doi: 10.1038/nature15383
- Noll et al. (2009) Noll, S., Burgarella, D., Giovannoli, E., et al. 2009, A&A, 507, 1793, doi: 10.1051/0004-6361/200912497
- Oh et al. (2008) Oh, S. H., Kim, W.-T., Lee, H. M., & Kim, J. 2008, ApJ, 683, 94, doi: 10.1086/588184
- Planck Collaboration et al. (2020) Planck Collaboration, Aghanim, N., Akrami, Y., et al. 2020, A&A, 641, A1, doi: 10.1051/0004-6361/201833880
- Rosas-Guevara et al. (2022) Rosas-Guevara, Y., Bonoli, S., Dotti, M., et al. 2022, MNRAS, 512, 5339, doi: 10.1093/mnras/stac816
- Sanders & Mirabel (1996) Sanders, D. B., & Mirabel, I. F. 1996, ARA&A, 34, 749, doi: 10.1146/annurev.astro.34.1.749
- Simmons et al. (2014) Simmons, B. D., Melvin, T., Lintott, C., et al. 2014, MNRAS, 445, 3466, doi: 10.1093/mnras/stu1817
- Simons et al. (2017) Simons, R. C., Kassin, S. A., Weiner, B. J., et al. 2017, ApJ, 843, 46, doi: 10.3847/1538-4357/aa740c
- Smail et al. (1997) Smail, I., Ivison, R. J., & Blain, A. W. 1997, ApJ, 490, L5, doi: 10.1086/311017
- Smail et al. (2023) Smail, I., Dudzeviciute, U., Gurwell, M., et al. 2023, arXiv e-prints, arXiv:2306.16039, doi: 10.48550/arXiv.2306.16039
- Speagle (2020) Speagle, J. S. 2020, MNRAS, 493, 3132, doi: 10.1093/mnras/staa278
- Speagle et al. (2014) Speagle, J. S., Steinhardt, C. L., Capak, P. L., & Silverman, J. D. 2014, ApJS, 214, 15, doi: 10.1088/0067-0049/214/2/15
- Stach et al. (2021) Stach, S. M., Smail, I., Amvrosiadis, A., et al. 2021, MNRAS, 504, 172, doi: 10.1093/mnras/stab714
- Stalevski et al. (2016) Stalevski, M., Ricci, C., Ueda, Y., et al. 2016, MNRAS, 458, 2288, doi: 10.1093/mnras/stw444
- Tacconi et al. (2008) Tacconi, L. J., Genzel, R., Smail, I., et al. 2008, ApJ, 680, 246, doi: 10.1086/587168
- Tamura et al. (2014) Tamura, Y., Saito, T., Tsuru, T. G., et al. 2014, ApJ, 781, L39, doi: 10.1088/2041-8205/781/2/L39
- Tsukui et al. (2023) Tsukui, T., Wisnioski, E., Bland-Hawthorn, J., et al. 2023, arXiv e-prints, arXiv:2308.14798, doi: 10.48550/arXiv.2308.14798
- Virtanen et al. (2020) Virtanen, P., Gommers, R., Oliphant, T. E., et al. 2020, Nature Methods, 17, 261, doi: 10.1038/s41592-019-0686-2
- Wang et al. (2020) Wang, J., Athanassoula, E., Yu, S.-Y., et al. 2020, ApJ, 893, 19, doi: 10.3847/1538-4357/ab7fad
- Yu & Ho (2020) Yu, S.-Y., & Ho, L. C. 2020, ApJ, 900, 150, doi: 10.3847/1538-4357/abac5b
- Yu et al. (2022a) Yu, S.-Y., Xu, D., Ho, L. C., Wang, J., & Kao, W.-B. 2022a, A&A, 661, A98, doi: 10.1051/0004-6361/202142533
- Yu et al. (2022b) Yu, S.-Y., Kalinova, V., Colombo, D., et al. 2022b, A&A, 666, A175, doi: 10.1051/0004-6361/202244306