Uncovering the MIR emission of quiescent galaxies with JWST
We present a study of the mid-IR (MIR) emission of quiescent galaxies (QGs) beyond the local universe. Using deep imaging in the SMACS-0723 cluster field we identify a mass limited ( M⊙) sample of intermediate redshift QGs () and perform modeling of their rest-frame UV to MIR photometry. We find that QGs exhibit a range of MIR spectra that are composed of a stellar continuum and a dust component that is 1-2 orders of magnitude fainter to that of star-forming galaxies. The observed scatter in the MIR spectra, especially at m, can be attributed to different dust continuum levels and/or the presence of Polycyclic Aromatic Hydrocarbons (PAHs) features. The latter would indicate enhanced 11.3- and 12.7 m PAHs strengths with respect to those at 6.2- and 7.7m, consistent with the observed spectra of local ellipticals and indicative of soft radiation fields. Finally, we augment the average UV-to-MIR spectrum of the population with cold dust and gas emission in the far-IR/mm and construct a panchromatic UV-to-radio SED††thanks: Publicly available at http://www.georgiosmagdis.com/software that can serve as a template for the future exploration of the interstellar medium of QGs with ALMA and .
Key Words.:
galaxies: ISM – galaxies: Photometry – ISM: Dust1 Introduction
Over the past decades, a population of massive galaxies with suppressed star formation, i.e quiescent galaxies (QGs), has been robustly established both photometrically (Daddi et al., 2005; Toft et al., 2005; Kriek et al., 2006) and spectroscopically (Toft et al., 2012; Whitaker et al., 2013; D’Eugenio et al., 2020; Valentino et al., 2020) up to 4-5. The recent launch of the James Webb Space Telescope (JWST) has allowed to spectroscopically confirm QGs up to = 4.68 (Carnall et al., 2023) and provided the opportunity to search for possible 5 candidates (Valentino et al., 2023). QGs are characterized by low levels of star formation compared to their main sequence star-forming counterparts (Daddi et al., 2007; Schreiber et al., 2015) and red colours, as a consequence of their old and evolved stellar populations.
A large volume of studies characterizing QGs across cosmic time has focused on their stellar properties (e.g. Williams et al., 2009; Tomczak et al., 2014), using optical/near-infrared (NIR) data. In addition, their far-infrared (FIR) emission, tracing cold dust and gas, has been been explored in the local and, more recently, in the distant universe (e.g. Young et al., 2011; Magdis et al., 2021; Blánquez-Sesé et al., 2023), primarily with the Atacama Large Millimeter Array (ALMA).
However, their mid-infrared (MIR) regime has only been examined in the local universe (e.g. Bregman et al., 2006; Kaneda et al., 2008; Rampazzo et al., 2013), since the ”limited” sensitivity of MIR observations carried out until recently with e.g. the Spitzer Space Telescope, has predominantly restricted the study of MIR emission to star forming galaxies (SFGs) and Active Galactic Nuclei (AGNs). In fact, most studies focusing on QGs intentionally select against galaxies with a detection in the MIR (e.g. MIPS 24m), as the latter is commonly associated with emission of warm dust heated by ongoing star formation or AGN activity.
The situation has been radically transformed with JWST that can reach sensitivities to comfortably extend the study of the MIR spectra of QGs to higher redshifts through the detection of dust continuum emission and, if present, of Polycyclic Aromatic Hydrocarbons (PAHs) that can be used as a powerful tracer of star formation / AGN activity (e.g. Förster Schreiber et al., 2004; Pope et al., 2008; Kirkpatrick et al., 2015; Xie & Ho, 2019), of the ISM conditions (e.g. Galliano et al., 2008; Rigopoulou et al., 2021) and even of the molecular gas reservoir (Cortzen et al., 2019) of a galaxy.
In this work, we utilise deep imaging data obtained with the Near Infrared Camera (NIRCam; Rieke et al., 2005) and the Mid-Infrared Instrument (MIRI; Rieke et al., 2015; Bouchet et al., 2015) as part of the JWST Early Release Observations (Pontoppidan et al., 2022) towards the SMACSJ0723.3-7327 (SMACS-0723) cluster field. Using the same set of observations, Langeroodi & Hjorth (2023) presented a detailed study of the MIR colors of low- to intermediate-redshift galaxies and AGNs, and showed how PAH features enable distinguishing between SFGs, QGs, and AGNs in NIRCam and MIRI mid-infrared colour-colour diagrams. Here, we focus on a sample of intermediate redshift QGs to explore their MIR spectra - a feat that until recently was unattainable beyond the local universe - and highlight the feasibility of future observations towards this direction.
The layout of the paper is as follows: In Section 2 we describe the utilized data and the methodology we followed for the construction of a multi-band photometric catalogue in the JWST SMACS-0723 field. In Section 3 we present the sample selection of QGs and the derivation of their MIR properties through the modeling of their UV to MIR broadband photometry. In Section 4 we present the results, explore the possibility of the presence of PAHs in the spectra of intermediate redshift QGs, and construct a panchromatic UV-to-radio SED template for the population. Finally, in section 5 we provide a summary of our main findings. Throughout this work, we assume a standard CDM cosmology with = 0.3, = 0.7 and = 70 km s-1 Mpc-1, adopt the Chabrier initial mass function (IMF) (Chabrier, 2003) and the AB magnitude system (Oke, 1974).
2 Data
In this section we describe the data used for this work consisting of and observations of the SMACS-0723 cluster field, centered around a massive lensing cluster located at . All the data considered here are publicly available and were retrieved from the Mikulski Archive for Space Telescopes (MAST).
2.1 HST archival data
The data were obtained from the treasury programme Reionization Lensing Cluster Survey (RELICS; Coe et al., 2019). Observations were carried out in the F435W, F606W, F814W filters from the Advanced Camera for Surveys (ACS) and F105W, F125W, F140W, F160W filters from the Wide Field Camera 3 (WFC3), covering a wavelength range from 0.435m to 1.6m.
2.2 JWST data
SMACS-0723 is one of the first target fields observed by JWST in the Early Release Observations (ERO) program (ID 2736; Pontoppidan et al., 2022) after the telescope commissioning. The photometric observations consist of data from the Near Infrared Camera (NIRCam; Rieke et al., 2005), the Near Infrared Imager and Slitless Spectrograph (NIRISS; Doyon et al., 2012) and the Mid-Infrared Instrument (MIRI; Rieke et al., 2015; Bouchet et al., 2015). The observations covering the wavelength range from 0.918m were carried out with the F090W, F150W, F200W, F277W, F356W, F444W NIRCam filters; F115WN, F200WN NIRISS filters, and F770W, F1000W, F1500W, F1800W MIRI filters, with a total observing time of 6.2 hrs in the MIRI bands. The NIRCam pointings, consisting of two adjacent fields of view, cover an area of 2.2’ 2.2’ each. Embedded within that area the MIRI coverage is located, with an area of 112.5” 73.5”. Since the MIRI photometric filters are the essential component of this work, we only consider the data within the MIRI coverage for the rest of the analysis.
2.3 Catalogue construction
To reduce the NIRCam and MIRI data in the SMACS0723 field, we retrieved the level-2 products from MAST, and processed them with the grizli pipeline (Brammer, 2023). A similar data reduction methodology has been presented in e.g. Kokorev et al. (2023); Valentino et al. (2023) and will be fully described in Brammer et al. (in prep.). We ensure to give particular care to the photometric zero-points corrections relative to the jwst_1041.pmap. We additionally include corrections and masking to reduce the effects of stray light and cosmic rays. Our mosaics include the updated sky flats for all NIRCam filters. For MIRI data, we additionally construct our own flat fields, by utilising all available exposures in the field. Finally, we include all the available optical and near-infrared data in the Complete Hubble Archive for Galaxy Evolution (CHArGE; Kokorev et al. 2022). We align the images to Gaia DR3 (Gaia Collaboration et al., 2021), co-add, and finally drizzle them (Fruchter & Hook, 2002) to a 0.02” pixel scale for the Short Wavelength (SW) NIRCam bands, and to 0.04” for all the remaining JWST/NIRCam, MIRI, and filters.
We then construct the photometric catalogue using SourceXtractor++ (Bertin et al., 2020; Kümmel et al., 2020). SourceXtractor++ is a flexible model-fitting engine that does source detection and simultaneous model-fitting on a number of images of different photometric bands. We detect on a weighted mean of the long wavelength bands and fit Sérsic models to all sources in all and bands. The fitted models in each band are convolved with the corresponding PSF model. For the bands, PSF models are obtained with WebbPSF (Perrin et al., 2014). This model-fitting approach offers the advantage of consistently measuring photometry in images of largely different resolutions, especially when combining ACS, NIRCam and MIRI, ranging from 0.4 m to 18 m.
To determine the redshifts and the rest frame colours of the detected sources we use EaZY-py (Brammer et al., 2008). We first search for spectroscopic reshifts () by crossmatching our galaxies with the MUSE spectroscopic catalogue of Caminha et al. (2022), and assign to 31 out of 1725 galaxies. For the remaining sources we derive their photometric redshifts () by running EaZY-py with its default parameters, setting the redshift range to 0 ¡ ¡ 18 with a z. We utilize the ”” subset of models within EaZY-py, which make use of redshift dependent star formation histories and dust attenuation. To assess the quality of the derived photometric redshifts we repeat the EaZY-py run for the 31 sources that have , letting this time the redshift as a free parameter. We find an excellent agreement between the derived and the , without a systematic offset and a scatter of =0.02.
To derive the physical properties of the galaxies, and in particular their stellar mass (), we use FAST (Kriek et al., 2009). We adopt the estimates from EaZY-py and fit the available photometry for each source up to 4.4 m with the stellar population models of Bruzual & Charlot (2003), an exponentially declining star formation history, fixed solar metallicity and a Calzetti et al. (2000) dust attenuation law. The derived stellar masses are correlated with those obtained by EaZY-py with a median offset of 0.25 dex.
| [µm] | Filter | Deptha |
|---|---|---|
| 7.52 | MIRI/F770W | 26.9 |
| 9.87 | MIRI/F1000W | 27.3 |
| 14.92 | MIRI/F1500W | 26.8 |
| 17.87 | MIRI/F1800W | 26.2 |
aComputed from 2” circular apertures at 5.
In Table 1, we summarise the achieved 5 depths in the SMACS-0723 cluster field in the MIRI bands. In order to compute the mosaic sensitivities, we calculate the standard deviation of the measured flux densities in 3000 empty circular apertures that are randomly placed in the mosaic. Our analysis yields 5 magnitude depths of 26.9 and 26.2 at 7.7 m and 18 m respectively, 1-2 orders of magnitude deeper compared to some of the deepest pre- MIR surveys (e.g. 23.1 and 19.6 at 8 m and 24 m with Spitzer in the COSMOS field Weaver et al. 2022; Jin et al. 2018). This along with the additional MIRI bands that sample the 824m wavelength range provide a unique opportunity to explore the MIR emission of QGs beyond the local Universe.
3 Analysis
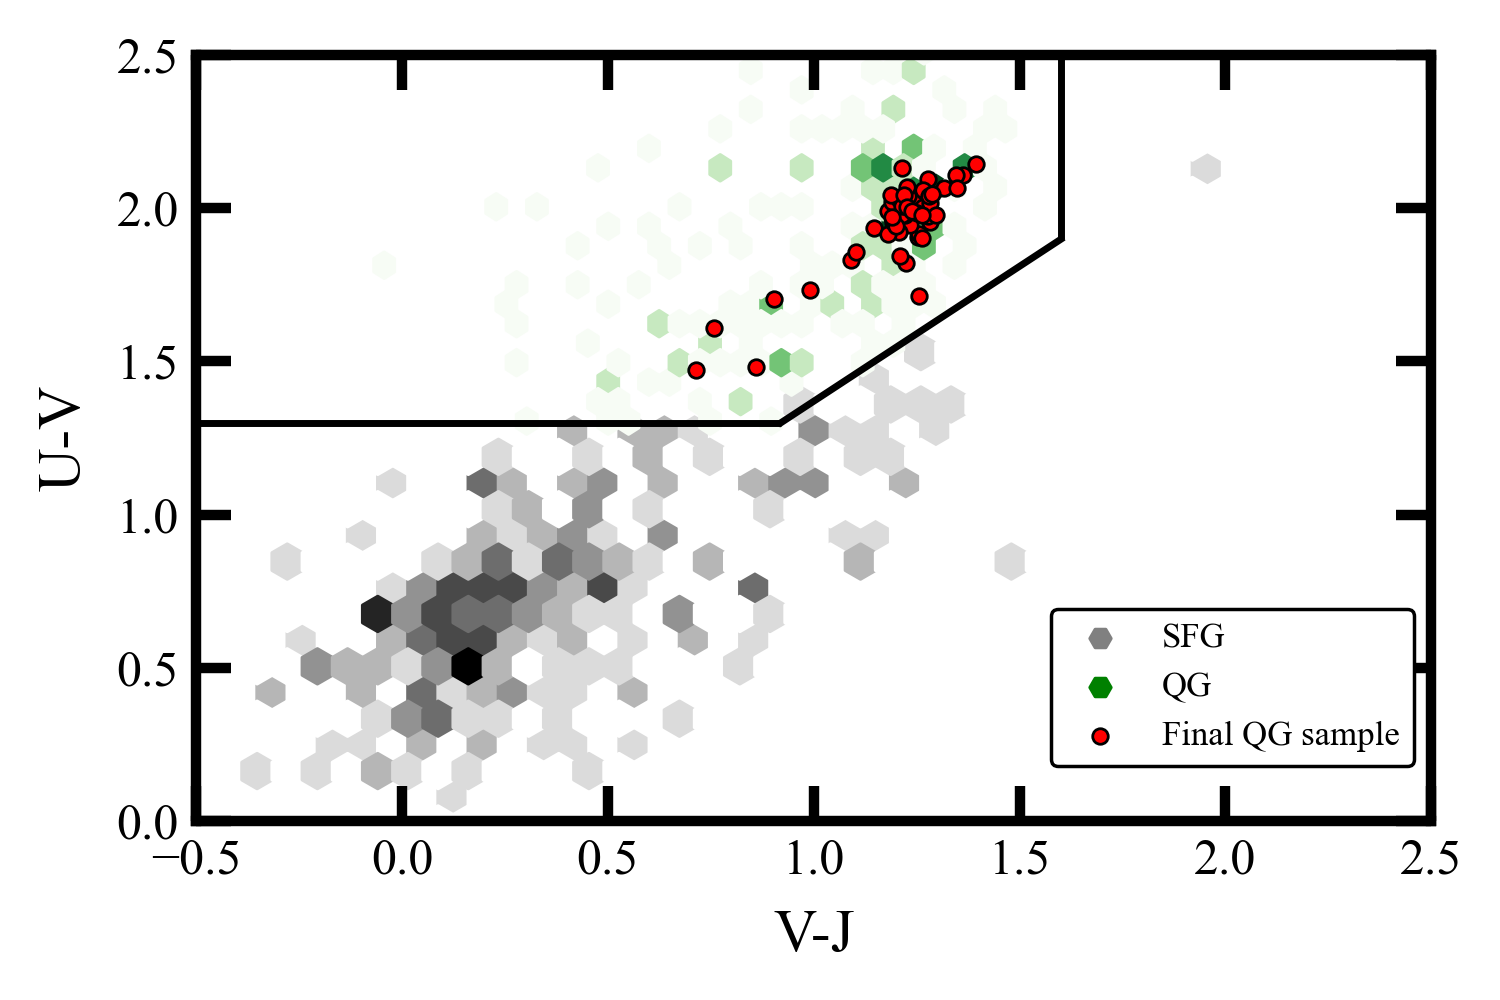
To select QGs from the parent sample we use the UVJ criterion (e.g. Williams et al., 2009) after inferring the rest-frame colour from the best fit EaZY-py SED models. For our purposes, we adopted the slightly modified colour selection introduced by Schreiber et al. (2015):
| (1) |
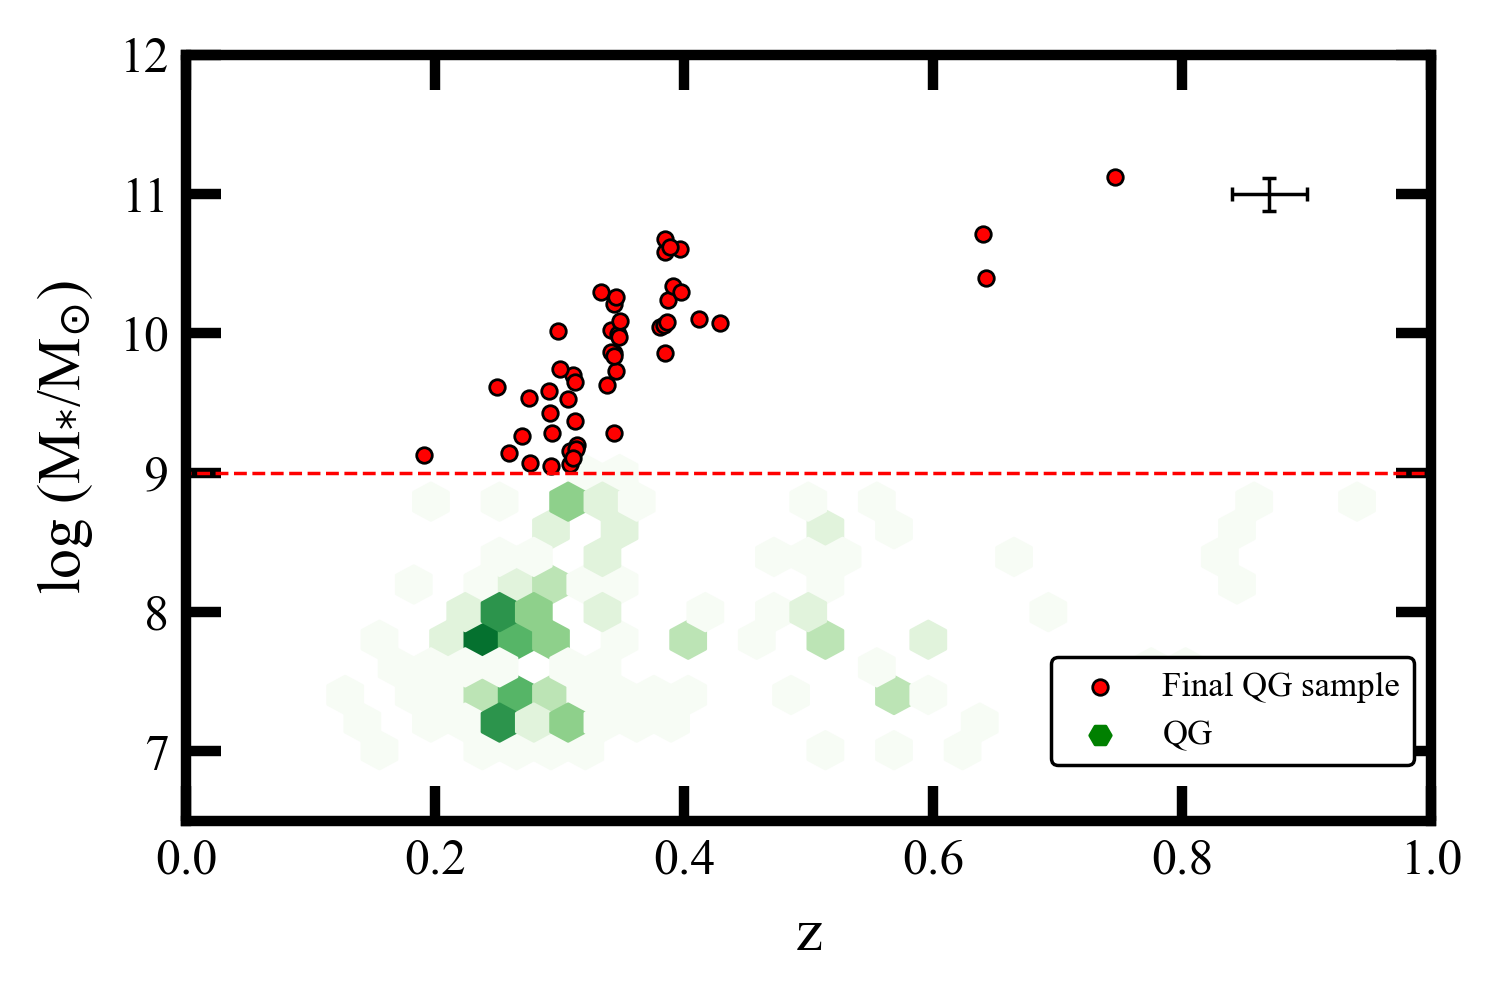
This selection results in a sample of 240 QGs (see Fig. 1) in the and log range (Figure 2). In an attempt to eliminate selection biases due to the different depths of available MIRI bands, we then introduce a stellar mass cut of ¿ 109 , above which of the QGs are detected in both the F770W and F1000W bands at 5 significance (with the detection rate dropping to 75% and 60% in F1500W and F1800W respectively). The mass selection along with a visual inspection of the cutouts to discard artifacts and sources with poorly constrained photometry, yields a sample of 63 candidate QGs. Finally to identify possible dusty star forming galaxies (DSFGs) that are misclassified as QGs we fit the full available photometry of each source (0.43 18m) with Stardust (Kokorev et al., 2021). This photometric fitting code can simultaneously and independently fit a stellar (Brammer et al., 2008), AGN (Mullaney et al., 2011) and dust component (Draine & Li, 2007; Draine et al., 2013) to the data in order to reproduce the observed SED of a galaxy and obtain its fundamental optical and IR properties (e.g , , ). We find that eight sources in our QGs sample have infrared luminosities () consistent with that of DSFGs ( ¿ 1012 ;Lonsdale et al. (2006); Casey et al. (2014)) and are subsequently removed from the sample. As shown in Figure 2 our final sample consists of 50 QGs with log of which 47 are at (; low- sample) and three are at (intermediate- sample). We note that a significant fraction of QGs in our sample with , i.e sources with , are likely to be cluster galaxies for which EaZY-py slightly underestimates their redshift. In fact, the majority of these sources have consistent to within 1-2 of the uncertainty (). Placing all low QGs at does not change the main results presented below.
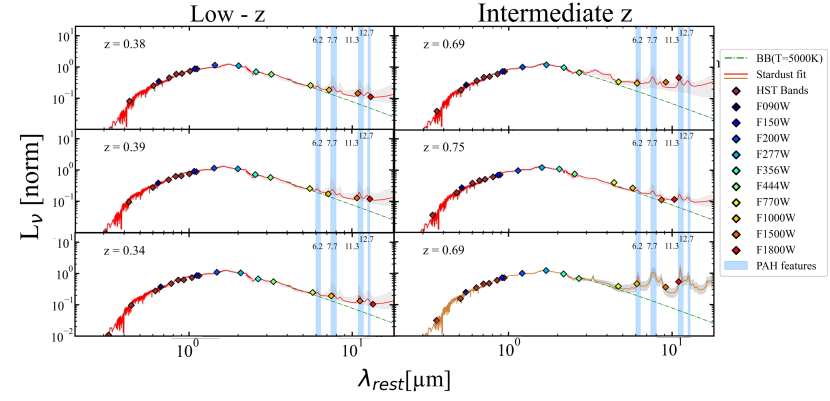
In order to model the MIR emission of the QGs in our final sample we re-run Stardust with some modifications. First, in addition to the Draine & Li (2007) dust models (DL07) utilized by Stardust, we also include the dust emission (continuum + PAHs) of the empirical template (P-QG) presented in Paspaliaris et al. (2023) that was constructed to reproduce the average IR emission of 229 local ellipticals. This step ensures that we will be able to capture any weak dust continuum and/or PAH emission that might be present in the spectrum of QGs and which cannot be recovered by the DL07 dust models. Finally, we approximate the emission of the stellar templates at m as a blackbody (BB) with a temperature = 5000 K. Examples of the derived best fit SEDs for low- and intermediate- QGs are presented in Figure 3.
4 Results & Discussion
The fitting methodology described above indicates that the rest-frame MIR emission of nine galaxies from our sample can be fully reproduced by stellar emission (BB, = 5000 K), without any contribution from a dust component. However, for the vast majority of the QGs (4150) a dust component on top of the stellar emission is necessary to reproduce the observed MIRI fluxes, revealing the presence of non negligible amounts of dust in the interstellar medium of low- and intermediate QGs with M⊙. We note that varying the adopted BB temperature for the stellar continuum within the range of 3000-7000 K does not affect our results.
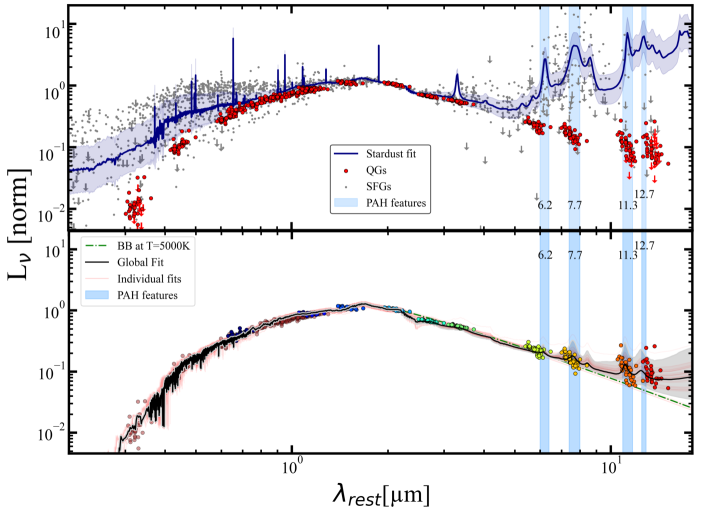
With the SED models of the QGs at hand, we can also compile the average rest-frame UV to mid-IR spectrum of the population in order to get a more global and informative picture of their rest-frame MIR emission and how it compares to that of SFGs and local ellipticals. In Figure 4 (top) we show the rest-frame SEDs of the QGs normalised to their rest frame K-band luminosity, as derived from the best fit Stardust stellar component. We also include the rest-frame SEDs of all SFGs in our catalogue along with the average best fit model derived by Stardust. As expected while there is a clear distinction in their UV-optical colour, there is also a mixture of the two populations in the UV-NIR part of the spectrum due to red DSFGs that mimic the colours of QGs. The dichotomy between the two population becomes more striking in the MIR ( m) with QGs being up to two orders of magnitude fainter than the SFGs, for fixed stellar mass (K-band luminosity). A notable feature in the photometry of each MIRI band is a trend of decreasing flux density with increasing rest-frame wavelength, or equally with decreasing redshift. To investigate the origin of this anti-correlation we mimic our observations by considering a grid of model SEDs within the redshift range of our sample. Each SED was then convolved with the corresponding MIRI transmission curves in order to measure the synthetic photometry in each band, at each redshift. Bringing the synthetic photometry to rest-frame and normalising at band (similar to the procedure applied to the real data), we recover a similar negative gradient in each MIRI band to that observed in the real data. We thus conclude, that the perceived trend is produced by a combination of the redshift range of the QGs in our sample along with the shape of the throughput of the MIRI filters.
Focusing on the QGs, in Figure 4 (bottom) we show the compilation of rest-frame SEDs of the low- QGs along with their individual fits and the best fit model to the running median of the cumulative data. While, on average, we can reproduce the MIR emission by a superposition of a stellar component and the P-QG template, it is clear that the scatter in the rest-frame MIR increases at longer wavelengths that correspond to the declining part of the stellar continuum emission. This indicates not only that dust is present in the ISM of low QGs but also that the dust emission can vary significantly between sources. The diversity of the MIR emission of QGs is also evident in the SEDs of the three intermediate- QGs presented in Figure 3; while the UV-NIR regime of their SED is nearly identical, their MIR emission exhibit a range of different dust continuum levels and spectral features. This also reflects the diversity found in the Spitzer/IRS spectra of the nuclei of local ellipticals, that span from comprising prominent PAH features (especially at 11.3- and 12.7m) to featureless continuum emission (Panuzzo et al., 2011; Rampazzo et al., 2013).
While the scatter in the MIR emission of low and intermediate QGs is likely to originate from different dust continuum levels, the fact that the most prominent PAHs features fall in, or close to the MIRI bands studied here, brings forward an alternative, and rather intriguing possibility. Namely, the scatter in the MIR emission of the QGs studied here could be driven by the presence and the variation of the intensity of PAHs in the MIR spectra of QGs. While PAHs in QGs beyond the local universe are not yet directly detected, here we might be getting a first glance. If indeed this is the case then our QGs seem to have stronger 11.3- and 12.7 m PAHs with respect to those at 6.2 and 7.7m. Interestingly, this would be consistent with the MIR spectra of local elliptical (Bregman et al., 2006; Kaneda et al., 2008; Rampazzo et al., 2013), and in direct contrast to that of SFGs which exhibit much more prominent 6.2- and 7.7m features (e.g. Joblin et al., 2000; Galliano et al., 2008). Moreover, a low 7.7/11.3 PAH ratio has been associated to a predominance of neutral to ionized PAH molecules in the ISM (Bregman et al., 2006; Tielens, 2008). The latter can also be enhanced by a soft radiation field which provides less energetic photons to excite the shorter wavelength features, as well as to diminish the UV field strength and increase the ratio of neutral to ionized PAHs (Bregman et al., 2006; Rigopoulou et al., 2021; Draine et al., 2021). To obtain a rough quantitative estimate of the 7.7/11.3 ratio for our QGs we divide the median flux of the data points located at the selected wavelengths, yielding a ratio of 7.7/11.3 = 0.61 (depending on the adopted underlying continuum level). This value corresponds to an ionization parameter of = 950 75 cm3 (Galliano et al., 2008), fully consistent with a very soft radiation field, characteristic of the evolved stellar populations found in QGs (Renzini, 1998; Daddi et al., 2000). It is also worth mentioning that other mid-IR lines could also contribute to the broadband MIRI photometry. For example, a fraction of the F1500W flux density could be attributed to the [NeII] 12.8m, which is largely blended with the 12.7m PAH feature. However, based on high spectral resolution observations of local ellipticals, the intensity of the 12.7m feature is larger relative to that of the [NeII] 12.8m emission line (Panuzzo et al., 2011). Nevertheless, we stress that the presence, and subsequently the strength of PAHs and of other atomic or molecular species can only be confirmed through follow-up MIR spectroscopy.
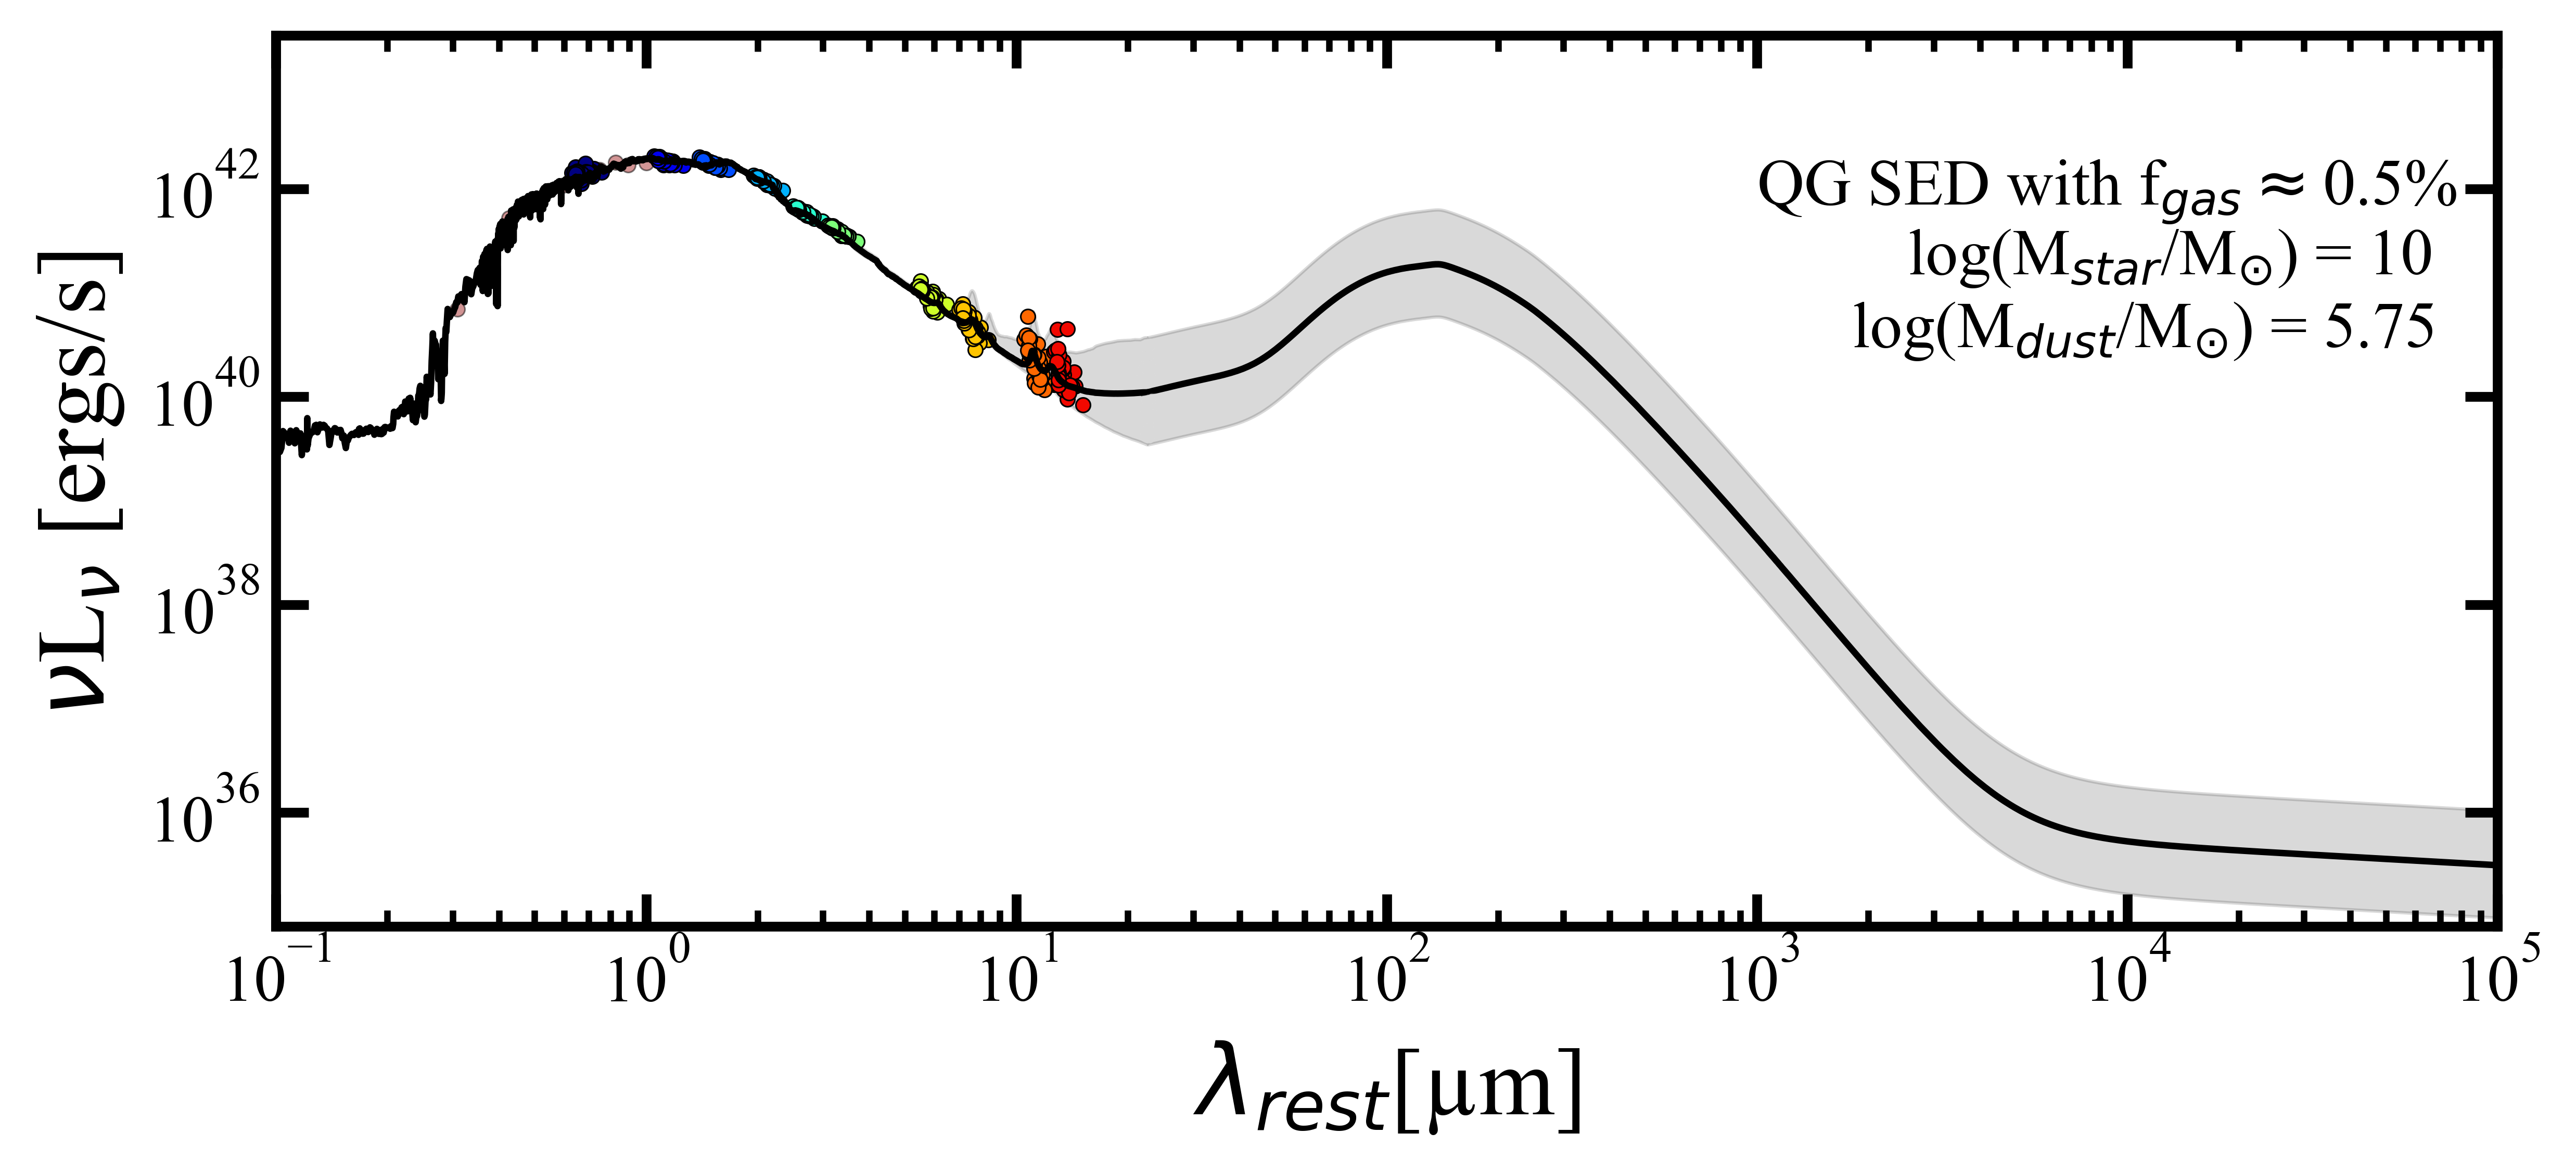
Finally, we attempt to bridge our work with recent FIR studies that have charecterised the cold dust emission and the ISM mass budget of distant QGs. In particular we bring together the average UV-to-MIR model SED of the QGs presented in Figure 4 (bottom), with the MIR-to-radio SED model introduced by Magdis et al. (2021), which is representative of the FIR emission of QGs. We first normalise the UV-to-MIR SED to log(M∗/) = 10 and then conjoin the two models at 20m by scaling the Magdis et al. (2021) template. This scaling corresponds to a dust mass of log(/) = 5.75 yielding a dust fraction of and a gas fraction of , assuming a dust to gas mass ratio of 100. These values are consistent with the sharp decline of QGs between and the present day that are reported in the literature (e.g. Gobat et al., 2018; Magdis et al., 2021; Blánquez-Sesé et al., 2023). Additionally, the QG model SED can be used to derive an independent estimate of the ionization parameter. To this end we first scale the SED model to the mean stellar mass of the QG sample, i.e. log(M∗/) = 10.5. We then employ the photodissociation region model described in Kaufman et al. (1999); Pound & Wolfire (2008) and convert the total infrared luminosity of the model (), to a UV radiation field ( = 12.5). Finally, assuming a range of gas temperatures ( K) and electron densities ( cm-3) appropriate for the value of the template, we infer an ionization parameter of 1-1300 cm3 that nicely brackets our estimate based on 7.7/11.3 PAH interband ratio. The panchromatic, UV-to-radio, template SED is presented in Figure 5 and is made publicly availablePublicly available at http://www.georgiosmagdis.com/software to facilitate future studies of QGs beyond the local universe.
5 Conclusions
In this work we presented an initial study of the MIR emission of QGs beyond the local universe, taking advantage of deep NIRCam and MIRI observations of SMACS-0723 cluster field. We report the detection of dust emission in the MIR spectra (µm) of QGs which is 1-2 order magnitudes fainter to that of SFGs. While for fixed stellar mass the rest-frame UV-to-NIR spectrum of the QGs appears to be rather homogeneous, the MIR emission of the population is characterised by a larger degree of diversification, especially at m. This scatter can be attributed to different dust continuum levels and/or the presence of PAHs in the spectra of QGs. The latter would indicate enhanced 11.3 and 12.7m PAH features compared to those at 6.2 and 7.7 m, consistent with the observed MIR spectra of local ellipticals and the soft radiation fields that are expected in the ISM of passive galaxies. Finally, we construct and make publicly available a panchromatic (UV-to-radio) SED that could serve as a template for future studies of distant QGs.
This study serves as a first step towards a better understanding of the MIR properties of QGs beyond the local universe and paves the way for follow-up spectroscopic observations that are necessary for the detailed characterisation of their ISM.
Acknowledgements.
GEM, SG and DBS acknowledge financial support from the Villum Young Investigator grant 37440 and 13160 and the Cosmic Dawn Center (DAWN), funded by the Danish National Research Foundation under grant No. 140 PD. CGG acknowledges support from CNES. DR acknowledges support from STFC through grant ST/W000903/1. JH and DL were supported by a VILLUM FONDEN Investigator grant (project number 16599). SJ is supported by the European Union’s Horizon Europe research and innovation program under the Marie Skłodowska-Curie grant agreement No. 101060888.References
- Bertin et al. (2020) Bertin, E., Schefer, M., Apostolakos, N., et al. 2020, in Astronomical Data Analysis Software and Systems XXIX, ed. R. Pizzo, E. R. Deul, J. D. Mol, J. de Plaa, & H. Verkouter
- Blánquez-Sesé et al. (2023) Blánquez-Sesé, D., Gómez-Guijarro, C., Magdis, G. E., et al. 2023, arXiv e-prints, arXiv:2303.12110
- Bouchet et al. (2015) Bouchet, P., García-Marín, M., Lagage, P. O., et al. 2015, PASP, 127, 612
- Brammer (2023) Brammer, G. 2023, grizli, Zenodo
- Brammer et al. (2008) Brammer, G. B., van Dokkum, P. G., & Coppi, P. 2008, ApJ, 686, 1503
- Bregman et al. (2006) Bregman, J. D., Bregman, J. N., & Temi, P. 2006, arXiv e-prints, astro
- Bruzual & Charlot (2003) Bruzual, G. & Charlot, S. 2003, MNRAS, 344, 1000
- Calzetti et al. (2000) Calzetti, D., Armus, L., Bohlin, R. C., et al. 2000, ApJ, 533, 682
- Caminha et al. (2022) Caminha, G. B., Suyu, S. H., Mercurio, A., et al. 2022, A&A, 666, L9
- Carnall et al. (2023) Carnall, A. C., McLeod, D. J., McLure, R. J., et al. 2023, MNRAS, 520, 3974
- Casey et al. (2014) Casey, C. M., Narayanan, D., & Cooray, A. 2014, Phys. Rep, 541, 45
- Chabrier (2003) Chabrier, G. 2003, PASP, 115, 763
- Coe et al. (2019) Coe, D., Salmon, B., Bradač, M., et al. 2019, ApJ, 884, 85
- Cortzen et al. (2019) Cortzen, I., Garrett, J., Magdis, G., et al. 2019, MNRAS, 482, 1618
- Daddi et al. (2000) Daddi, E., Cimatti, A., & Renzini, A. 2000, A&A, 362, L45
- Daddi et al. (2007) Daddi, E., Dickinson, M., Morrison, G., et al. 2007, ApJ, 670, 156
- Daddi et al. (2005) Daddi, E., Renzini, A., Pirzkal, N., et al. 2005, ApJ, 626, 680
- D’Eugenio et al. (2020) D’Eugenio, C., Daddi, E., Gobat, R., et al. 2020, ApJ, 892, L2
- Doyon et al. (2012) Doyon, R., Hutchings, J. B., Beaulieu, M., et al. 2012, in Society of Photo-Optical Instrumentation Engineers (SPIE) Conference Series, Vol. 8442, Space Telescopes and Instrumentation 2012: Optical, Infrared, and Millimeter Wave, ed. M. C. Clampin, G. G. Fazio, H. A. MacEwen, & J. Oschmann, Jacobus M., 84422R
- Draine et al. (2013) Draine, B. T., Aniano, G., Krause, O., et al. 2013, The Astrophysical Journal, 780, 172
- Draine & Li (2007) Draine, B. T. & Li, A. 2007, ApJ, 657, 810
- Draine et al. (2021) Draine, B. T., Li, A., Hensley, B. S., et al. 2021, ApJ, 917, 3
- Förster Schreiber et al. (2004) Förster Schreiber, N. M., Roussel, H., Sauvage, M., & Charmandaris, V. 2004, A&A, 419, 501
- Fruchter & Hook (2002) Fruchter, A. S. & Hook, R. N. 2002, PASP, 114, 144
- Gaia Collaboration et al. (2021) Gaia Collaboration, Brown, A. G. A., Vallenari, A., et al. 2021, A&A, 649, A1
- Galliano et al. (2008) Galliano, F., Madden, S. C., Tielens, A. G. G. M., Peeters, E., & Jones, A. P. 2008, ApJ, 679, 310
- Gobat et al. (2018) Gobat, R., Daddi, E., Magdis, G., et al. 2018, Nature Astronomy, 2, 239
- Jin et al. (2018) Jin, S., Daddi, E., Liu, D., et al. 2018, ApJ, 864, 56
- Joblin et al. (2000) Joblin, C., Abergel, A., Bregman, J., et al. 2000, in ESA Special Publication, Vol. 456, ISO Beyond the Peaks: The 2nd ISO Workshop on Analytical Spectroscopy, ed. A. Salama, M. F. Kessler, K. Leech, & B. Schulz, 49
- Kaneda et al. (2008) Kaneda, H., Onaka, T., Sakon, I., et al. 2008, ApJ, 684, 270
- Kaufman et al. (1999) Kaufman, M. J., Wolfire, M. G., Hollenbach, D. J., & Luhman, M. L. 1999, ApJ, 527, 795
- Kirkpatrick et al. (2015) Kirkpatrick, A., Pope, A., Sajina, A., et al. 2015, ApJ, 814, 9
- Kokorev et al. (2022) Kokorev, V., Brammer, G., Fujimoto, S., et al. 2022, ApJS, 263, 38
- Kokorev et al. (2023) Kokorev, V., Jin, S., Magdis, G. E., et al. 2023, ApJ, 945, L25
- Kokorev et al. (2021) Kokorev, V. I., Magdis, G. E., Davidzon, I., et al. 2021, ApJ, 921, 40
- Kriek et al. (2006) Kriek, M., van Dokkum, P. G., Franx, M., et al. 2006, ApJ, 649, L71
- Kriek et al. (2009) Kriek, M., van Dokkum, P. G., Labbé, I., et al. 2009, ApJ, 700, 221
- Kümmel et al. (2020) Kümmel, M., Bertin, E., Schefer, M., et al. 2020, in Astronomical Society of the Pacific Conference Series, Vol. 527, Astronomical Data Analysis Software and Systems XXIX, ed. R. Pizzo, E. R. Deul, J. D. Mol, J. de Plaa, & H. Verkouter, 29
- Langeroodi & Hjorth (2023) Langeroodi, D. & Hjorth, J. 2023, ApJ, 946, L40
- Lonsdale et al. (2006) Lonsdale, C. J., Farrah, D., & Smith, H. E. 2006, in Astrophysics Update 2, ed. J. W. Mason, 285
- Magdis et al. (2021) Magdis, G. E., Gobat, R., Valentino, F., et al. 2021, A&A, 647, A33
- Mullaney et al. (2011) Mullaney, J. R., Alexander, D. M., Goulding, A. D., & Hickox, R. C. 2011, MNRAS, 414, 1082
- Oke (1974) Oke, J. B. 1974, ApJS, 27, 21
- Panuzzo et al. (2011) Panuzzo, P., Rampazzo, R., Bressan, A., et al. 2011, A&A, 528, A10
- Paspaliaris et al. (2023) Paspaliaris, E. D., Xilouris, E. M., Nersesian, A., et al. 2023, A&A, 669, A11
- Perrin et al. (2014) Perrin, M. D., Sivaramakrishnan, A., Lajoie, C.-P., et al. 2014, in Society of Photo-Optical Instrumentation Engineers (SPIE) Conference Series, Vol. 9143, Space Telescopes and Instrumentation 2014: Optical, Infrared, and Millimeter Wave, ed. J. Oschmann, Jacobus M., M. Clampin, G. G. Fazio, & H. A. MacEwen, 91433X
- Pontoppidan et al. (2022) Pontoppidan, K. M., Barrientes, J., Blome, C., et al. 2022, ApJ, 936, L14
- Pope et al. (2008) Pope, A., Bussmann, R. S., Dey, A., et al. 2008, ApJ, 689, 127
- Pound & Wolfire (2008) Pound, M. W. & Wolfire, M. G. 2008, in Astronomical Society of the Pacific Conference Series, Vol. 394, Astronomical Data Analysis Software and Systems XVII, ed. R. W. Argyle, P. S. Bunclark, & J. R. Lewis, 654
- Rampazzo et al. (2013) Rampazzo, R., Panuzzo, P., Vega, O., et al. 2013, MNRAS, 432, 374
- Renzini (1998) Renzini, A. 1998, arXiv e-prints, astro
- Rieke et al. (2015) Rieke, G. H., Wright, G. S., Böker, T., et al. 2015, PASP, 127, 584
- Rieke et al. (2005) Rieke, M. J., Kelly, D., & Horner, S. 2005, in Society of Photo-Optical Instrumentation Engineers (SPIE) Conference Series, Vol. 5904, Cryogenic Optical Systems and Instruments XI, ed. J. B. Heaney & L. G. Burriesci, 1–8
- Rigopoulou et al. (2021) Rigopoulou, D., Barale, M., Clary, D. C., et al. 2021, MNRAS, 504, 5287
- Schreiber et al. (2015) Schreiber, C., Pannella, M., Elbaz, D., et al. 2015, A&A, 575, A74
- Tielens (2008) Tielens, A. G. G. M. 2008, ARA&A, 46, 289
- Toft et al. (2012) Toft, S., Gallazzi, A., Zirm, A., et al. 2012, ApJ, 754, 3
- Toft et al. (2005) Toft, S., van Dokkum, P., Franx, M., et al. 2005, ApJ, 624, L9
- Tomczak et al. (2014) Tomczak, A. R., Quadri, R. F., Tran, K.-V. H., et al. 2014, ApJ, 783, 85
- Valentino et al. (2023) Valentino, F., Brammer, G., Gould, K. M. L., et al. 2023, arXiv e-prints, arXiv:2302.10936
- Valentino et al. (2020) Valentino, F., Tanaka, M., Davidzon, I., et al. 2020, ApJ, 889, 93
- Weaver et al. (2022) Weaver, J. R., Kauffmann, O. B., Ilbert, O., et al. 2022, ApJS, 258, 11
- Whitaker et al. (2013) Whitaker, K. E., van Dokkum, P. G., Brammer, G., et al. 2013, ApJ, 770, L39
- Williams et al. (2009) Williams, R. J., Quadri, R. F., Franx, M., van Dokkum, P., & Labbé, I. 2009, ApJ, 691, 1879
- Xie & Ho (2019) Xie, Y. & Ho, L. C. 2019, ApJ, 884, 136
- Young et al. (2011) Young, L. M., Bureau, M., Davis, T. A., et al. 2011, MNRAS, 414, 940