Revisiting Mobility Modeling with Graph: A Graph Transformer Model for Next Point-of-Interest Recommendation
Abstract.
Next Point-of-Interest (POI) recommendation plays a crucial role in urban mobility applications. Recently, POI recommendation models based on Graph Neural Networks (GNN) have been extensively studied and achieved, however, the effective incorporation of both spatial and temporal information into such GNN-based models remains challenging. Temporal information is extracted from users’ trajectories, while spatial information is obtained from POIs. Extracting distinct fine-grained features unique to each piece of information is difficult since temporal information often includes spatial information, as users tend to visit nearby POIs. To address the challenge, we propose Mobility Graph Transformer (MobGT) that enables us to fully leverage graphs to capture both the spatial and temporal features in users’ mobility patterns. MobGT combines individual spatial and temporal graph encoders to capture unique features and global user-location relations. Additionally, it incorporates a mobility encoder based on Graph Transformer to extract higher-order information between POIs. To address the long-tailed problem in spatial-temporal data, MobGT introduces a novel loss function, Tail Loss. Experimental results demonstrate that MobGT outperforms state-of-the-art models on various datasets and metrics, achieving 24% improvement on average. Our codes are available at https://github.com/Yukayo/MobGT.
1. Introduction
With the proliferation of location-based social networks and mobile applications, a large amount of check-in information with spatial-temporal labels has been generated. Moreover, with the widespread use of location-based services in vehicles, such as GPS systems and ride-sharing applications, people also leverage these spatial-temporal data for mobility applications. Point-of-interest (POI) recommendation is a hot downstream task based on the spatial-temporal data that has been garnering more attention (Zhao et al., 2020a; Han et al., 2021; Rao et al., 2022).
Traditional POI recommendation studies have primarily focused on extracting local information from individual users’ trajectories (Wu et al., 2019; Liu et al., 2022; Wu et al., 2020; Feng et al., 2018; Sun et al., 2020; Jiang et al., 2022; Chen et al., 2020). However, recent studies have demonstrated significant performance improvements by also extracting global information from user-location relationships (Yang et al., 2019; Rao et al., 2022; Lim et al., 2020; Xue et al., 2021). The former approaches are only based on sequential models, such as recurrent neural networks (RNNs) and Transformer, that treat users’ trajectories simply as sequences. The latter approaches are based on the integration of sequential models and graph models. In addition to the capturing of local information via sequential models, such graph-based approaches also extract the global relations between users and locations through all the historical trajectories utilizing graph neural networks (GNNs). In this paper, we focus on the graph-based approach. Although the previous graph-based models have achieved significant results in the next POI recommendation, they still suffer from limitations that may result in poor recommendation performance.
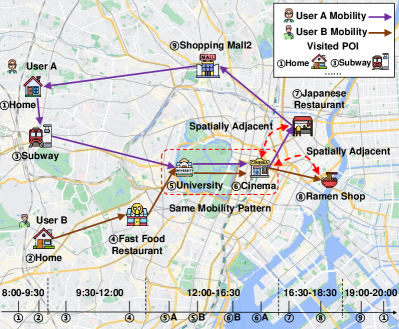
Firstly and most significantly, existing works on graph-based spatial-temporal modeling lack effective integration of both spatial and temporal information from a global view (Li et al., 2022; Jiang et al., 2021). The recent state-of-the-art models consider incorporating both spatial-temporal features using Knowledge Graph (Rao et al., 2022). But, they argue that temporal relations have already implicitly captured users’ spatial visiting property and implemented their model without the spatial modeling part since people tend to visit places close to themselves. However, the user’s subsequent location is influenced not only by temporal context but also by spatial context. For example, in Fig. 1, the cinema and two distinct types of restaurants are spatially adjacent, indicating that we can recommend the Japanese restaurant visited by user A to user B after watching a movie by utilizing spatially adjacent. It’s challenging for the existing graph-based model to capture such spatial adjacency with only temporal information.
Secondly, capturing more intricate and nuanced user behaviors from individual (local) mobility remains challenging. In the previous graph-based POI recommendation models (Rao et al., 2022; Yang et al., 2022), local trajectories are encoded through sequential models even though the global information is encoded by GNNs. However, such sequential modeling is limited in handling high-order spatial relationships, for instance, returning to the starting point after visiting multiple locations or repeating similar mobility patterns under different times and contexts. In Fig. 1, user A departs from home, visits several distinct locations, and eventually returns home in the evening, forming a closed-loop trajectory. Simultaneously, both user A and user B move from the university to the cinema, exhibiting repeated mobility patterns. It is hard for the sequential model to capture such cyclic mobility patterns and the same mobility pattern in the trajectory.
Finally, as data obtained from POI check-in services inherently involve long-tailed problems, that is, most locations are visited a few times, the development of effective training methods that can utilize low-frequent location data is as significant as the design of the model itself to achieve fine-grained prediction.
To address these three challenges, we propose a novel Mobility Graph Transformer (MobGT) model. Our key contributions are summarized as follows:
-
•
We propose global mobility GNN modules from three perspectives: spatial, temporal, and POI categories, to model the user’s POI transform pattern cooperatively.
-
•
We propose a graph-based Transformer model to model the local mobility graph of each user, which can utilize explicit contextual information to enrich the representation results and use a specialized encoding module to capture high-order dependency relationships in the graph.
-
•
We propose a novel loss function, Tail Loss, to address the long-tailed problem in locational data.
-
•
We conduct extensive experiments on two publicly available real-world check-in datasets and a private vehicle GPS trajectory dataset. Our experimental results demonstrate that our proposed MobGT outperforms the existing state-of-the-art models, achieving an average improvement of 24%.
2. Related Work
2.1. Next POI Recommendation
In contrast to the conventional POI recommendation approach, which bears resemblance to product or news recommendation, the task of the next POI recommendation involves analyzing and identifying the most probable POI that a user will visit next, based on their recent or historical mobility pattern (Yao et al., 2017). Early work more focused on non-deep learning-based recommendation approaches such as Markov Chain (MC) (Cheng et al., 2013; Ye et al., 2013; Gambs et al., 2012; Liu et al., 2013), Collaborative Filtering (CF) (Ye et al., 2010; Gao et al., 2018), and Matrix Factorization (MF) (Liu et al., 2014; Lian et al., 2014; Liu et al., 2013; Lian et al., 2018). For example, (Liu et al., 2013) extended the POI recommendation that combines both CF and MF. Firstly, it utilized CF to learn the current user’s POI transition pattern by studying the POI transition patterns of other similar users. Then, it clustered similar users and employed MF to predict the user’s interested POIs. Similarly, Zhang et al. (Zhang and Chow, 2016) extended the application of additive Markov chain (Zhang and Chow, 2015) by using categorical, geographic, and other contextual information. Meanwhile, some studies have also explored the use of Markov chains or Bayesian methods to provide personalized next POI recommendations (Feng et al., 2015; Chang et al., 2018; He et al., 2016). However, these methods also have obvious deficiencies, they are unable to effectively learn overall trends of movement within sequences. For example, Markov chains mainly rely on local information in the sequence but do not learn enough about the overall trend.
Deep learning models, particularly those based on RNN and LSTM, have been widely adopted to address the next POI recommendation problem (Lian et al., 2020; Liu et al., 2016; Yang et al., 2020; Zhao et al., 2020b). The early representative work was that Liu et al. proposed the Spatial-Temporal Recurrent Neural Networks (ST-RNN) (Liu et al., 2016), which extends the traditional RNN by incorporating the transformation matrix of temporal and spatial features. In 2020, Yang et al. proposed the Flashback (Yang et al., 2020) model, which focuses primarily on sparse user information and effectively captures historical trajectory information through modifications to the return value of the RNN hidden state. Due to the limited ability of RNNs to capture users’ long-term interests, many researchers have proposed POI recommendation methods based on LSTM. In HST-LSTM (Kong and Wu, 2018), the authors utilized a layered structure to capture the periodicity of the mobility to achieve POI recommendation with LSTM structure. Feng et al. proposed the DeepMove (Feng et al., 2018) architecture, which employs two distinct LSTM architectures and attention mechanisms to capture users’ long-term and short-term interests, respectively. LSTPM (Sun et al., 2020) improved upon the design of DeepMove (Feng et al., 2018) by incorporating a Geo-dilated LSTM module into the short-term interest module, to learn the geographical distribution of POIs in short-term interests. STAN (Luo et al., 2021) showed the significance of non-adjacent POIs for recommendation results, using two self-attention layers to learn the correlation of adjacent and non-adjacent POIs. However, these works all employ sequential models to address the next POI recommendation problem, neglecting to learn movement patterns and POI distributions from a global perspective.
2.2. Graph-based POI Recommendation
Recently, researchers have proposed various graph-based POI recommendation models, including GTAG (Xie et al., 2016), STP-UDGAT (Lim et al., 2020), SGRec (Li et al., 2021), and GETNext (Yang et al., 2022). GTAG (Xie et al., 2016) innovatively introduced the trajectory session into the graph, forming many connected edges through user-session-multiple check-in POIs, resulting in a large graph. However, the introduction of session nodes may lead to some GNN methods being unable to handle such large-scale graphs. STP-UDGAT (Lim et al., 2020) proposed to establish a global graph between various POIs from the view of spatial and temporal to introduce more contextual information. However, all global graphs are undirected graphs, and the edge weight is almost constant, which loses the order relationship between POI-POI and blurs the accurate time and space information. SGRec (Li et al., 2021) used Graph Attention Networks (GAT) to capture the similarity between trajectories from the perspective of collaborative signals (Wang et al., 2019) to improve the representation of POIs but ignores the spatial-temporal information of POIs. GETNext (Yang et al., 2022) aggregated all check-in POIs from the perspective of time pair to form a global graph and used GNN to generate corresponding POI embeddings for downstream POI recommendation. However, for each user’s trajectory, GETNext still uses the Transformer (Vaswani et al., 2017) architecture to predict the next POI, which cannot model the explicit correlations between POIs within each trajectory, such as the spatial distance and visit frequency between POIs.
In contrast, our proposed model first constructs a unified global graph using three different global perspectives, which can contain POI geospatial information, POI temporal transition patterns, and category transition frequencies among POIs. Besides, for each user’s mobility data, we convert it into a local mobility graph and use a graph-based Transformer to learn high-order relationships between POIs. To the best of our knowledge, our model is the first next POI recommendation model to multi-view encode POI information based on the global graph and individual mobility subgraphs.
3. Preliminary
In this section, we present the key definitions relevant to our task. Let be a set of users and be a set of check-in locations (POIs). Each location is represented as a tuple , including the visit frequency, category, latitude, and longitude. Furthermore, let represent the check-in times of each user at each POI. We now define several key concepts in our work:
Definition 3.1 (Check-in).
A check-in behavior is represented as a tuple , meaning that a user visited and checked-in location at timestamp .
Definition 3.2 (User Check-in Trajectory).
Given a user , the user check-in trajectory is a series of check-in points, i.e. .
Definition 3.3 (Trajectory).
We define a trajectory as a sequence = , , …, of ordered by time, with a timestamp .
Definition 3.4 (Next POI Recommendation).
Our objective is to generate a list of the POIs that a user is most likely to visit next. More specific, given all users’ historical mobility trajectories and a short-term trajectory of any user , where , we need to output the top- POIs that the user is most likely to visit next in a timestamp .
4. Methodology
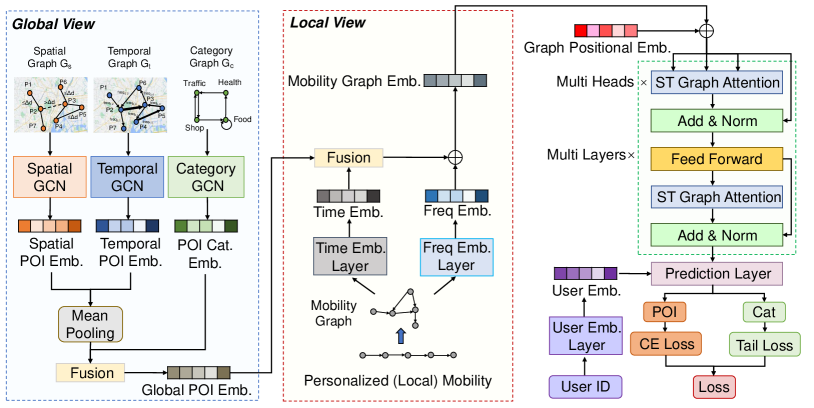
In Fig. 2, we present the overall architecture of Mobility Graph Transformer (MobGT), which integrates diverse contextual perspectives. Initially, we define three global graphs from distinct viewpoints, capturing the geographic and transition information between POIs and POI categories to model the mobility patterns of all users. Subsequently, we leverage more precise mobility contextual information to learn user, time, and POI frequency embeddings. Finally, we input POI embeddings generated from the global and the local graph, as well as user, category embeddings, and other contextual information into our proposed Spatial-Temporal (ST) graph attention model with individual mobility graphs to learn the mobility characteristics of each user.
4.1. POI Embedding via Global Graph
In this section, we propose three types of global graphs, from spatial, temporal, and categorical perspectives, to learn POI embeddings.
Global Spatial Graph. We build an undirected POI-POI graph where the set of nodes (POIs) is represented by and each undirected edge between POIs is represented by . If two POIs are adjacent geographically, that is, the Haversine distance between the two POIs is below a threshold, i.e., 2.5 km, we add an edge between them in . It should be noted that since the Earth is a three-dimensional sphere rather than a two-dimensional plane, we use the Haversine distance rather than the Euclidean distance to calculate the distance between two POIs.
Global Temporal Graph. Then we propose a directed POI-POI graph with nodes set and directed edges , where edge weight indicates the frequency of a POI pair in all trajectories.
Global Category Graph. Finally, we propose a global POI category graph which is a directed Cat.-Cat. graph, represented by , where is the set of categories that each POI belongs to. We connect each directed category pair based on all users’ trajectories. The edge weight between each pair is the frequency of category pair occurrences.
To obtain POI embeddings, we employ GCN to learn the relevant contextual features from the three global graphs. For the spatial and temporal POI embeddings , we first feed them into a pooling layer to obtain the aggregated POI embedding . We then fuse the POI and category embeddings using the following approach:
| (1) |
where denotes the concatenation and is the Leaky ReLu activation function.
4.2. Mobility Embedding via Local Graph
The global graph of learning POI and category embeddings aggregates information from all users and lacks the learning of users’ preferences. Next, we propose our local graph to enrich the semantic information of POIs by fusing different contextual embeddings.
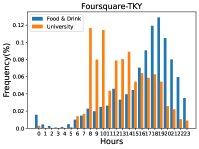
For the POI recommendation task, user check-in behavior has a strong dependence on time (Yuan et al., 2013; He et al., 2019; Wang et al., 2021). As shown in Fig. 4(b) for the Gowalla and Toyota datasets, users are more active during rush hours, so we need a time-aware model that can better explore users’ mobility patterns. For example, a white-collar worker’s mobility on workdays is almost always from 7-9 a.m. to the station and from 5-7 p.m. back from the station. In Fig. 4(c), in the Foursquare-TKY dataset, for two different POI categories ”Food & Drink” and ”University”, ”University” is visited more frequently during the day than ”Food & Drink”, so we need to consider how to make the model learn to capture the relationship between POI and time patterns, i.e., recommend ”University” as users’ destination rather than ”Food & Drink” at 9:00 AM. To capture the relationship between POIs and time patterns, we discretize check-in times into 48 intervals per day and utilize an embedding layer to generate low-dimensional vector representations for each time interval . Specifically, the time embedding can be denoted as:
| (2) |
Next, we utilize the same approach as the fusion of POI and POI category to aggregate the information for POI embedding and time embedding and get an aggregation POI embedding .
From Fig. 4(b), we observe that the frequency of POI visits varies significantly across different time periods, Also, several studies (Yang et al., 2022; Lim et al., 2020; Li et al., 2019) have highlighted the importance of frequency for POI recommendation, so it is important to consider using this frequency information to enrich the semantic representation of POIs. Therefore, we use an embedding layer to train a POI frequency embedding , which can be represented as:
| (3) |
Finally, we fuse the POI embedding and POI frequency embedding by element-wise addition operation:
| (4) |
To predict the next POI to be visited, we convert each check-in mobility into a graph and feed it into our proposed spatial-temporal (ST) graph attention module. Inspired by (Ishiguro et al., 2019), we add a center node to aggregate the information of the entire graph. The center node is connected to all nodes in the graph in an undirected manner, enabling multi-hop propagation of information. This allows the center node to capture the information of all nodes and serve as a relay node. As the sequence model is propagated hop-by-hop when passing information, the center node can facilitate multi-hop propagation of information among all nodes.
4.3. Spatial-Temporal Graph Attention
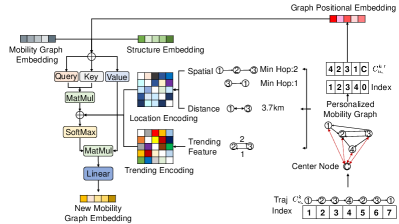
In this section, we introduce our proposed Spatial-Temporal (ST) graph attention module illustrated in Fig. 3 for predicting the user’s next POI based on the embedded mobility graph.
4.3.1. Structure Encoding
After converting mobility sequences into graphs, we can utilize the degree of nodes to enhance the model’s capacity to capture the structure information of the entire graph. For example, when a POI is frequently visited in a subgraph of mobility, it is likely to be the user’s workplace or home address. However, if the model only depends on attention mechanisms to calculate their potential connections is far less effective than directly inputting graph structure information into the model. Inspired by (Ying et al., 2021), we propose to define three new structural encodings to enrich the semantic information of POIs in the mobility graph through explicit graph structure input:
| (5) |
where are all learnable embeddings. Here, and refer to the embeddings of node in-degree and out-degree, respectively, and is the embedding of the node’s position. Meanwhile, when we convert a sequence to a graph if cycles occur due to the repetition of nodes, so we encode the position of each POI’s last appearance in the trajectory. For introducing the index position of nodes , we use a trainable position matrix to generate a positional embedding for each input node.
4.3.2. Location Encoding
The difference between POI recommendation and traditional recommendation tasks lies in its unique geographical information, which we have considered from a global perspective. Therefore, we also encode two types of location information for nodes in the mobility subgraph. Firstly, we calculate the shortest hop (sh, for human behavior) count between each POI. Subsequently, we use the Haversine function (Winarno et al., 2017) to compute the true distance between each POI. For traditional GNNs, the model typically focuses on its first-order neighbors, such as GAT (Veličković et al., 2017). However, by calculating the shortest hop count, we introduce high-order neighbor relationships between nodes into the model. Specifically, for any two nodes and , we define:
| (6) |
where is a learnable scalar indexed by , and is a learnable scalar trained by binning algorithm. Furthermore, Q and K are the corresponding trainable attention weight matrices. As the geographical distance between two nodes is a continuous floating-point number, it would be challenging to generate trainable embeddings directly, and the distance between two POIs is also randomly distributed. To make the number of POIs in each bin more evenly distributed when discretizing, we use the Freedman-Diaconis formula (Chuan et al., 2019) to calculate the number of bins, we denote the number of bins as follows:
| (7) |
where IQR is the interquartile range, and is the number of samples.
4.3.3. Trending Encoding
For a given sequence , we transform it into a graph structure and obtain node set . For POI pairs such as that occur multiple times, we should incorporate these high-frequency POI pairs as input information in our encoding component. Furthermore, previous studies did not effectively capture feature information beyond single-hop nodes. To address this issue, we propose a graph-based Trending Encoding method. Specifically, for any node pair , similar to Location Encoding, we can find the shortest hop to aggregate all higher-order relationships. Along this shortest hop, we aggregate all edge features as our Trending Encoding, which can be expressed as follows:
| (8) |
where is a trainable matrix. Additionally, to introduce Trending Encoding into the two encoding methods mentioned above without disrupting the original data flow, we treat it as the bias term in the attention module. Thus, our ST Graph Attention can be denoted as:
| (9) |
Finally, we use the encoder structure of the Transformer to input the node embeddings that have passed through the ST Graph Attention module into several feed-forward layers (FFL) for normalization.
4.4. Prediction and Optimization
In this section, we describe how to utilize user information, which can improve the effect of personalized recommendations, and introduce the design of the prediction layer and optimization methods.
4.4.1. User Embedding and Prediction Layer
The training layer learns the user’s transition patterns from the first-order and higher-order features embedded in the input mobility subgraphs. However, to further incorporate user information into the model explicitly and provide more personalized POI recommendation services, we introduce user embedding by a trainable matrix . We also denote the mobility embedding output by the training layer as . We use the same fusion method in a global graph to concatenate the user embedding and the mobility embedding to form a representation . To predict the user’s next visited location, we adopt two different multilayer perceptron models (MLP) as prediction layers to predict the next POI and POI category, respectively.
| (10) | ||||
where and are the weighted matrices of the MLP, and and are their corresponding bias terms. refers to using the center node we mentioned as the training target, which contains all semantic information (POI, POI category, visited frequency, etc.) of the user’s next possible visited POI.
4.4.2. Optimization
We employ cross-entropy as the main loss function for POI prediction. However, as the number of POI categories is significantly smaller than the number of POIs (i.e., the long-tail problem), the model may face challenges in learning the features of certain POIs with limited data, resulting in model performance degradation. To alleviate this, inspired by (Chen et al., 2022), we introduce an extra task of predicting the POI category and propose a Tail Loss as follows:
| (11) |
where is the model’s predicted output for sample , is the true class label for sample , is the number of samples, means the sigmoid activation function, and are hyperparameters used to control the weight of the positive and negative losses, respectively, and is an exponent used to control the sensitivity to the tail of the probability distribution. The final loss can be denoted as:
| (12) |
where is a balancing factor for the two losses. In our study, , , , and are set to 0.2, 1, 1.2, and 10.
5. Experiments
5.1. Datasets
| Dataset | Gowalla-NV | Foursquare-TKY | Toyota-TKY |
|---|---|---|---|
| Duration | 2009.022010.10 | 2012.042013.02 | 2021.052022.04 |
| #Users | 1,080 | 2,261 | 995 |
| #POIs | 3,679 | 7,855 | 8,011 |
| #Categories | 253 | 291 | 49 |
| #Check-Ins | 87,828 | 363,163 | 539,755 |
| #Trajectories | 6,869 | 44,669 | 51,880 |
| #POIs / User | 35 | 38 | 106 |
Three datasets were utilized in our experiments to assess the performance of our approach. The first two datasets were collected from two public LBSN (Location-Based Social Network) platforms: Gowalla-Nevada (Liu et al., 2014) and Foursquare-TKY (Yang et al., 2014). Each record in these datasets includes the user ID, check-in POI, timestamp, latitude, longitude, and POI category. The third dataset was collected from the GPS systems of Toyota cars. The dataset records the vehicle data of the Tokyo metropolitan area mainly covering the Harumi, Kichijyoji, Kitasenjyu, Musasukosugi, and Tamapuraza areas. We selected the top 200 most active users from these five regions to form the entire dataset. In addition, the dataset does not include taxi users. Each record in the dataset contains the user ID, timestamp, latitude, and longitude information, with POI and POI category information obtained through data mapping based on the Toyota database. We list the main statistics in Table 1.
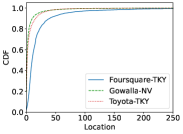
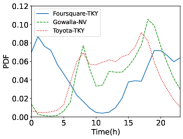
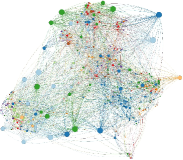
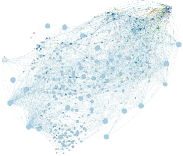
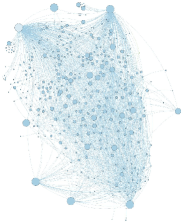
We partition the check-in records into multiple trajectories based on a 1-day time interval, ensuring that each trajectory contains a minimum of 3 check-in POIs. Subsequently, we split the data into training and test sets based on the chronological order of check-ins, with the first 80% of the trajectories comprising the training set, while the remaining 20% data make up the test set. The spatial-temporal characteristics of the datasets are depicted in Fig. 4. Specifically, Fig. 4(a) illustrates that the majority of POIs are visited fewer than 50 times. Fig. 4(b) depicts that the users of the Foursquare dataset exhibit heightened activity during nighttime, whereas the users of Gowalla and Toyota datasets exhibit peak activity during the morning hours between 7-9 and evening hours between 17-19, which aligns with typical human activity patterns. Fig. 5 depicts the distribution of the three datasets after visualization. We can observe that in the Toyota dataset, there is a noticeably higher number of hot visited points compared to the other two datasets. Here, ”hot visited points” refer to the frequency of node visits, with the size of the nodes in the graph representing the visitation frequency. On the other hand, this also reflects that the movement patterns of vehicles are more regular than those of humans, which is one of the reasons our model performs better on the Toyota dataset.
5.2. Experimental Setup
5.2.1. Baselines
We implement 8 baselines to evaluate our model.
-
•
MC (Gambs et al., 2012)is a conventional recommendation model that forecasts the subsequent item based on the probabilities derived from the Markov Chains.
-
•
LSTM (Hochreiter and Schmidhuber, 1997) is a variation of the RNN model designed to effectively model sequence through the simultaneous consideration of both long-term and short-term dependencies.
-
•
ST-RNN (Liu et al., 2016) extends the traditional RNN by incorporating the transformation matrix of temporal and spatial features.
-
•
DeepMove (Feng et al., 2018) captures sequential patterns by integrating multiple attention mechanisms to model both the long-term and short-term interests of users.
-
•
Flashback (Yang et al., 2020) is an RNN-based model that places a strong emphasis on modeling historical check-in data.
-
•
LSTPM (Sun et al., 2020) utilizes a geo-nonlocal LSTM architecture to model the evolving patterns of long-term interests and a geo-dilated LSTM to capture the geographic dependencies of short-term interests.
-
•
STAN (Luo et al., 2021) employs an attention mechanism to learn the spatial-temporal relationships between non-adjacent POIs in the check-in sequence.
-
•
GETNext (Yang et al., 2022) is a Transformer-based model that utilizes all user mobility patterns to represent POIs. GETNext is the state-of-the-art model for the next POI recommendation task.
5.2.2. Metrics
We employ top-k Accuracy@1,5,10 to evaluate the recommendation performance of our model. Top-k accuracy measures the probability of having the correct label within the top-k predicted samples. To better understand the position of the correct label within the top-k predicted samples, we adopt NDCG@5,10 (Normalized Discounted Cumulative Gain) as an evaluation metric, which can reflect both the position and score of the correct label within the top-k predicted samples. It should be noted that the value of NDCG@1 is equal to Acc@1, and we omit NDCG@1 in the results. In addition, we use MRR (Mean Reciprocal Rank) to measure the average position of the correct label among all predicted samples. The higher value indicates better model performance.
5.2.3. Settings
We employ AdamW as the optimizer, with the batch size being determined by the dataset size, and the learning rate is set to decay from 0.0002. If the training error remains unchanged for a certain period, the training algorithm will terminate early, or it will stop after 200 epochs. We evaluate the experiments on a GPU server, where the computing node is equipped with a 38-core Intel(R) Xeon(R) Platinum 8368 CPU @ 2.40GHz, 256GB RAM, and 1 NVIDIA A100 Tensor Core 40GB GPU. In our model, the hidden state size is set to 128, and the number of attention layers is set to 3.
5.3. Results and Analysis
Table 2 and Table 3 illustrate the results of our MobGT compared to other baseline models on the three datasets. Overall, our model performs better on the Foursquare-TKY and Toyota datasets than on the Gowalla-NV dataset. This can be attributed to the fact that the area of Nevada is significantly larger than that of Tokyo, which leads to more scattered and sparse user trajectories. As shown in Table 1, the Gowalla dataset contains approximately 88k check-in records and 3,679 POIs, which are distributed over an area of 286,380 square kilometers in Nevada. The Toyota dataset contains approximately 540k check-in records and 8,011 POIs, which are distributed over the entire Tokyo metropolitan area of 2,194.07 square kilometers. Due to the inherent sparsity of the datasets, the model’s performance on Gowalla is markedly lower than that on Foursquare-TKY and Toyota. Specifically, our model achieves an Acc@1 of 22.09% on the Foursquare-TKY dataset, while on Gowalla, it can only reach 16.90%.
Nonetheless, MobGT outperforms the best baseline models on all datasets. For instance, on the Toyota dataset, we achieve an Acc@1 accuracy of 26.34%, whereas the state-of-the-art model LSTPM only achieves 19.18%. Our model also improves the NDCG@5 by 25.81% compared to the best baseline model. Similar results are observed on other datasets. Furthermore, traditional Markov models are no longer able to learn complex transition states in trajectories, while sequence models such as LSTPM and STAN exhibit weaker overall recommendation performance than graph-based models such as GETNext. For example, on the Gowalla dataset, GETNext achieves an Acc@1 accuracy that is 53.23% higher than that of LSTPM.
| Gowalla-NV | Foursquare-TKY | Toyota-TKY | |||||||
|---|---|---|---|---|---|---|---|---|---|
| Acc@1 | Acc@5 | Acc@10 | Acc@1 | Acc@5 | Acc@10 | Acc@1 | Acc@5 | Acc@10 | |
| MC (Gambs et al., 2012) | 0.0225 | 0.0523 | 0.0668 | 0.0387 | 0.0769 | 0.0925 | 0.0190 | 0.0318 | 0.0365 |
| LSTM (Hochreiter and Schmidhuber, 1997) | 0.0591 | 0.1396 | 0.1841 | 0.0944 | 0.2199 | 0.2809 | 0.1305 | 0.2309 | 0.2925 |
| ST-RNN (Liu et al., 2016) | 0.1149 | 0.1277 | 0.1362 | 0.0245 | 0.0885 | 0.1131 | 0.0221 | 0.0443 | 0.0634 |
| DeepMove (Feng et al., 2018) | 0.0732 | 0.1710 | 0.2265 | 0.1601 | 0.3299 | 0.3996 | 0.1614 | 0.2970 | 0.3702 |
| Flashback (Yang et al., 2020) | 0.0703 | 0.1618 | 0.2136 | 0.1283 | 0.2867 | 0.3506 | 0.1853 | 0.3294 | 0.3934 |
| LSTPM (Sun et al., 2020) | 0.0883 | 0.1971 | 0.2617 | 0.1806 | 0.3844 | 0.4659 | 0.1918 | 0.3584 | 0.4409 |
| STAN (Luo et al., 2021) | 0.0746 | 0.2005 | 0.2508 | 0.1156 | 0.3063 | 0.4110 | 0.0800 | 0.2320 | 0.3200 |
| GETNext (Yang et al., 2022) | 0.1353 | 0.2516 | 0.2896 | 0.2017 | 0.4173 | 0.4940 | 0.1062 | 0.2093 | 0.2581 |
| MobGT (Ours) | 0.1690 | 0.2733 | 0.3112 | 0.2209 | 0.4298 | 0.4945 | 0.2634 | 0.4297 | 0.4999 |
| Gowalla-NV | Foursquare-TKY | Toyota-TKY | |||||||
|---|---|---|---|---|---|---|---|---|---|
| NDCG@5 | NDCG@10 | MRR | NDCG@5 | NDCG@10 | MRR | NDCG@5 | NDCG@10 | MRR | |
| MC (Gambs et al., 2012) | 0.0389 | 0.0437 | 0.0399 | 0.0602 | 0.0653 | 0.0316 | 0.0259 | 0.0274 | 0.0475 |
| LSTM (Hochreiter and Schmidhuber, 1997) | 0.1007 | 0.1151 | 0.1031 | 0.1598 | 0.1796 | 0.1567 | 0.1861 | 0.2040 | 0.1864 |
| ST-RNN (Liu et al., 2016) | 0.1206 | 0.1232 | 0.1226 | 0.0577 | 0.0655 | 0.0552 | 0.0340 | 0.0403 | 0.0370 |
| DeepMove (Feng et al., 2018) | 0.1240 | 0.1419 | 0.1255 | 0.2494 | 0.2721 | 0.2405 | 0.2319 | 0.2556 | 0.2311 |
| Flashback (Yang et al., 2020) | 0.1175 | 0.1343 | 0.1203 | 0.2116 | 0.2324 | 0.2033 | 0.2616 | 0.2822 | 0.2574 |
| LSTPM (Sun et al., 2020) | 0.1441 | 0.1648 | 0.1456 | 0.2877 | 0.3142 | 0.2758 | 0.2790 | 0.3056 | 0.2752 |
| STAN (Luo et al., 2021) | 0.1388 | 0.1549 | 0.1321 | 0.2116 | 0.2452 | 0.2039 | 0.1557 | 0.1838 | 0.1548 |
| GETNext (Yang et al., 2022) | 0.1967 | 0.2084 | 0.1908 | 0.3160 | 0.3408 | 0.3017 | 0.1600 | 0.1759 | 0.1586 |
| MobGT (Ours) | 0.2234 | 0.2356 | 0.2174 | 0.3344 | 0.3544 | 0.3165 | 0.3510 | 0.3737 | 0.3437 |
| Model/Metric | Acc@1 | Acc@5 | Acc@10 | NDCG@5 | NDCG@10 | MRR |
|---|---|---|---|---|---|---|
| MobGT (complete) | 0.1690 | 0.2733 | 0.3112 | 0.2234 | 0.2356 | 0.2174 |
| w/o Spatial Graph | 0.1675 | 0.2609 | 0.2980 | 0.2148 | 0.2251 | 0.2086 |
| w/o Temporal Graph | 0.1606 | 0.2583 | 0.2928 | 0.2090 | 0.2217 | 0.2054 |
| w/o Global Graph | 0.1580 | 0.2596 | 0.2975 | 0.2128 | 0.2250 | 0.2079 |
| w/o ST Graph Attention | 0.1590 | 0.2575 | 0.2986 | 0.2124 | 0.2256 | 0.2086 |
| w/o Context | 0.1116 | 0.1327 | 0.1627 | 0.1221 | 0.1315 | 0.1286 |
| w/o Tail Loss | 0.1588 | 0.2665 | 0.3017 | 0.2161 | 0.2275 | 0.2102 |
| w/o Category & Tail Loss | 0.1480 | 0.2396 | 0.2801 | 0.1978 | 0.2110 | 0.1956 |
5.4. Ablation Study
We conduct rigorous ablation experiments to demonstrate the impact of each component in our proposed model on the overall prediction performance of the Gowalla dataset. The results are presented in Table 4. Specifically, we perform 8 experiments: (1) the full MobGT, (2)without Spatial global graph, (3)without Temporal global graph, (4) without all global graphs (Spatial, Temporal, and Category), (5) without ST Graph Attention component, (6) without related contextual information including user, category, frequency and check-in time, only using POI embedding from the global view, (7) without proposed Tail Loss and utilizing cross-entropy loss as the category prediction loss, (8) without category decoder and utilizing Tail Loss as the POI prediction loss. The complete MobGT evidently achieved the best performance, while for the remaining components, the results indicate that the ST contextual component has the most significant influence on the overall model performance. For instance, when not utilizing the spatial-temporal context to enrich the POI embeddings, Acc@1 decreases by 33.96% compared to the complete model. Other components also contribute to the overall enhancement of the model, such as the global view module component, which leads to a 6.96% improvement in Acc@1.
5.5. Hyperparameter Study
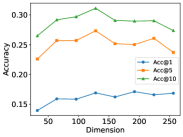
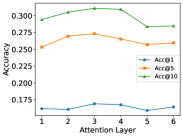
To validate the stability of our model, we conduct corresponding hyperparameter experiments. We set the dimension of the hidden layers in the model to an arithmetic sequence ranging from 32 to 256, successively testing the impact of different hidden layer dimensions on the model. As illustrated in Fig. 6(a), on the Gowalla dataset, when , although the performance in terms of Acc@1 is slightly lower than when , the remaining metrics are significantly higher than other settings. Overall, our model’s prediction performance is not sensitive to the hyperparameter. Excluding the settings, and , the variation rate for Acc@1 is less than 8%, and the variation rate for MRR is less than 5%, indicating a relatively insignificant impact. On the other hand, we also test the number of attention layers in the model. As shown in Fig. 6(b), we draw a similar conclusion: although the number of attention layers changes continuously, the variation rate for Acc@1 is less than 6%, and the variation rate for MRR is less than 7%. The model achieves the best performance when we set .
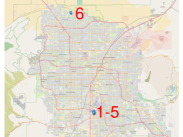
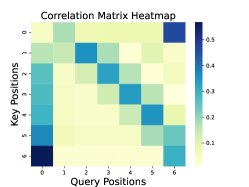
5.6. Case Study
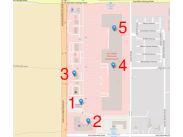
The MobGT model possesses good interpretability, such as predicting the next POI based on a given Traj sample containing POI 1-6. From Fig. 7(a), we can observe that the user frequently checks in at a place similar to a shopping mall, mainly for shopping or dining. However, based on Fig. 7(b), POI 6 is very far from POI 1-5, and it is highly likely that the user checked in some POIs in a shopping mall and then drove back home. We can also observe from Fig. 7(c) that Center Node 0 has the strongest association with POI 6, and POI 6 also has the strongest association with Center Node 0. Therefore, the final prediction result is likely to be POI 6 (according to the label, the next visited POI is still POI 6). For the case where the user checks in twice at the same location, we consider that this is due to data loss on the Gowalla platform or the user’s behavior of checking in again when leaving home.
6. Conclusion
This paper proposes a novel next POI recommendation model MobGT based on graph and spatial-temporal attention by exploring transition patterns of trajectories in all users and each individual user. Specifically, our model considers the mobility preferences of all users and the inherent location information between POIs as components of overall POI transition behavior. We use GNN to learn this POI preference, which is then used for each user’s unique mobility subgraph. The spatial-temporal context information of all POIs is encoded using proposed ST attention combined with the degree and structure information unique to graph structures. Finally, we also proposed Tail Loss to address the long tail problem inherent in these POI check-in datasets Extensive experiments on three real-world datasets demonstrate that our proposed model outperforms state-of-the-art models in all metrics. We also validate the stability of our model under different parameters and provide visualization results to demonstrate the interpretability of our model in predicting the next POI. For future work, we plan to build a module to specifically learn the features of long-tail data to further enhance the interpretability of our model in solving long-tail problems. Another possible direction is to improve the representation of user embedding, such as performing clustering operations based on user movement trajectories in advance, so that the model can more easily learn POI representation from similar user trajectories.
Acknowledgements.
This work was supported by JST SPRING (JPMJSP2108), JSPS KAKENHI Grant Numbers JP21K17749 and JP21K21280, and Initiative on Promotion of Supercomputing for Young or Women Researchers, Information Technology Center, The University of Tokyo.References
- (1)
- Chang et al. (2018) Buru Chang, Yonggyu Park, Donghyeon Park, Seongsoon Kim, and Jaewoo Kang. 2018. Content-aware hierarchical point-of-interest embedding model for successive poi recommendation.. In IJCAI, Vol. 2018. 27th.
- Chen et al. (2020) Quanjun Chen, Renhe Jiang, Chuang Yang, Zekun Cai, Zipei Fan, Kota Tsubouchi, Ryosuke Shibasaki, and Xuan Song. 2020. Dualsin: Dual sequential interaction network for human intentional mobility prediction. In Proceedings of the 28th International Conference on Advances in Geographic Information Systems. 283–292.
- Chen et al. (2022) Zhao Chen, Vincent Casser, Henrik Kretzschmar, and Dragomir Anguelov. 2022. GradTail: Learning Long-Tailed Data Using Gradient-based Sample Weighting. arXiv preprint arXiv:2201.05938 (2022).
- Cheng et al. (2013) Chen Cheng, Haiqin Yang, Michael R Lyu, and Irwin King. 2013. Where you like to go next: Successive point-of-interest recommendation. In Twenty-Third international joint conference on Artificial Intelligence.
- Chuan et al. (2019) Zun Liang Chuan, Wan Nur Syahidah Wan Yusoff, Mohd Khairul Bazli Mohd Aziz, Azlyna Senawi, and Tan Lit Ken. 2019. A comparison study between Doane’s and Freedman-Diaconis’ binning rule in characterizing potential water resources availability. In Journal of Physics: Conference Series, Vol. 1366. IOP Publishing, 012103.
- Feng et al. (2018) Jie Feng, Yong Li, Chao Zhang, Funing Sun, Fanchao Meng, Ang Guo, and Depeng Jin. 2018. Deepmove: Predicting human mobility with attentional recurrent networks. In Proceedings of the 2018 world wide web conference. 1459–1468.
- Feng et al. (2015) Shanshan Feng, Xutao Li, Yifeng Zeng, Gao Cong, Yeow Meng Chee, and Quan Yuan. 2015. Personalized ranking metric embedding for next new poi recommendation. In Twenty-Fourth International Joint Conference on Artificial Intelligence.
- Gambs et al. (2012) Sébastien Gambs, Marc-Olivier Killijian, and Miguel Núñez del Prado Cortez. 2012. Next place prediction using mobility markov chains. In Proceedings of the first workshop on measurement, privacy, and mobility. 1–6.
- Gao et al. (2018) Rong Gao, Jing Li, Xuefei Li, Chengfang Song, and Yifei Zhou. 2018. A personalized point-of-interest recommendation model via fusion of geo-social information. Neurocomputing 273 (2018), 159–170.
- Han et al. (2021) Peng Han, Shuo Shang, Aixin Sun, Peilin Zhao, Kai Zheng, and Xiangliang Zhang. 2021. Point-of-interest recommendation with global and local context. IEEE Transactions on Knowledge and Data Engineering (2021).
- He et al. (2016) Jing He, Xin Li, Lejian Liao, Dandan Song, and William Cheung. 2016. Inferring a personalized next point-of-interest recommendation model with latent behavior patterns. In Proceedings of the AAAI Conference on Artificial Intelligence, Vol. 30.
- He et al. (2019) Jing He, Xin Li, Lejian Liao, and Mingzhong Wang. 2019. Inferring continuous latent preference on transition intervals for next point-of-interest recommendation. In Machine Learning and Knowledge Discovery in Databases: European Conference, ECML PKDD 2018, Dublin, Ireland, September 10–14, 2018, Proceedings, Part II 18. Springer, 741–756.
- Hochreiter and Schmidhuber (1997) Sepp Hochreiter and Jürgen Schmidhuber. 1997. Long short-term memory. Neural computation 9, 8 (1997), 1735–1780.
- Ishiguro et al. (2019) Katsuhiko Ishiguro, Shin-ichi Maeda, and Masanori Koyama. 2019. Graph warp module: an auxiliary module for boosting the power of graph neural networks in molecular graph analysis. arXiv preprint arXiv:1902.01020 (2019).
- Jiang et al. (2022) Renhe Jiang, Quanjun Chen, Zekun Cai, Zipei Fan, Xuan Song, Kota Tsubouchi, and Ryosuke Shibasaki. 2022. Will you go where you search? A deep learning framework for estimating user search-and-go behavior. Neurocomputing 472 (2022), 338–348.
- Jiang et al. (2021) Renhe Jiang, Xuan Song, Zipei Fan, Tianqi Xia, Zhaonan Wang, Quanjun Chen, Zekun Cai, and Ryosuke Shibasaki. 2021. Transfer urban human mobility via poi embedding over multiple cities. ACM Transactions on Data Science 2, 1 (2021), 1–26.
- Kong and Wu (2018) Dejiang Kong and Fei Wu. 2018. HST-LSTM: A hierarchical spatial-temporal long-short term memory network for location prediction.. In IJCAI, Vol. 18. 2341–2347.
- Li et al. (2021) Yang Li, Tong Chen, Yadan Luo, Hongzhi Yin, and Zi Huang. 2021. Discovering collaborative signals for next POI recommendation with iterative Seq2Graph augmentation. arXiv preprint arXiv:2106.15814 (2021).
- Li et al. (2022) Yongkang Li, Zipei Fan, Du Yin, Renhe Jiang, Jinliang Deng, and Xuan Song. 2022. HMGCL: Heterogeneous multigraph contrastive learning for LBSN friend recommendation. World Wide Web (2022), 1–24.
- Li et al. (2019) Yang Li, Yadan Luo, Zheng Zhang, Shazia Sadiq, and Peng Cui. 2019. Context-aware attention-based data augmentation for POI recommendation. In 2019 IEEE 35th International Conference on Data Engineering Workshops (ICDEW). IEEE, 177–184.
- Lian et al. (2020) Defu Lian, Yongji Wu, Yong Ge, Xing Xie, and Enhong Chen. 2020. Geography-aware sequential location recommendation. In Proceedings of the 26th ACM SIGKDD international conference on knowledge discovery & data mining. 2009–2019.
- Lian et al. (2014) Defu Lian, Cong Zhao, Xing Xie, Guangzhong Sun, Enhong Chen, and Yong Rui. 2014. GeoMF: joint geographical modeling and matrix factorization for point-of-interest recommendation. In Proceedings of the 20th ACM SIGKDD international conference on Knowledge discovery and data mining. 831–840.
- Lian et al. (2018) Defu Lian, Kai Zheng, Yong Ge, Longbing Cao, Enhong Chen, and Xing Xie. 2018. GeoMF++ scalable location recommendation via joint geographical modeling and matrix factorization. ACM Transactions on Information Systems (TOIS) 36, 3 (2018), 1–29.
- Lim et al. (2020) Nicholas Lim, Bryan Hooi, See-Kiong Ng, Xueou Wang, Yong Liang Goh, Renrong Weng, and Jagannadan Varadarajan. 2020. STP-UDGAT: spatial-temporal-preference user dimensional graph attention network for next POI recommendation. In Proceedings of the 29th ACM International Conference on Information & Knowledge Management. 845–854.
- Liu et al. (2016) Qiang Liu, Shu Wu, Liang Wang, and Tieniu Tan. 2016. Predicting the next location: A recurrent model with spatial and temporal contexts. In Thirtieth AAAI conference on artificial intelligence.
- Liu et al. (2013) Xin Liu, Yong Liu, Karl Aberer, and Chunyan Miao. 2013. Personalized point-of-interest recommendation by mining users’ preference transition. In Proceedings of the 22nd ACM international conference on Information & Knowledge Management. 733–738.
- Liu et al. (2022) Xin Liu, Yongjian Yang, Yuanbo Xu, Funing Yang, Qiuyang Huang, and Hong Wang. 2022. Real-time POI recommendation via modeling long-and short-term user preferences. Neurocomputing 467 (2022), 454–464.
- Liu et al. (2014) Yong Liu, Wei Wei, Aixin Sun, and Chunyan Miao. 2014. Exploiting geographical neighborhood characteristics for location recommendation. In Proceedings of the 23rd ACM international conference on conference on information and knowledge management. 739–748.
- Luo et al. (2021) Yingtao Luo, Qiang Liu, and Zhaocheng Liu. 2021. Stan: Spatio-temporal attention network for next location recommendation. In Proceedings of the Web Conference 2021. 2177–2185.
- Rao et al. (2022) Xuan Rao, Lisi Chen, Yong Liu, Shuo Shang, Bin Yao, and Peng Han. 2022. Graph-flashback network for next location recommendation. In Proceedings of the 28th ACM SIGKDD Conference on Knowledge Discovery and Data Mining. 1463–1471.
- Sun et al. (2020) Ke Sun, Tieyun Qian, Tong Chen, Yile Liang, Quoc Viet Hung Nguyen, and Hongzhi Yin. 2020. Where to go next: Modeling long-and short-term user preferences for point-of-interest recommendation. In Proceedings of the AAAI Conference on Artificial Intelligence, Vol. 34. 214–221.
- Vaswani et al. (2017) Ashish Vaswani, Noam Shazeer, Niki Parmar, Jakob Uszkoreit, Llion Jones, Aidan N Gomez, Łukasz Kaiser, and Illia Polosukhin. 2017. Attention is all you need. Advances in neural information processing systems 30 (2017).
- Veličković et al. (2017) Petar Veličković, Guillem Cucurull, Arantxa Casanova, Adriana Romero, Pietro Lio, and Yoshua Bengio. 2017. Graph attention networks. arXiv preprint arXiv:1710.10903 (2017).
- Wang et al. (2019) Xiang Wang, Xiangnan He, Meng Wang, Fuli Feng, and Tat-Seng Chua. 2019. Neural graph collaborative filtering. In Proceedings of the 42nd international ACM SIGIR conference on Research and development in Information Retrieval. 165–174.
- Wang et al. (2021) Zhaonan Wang, Tianqi Xia, Renhe Jiang, Xin Liu, Kyoung-Sook Kim, Xuan Song, and Ryosuke Shibasaki. 2021. Forecasting ambulance demand with profiled human mobility via heterogeneous multi-graph neural networks. In 2021 IEEE 37th International Conference on Data Engineering (ICDE). IEEE, 1751–1762.
- Winarno et al. (2017) Edy Winarno, Wiwien Hadikurniawati, and Rendy Nusa Rosso. 2017. Location based service for presence system using haversine method. In 2017 international conference on innovative and creative information technology (ICITech). IEEE, 1–4.
- Wu et al. (2019) Yuxia Wu, Ke Li, Guoshuai Zhao, and Xueming Qian. 2019. Long-and short-term preference learning for next POI recommendation. In Proceedings of the 28th ACM international conference on information and knowledge management. 2301–2304.
- Wu et al. (2020) Yuxia Wu, Ke Li, Guoshuai Zhao, and Xueming Qian. 2020. Personalized long-and short-term preference learning for next POI recommendation. IEEE Transactions on Knowledge and Data Engineering 34, 4 (2020), 1944–1957.
- Xie et al. (2016) Min Xie, Hongzhi Yin, Hao Wang, Fanjiang Xu, Weitong Chen, and Sen Wang. 2016. Learning graph-based poi embedding for location-based recommendation. In Proceedings of the 25th ACM international on conference on information and knowledge management. 15–24.
- Xue et al. (2021) Hao Xue, Flora Salim, Yongli Ren, and Nuria Oliver. 2021. MobTCast: Leveraging auxiliary trajectory forecasting for human mobility prediction. Advances in Neural Information Processing Systems 34 (2021), 30380–30391.
- Yang et al. (2020) Dingqi Yang, Benjamin Fankhauser, Paolo Rosso, and Philippe Cudre-Mauroux. 2020. Location prediction over sparse user mobility traces using rnns. In IJCAI. 2184–2190.
- Yang et al. (2019) Dingqi Yang, Bingqing Qu, Jie Yang, and Philippe Cudre-Mauroux. 2019. Revisiting user mobility and social relationships in lbsns: a hypergraph embedding approach. In The world wide web conference. 2147–2157.
- Yang et al. (2014) Dingqi Yang, Daqing Zhang, Vincent W Zheng, and Zhiyong Yu. 2014. Modeling user activity preference by leveraging user spatial temporal characteristics in LBSNs. IEEE Transactions on Systems, Man, and Cybernetics: Systems 45, 1 (2014), 129–142.
- Yang et al. (2022) Song Yang, Jiamou Liu, and Kaiqi Zhao. 2022. GETNext: trajectory flow map enhanced transformer for next POI recommendation. In Proceedings of the 45th International ACM SIGIR Conference on research and development in information retrieval. 1144–1153.
- Yao et al. (2017) Di Yao, Chao Zhang, Jianhui Huang, and Jingping Bi. 2017. Serm: A recurrent model for next location prediction in semantic trajectories. In Proceedings of the 2017 ACM on Conference on Information and Knowledge Management. 2411–2414.
- Ye et al. (2013) Jihang Ye, Zhe Zhu, and Hong Cheng. 2013. What’s your next move: User activity prediction in location-based social networks. In Proceedings of the 2013 SIAM International Conference on Data Mining. SIAM, 171–179.
- Ye et al. (2010) Mao Ye, Peifeng Yin, and Wang-Chien Lee. 2010. Location recommendation for location-based social networks. In Proceedings of the 18th SIGSPATIAL international conference on advances in geographic information systems. 458–461.
- Ying et al. (2021) Chengxuan Ying, Tianle Cai, Shengjie Luo, Shuxin Zheng, Guolin Ke, Di He, Yanming Shen, and Tie-Yan Liu. 2021. Do transformers really perform badly for graph representation? Advances in Neural Information Processing Systems 34 (2021), 28877–28888.
- Yuan et al. (2013) Quan Yuan, Gao Cong, Zongyang Ma, Aixin Sun, and Nadia Magnenat Thalmann. 2013. Time-aware point-of-interest recommendation. In Proceedings of the 36th international ACM SIGIR conference on Research and development in information retrieval. 363–372.
- Zhang and Chow (2015) Jia-Dong Zhang and Chi-Yin Chow. 2015. Spatiotemporal sequential influence modeling for location recommendations: A gravity-based approach. ACM Transactions on Intelligent Systems and Technology (TIST) 7, 1 (2015), 1–25.
- Zhang and Chow (2016) Jia-Dong Zhang and Chi-Yin Chow. 2016. Point-of-interest recommendations in location-based social networks. Sigspatial Special 7, 3 (2016), 26–33.
- Zhao et al. (2020b) Kangzhi Zhao, Yong Zhang, Hongzhi Yin, Jin Wang, Kai Zheng, Xiaofang Zhou, and Chunxiao Xing. 2020b. Discovering Subsequence Patterns for Next POI Recommendation.. In IJCAI. 3216–3222.
- Zhao et al. (2020a) Pengpeng Zhao, Anjing Luo, Yanchi Liu, Fuzhen Zhuang, Jiajie Xu, Zhixu Li, Victor S Sheng, and Xiaofang Zhou. 2020a. Where to go next: A spatio-temporal gated network for next poi recommendation. IEEE Transactions on Knowledge and Data Engineering (2020).