InfraParis: A multi-modal and multi-task autonomous driving dataset
Abstract
Current deep neural networks (DNNs) for autonomous driving computer vision are typically trained on specific datasets that only involve a single type of data and urban scenes. Consequently, these models struggle to handle new objects, noise, nighttime conditions, and diverse scenarios, which is essential for safety-critical applications. Despite ongoing efforts to enhance the resilience of computer vision DNNs, progress has been sluggish, partly due to the absence of benchmarks featuring multiple modalities. We introduce a novel and versatile dataset named InfraParis that supports multiple tasks across three modalities: RGB, depth, and infrared. We assess various state-of-the-art baseline techniques, encompassing models for the tasks of semantic segmentation, object detection, and depth estimation. More visualizations and the download link for InfraParis are available at https://ensta-u2is.github.io/infraParis/.
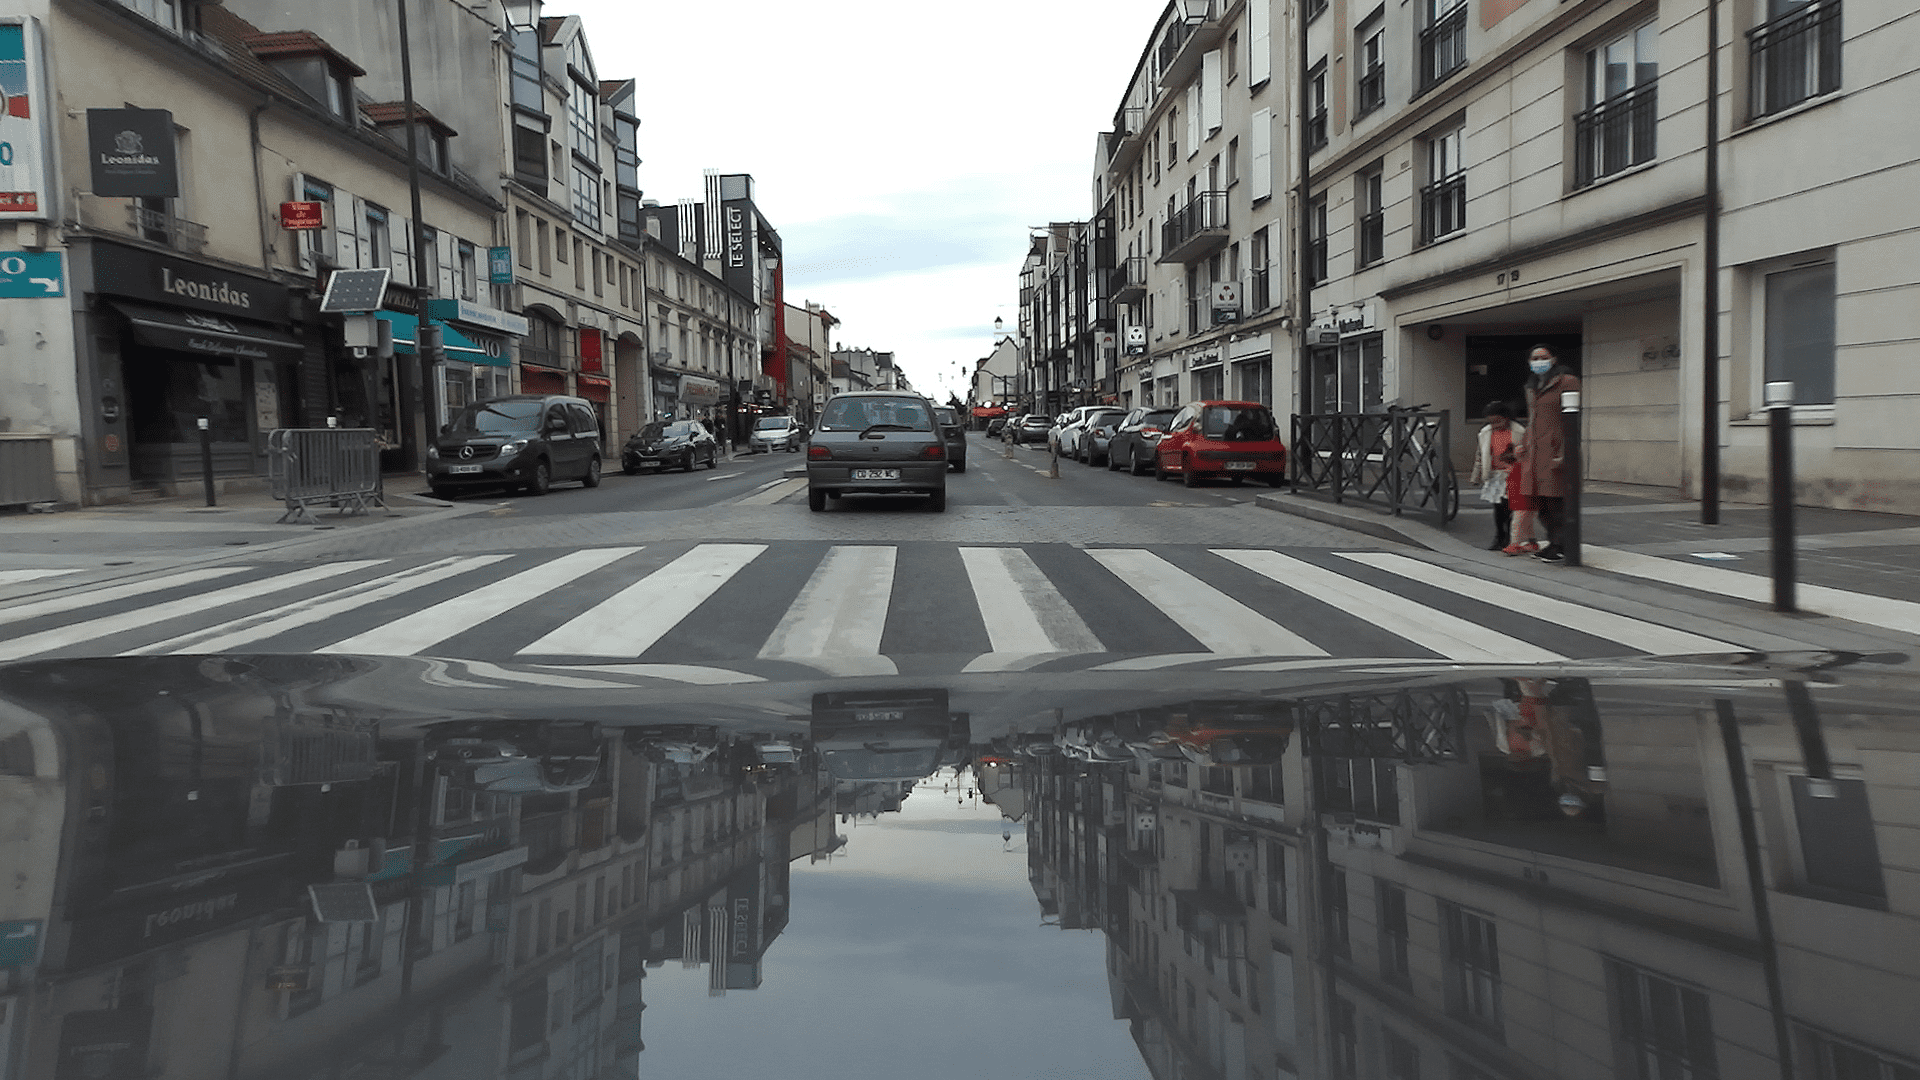
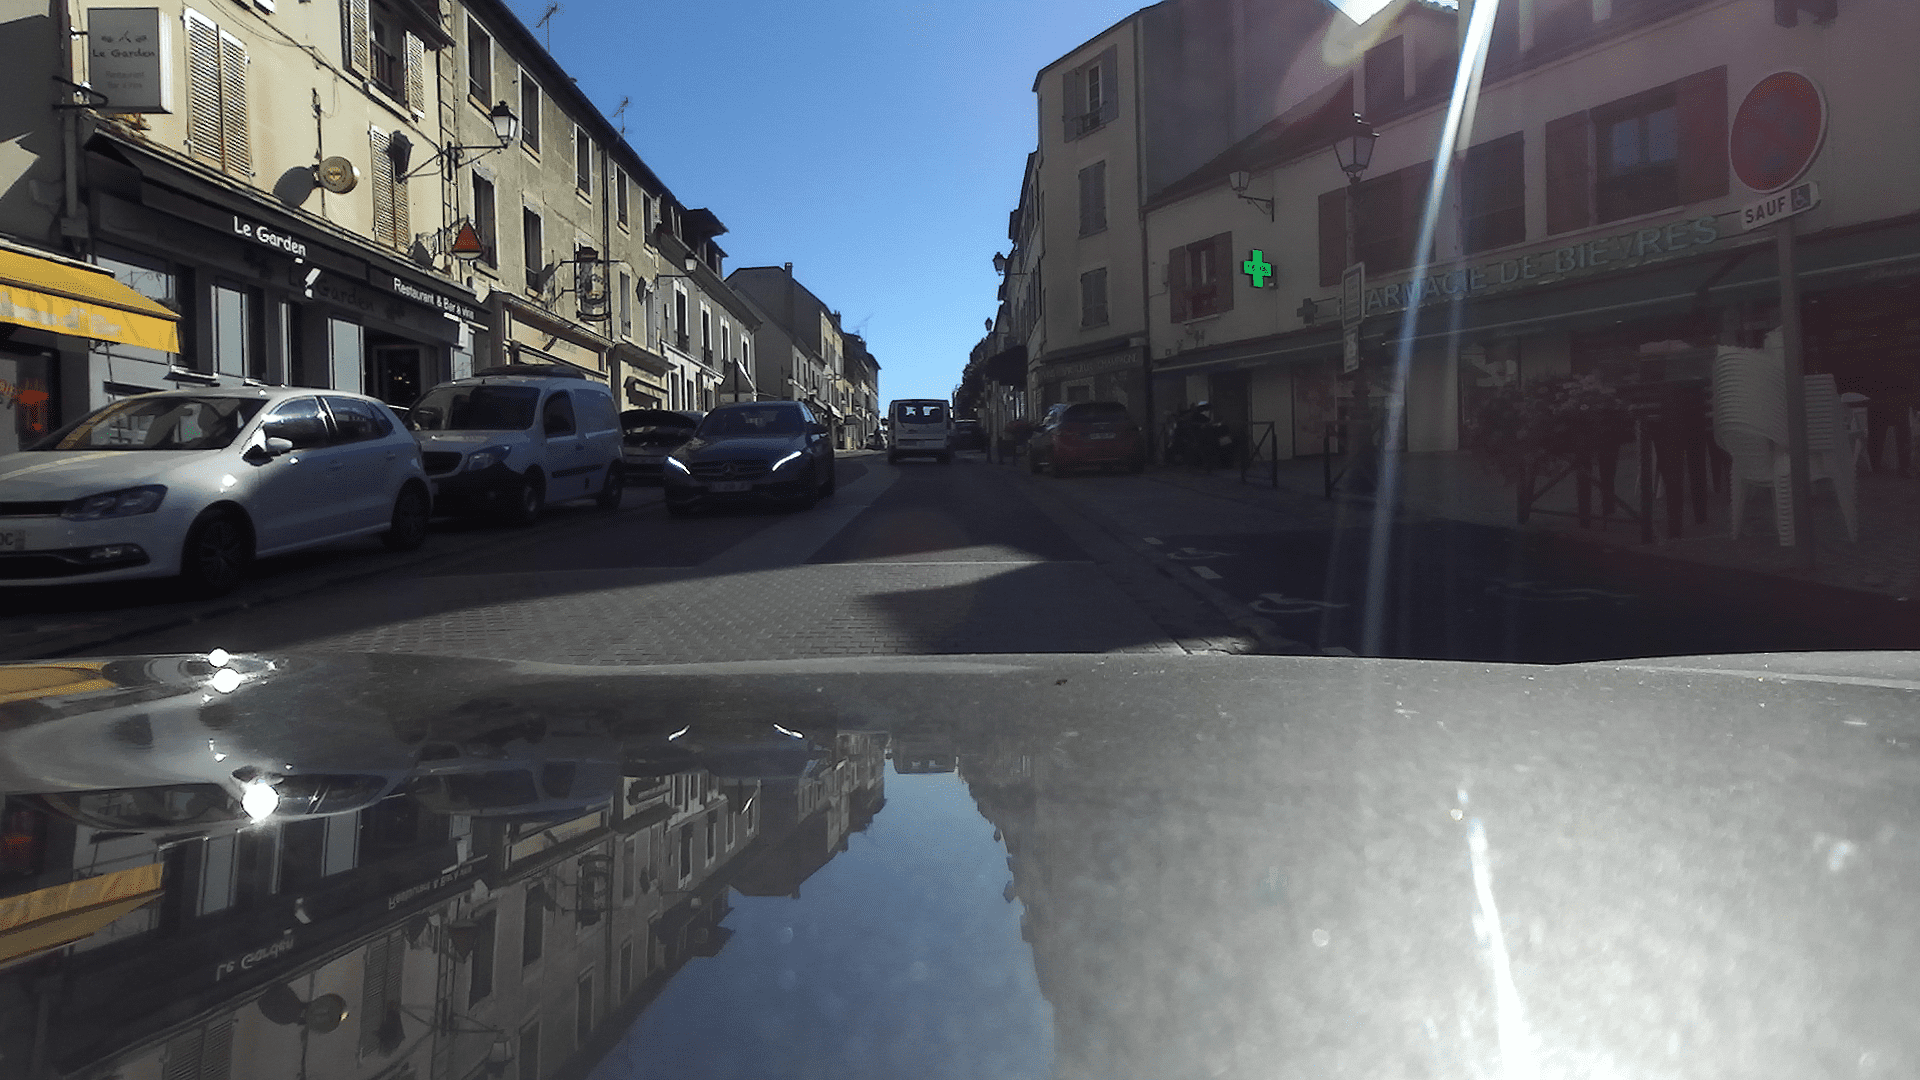
![[Uncaptioned image]](/html/2309.15751/assets/figures/Paris5_6_RGB_t_1621767801_6.png)
![[Uncaptioned image]](/html/2309.15751/assets/figures/Paris5_6_depth_t_1621767801_6_cropped_bar.png)
![[Uncaptioned image]](/html/2309.15751/assets/figures/Paris5_6_IR_t_1621767801_6_bar.png)
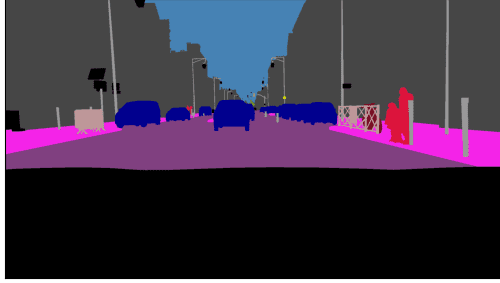
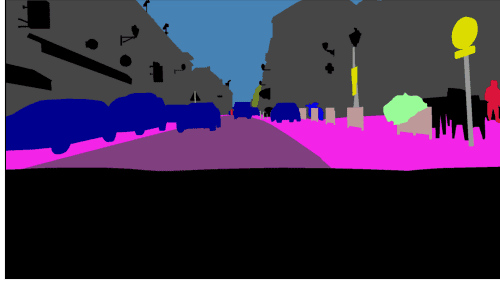
![[Uncaptioned image]](/html/2309.15751/assets/figures/Paris5_6__label_t_1621767801_6.png)
1 Introduction
In the realm of autonomous driving, the ability of vehicles to navigate effectively under varying lighting conditions, including both day and night, is of paramount importance. Achieving this requires the development of intelligent systems that possess robust visual perception capabilities. In recent years, the potential of utilizing Infrared (IR) datasets to enhance vision in challenging environments has garnered attention [14, 49, 26]. Despite this promise, the availability of comprehensive IR datasets remains limited compared to the abundance of RGB datasets [10, 18, 39, 40, 48]. While RGB datasets have proliferated, datasets containing IR imagery have not attained the same prevalence.
The benefit of IR images lies in their capacity to convey thermal information, which can provide invaluable insights for understanding and interpreting the environment. However, harnessing the potential of IR datasets is not without its challenges. The distinctive nature of information captured by IR cameras introduces complexities that make dataset handling and analysis a formidable task. These intricacies are exemplified through the existence of materials acting as pure mirror for the IR spectrum (e.g. water), thereby inducing the occurrence of false positives. Poor contrast and drastic changes in object appearance over time are other elements that hinder the popularity of IR modalities in urban scenes.
The emergence of foundation models [36, 3] capable of accommodating multimodal datasets and performing multiple tasks has marked a significant leap forward in the field. Models such as [45, 20] demonstrate the potential of integrating diverse data modalities to enhance overall performance. However, harnessing the benefits of these foundation models necessitates access to well-annotated multimodal datasets, a critical resource that remains scarce.
The importance of establishing a multimodal and and multitask dataset like the one we present, named InfraParis, becomes evident when considering challenges related to domain adaptation. The drastic dissimilarity between IR images and traditional RGB data makes the InfraParis database uniquely valuable for addressing domain adaptation scenarios. Additionally, the incorporation of multitask learning enables DNNs to attain more generalized representations. Thus, this dataset can serve as an instrumental bridge for testing and improving the robustness of models across disparate modalities and tasks. Furthermore, the inclusion of thermal data in InfraParis opens doors for enhanced object detection, tracking, depth estimation, and semantic segmentation, areas where traditional RGB data might fall short.
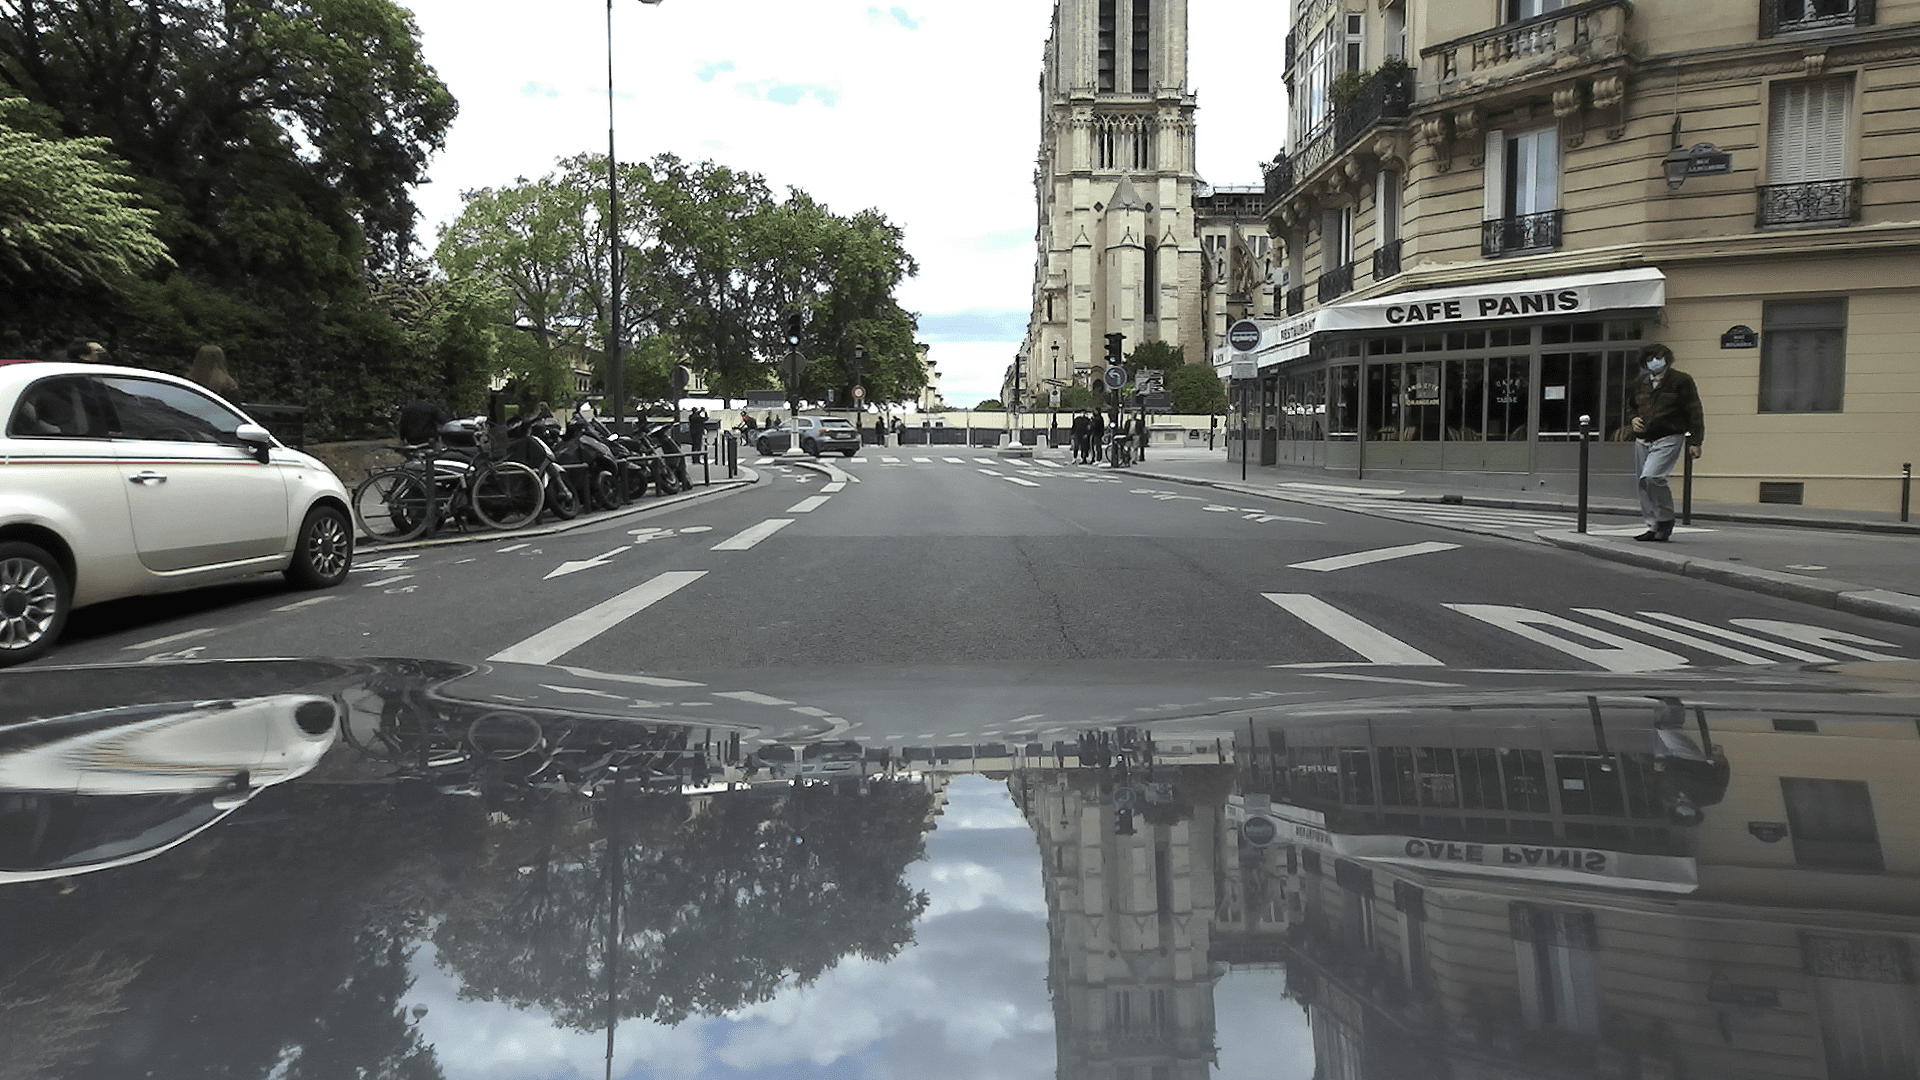
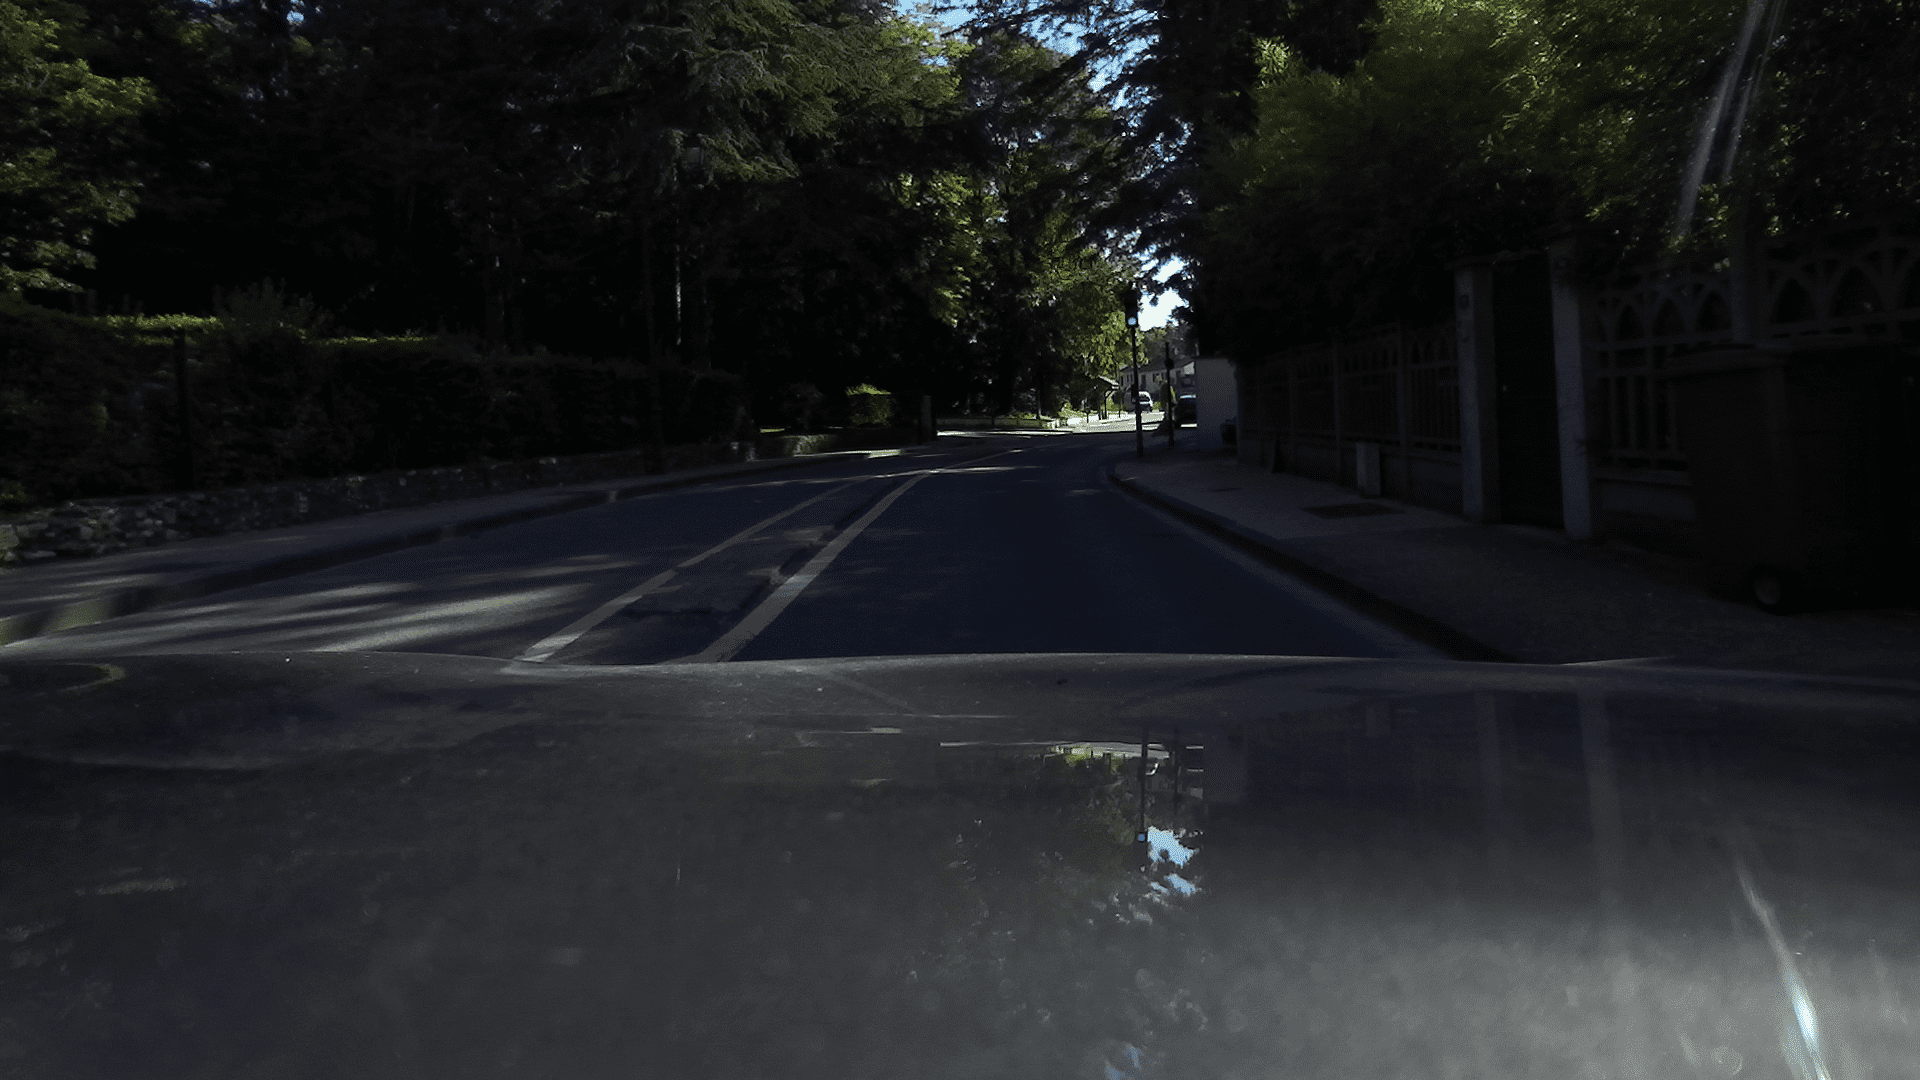
The dataset was collected across the Parisian metropolitan area and its environs, encompassing a diverse array of scenes that exhibit varying characteristics. This geographic breadth offers a spectrum of scenes, ranging from urban settings to rural landscapes and highway roads. Consequently, the dataset encapsulates the distinct attributes associated with each of these settings, including the differing people density, crowd dynamics, and environmental conditions. Another interesting aspect is that the timing of data acquisition coincided with the extensive preparations underway for the forthcoming Olympic Games in Paris. This temporal context further enhances the dataset’s complexity. The significant amount of ongoing construction and activities related to the Games introduces a high degree of variability and challenge to the dataset. The dynamic nature of this context translates into scenes featuring intricate interactions between vehicles, pedestrians, and various urban elements. This intricate tapestry of activities, coupled with the diverse surroundings, makes the InfraParis dataset uniquely demanding and reflective of real-world scenarios that autonomous vehicles might encounter.
In summary, this paper introduces the InfraParis multimodal dataset, acknowledging the necessity of IR data for comprehensive environmental perception, the challenges inherent to IR dataset management, the potential benefits of integrating multimodal foundation models, and the pivotal role of the database in tackling domain adaptation difficulties. By providing researchers with a rich resource that bridges the gap between RGB and IR domains, InfraParis paves the way for more adaptable and reliable autonomous driving systems, even in the most challenging visual conditions.
2 Related works
| Dataset | Scenario | Annotation type | # images | # classes | RGB | Depth | IR range | ||||
| Thermal Dogs and People [2] | Humans and dogs in infrared | Bounding box | 203 | 2 | x | x | Unknown | ||||
| PTB-TIR [30] | Pedestrians detection | Bounding box | 30128 | 1 | x | x | Unknown | ||||
| NVGesture [32] | Hand gesture recognition | Hand gesture label | 1532 | 25 | ✓ | ✓ | 0.85-0.87 µm (NIR) | ||||
| SODA [27] | Image segmentation | Polygons | 7168 | 20 | x | x | 0.75-13 µm | ||||
| KAIST Multispectral Pedestrian [25] | Pedestrians detection | Bounding box | 95000 | 3 | ✓ | x | 7.5-13 µm (LWIR) | ||||
| KAIST all-day dataset [9] |
|
Bounding box | 8970 | 3 | ✓ | ✓ | 7.5-14 µm (LWIR) | ||||
| Flir thermal dataset [1] | Autonomous Driving | Bounding box | 14000 | 5 | ✓ | x | 7.5-13.5 µm (LWIR) | ||||
| Brno-Urban-Dataset [28] | Autonomous Driving | None | 13h44min | ✓ | ✓ | 7.5-13.5 µm (LWIR) | |||||
| Freiburg Thermal [51] |
|
Instance semantics | 20647 | 13 | ✓ | x | 8-14 µm (LWIR) | ||||
| MFNet dataset [46] |
|
|
1569 | 8 | ✓ | x | 8-14 µm (LWIR) | ||||
| All-weather vision for automotive safety & all weather visibility for cars [33] | Autonomous driving | None | Unknown | - | ✓ | x |
|
||||
| Ours | Autonomous driving |
|
7301 | 19 | ✓ | ✓ | 8-14 µm (LWIR) |
2.1 Autonomous driving datasets
A range of real-world datasets tailored for autonomous driving purposes has recently been unveiled [10, 18, 43, 5, 54, 50, 37, 7, 24, 15, 44]. These datasets have played a pivotal role in driving significant advancements in the field, although they typically center on singular tasks such as semantic segmentation [10, 54, 37], object detection [18, 43, 5], or motion prediction [7, 24], often lacking multi-task capabilities with integration of multimodal information especially infrared. While synthetic datasets like GTA-V [39], SYNTHIA [40], virtual KITTI [16], MUAD [15], and SHIFT [44] offer ample training data without incurring the costs of annotating real images or privacy concerns, even these synthetic images fall short of including infrared data.
Other existing datasets predominantly serve domain adaptation, typically emulating content and classes from a specific real dataset. Some datasets, like Fishyscapes [4], Lost and Found [34], and SegmentMeIfYouCan [6], emphasize reliability for self-driving vehicles by evaluating semantic segmentation DNNs in the context of out-of-distribution objects. Other datasets assess robustness against varying weather conditions, including night [11, 12, 42], rain [48, 42], and fog [41, 42], though they often suffer from differing locations and conditions, leading to performance drops coinciding with challenging weather conditions.
To bolster the reliability of semantic segmentation DNNs and address the dearth of diversity in real-world environments, certain studies have promoted virtual object inpainting [23] or synthesis of weather conditions [47]. However, these approaches raise concerns about result fidelity. The recent ACDC dataset [42], composed exclusively of real images from consistent locations and inclusive of aleatoric uncertainty sources, endeavors to alleviate these concerns. Yet, even with their significance, these datasets often remain confined to a single modality or task.
2.2 Multi-modal datasets and DNNs
Several infrared autonomous driving datasets exist [1, 28, 33, 19], yet most lack annotations for semantic segmentation. Freiburg Thermal dataset [51] and MFNet dataset [46] have semantic segmentation annotations, yet the former lacks object detection annotations, and the latter is short on the image amount compared to other datasets. Moreover, the depth modality lacks in the above-mentioned datasets. Additionally, there are some other infrared datasets [32, 2, 9, 30, 25] working for other scenarios such as traffic surveillance. In essence, multimodal datasets and benchmarks in autonomous driving scenarios are still under-acquired and under-explored.
Notably, some studies have explored thermal image semantic segmentation. Qiao et al. [35] employ a level set method to segment pedestrians in thermal images, while Li et al. [27] propose an edge-conditioned segmentation network for thermal images trained on a dataset encompassing various indoor and outdoor scenes. Ha et al. [19] introduce a multimodal fusion network architecture for RGB and thermal images, evaluated on their own MF dataset [19].
To summarize the existing landscape of Infrared datasets, we have provided an overview in Table 1 with a comparison to our InfraParis dataset.
3 The dataset: InfraParis
3.1 Acquisition process
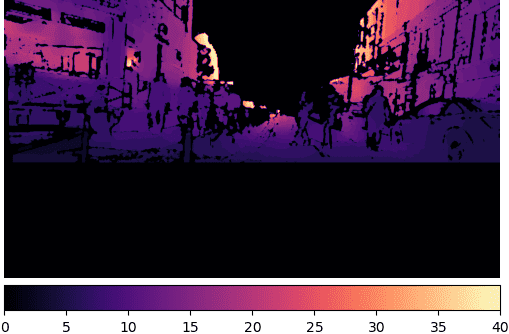
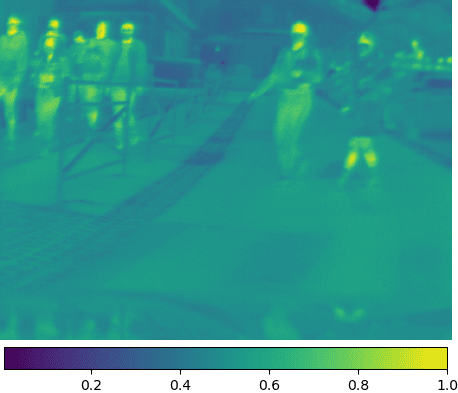
We used the Stereolabs ZED 2 stereo camera, capable of capturing paired color images to generate depth maps. During the data acquisition phase, the ZED 2 played a pivotal role in achieving precise calibration and registration of depth and RGB information. We also employed the optris PI 450i Infrared camera, featuring an field of view with a spectral range of 8 – 14 m, while the ZED 2 boasts a wider field of view at , coupled with a depth range spanning 0 to 40 meters. Both cameras were rigidly affixed together to prevent movement and securely mounted on the vehicle’s hood to mitigate potential glass distortion. The calibration process is elaborated upon in section 3.3, along with the synchronization mechanism that ensures simultaneous image capture for both cameras.
Having synchronized the database and fine-tuned camera calibration, the focus shifted to generating annotations exclusively for the RGB images, which could then be transferred to correspond with the infrared and depth counterparts. To ensure accurate and reliable annotations, we enlisted the expertise of professional annotation services. These annotations were meticulously crafted to align with the class schema established by the cityscape dataset [10], thereby facilitating potential domain adaptation from cityscape to InfraParis. Rigorous quality assessment was undertaken through the collaborative efforts of university members and students using specialized annotation software. Following multiple iterations of correction and assessment, the annotations attained a commendable level of precision and fidelity.
3.2 Ethics and policy
We ensured participant awareness regarding their inclusion in the dataset by providing them the option to request the removal of their images through email communication within the vehicle. Following a two-year period, no such requests were received. To uphold privacy and prevent the disclosure of personal information, we take a proactive approach by promptly removing images upon receiving complaints. This action underlines our commitment to respecting participants’ rights and maintaining confidentiality. A notable facet of this dataset is its timeframe, captured in the aftermath of the COVID-19 pandemic. Consequently, a significant majority of individuals were photographed wearing masks. This situation significantly contributes to the heightened preservation of their privacy.
Our dataset is characterized by its comprehensive representation of diverse viewpoints and demographics. We have proactively undertaken efforts to encompass a broad spectrum of backgrounds, cultures, and life experiences. By doing so, we have diligently avoided potential biases or instances of under-representation that could distort findings or perpetuate inequalities.
3.3 Camera calibration
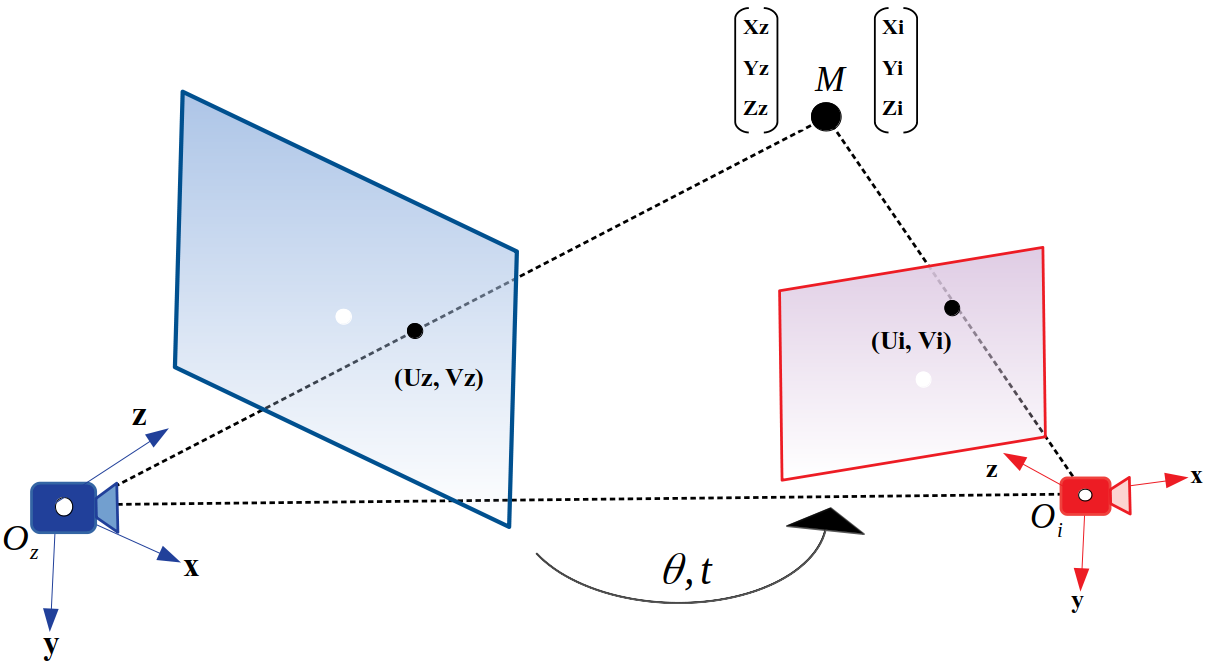
Our goal is
to determine how an image acquired by the ZED camera would look like if it was acquired from the point of view of the IR camera (see Figure 2) by performing re-projection. In this way any visual task performed on the ZED camera image can be visualized in the IR system coordinate which is critical if we want to combine infrared maps with other modalities. Please note that the field of view of the ZED Camera is larger than the IR one which explains why the IR is chosen as reference. Indeed, a projection from IR to ZED would have rendered maps with a great number of unknown values.
The projection matrix, made of the intrinsic parameters of a camera, namely its focal lengths and principal point is written as follows:
| (1) |
We denote as (resp. ) the projective matrix of the ZED (resp. of the Optris IR) camera. Let us also define and respectively the rotation matrix (illustrated as in Figure 3) and the translation vector of the ZED camera with respect to the Optris. These are the extrinsic parameters, forming the displacement matrix:
| (2) |
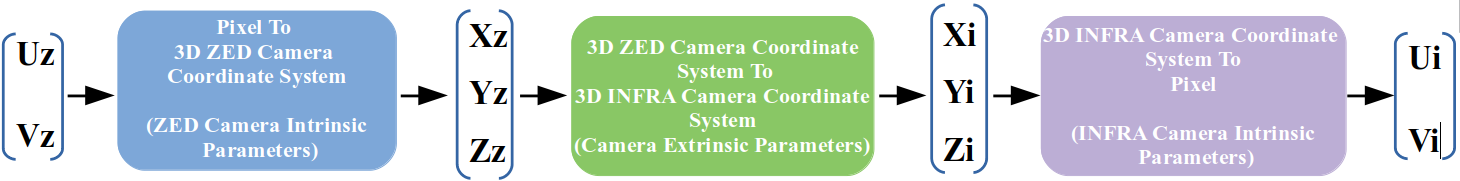
Let us consider a specific visual task performed on the ZED camera image, semantic segmentation for instance. And let us consider a given pixel . The goal of the re-projection is to find the corresponding pixel in the IR system coordinate as described in Figure 3. To do so we apply the following pipeline (see Figure. 4).
The 3D point in the ZED camera system coordinate can be obtained from as follows:
| (3) |
Where is the depth value at pixel as rendered by the ZED camera in the left image coordinate system.
The obtained 3D vector can then be written in the IR system coordinate by using the extrinsic matrix:
| (4) |
and
| (5) |
Finally the corresponding re-projected labelling image is filled as follows:
| (6) |
Please note that in order to keep the number of parameters to be determined low we chose not to take into account eventual distortions in our pipeline. We think it was unnecessary considering that images don’t seem to be distorted visually. Yet this is something to be considered in the general case.
We consider two different kinds of parameters:
-
•
Known Parameters: The ZED SDK API provides precise values of the intrinsic parameters of the ZED Camera.
-
•
Coarse parameter estimates: The intrinsic parameters of the IR Camera are roughly given by the documentation of the camera (Optris PI 450i).
For the extrinsic parameters, the IR camera was placed in the middle of the ZED cameras Hence, we expect the first component of the vector to be about half the baseline of the ZED Camera. In the same way, as well as the rotation angle are expected to be around zero.
We then refined the coarse parameter estimates by a grid search around the coarse parameter values. We chose the parameters that maximize the correlation between the edges of the semantic map and the edges of the infrared image. Edges of the infrared images were obtained with a threshold on the gradient. Edge maps were dilated to improve the metric quality.
3.4 Statistics of the dataset
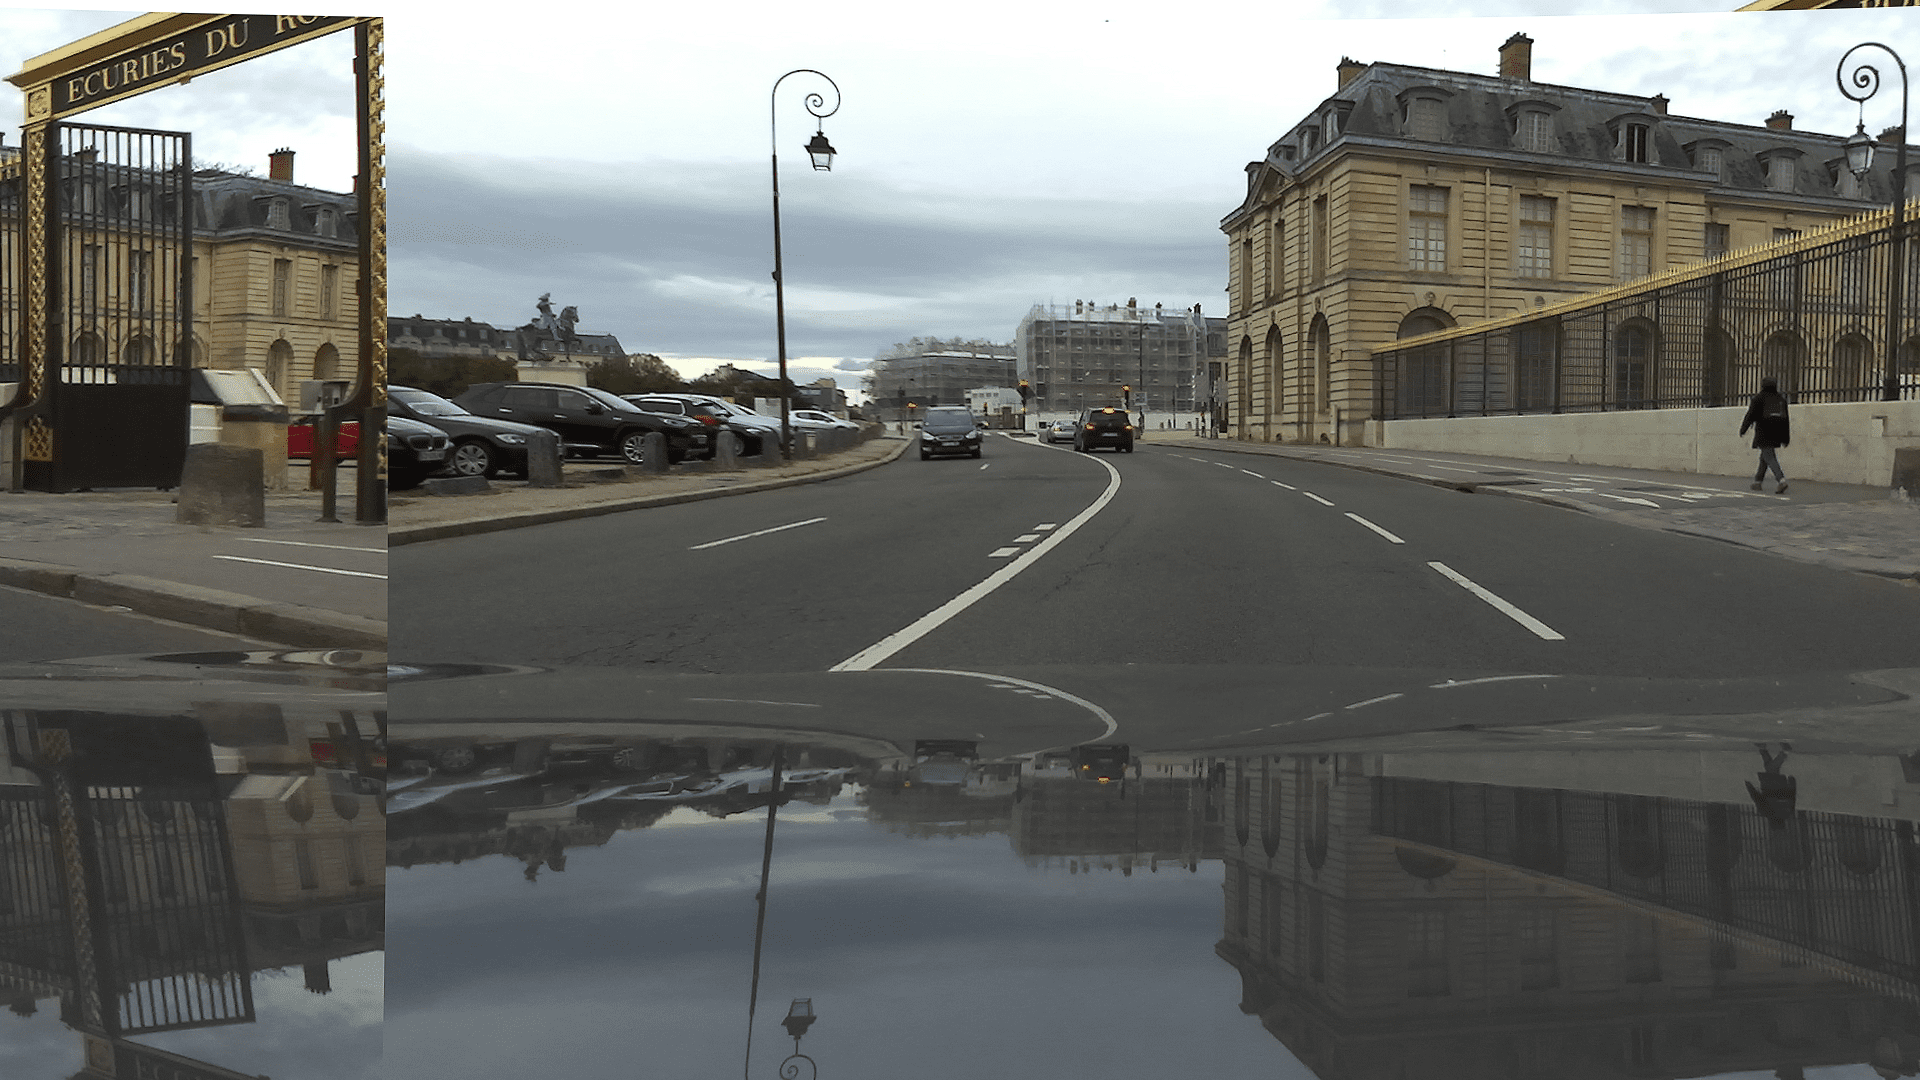
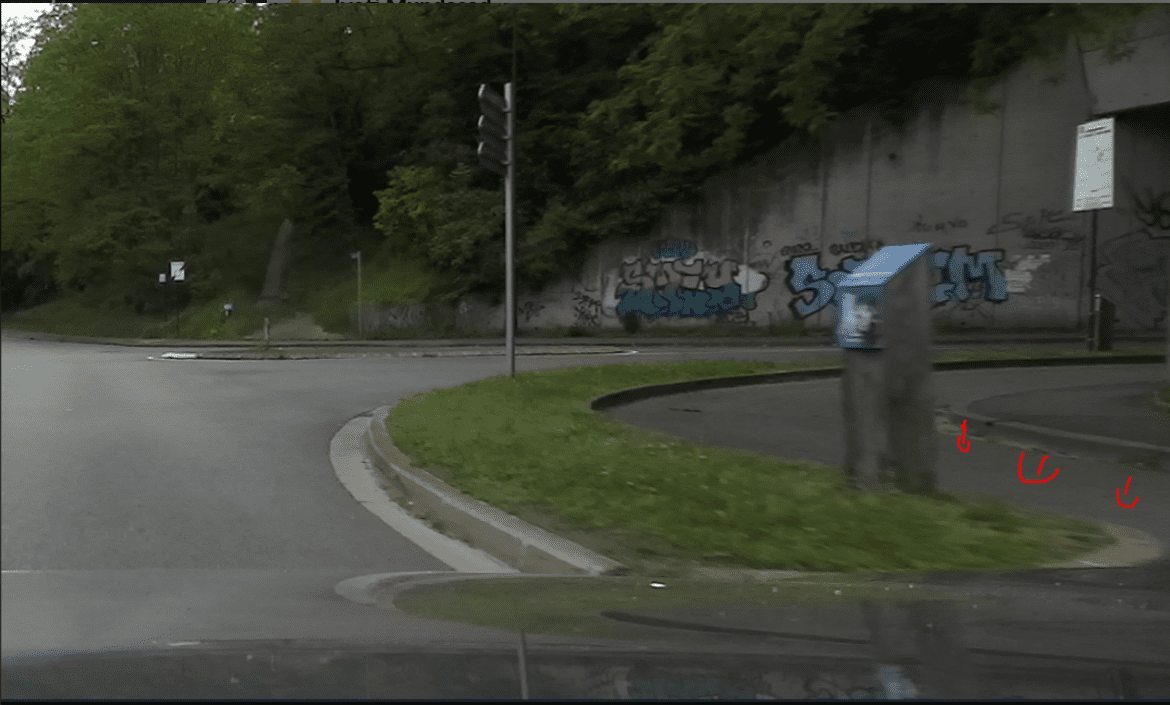
We captured a set of 12 084 images in various areas around Paris. During the image capture process, a portion of the acquired images proved to be unusable, ranging from to based on specific acquisitions. These discrepancies arose due to a range of corruptions: some emerged due to sensor malfunctions blending two images (as illustrated in Figure 5), while others were marred by noise and unconventional lighting. In Appendix Section B, we provide an overview of instances where annotation ambiguities arose and detail the strategies we employed to effectively resolve them.
Consequently, we meticulously curated a total of 7 301 viable images, which we subsequently categorized into three distinct groups: Train, Validation, and Test, as delineated in Table 2. The objective was to assemble a diverse and cohesive dataset with validation and test subsets that amalgamate both rural and urban contexts. Nonetheless, the InfraParis dataset offers an additional set of 16 142 consecutive frames, which can be interpreted as video data. These video sequences prove particularly valuable for the unsupervised depth task due to their potential to enhance depth estimation accuracy.
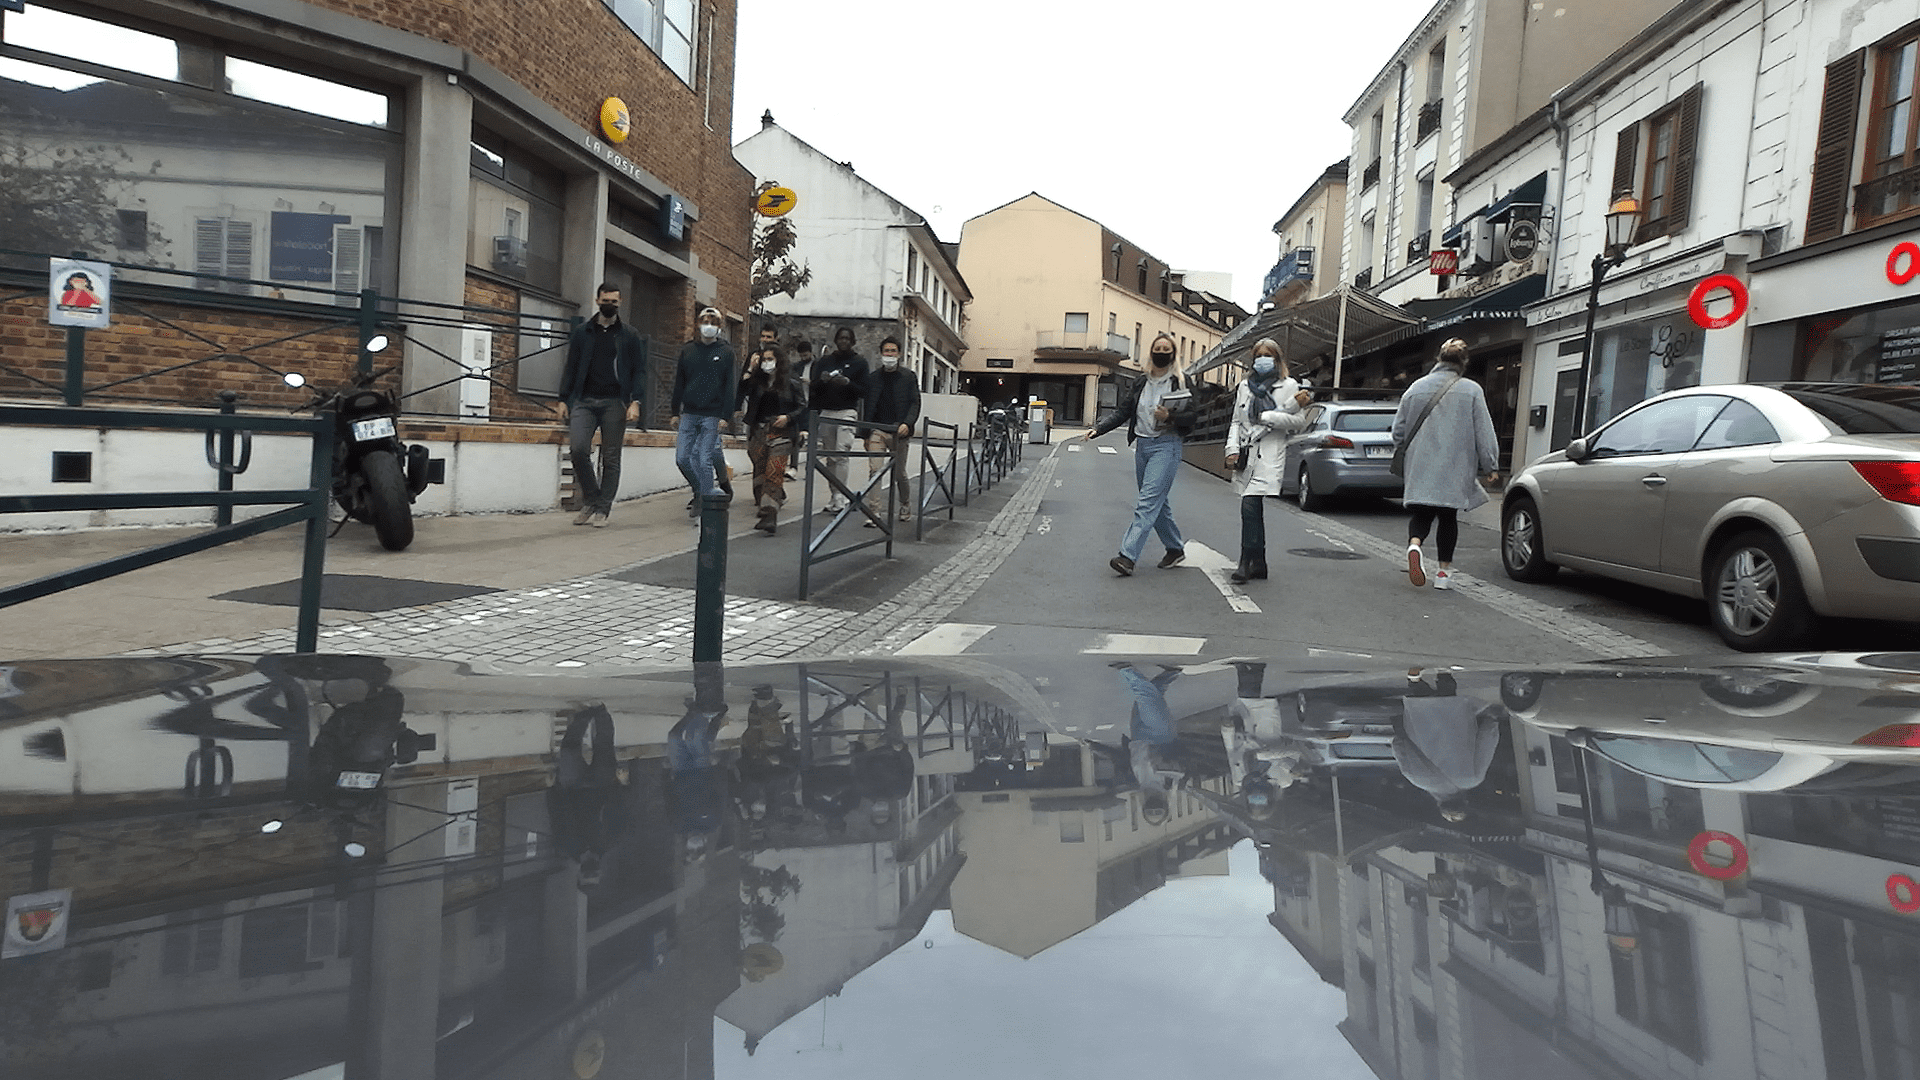
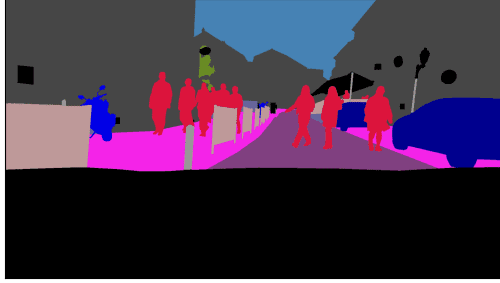
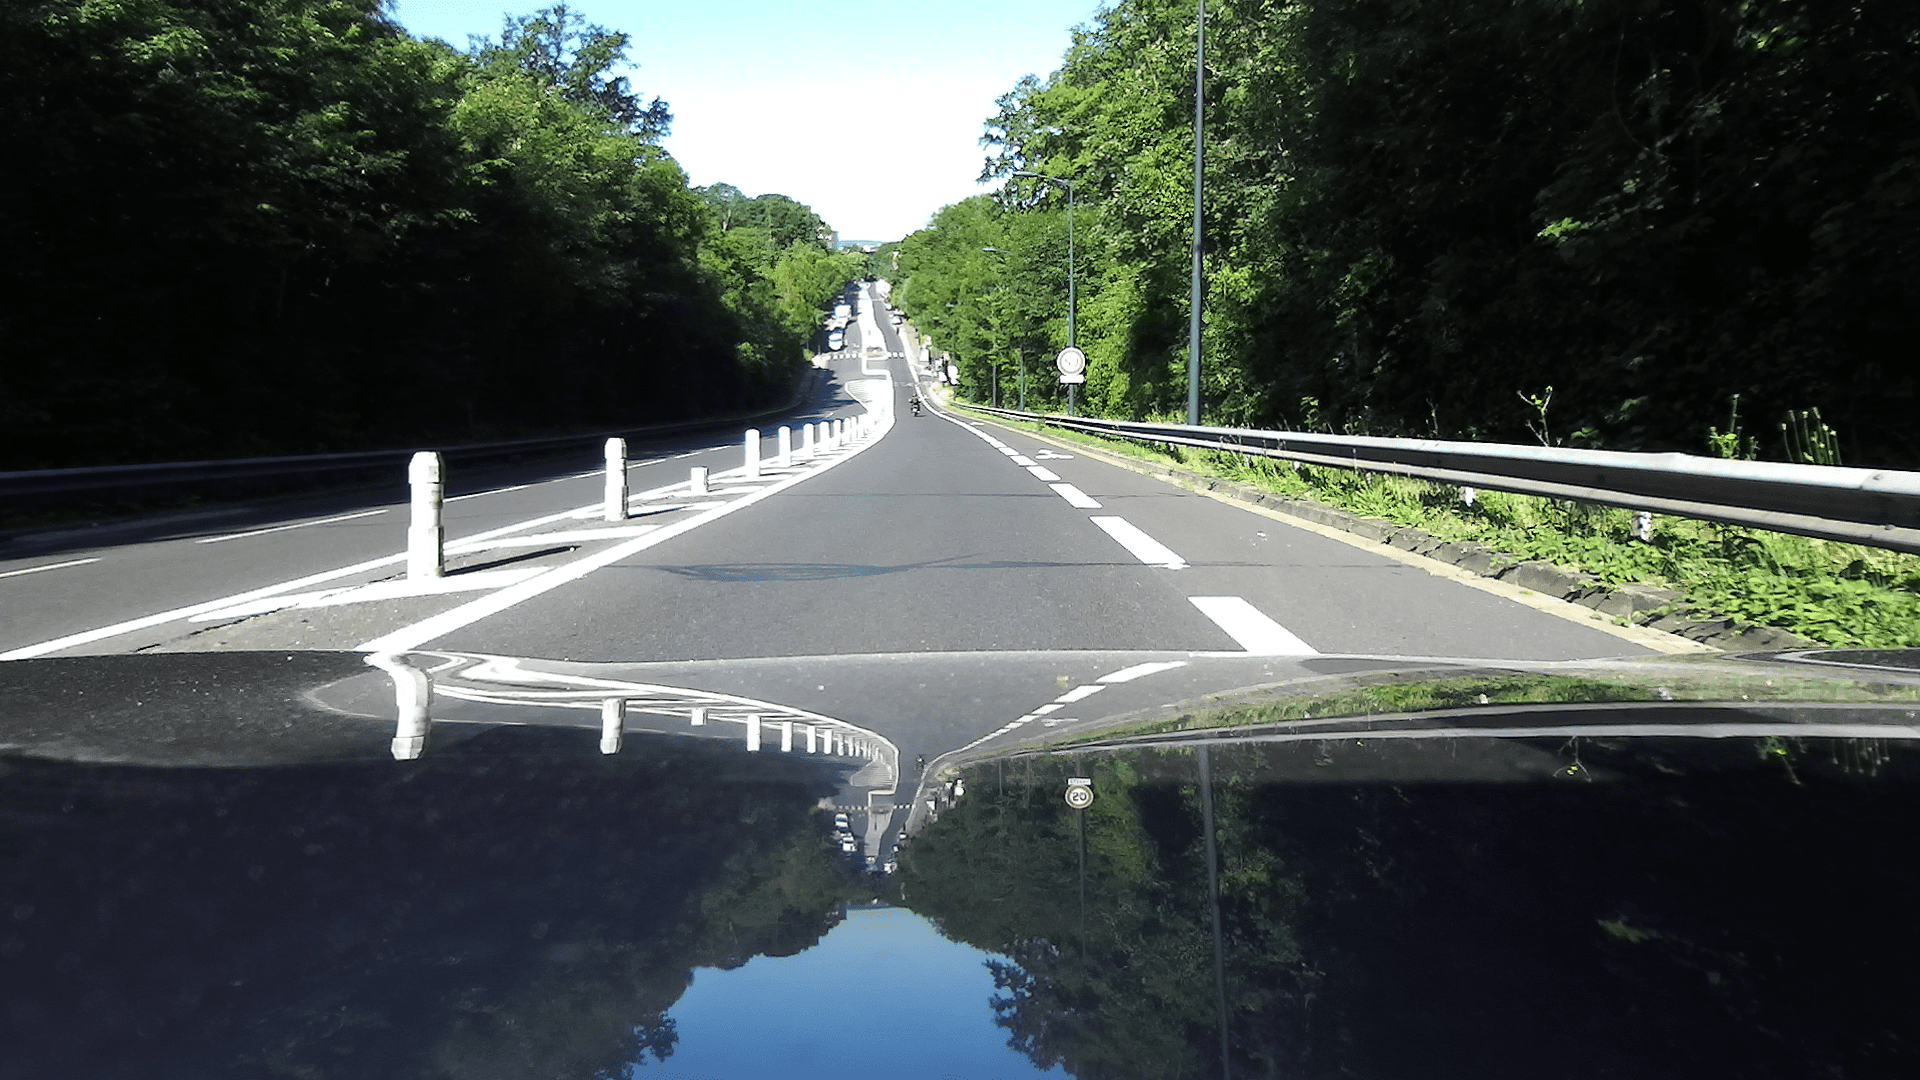
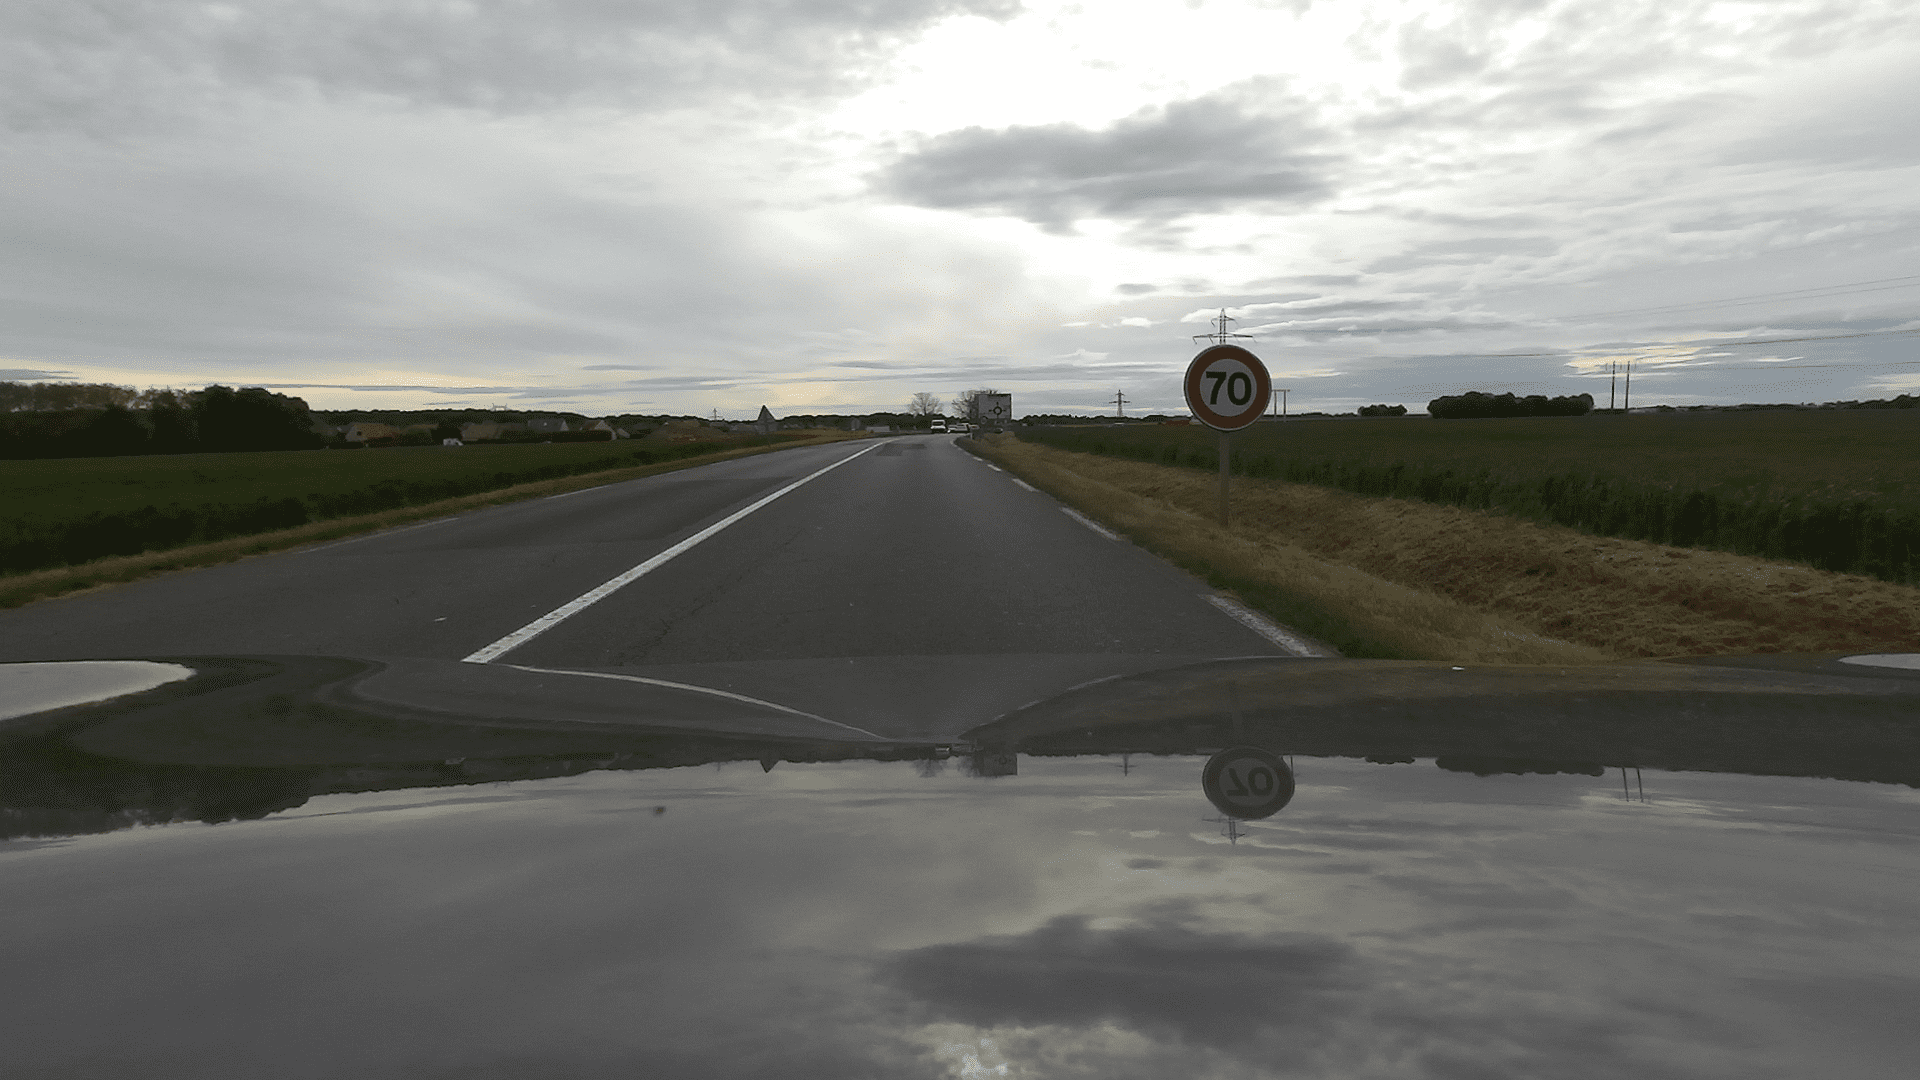
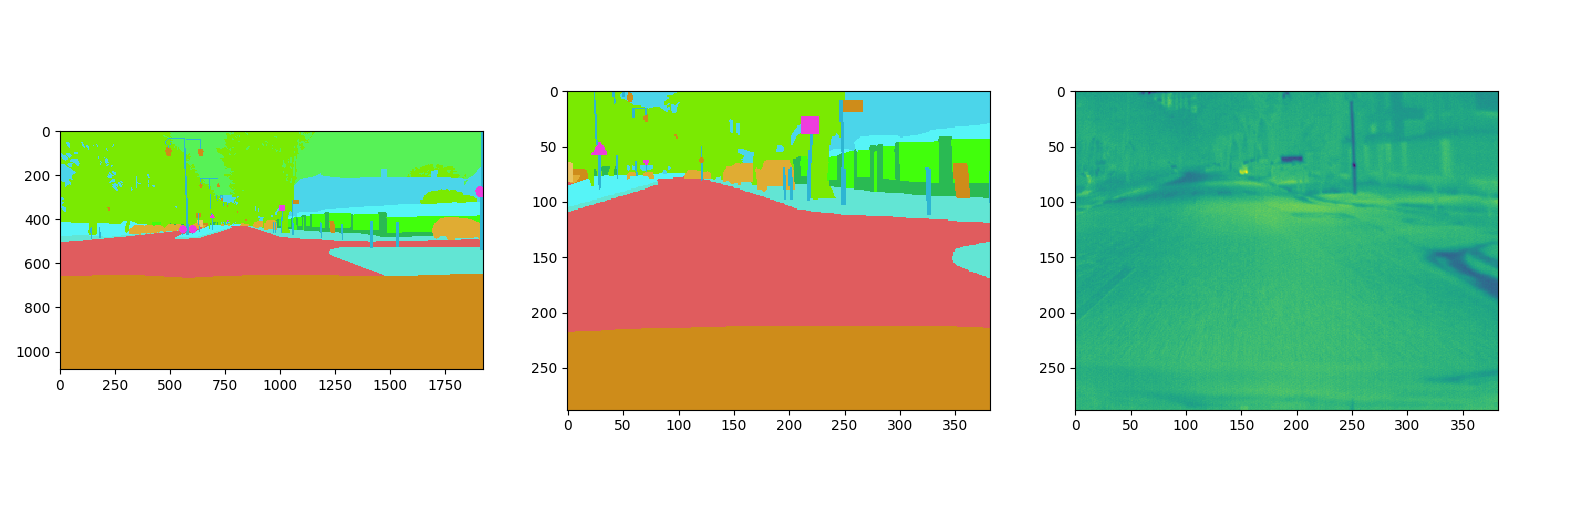
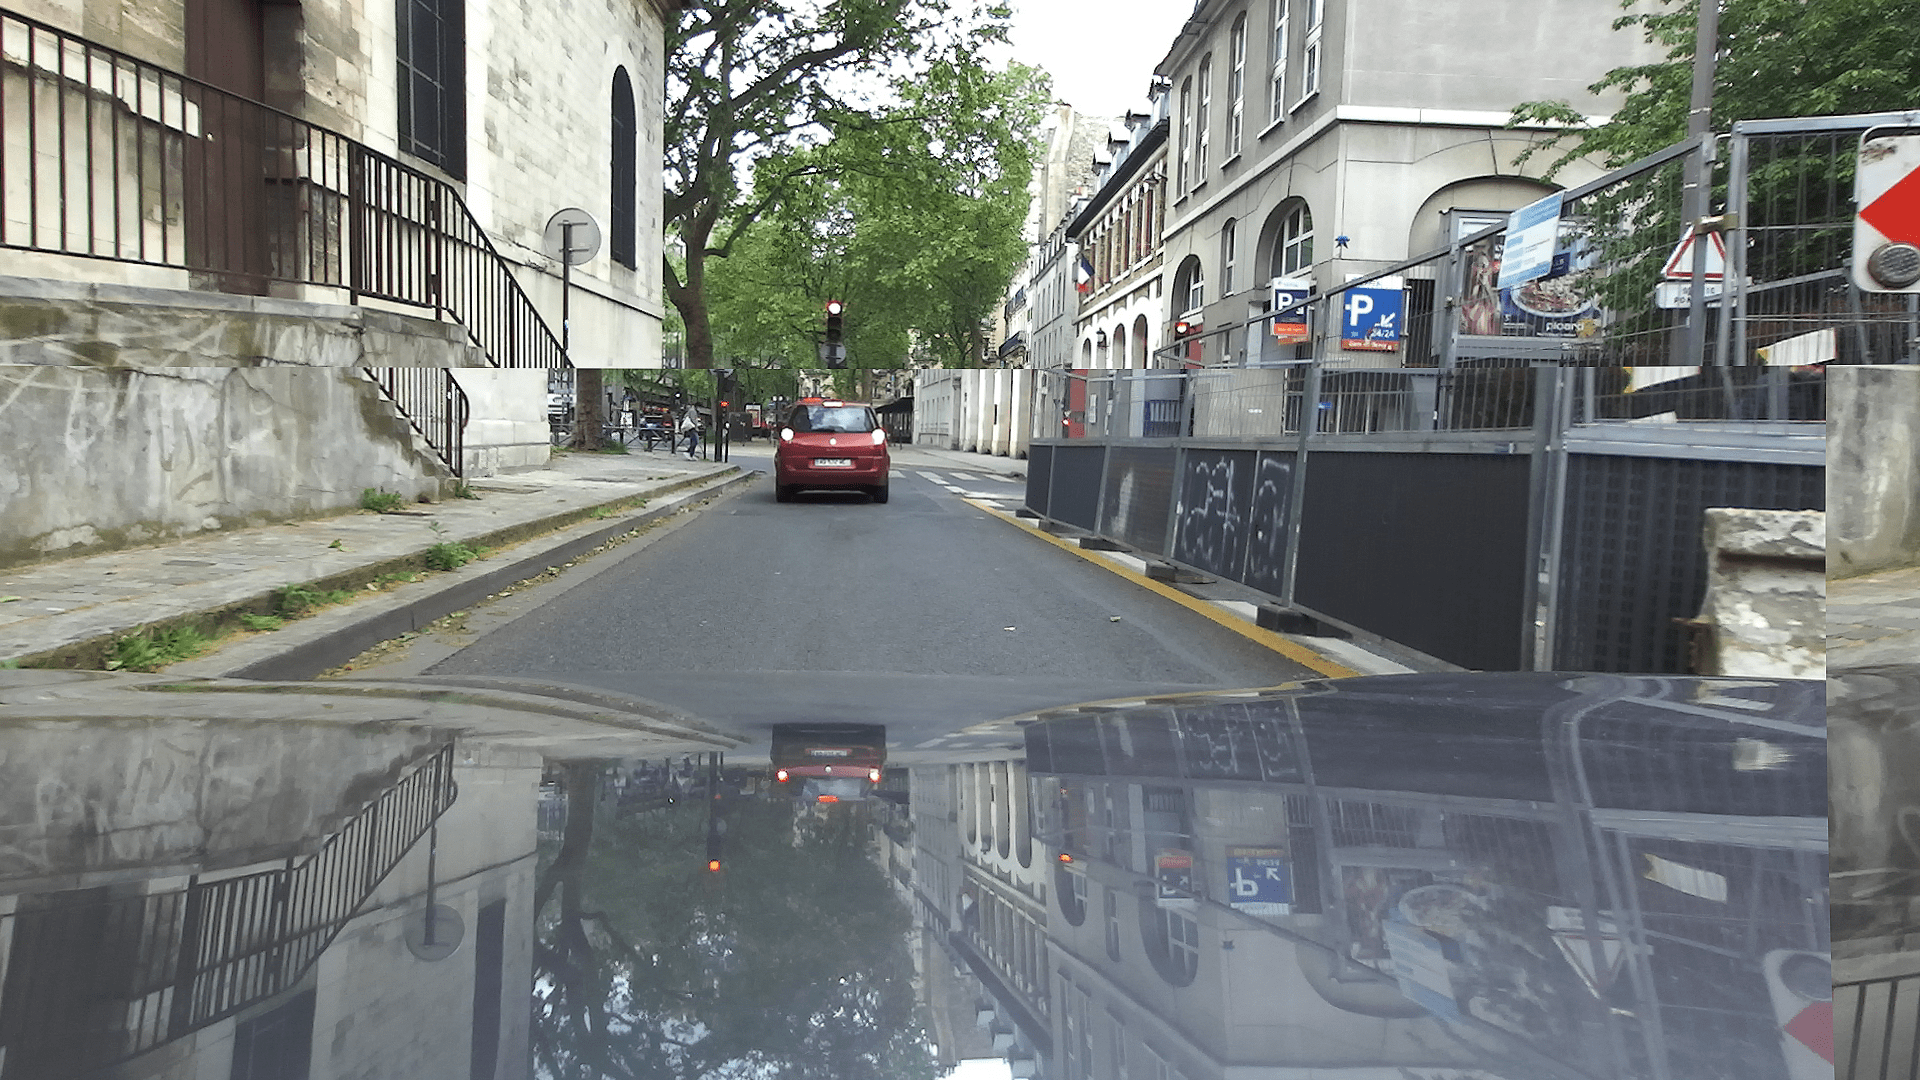
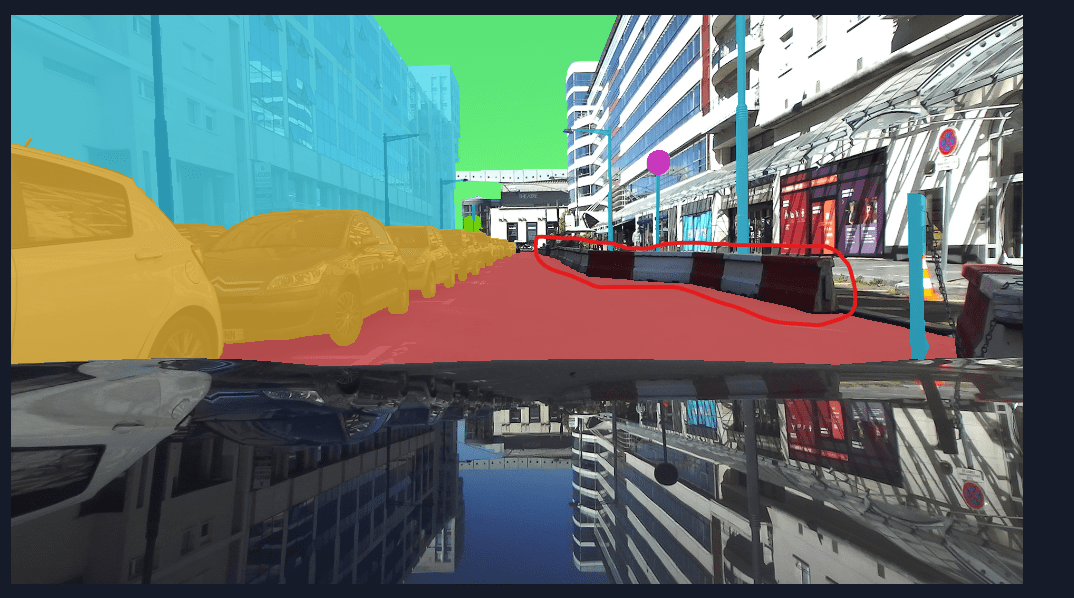
The distribution of these 7 301 images is thoughtfully arranged across various cities surrounding the Paris area, as detailed in Table 2. This geographical spread affords a heterogeneous assortment of scenes. For instance, the core of Paris exhibits a bustling atmosphere with towering modern structures in the 13th arrondissement juxtaposed with Haussmannian buildings in the 5th. Meanwhile, the suburbs like Orsay showcase a more organized layout of quaint houses, while Clamart and Meudon, situated near forests, evoke a rural ambiance. Examples of images from the dataset are depicted in Figures 1.
In an effort to inject diversity among the different cities, we chose to employ a subset of images for each city, ensuring an absence of overlap between consecutive frames.
| City | Selected | ||||
| images | Usable | ||||
| images | Unusable | ||||
| images | Percentage | ||||
| of unusable | |||||
| images | |||||
|
Train |
Antony BLR | 1035 | 1320 | 710 | 34.98% |
| Bièvres | 661 | 848 | 238 | 21.92% | |
| Chaville-Sevre-Viroflay | 906 | 1199 | 332 | 21.69% | |
| Meudon-Clamart | 100 | 2076 | 452 | 17.88% | |
| Orsay Saclay | 631 | 986 | 276 | 21.87% | |
| Paris5-6 | 1105 | 1415 | 2016 | 58.76% | |
| SQY | 99 | 283 | 164 | 36.69% | |
| SQY-Montigny | 782 | 946 | 319 | 25.22% | |
| Trappes | 499 | 1220 | 694 | 36.26% | |
| Versailles | 749 | 884 | 539 | 37.88% | |
|
Validation |
Massy | 40 | 973 | 589 | 37.71% |
| Palaiseau | 10 | 436 | 584 | 57.25% | |
| Paris13 | 73 | 114 | 1390 | 92.42% | |
| Paris14 | 39 | 64 | 379 | 85.55% | |
| Paris15 | 7 | 12 | 90 | 88.24% | |
| Plateau | 20 | 438 | 378 | 46.32% | |
|
Test |
Paris12 | 190 | 921 | 2273 | 71.16% |
| Saint-Cyr | 82 | 1361 | 450 | 24.85% | |
| Verrières | 299 | 646 | 211 | 24.62% | |
| Total | 7301 | 16142 | 12084 | 44.28% |
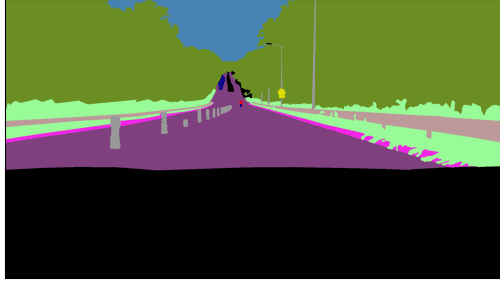
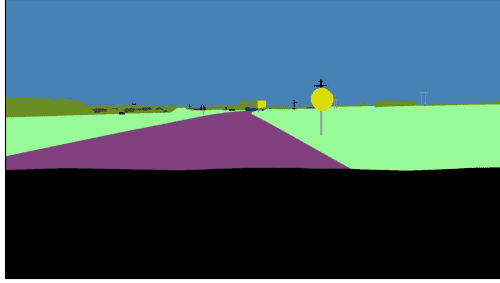
3.5 Class labels
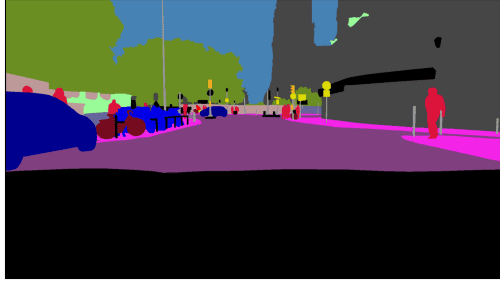
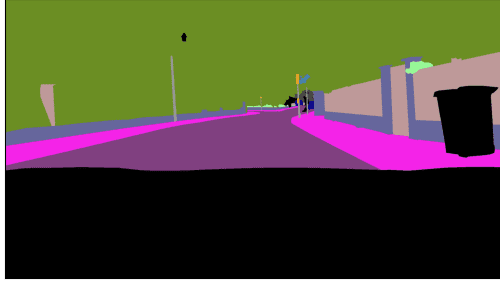
We provide precise pixel-level annotations for 20 classes. Our meticulous annotation effort resulted in a set of 7 301 finely-detailed images, each adorned with layered polygons. These annotations were accomplished in collaboration with a professional annotation company. On average, approximately 1.5 hours were invested in annotating each image, followed by an additional 20 minutes of quality verification conducted by our team. The annotation team was directed to designate instances as ”unlabeled” in cases of uncertainty and to document any new, previously-unlabeled instance types encountered during the process, in order to maintain comprehensive records.
Our annotation schema comprises 20 distinct visual classes, systematically organized into eight overarching categories: flat, construction, nature, vehicle, sky, object, human, and void. Notably, the “road” class encompasses sections of the ground typically traversed by vehicles, including all lanes, directions, and streets, complete with road markings. Furthermore, areas delimited solely by road markings, such as bicycle lanes, roundabout lanes, and parking spaces, are also classified as “road”. Curbs, however, are excluded from this label.
The “Sidewalk” class encapsulates ground segments designated for pedestrians or cyclists, demarcated from the road by obstacles like curbs or poles, rather than mere markings. Often elevated relative to the road, sidewalks are typically situated along road sides. This category encompasses pedestrian zones, walkable parts of traffic islands, and features that create separation from the road.
The “person” class includes individuals walking, standing, or sitting on surfaces such as the ground, benches, or chairs. It also incorporates toddlers, people pushing bicycles, or those standing adjacent to bicycles with both legs on one side. Items carried by a person, like backpacks, are part of this class, but objects in contact with the ground, like trolleys, are not included.
The “rider” class designates a human employing a device to traverse a distance. This category encompasses riders/drivers of bicycles, motorbikes, scooters, skateboards, horses, rollerblades, wheelchairs, road cleaning cars, and open-top cars. Notably, humans within cars are encompassed by the “car” label, as the label does not account for holes or openings.
The “car” class encompasses vehicles such as cars, jeeps, SUVs, vans with continuous body shapes, caravans, and excludes other types of trailers. The “truck” class encompasses trucks, box trucks, and pickup trucks, along with their associated trailers. Notably, the back portion or loading area is physically separated from the driving compartment. The “bus” class pertains to vehicles designed for the transportation of 9 or more individuals, serving either as public transportation or for long-distance travel.
The “on rails” class pertains to vehicles operating on tracks, including trams and trains. The “motorcycle and bicycle” class covers motorbikes, mopeds, and scooters without riders (who are referred to as “riders”, as mentioned above), as well as bicycles without riders.
The “building” class encompasses structures such as buildings, skyscrapers, houses, bus stop buildings, garages, and carports. Even if a building features glass walls through which visibility is possible, the entire structure is categorized as a building. This class also includes scaffolding affixed to buildings. On the other hand, the “individual standing wall” class pertains to standalone walls that are not part of a larger building.
Table 3 summarizes the number of images and pixels corresponding to each class. Only the class “person” is annotated for the object detection task.
|
|
|
||||||
| Road | 7326 | 9,75 % | ||||||
| Sidewalk | 7102 | 3,38 % | ||||||
| Building | 6917 | 12,69 % | ||||||
| Wall | 4847 | 1,44 % | ||||||
| Fence | 5992 | 2,29 % | ||||||
| Pole | 7292 | 0,77 % | ||||||
| Traffic light | 3231 | 0,08 % | ||||||
| Traffic sign | 5479 | 0,18 % | ||||||
| Vegetation | 7080 | 13,04 % | ||||||
| Terrain | 6145 | 3,29 % | ||||||
| Sky | 7260 | 10,10 % | ||||||
| Person | 3755 | 0,16 % | ||||||
| Rider | 7174 | 0,03 % | ||||||
| Car | 6906 | 3,42 % | ||||||
| Truck | 874 | 0,12 % | ||||||
| Bus | 686 | 0,13% | ||||||
| Train | 20 | 0,00% | ||||||
| Motorcycle | 1669 | 0,10 % | ||||||
| Bicycle | 1572 | 0,07% | ||||||
| Unlabeled | 7301 | 40,89 % |
4 Experimental Results
4.1 Semantic segmentation
In this section, we present a benchmark for semantic segmentation using reference models, specifically SegFormer [53] and DeepLab v3+ [8]. In Supplementary materials Section A, we provide the detailed hyperparameters for these experiments.
The outcomes of segmentation Deep Neural Networks (DNNs) trained on the InfraParis (RGB) dataset and tested on both InfraParis and Cityscapes [10] are summarized in Table 4. Additionally, we trained the DNNs on Cityscapes and evaluated them on both Cityscapes and InfraParis. Notably, the two datasets exhibit comparable mean Intersection over Union (mIoU) values, indicating similar behavior.
Furthermore, Table 4 illustrates the outcomes of training on the infrared images of InfraParis and testing on the same modality, emphasizing that the results are notably lower. This observation is intriguing as it suggests that infrared images alone might not be sufficient for effective semantic segmentation.
| Training | |||
| set | Models | mIoU | |
| Eval set 1 | Eval set 2 | ||
| Cityscapes | InfraParis | ||
|
Cityscapes |
DeepLabV3+MobileNet | 72.767 | 51.926 |
| DeepLabV3+Resnet101 | 77.122 | 55.815 | |
| Segformer B0 | 72.874 | 54.630 | |
| Segformer B1 | 75.068 | 57.229 | |
| Segformer B2 | 78.972 | 59.859 | |
| Segformer B3 | 80.201 | 60.784 | |
| Segformer B4 | 80.008 | 62.463 | |
| Segformer B5 | 80.994 | 62.995 | |
|
InfraParis RGB |
DeepLabV3+MobileNet | 47.685 | 65.651 |
| DeepLabV3+Resnet101 | 53.062 | 69.040 | |
| Segformer B0 | 55.051 | 64.160 | |
| Segformer B1 | 58.369 | 68.006 | |
| Segformer B2 | 63.589 | 69.852 | |
| Segformer B3 | 61.775 | 68.803 | |
| Segformer B4 | 63.583 | 70.333 | |
| Segformer B5 | 63.853 | 70.595 | |
|
InfraParis Thermal |
DeepLabV3+MobileNet | 31.158 | |
| DeepLabV3+Resnet101 | - | 34.445 | |
| Segformer B0 | 31.032 | ||
| Segformer B1 | 35.313 | ||
| Segformer B2 | 35.313 | ||
| Segformer B3 | 36.623 | ||
| Segformer B4 | 36.708 | ||
| Segformer B5 | 36.161 |
4.2 Supervised monocular depth estimation
| Training set | Eval set | Abs Rel | Sqr Rel | RMSE | RMSElog | |||||
| KITTI | KITTI | 0.049 | 0.095 | 1.311 | 0.071 | 0.982 | 0.998 | 1.000 | ||
| InfraParis | 0.388 | 4.486 | 10.543 | 0.747 | 0.339 | 0.565 | 0.677 | |||
| Cityscapes | 0.328 | 4.324 | 10.788 | 0.709 | 0.481 | 0.609 | 0.684 | |||
| InfraParis RGB | KITTI | 0.267 | 1.674 | 4.868 | 0.267 | 0.573 | 0.887 | 0.986 | ||
| InfraParis | 0.203 | 0.860 | 3.638 | 0.234 | 0.680 | 0.945 | 0.987 | |||
| Cityscapes | 0.324 | 2.448 | 7.537 | 0.469 | 0.244 | 0.553 | 0.862 | |||
|
InfraParis | 0.152 | 0.530 | 2.637 | 0.183 | 0.812 | 0.969 | 0.993 |
| Model | AP | AP50 | AP75 | APs | APm | APl |
| Faster R-CNN | 24.825 | 44.363 | 23.963 | 7.148 | 36.774 | 64.205 |
| Mask R-CNN | 29.935 | 52.685 | 26.99 | 10.791 | 41.285 | 65.685 |
We here provide a benchmark for supervised monocular depth estimation. The baseline model is established using NeWCRFs [55], which employs a Swin-Transformer [31] as the encoder. We conduct the following experiments to provide the benchmark as well as show the versatility of the proposed dataset.
In the first experiment, the model is trained on the InfraParis training and validation set, then evaluated on the InfraParis test set, Cityscapes validation set [10], and KITTI [17] eigen-spilt [13] validation set, respectively. The second experiment was performed in the opposite way, training the model on the KITTI dataset and evaluating the performance on the InfraParis test set and Cityscapes. Note that since the depth value range acquired by the sensor is 0-40 m, our evaluation on the KITTI and Cityscapes datasets follows the same range for a reasonable comparison. In the third experiment, we train the NeWCRFs model to fit thermal images to the depth values for the corresponding areas. All training settings are the same as those used for NeWCRFs training on KITTI, except that we use 4 as the batch size on InfraParis RGB images training. The evaluation metrics follow those commonly used in depth maps prediction literature [13, 55].
The benchmark is presented in Table 5. We can see that the model trained on KITTI cannot directly transfer well to the Cityscapes and InfraParis. Yet, the one trained on InfraParis can provide better performance when it is directly evaluated on the other datasets. Since monocular depth estimation is an ill-posed problem and heavily depends on the training dataset, this benchmark shows the good diversity of the proposed dataset. The model trained on InfraParis thermal images shows even better results. Since the resolution of the thermal data is smaller, we consider that the scene has lower diversity in this case, and one cannot directly compare this result to the previous ones. We take this result as a benchmark of the thermal-to-depth estimation task of the proposed dataset.
4.3 Object detection
In this section, we present a benchmark for object detection using Faster R-CNN [38] and Mask R-CNN [21] architectures with ResNet50 [22] as the backbone. Supplementary materials Section A provides detailed hyperparameters. The goal is to detect the class Person. While only one class is considered in our study, it remains a challenging issue to take into account the small number of samples available for finetuning (3721 useful images with at least one person annotated). We used the library Detectron2 [52] to do our experiments. Models were initialized with the available pre-trained weights on COCO [29], then finetuned on the InfraParis training set, and finally evaluated on the InfraParis test set. Results are summarized in Table 6.
5 Conclusion
In conclusion, the InfraParis dataset presented in this paper stands as a significant contribution to the field of autonomous driving research. Notably, it introduces a novel multi-modal and multi-task dataset that comprises a total of 7 301 meticulously annotated multimodal pieces of data. One of the key distinguishing features of this dataset lies in its uniqueness; it is one of the few datasets available that encompasses both multiple tasks and modalities on such a substantial scale. The dataset’s value is further amplified by its potential to be seamlessly integrated with existing standard autonomous driving datasets such as Cityscapes or KITTI. By offering an extensive range of data spanning multiple tasks, including semantic segmentation, object detection, and depth prediction, as well as modalities like RGB and infrared, the InfraParis dataset enables comprehensive testing and validation of multi-modal models.
The diverse and challenging scenarios encapsulated within the dataset also make it particularly compelling. The convergence of construction activities related to the Olympic Games and the dynamics introduced by the COVID-19 pandemic have generated a unique amalgamation of scenes that are typically absent from traditional datasets. The dataset thereby empowers researchers to explore new and unconventional scenarios, shedding light on previously unexplored sources of uncertainty and variability.
In essence, the InfraParis dataset bears witness to the progress made in improving the capabilities of autonomous driving systems. By offering a substantial and versatile collection of multi-modal data with multi-task annotations, the dataset not only enhances the training and evaluation of contemporary models but also paves the way for innovations that can contribute to safer and more reliable autonomous vehicles in the future.
Acknowledgment : This work was performed using HPC resources from GENCI-IDRIS (Grant 2021 - AD011011970R1) and (Grant 2022 - AD011011970R2). We gratefully acknowledge the support AID Project ACoCaTherm which supported the creation of the dataset.
References
- [1] Flir thermal dataset. https://www.flir.com/oem/adas/adas-dataset-form/. Accessed: 2021-08-03.
- [2] Thermal Dogs and People Dataset. https://public.roboflow.com/object-detection/thermal-dogs-and-people. Accessed: 2021-08-03.
- [3] Jean-Baptiste Alayrac, Jeff Donahue, Pauline Luc, Antoine Miech, Iain Barr, Yana Hasson, Karel Lenc, Arthur Mensch, Katherine Millican, Malcolm Reynolds, et al. Flamingo: a visual language model for few-shot learning. NeurIPS, 2022.
- [4] Hermann Blum, Paul-Edouard Sarlin, Juan Nieto, Roland Siegwart, and Cesar Cadena. Fishyscapes: A benchmark for safe semantic segmentation in autonomous driving. In ICCV Workshops, 2019.
- [5] Holger Caesar, Varun Bankiti, Alex H. Lang, Sourabh Vora, Venice Erin Liong, Qiang Xu, Anush Krishnan, Yu Pan, Giancarlo Baldan, and Oscar Beijbom. nuScenes: A multimodal dataset for autonomous driving. In CVPR, 2020.
- [6] Robin Chan, Krzysztof Lis, Svenja Uhlemeyer, Hermann Blum, Sina Honari, Roland Siegwart, Mathieu Salzmann, Pascal Fua, and Matthias Rottmann. Segmentmeifyoucan: A benchmark for anomaly segmentation. In NeurIPS Datasets and Benchmarks, 2021.
- [7] Ming-Fang Chang, John Lambert, Patsorn Sangkloy, Jagjeet Singh, Slawomir Bak, Andrew Hartnett, De Wang, Peter Carr, Simon Lucey, Deva Ramanan, et al. Argoverse: 3d tracking and forecasting with rich maps. In CVPR, 2019.
- [8] Liang-Chieh Chen, Yukun Zhu, George Papandreou, Florian Schroff, and Hartwig Adam. Encoder-decoder with atrous separable convolution for semantic image segmentation. In ECCV, 2018.
- [9] Yukyung Choi, Namil Kim, Soonmin Hwang, Kibaek Park, Jae Shin Yoon, Kyounghwan An, and In So Kweon. Kaist multi-spectral day/night data set for autonomous and assisted driving. IEEE Transactions on Intelligent Transportation Systems, 19(3):934–948, 2018.
- [10] Marius Cordts, Mohamed Omran, Sebastian Ramos, Timo Rehfeld, Markus Enzweiler, Rodrigo Benenson, Uwe Franke, Stefan Roth, and Bernt Schiele. The cityscapes dataset for semantic urban scene understanding. In CVPR, 2016.
- [11] Dengxin Dai, Christos Sakaridis, Simon Hecker, and Luc Van Gool. Curriculum model adaptation with synthetic and real data for semantic foggy scene understanding. IJCV, 2020.
- [12] Dengxin Dai and Luc Van Gool. Dark model adaptation: Semantic image segmentation from daytime to nighttime. In ITSC, 2018.
- [13] David Eigen, Christian Puhrsch, and Rob Fergus. Depth map prediction from a single image using a multi-scale deep network. NeurIPS, 2014.
- [14] Muhammad Ali Farooq, Waseem Shariff, Mehdi Sefidgar Dilmaghani, Wang Yao, Moazam Soomro, and Peter Corcoran. Decisive data using multi-modality optical sensors for advanced vehicular systems, 2023.
- [15] Gianni Franchi, Xuanlong Yu, Andrei Bursuc, Angel Tena, Rémi Kazmierczak, Séverine Dubuisson, Emanuel Aldea, and David Filliat. MUAD: Multiple uncertainties for autonomous driving, a benchmark for multiple uncertainty types and tasks. In BMVC, 2022.
- [16] Adrien Gaidon, Qiao Wang, Yohann Cabon, and Eleonora Vig. Virtual worlds as proxy for multi-object tracking analysis. In CVPR, 2016.
- [17] Andreas Geiger, Philip Lenz, Christoph Stiller, and Raquel Urtasun. Vision meets robotics: The kitti dataset. The International Journal of Robotics Research, 32(11):1231–1237, 2013.
- [18] Andreas Geiger, Philip Lenz, and Raquel Urtasun. Are we ready for autonomous driving? the kitti vision benchmark suite. In CVPR, 2012.
- [19] Qishen Ha, Kohei Watanabe, Takumi Karasawa, Yoshitaka Ushiku, and Tatsuya Harada. Mfnet: Towards real-time semantic segmentation for autonomous vehicles with multi-spectral scenes. In IROS. IEEE, 2017.
- [20] Chris Hallacy and Pamela Mishkin. Learning transferable visual models from natural language supervision, 2021.
- [21] Kaiming He, Georgia Gkioxari, Piotr Dollár, and Ross Girshick. Mask r-cnn. In ICCV, 2017.
- [22] Kaiming He, Xiangyu Zhang, Shaoqing Ren, and Jian Sun. Deep residual learning for image recognition. In CVPR, 2016.
- [23] Dan Hendrycks, Steven Basart, Mantas Mazeika, Mohammadreza Mostajabi, Jacob Steinhardt, and Dawn Song. A benchmark for anomaly segmentation. arXiv:1911.11132, 2019.
- [24] John Houston, Guido Zuidhof, Luca Bergamini, Yawei Ye, Long Chen, Ashesh Jain, Sammy Omari, Vladimir Iglovikov, and Peter Ondruska. One thousand and one hours: Self-driving motion prediction dataset. arXiv:2006.14480, 2020.
- [25] Soonmin Hwang, Jaesik Park, Namil Kim, Yukyung Choi, and In So Kweon. Multispectral pedestrian detection: Benchmark dataset and baseline. In CVPR, 2015.
- [26] Alexandru Kampmann, Michael Lamberti, Nikola Petrovic, Stefan Kowalewski, and Bassam Alrifaee. Investigating outdoor recognition performance of infrared beacons for infrastructure-based localization., 2022.
- [27] Chenglong Li, Wei Xia, Yan Yan, Bin Luo, and Jin Tang. Segmenting objects in day and night: Edge-conditioned cnn for thermal image semantic segmentation. IEEE Transactions on Neural Networks and Learning Systems, 2020.
- [28] Adam Ligocki, Ales Jelinek, and Ludek Zalud. Brno urban dataset-the new data for self-driving agents and mapping tasks. In ICRA. IEEE, 2020.
- [29] Tsung-Yi Lin, Michael Maire, Serge Belongie, James Hays, Pietro Perona, Deva Ramanan, Piotr Dollár, and C Lawrence Zitnick. Microsoft coco: Common objects in context. In ECCV. Springer, 2014.
- [30] Qiao Liu, Zhenyu He, Xin Li, and Yuan Zheng. Ptb-tir: A thermal infrared pedestrian tracking benchmark. IEEE Transactions on Multimedia, 22(3):666–675, 2019.
- [31] Ze Liu, Yutong Lin, Yue Cao, Han Hu, Yixuan Wei, Zheng Zhang, Stephen Lin, and Baining Guo. Swin transformer: Hierarchical vision transformer using shifted windows. In ICCV, 2021.
- [32] Pavlo Molchanov, Xiaodong Yang (NVIDIA), Shalini Gupta (NVIDIA), Kihwan Kim (NVIDIA), Stephen Tyree, and Jan Kautz. Online detection and classification of dynamic hand gestures with recurrent 3d convolutional neural networks. 2016.
- [33] Nicolas Pinchon, Olivier Cassignol, Frédéric Bernardin, Adrien Nicolas, Patrick Leduc, and al.. All- weather vision for automotive safety: which spectral band? AMAA 2018, Advanced Microsystems for Automotive Applications, Sep 2018, Berlin, Germany. pp. 3-15, 10.1007/978-3-319-99762-9-1, hal-01975285, 2018.
- [34] Peter Pinggera, Sebastian Ramos, Stefan Gehrig, Uwe Franke, Carsten Rother, and Rudolf Mester. Lost and found: detecting small road hazards for self-driving vehicles. In IROS, 2016.
- [35] Yulong Qiao, Ziwei Wei, and Yan Zhao. Thermal infrared pedestrian image segmentation using level set method. Sensors, 17(8):1811, 2017.
- [36] Alec Radford, Jong Wook Kim, Chris Hallacy, Aditya Ramesh, Gabriel Goh, Sandhini Agarwal, Girish Sastry, Amanda Askell, Pamela Mishkin, Jack Clark, et al. Learning transferable visual models from natural language supervision. In ICML. PMLR, 2021.
- [37] Vasili Ramanishka, Yi-Ting Chen, Teruhisa Misu, and Kate Saenko. Toward driving scene understanding: A dataset for learning driver behavior and causal reasoning. In CVPR, 2018.
- [38] Shaoqing Ren, Kaiming He, Ross Girshick, and Jian Sun. Faster r-cnn: Towards real-time object detection with region proposal networks. Advances in neural information processing systems, 28, 2015.
- [39] Stephan R Richter, Vibhav Vineet, Stefan Roth, and Vladlen Koltun. Playing for data: Ground truth from computer games. In ECCV, 2016.
- [40] German Ros, Laura Sellart, Joanna Materzynska, David Vazquez, and Antonio M Lopez. The synthia dataset: A large collection of synthetic images for semantic segmentation of urban scenes. In CVPR, 2016.
- [41] Christos Sakaridis, Dengxin Dai, and Luc Van Gool. Semantic foggy scene understanding with synthetic data. IJCV, 2018.
- [42] Christos Sakaridis, Dengxin Dai, and Luc Van Gool. Acdc: The adverse conditions dataset with correspondences for semantic driving scene understanding. In ICCV, 2021.
- [43] Pei Sun, Henrik Kretzschmar, Xerxes Dotiwalla, Aurelien Chouard, Vijaysai Patnaik, Paul Tsui, James Guo, Yin Zhou, Yuning Chai, Benjamin Caine, Vijay Vasudevan, Wei Han, Jiquan Ngiam, Hang Zhao, Aleksei Timofeev, Scott Ettinger, Maxim Krivokon, Amy Gao, Aditya Joshi, Yu Zhang, Jonathon Shlens, Zhifeng Chen, and Dragomir Anguelov. Scalability in perception for autonomous driving: Waymo open dataset. In CVPR, 2020.
- [44] Tao Sun, Mattia Segu, Janis Postels, Yuxuan Wang, Luc Van Gool, Bernt Schiele, Federico Tombari, and Fisher Yu. SHIFT: a synthetic driving dataset for continuous multi-task domain adaptation. In CVPR, pages 21371–21382, June 2022.
- [45] Ximeng Sun, Pengchuan Zhang, Peizhao Zhang, Hardik Shah, Kate Saenko, and Xide Xia. Dime-fm: Distilling multimodal and efficient foundation models, 2023.
- [46] Karasawa Takumi, Kohei Watanabe, Qishen Ha, Antonio Tejero-De-Pablos, Yoshitaka Ushiku, and Tatsuya Harada. Multispectral object detection for autonomous vehicles. In Proceedings of the on Thematic Workshops of ACM Multimedia 2017, pages 35–43, 2017.
- [47] Maxime Tremblay, Shirsendu Sukanta Halder, Raoul de Charette, and Jean-François Lalonde. Rain rendering for evaluating and improving robustness to bad weather. IJCV, 2021.
- [48] Frederick Tung, Jianhui Chen, Lili Meng, and James J Little. The Raincouver scene parsing benchmark for self-driving in adverse weather and at night. RAL, 2017.
- [49] Mohsen Vadidar, Ali Kariminezhad, Christian Mayr, Laurent Kloeker, and Lutz Eckstein. Robust environment perception for automated driving: A unified learning pipeline for visual-infrared object detection., 2022.
- [50] Girish Varma, Anbumani Subramanian, Anoop Namboodiri, Manmohan Chandraker, and CV Jawahar. IDD: A dataset for exploring problems of autonomous navigation in unconstrained environments. In WACV, 2019.
- [51] Vertens, Johan, Zürn, Jannik, Burgard, and Wolfram. Heatnet: Bridging the day-night domain gap in semantic segmentation with thermal images. arXiv preprint arXiv:2003.04645, 2020.
- [52] Yuxin Wu, Alexander Kirillov, Francisco Massa, Wan-Yen Lo, and Ross Girshick. Detectron2. https://github.com/facebookresearch/detectron2, 2019.
- [53] Enze Xie, Wenhai Wang, Zhiding Yu, Anima Anandkumar, Jose M Alvarez, and Ping Luo. Segformer: Simple and efficient design for semantic segmentation with transformers. NeurIPS, 2021.
- [54] Fisher Yu, Haofeng Chen, Xin Wang, Wenqi Xian, Yingying Chen, Fangchen Liu, Vashisht Madhavan, and Trevor Darrell. BDD100k: A diverse driving dataset for heterogeneous multitask learning. In CVPR, 2020.
- [55] Weihao Yuan, Xiaodong Gu, Zuozhuo Dai, Siyu Zhu, and Ping Tan. Newcrfs: Neural window fully-connected crfs for monocular depth estimation. In CVPR, 2022.
InfraParis: A multi-modal and multi-task autonomous driving dataset
—— Supplementary Material ——
Appendix A Implementation details
A.1 Semantic segmentation
Table A7 furnishes comprehensive insights into the hyperparameters and elaborate implementation details pertaining to the semantic segmentation task. In the case of RGB images, our approach incorporates classical data augmentation techniques such as random crop, random color jitters, and random horizontal flip, alongside normalization transformations that involve mean subtraction and division by the standard variation. However, for infrared images, a similar augmentation process is applied, albeit without the inclusion of random color jitters.
| Architecture | Deeplab v3+ | Segformer B0,B1,B2 | Segformer B3,B4,B5 |
| backbone | ResNet101 and mobilenet | NA | NA |
| output stride | 8 | NA | NA |
| learning rate | 0.1 | 0.1 | 0.0001 |
| batch size | 16 | 8 | 3 |
| number of train iterations | 100 | 60 | 60 |
| weight decay | 0.0001 | 0.01 | 0.01 |
| Optimizer | SGD | AdamW | AdamW |
| random crop of training images | 768 | 768 | 1024 |
A.2 Supervised monocular depth estimation
As we mentioned in the main paper §4.2, the hyperparameters we used are the same as the official ones applied on the KITTI dataset, except that we use 4 instead of 8 as the batch size when we train the NeWCRFs model on the InfraParis RGB images. We find that batch size 4 works slightly better than 8 during evaluation.
Additionally, we found that sometimes the radar produced some depth information on parts of the front of the car. Thus, during training on InfraParis, we also crop the training images from the top down to a position of .
A.3 Object detection
Table A8 furnishes comprehensive insights into the hyperparameters and elaborate implementation details regarding the object detection task. In the case of RGB images, our approach incorporates classical data augmentation techniques such as random crop, random color jitters, and random horizontal flip, alongside normalization transformations that involve mean subtraction and division by the standard variation. Please refer to the detectron2 library for more specific details on the architecture name mentioned in Table A8.
| Architecture | faster_rcnn_R_50_C4_1x | mask_rcnn_R_50_FPN_3x |
| backbone | ResNet50 | ResnNt50 |
| learning rate | 0.001 | 0.001 |
| roi.heads batch size | 256 | 256 |
| batch size | 8 | 8 |
| number of train iterations | 50 | 50 |
| weight decay | 0.0001 | 0.0001 |
| Optimizer | SGD | SGD |
A.4 Unsupervised monocular depth estimation
We here provide a benchmark for unsupervised monocular depth estimation. We started from Monodepth2 pre-trained on KITTI and then fine-tuned it on the InfraParis training and validation set. Then we evaluated it on the InfraParis test set. Results are shown in Table A9. We followed the same evaluation protocol as Monodepth2 to solve the scale ambiguity. We applied a mask adapted to the InfraParis dataset which gets rid of pixels corresponding to both the front of the car and to the sky.
Appendix B Resolving ambiguous images
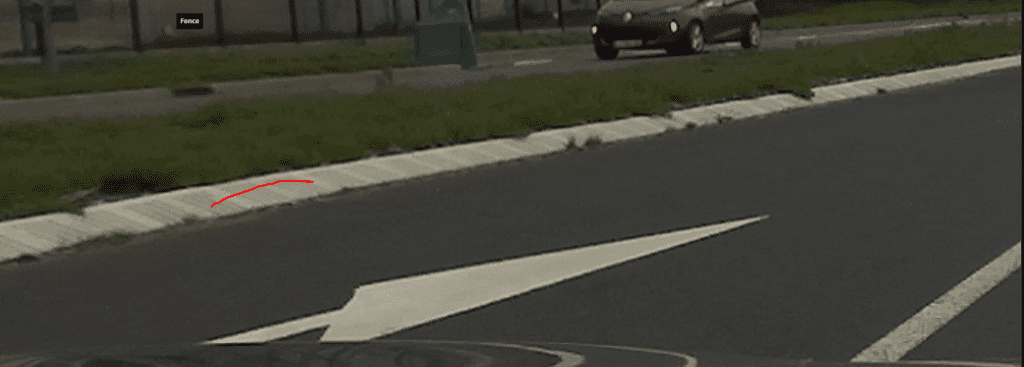
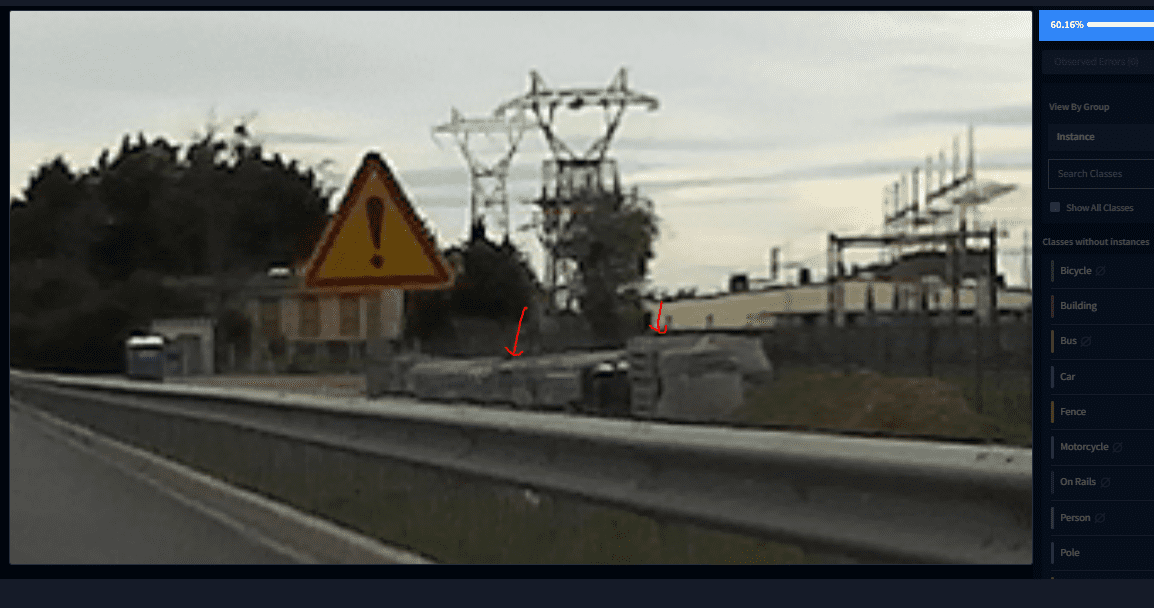
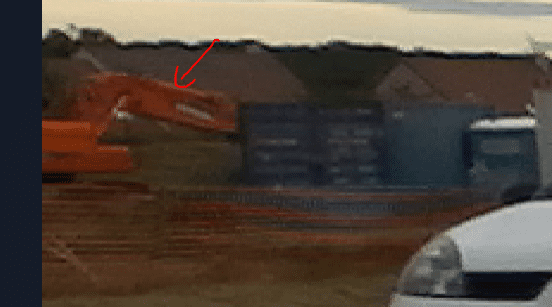
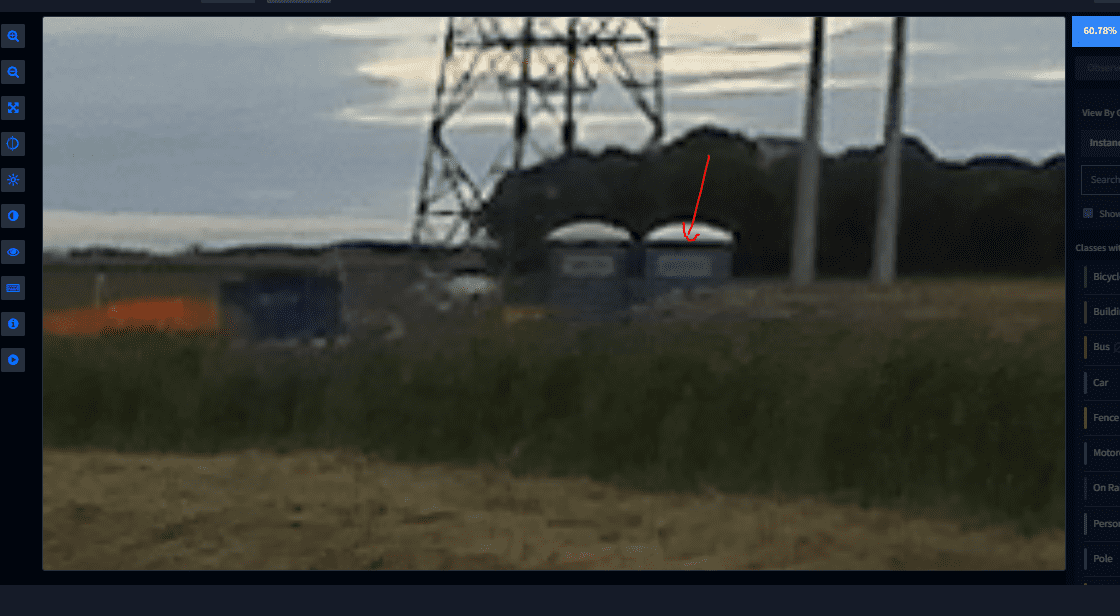
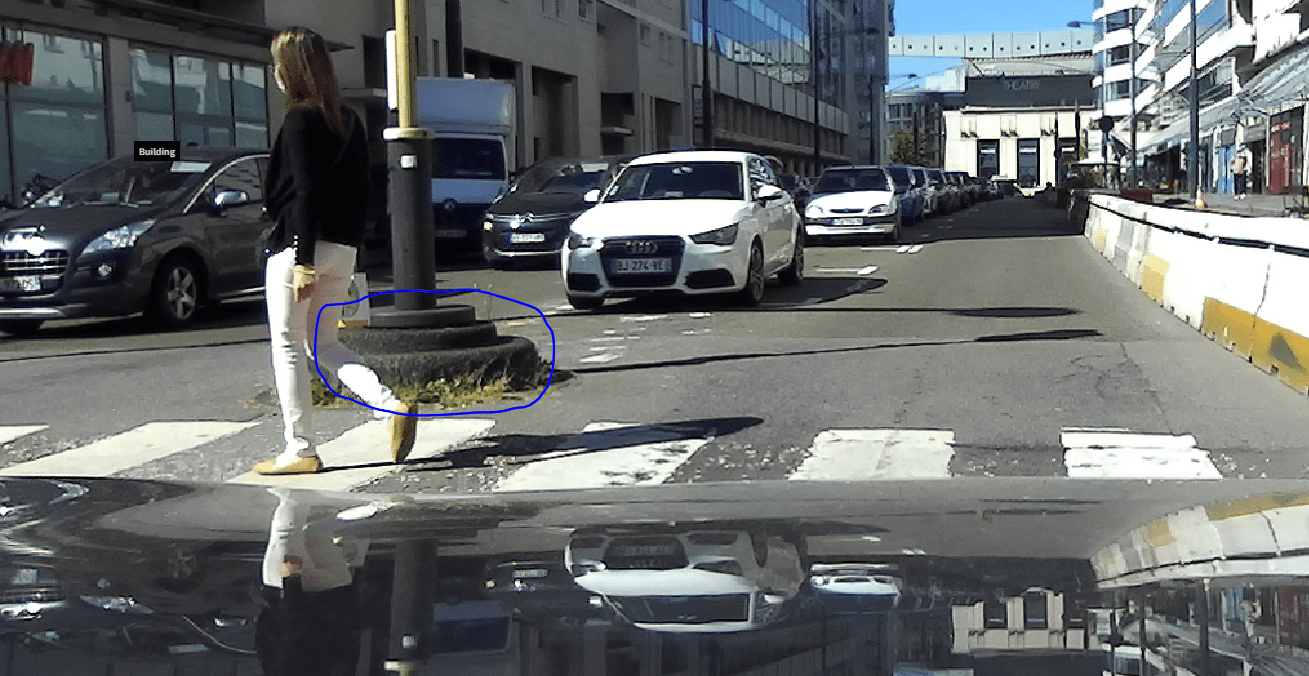
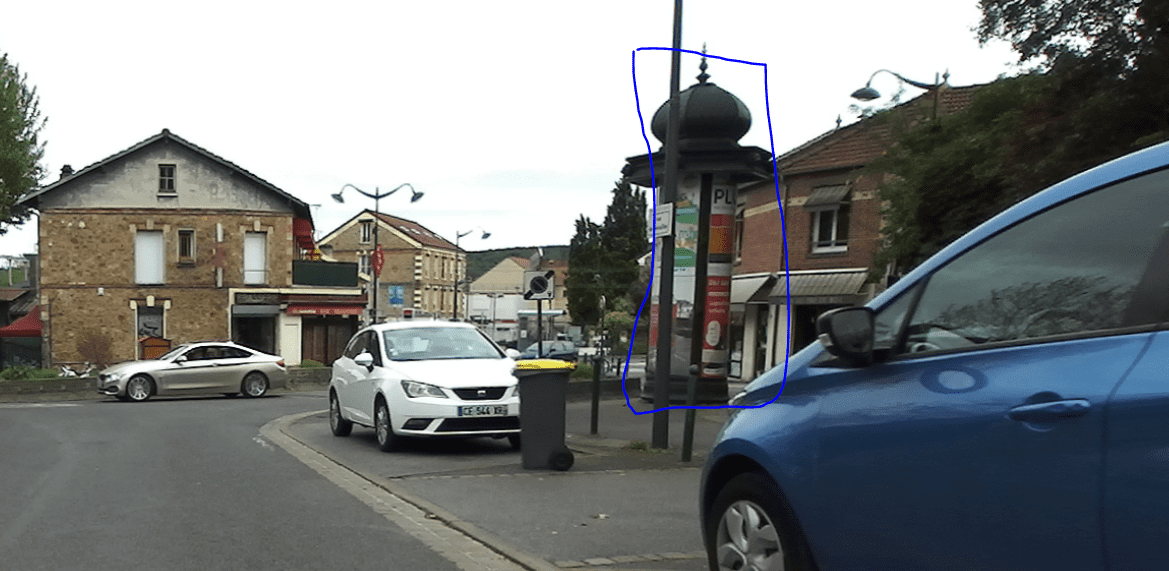
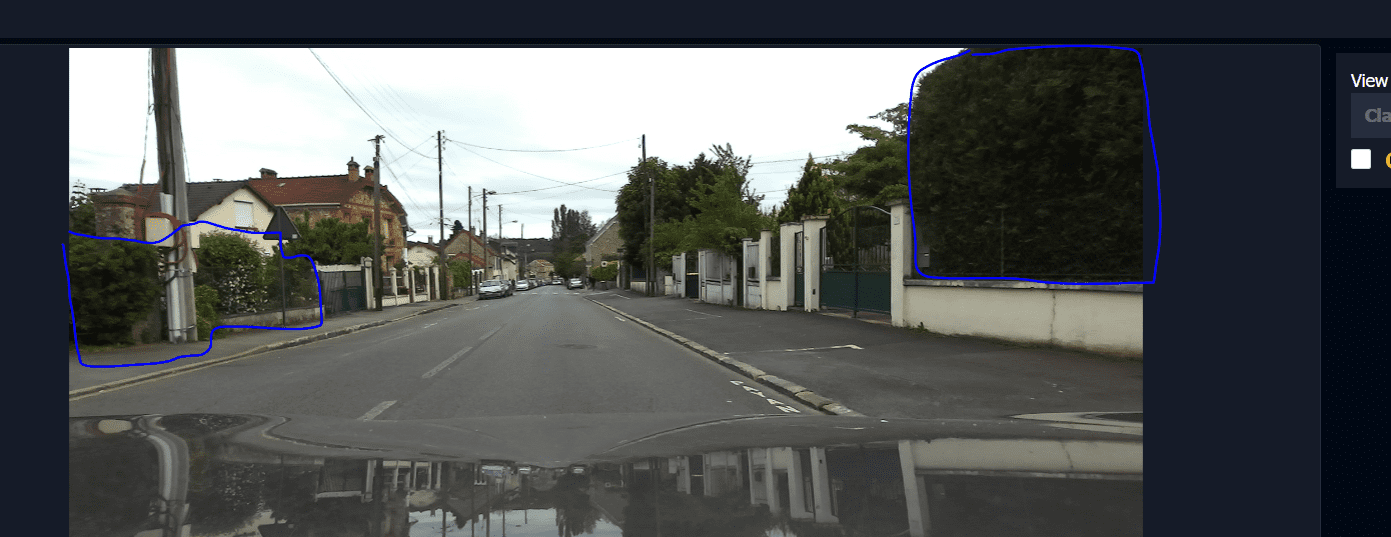
Throughout the annotation process, we encountered various instances of ambiguity. For a visual representation of these complexities, please consult Figures A7. To ensure the integrity of our dataset, particularly in instances where uncertainty prevailed, we collaborated with the annotation company to categorize dubious instances as ”unlabeled.” This approach was adopted to prevent any adverse impact on the performance of DNNs stemming from incorrect annotations.
| Training set | Eval set | Abs Rel | Sqr Rel | RMSE | RMSElog | |||
| KITTI | InfraParis | 0.236 | 0.984 | 3.870 | 0.341 | 0.573 | 0.832 | 0.933 |